Next Article in Journal
Siliceous Fly Ash Utilization Conditions for Zeolite Synthesis
Previous Article in Journal
Hybrid Pigments from Bixin Dye and Inorganic Matrices
 
 
Please note that, as of 4 December 2024, Environmental Sciences Proceedings has been renamed to Environmental and Earth Sciences Proceedings and is now published here.
Proceeding Paper

Spectral Response (VNIR-SWIR) Associated with the Octahedral Sheet of Smectites †

by
Adrián Lorenzo
1,*,
Andrea García-Vicente
1,
Juan Morales
1,
Emilia García-Romero
2,3 and
Mercedes Suárez
1
1
Department of Geology, University of Salamanca, Plaza de la Merced, S/N, 37008 Salamanca, Spain
2
Department of Mineralogy and Petrology, Complutense University of Madrid, C/ José Antonio Novais, 28014 Madrid, Spain
3
Geoscience Institute (UCM-CSIC), 28014 Madrid, Spain
*
Author to whom correspondence should be addressed.
Presented at the 2nd International Electronic Conference on Mineral Science, 1–15 March 2021; Available online: https://iecms2021.sciforum.net/.
Environ. Sci. Proc. 2021, 6(1), 23; https://doi.org/10.3390/iecms2021-09352
Published: 25 February 2021
(This article belongs to the Proceedings of The 2nd International Electronic Conference on Mineral Science)

Abstract

:
A mineralogical characterization of a group of bentonite samples was done by X-ray diffraction (XRD), chemical analysis by inductively coupled plasma mass spectroscopy (ICP-MS), and visible-near infrared and short-wave infrared spectroscopy (VNIR-SWIR). As tested by XRD, all samples are very pure, composed mainly of smectites with very small amounts of impurities, such as quartz and feldspar. The results of the chemical analysis show high contents of Al2O3 in all the samples except for COU(V), which has high contents of Fe2O3 and R4, which is a trioctahedral smectite. Within VNIR-SWIR spectra, absorption feature characteristics of the smectites due to the presence of Fe are observed at lowest wavenumber while, at the SWIR region, the absorptions are related to the M-OH bonds and there are differences among the samples according to their octahedral content.

1. Introduction

Bentonites are smectite-rich rocks that have a wide number of industrial applications, mainly in the sector of ad/absorbents. Their industrial properties are related to their structure, crystal chemistry, and small particle size, together with their swelling ability. Recently, these minerals have been widely investigated for their use as nanocomposites and bionanocomposites [1].
Variations in the crystal chemistry of the smectites due to tetrahedral and octahedral substitutions produce different layer charges and influence their application properties. According to the octahedral content, the smectites are classified as dioctahedral or trioctahedral, the dioctahedral smectites being more abundant.
VNIR-SWIR spectroscopy is a technique that allows obtaining structural information of the minerals in a short time, without previous treatment of the sample, and it is especially useful for the study of smectites because these minerals have a good spectral response in this range of wavelengths. The results of the characterization with this technique can be applied in different fields, such as remote sensing, mineral deposits mapping, soil characterization, and heritage conservation [2,3,4,5], among others.
In this work, the spectral response VNIR-SWIR of a group of smectites, including dioctahedral, Fe-rich, and trioctahedral smectites, is studied with the aim of obtaining a relationship of the spectral response in the wavelength selected and the crystal-chemical parameters of smectites.

2. Materials and Methods

For this work, we selected seven samples, shown in Table 1. The samples come from different localities: three from the USA, three from Spain, and one from Italy. The samples coming from the USA were obtained from the Source Clay Repository of the Clay Minerals Society and the rest of the samples were collected from field sites.
For their mineralogical and chemical characterization, the samples were manually ground in an agate mortar until reaching a particle size <50 µm. The mineralogical characterization was carried out by X-ray diffraction and VNIR-SWIR spectroscopy analysis. In the X-ray diffraction study, the samples were analyzed using two methods: randomly oriented powders and oriented powder aggregates (under ambient conditions after solvation with ethylene-glycol, and after heating at 550 °C for 2 h). A Bruker D8 Advance ECO diffractometer with LYNXEYE SSD160 high resolution detector, theta-2theta configuration, and Cu anode was used, working at 40 kV and 30 mA and a speed of 0.05°min−1. The High Score Plus (PANalytical) software was used to interpret all the results. The VNIR-SWIR spectroscopy study was done with the field spectroradiometer ASD FieldSpec 4 Standard-Res. This equipment has three detectors: VNIR, SWIR1, and SWIR2, which measure wavelength comprises from 350 to 1000 nm, from 1001 to 1800 nm, and from 1801 to 2500 nm, respectively. The samples were measured in direct contact with the sounding line, protected with glass without response. The results were interpreted with Spectragryph software [6].
The chemical analyses of major elements were done in the Activation Laboratories Ltd., Ontario (Canada), using FUS-ICP for mayor elements and FUS-MS for trace elements, and FeO was determined by titration.

3. Results

3.1. X-ray Diffraction

The X-ray study showed that all the samples are high purity bentonites constituted mainly by smectites-group minerals, quartz, and plagioclase as accessory minerals, as can be seen in Figure 1. Based on the 060 reflection, we observed that the samples APA, PUT, SAN, SUD, and CGA are dioctahedral, while R4 is trioctahedral. The position of the 060 reflection in the COU(V) sample agrees with the high Fe3+ content, which produces the high background of its XRD-pattern. All samples, except for R4, present good crystallinity with relatively narrow 001 reflection, as shown in Figure 1.

3.2. Chemical Analysis

The results of the chemical analysis, expressed as the percentage of oxides of major elements, can be seen in Table 2. As the samples are almost pure smectites, their chemical analysis can be interpreted according to the general structural formula of the smectites. The contents of Al, Fe, Mg, and Mn are mainly related to octahedral cations, and the contents in Ca, Na, and K are then related to the interlaminar space, although Mg can also be an interlayer cation in both dioctahedral and trioctahedral smectites [7]. Although Fe in smectites appears mainly as Fe3+ [8], FeO has also been analyzed. Because the smectites are hydrated minerals, all samples present high values of loss of ignition tests (LOI), between 17.27% and 22.89% for R4 and APA samples, respectively. Samples APA, PUT, SAN, SUD, and CGA are Al-rich samples, ranging between 14.18% and 16.82% of Al2O3. On the other hand, COU(V) and R4 samples have the highest contents in Fe2O3 and MgO, respectively. COU(V) has 18.17% of Fe2O3. R4 is a trioctahedral smectite, according to its high percentage of MgO (25.81%). The main exchangeable cation is Ca2+, according to the content in this oxide; the samples SUD and CGA also contain Na+ in similar proportions as exchangeable cation.

3.3. VNIR-SWIR Spectroscopy

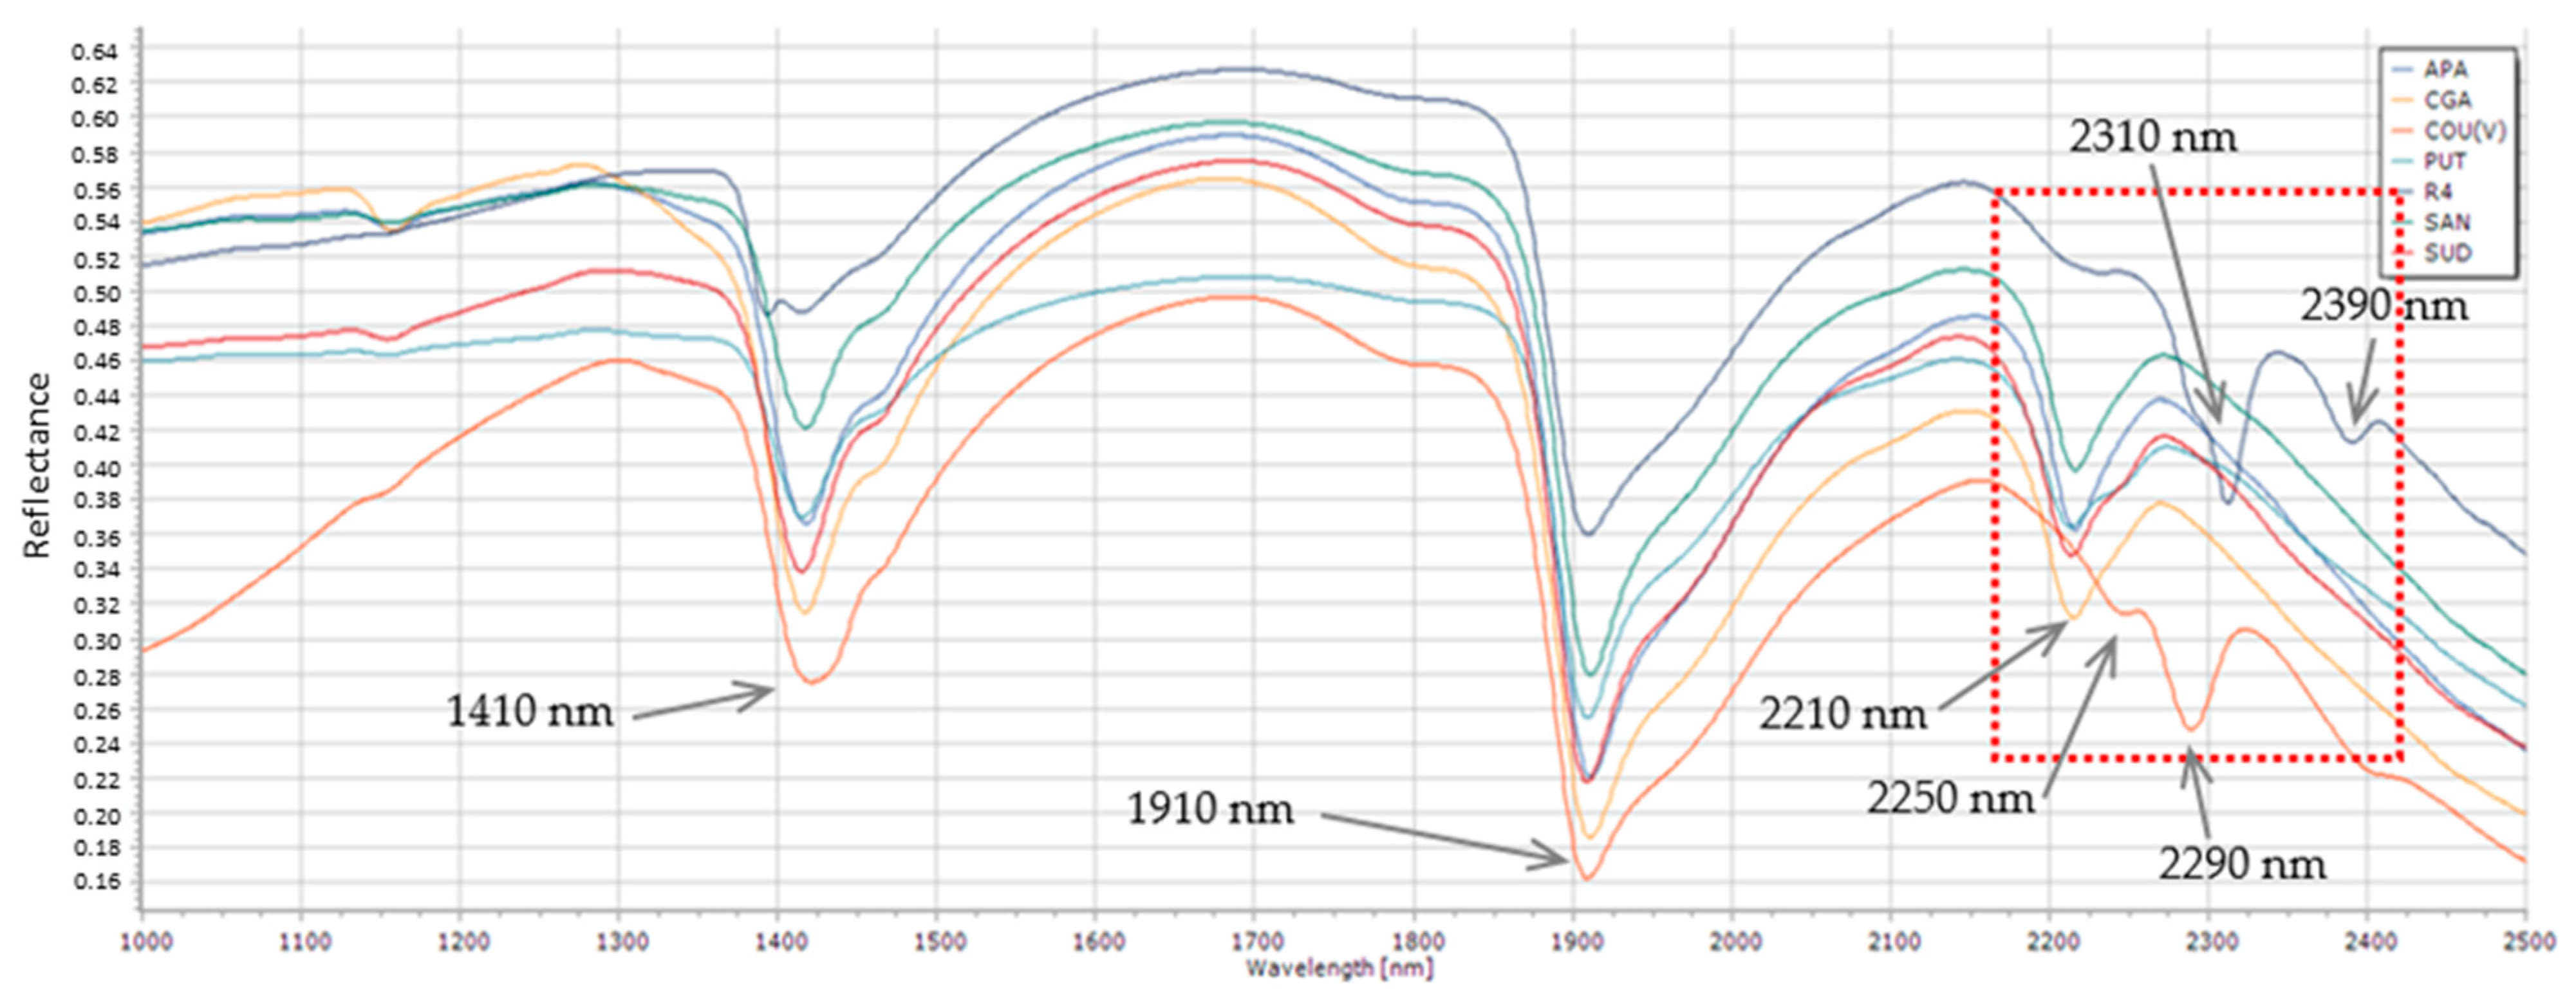
The VNIR-SWIR spectra are shown in Figure 2 and Figure 3. In order to better understand the spectral response, they were divided into two parts: (1) the visible and near wavelength range (from 350 nm to 1000 nm), and (2) the short wavelength range (from 1001 nm to 2500 nm). In the visible and near infrared wavelength of the spectra, the absorptions are due to the electronic transitions of Fe and other transition elements [9]. The samples COU(V) and SUD show the most intense absorption bands in this region (Figure 2). This is due to the high amount of Fe that these two samples contain, mainly as Fe3+ (Table 2). Both samples present broad bands centered at ~650 nm and 950 nm.
In the short-wave zone of the spectra, the samples show two intense absorptive features near 1410 nm and 1910 nm (Figure 3) related to the combinations of the vibration modes of H2O [10]. These broad bands are characteristic of the hydrated minerals.
In the region of the spectra with the wavelengths higher than 2200 nm (framed in red in Figure 3), the assignation of the absorption band has been done according to [10,11,12], and the samples can be divided into three groups by their characteristic absorption features at 2210 nm, 2290 nm, 2310 nm, and 2390 nm.

4. Discussion

The classification of the smectites of these highly pure bentonites from XRD-patterns agrees with the chemical analysis. The samples APA, PUT, SAN, SUD, and CGA are Al-rich samples, and they have been identified as dioctahedral smectites by their 060 reflection values, while COU(V) and R4 samples are Fe- and Mg-rich smectites, respectively.
The differences in the spectral response are related to the different composition of the smectites. In the lower wavelength region, in the VNIR range, the richest in Fe samples exhibit the more intense absorptions as wide bands. These bands do not correspond to the most frequent Fe-oxide minerals hematite and goethite, of which characteristic absorption bands are centered at 530 nm and 890 nm in hematite, and 480 nm and 969 nm in goethite. However, the most intense absorption in these two Fe-rich smectites is located at 650 nm and it is due to the octahedral Fe in these smectites.
In the short-wave region of the spectra, the samples show singular absorption features associated with the octahedral cations, due to the vibrations of the M-OH bonds [10,11,12]. The samples with a high content in Al show an intense feature near 2210 nm. APA, PUT, SAN, SUD, and CGA have absorption features ~2210 nm. These absorption features are due to the Al-Al-OH in the octahedral sheet. This agrees with the results of the chemical analysis that showed high amount of Al in these five samples. More specifically, the concentrations of Al3+ are 14.18% for APA, 14.02% for PUT, 14.52% for SAN, 16.60% for SUD, and 16.82% for CGA. On the other hand, the smectites with a high Fe content show an intense absorption close to 2290 nm. COU(V) sample has a deep absorption feature at ~2290 nm related to the bond vibration of Fe3+-Fe3+-OH in the octahedral sheet. The presence of octahedral Fe also causes the absorption at 2250 nm in the COU(V) sample; this absorption appears as a shoulder in the PUT sample. They are probably related to the dioctahedral Al-Fe3+-OH bonds. On the other hand, the only trioctahedral smectite studied here, the R4 sample, has two characteristic absorption features at ~2310 nm and ~2390 nm, both related to the 3Mg-OH bonds vibration in the octahedral sheet, according to the content of MgO (25.81%) obtained in the chemical analysis.

5. Conclusions

The samples present clear and discriminatory absorption bands related to the octahedral content of the smectites. Dioctahedral Al-rich smectites are characterized by the absorption at 2210 nm, while most Fe-rich dioctahedral smectites present the most intense absorption at 2290 nm. The presence of dioctahedral Al-Fe3+-OH bonds causes an adsorption located at 2250 nm. Finally, trioctahedral 3Mg-OH bonds produce significant absorption bands located at ~2310 nm and ~2390 nm. These discriminatory absorptions allow us to identify the smectite type by means of field spectroscopy.

Author Contributions

All authors have read and agreed to the published version of the manuscript, and all authors have contributed to obtaining, analyzing, and discussing the data.

Funding

This research was funded by the Ministerio de Ciencia e Innovación, project: PID2019-106504RB-I00.

Institutional Review Board Statement

Not applicable.

Informed Consent Statement

Not applicable.

Data Availability Statement

The data that support the findings of this study will be made available by the corresponding author (A.L.), upon reasonable request.

Conflicts of Interest

The authors declare no conflict of interest.

References

  1. Bergaya, F.; Jaber, M.; Lambert, J.-F. Clays and Clay Minerals as Layered Nanofillers for (Bio)Polymers. Green Energy Technol. 2012, 50, 41–75. [Google Scholar] [CrossRef]
  2. Bishop, J.L.; Gates, W.P.; Makarewicz, H.D.; McKeown, N.K.; Hiroi, T. Reflectance spectroscopy of beidellites and their importance for mars. Clays Clay Miner. 2011, 59, 378–399. [Google Scholar] [CrossRef]
  3. Rajendran, S.; Sobhi, N. Characterization of ASTER spectral bands for mapping of alteration zones of volcanogenic massive sulphide deposits. Ore Geol. Rev. 2017, 88, 317–335. [Google Scholar] [CrossRef]
  4. Ogena, Y.; Goldshlegerb, N.; Ben-Dorc, E. 3D spectral analysis in the VNIR–SWIR spectral region as a tool for soil classification. Geoderma 2017, 302, 100–110. [Google Scholar] [CrossRef]
  5. Camaiti, M.; Benvenuti, M.; Costagliola, P.; Di Benedetto, F.; Moretti, S. Hyperspectral Sensors for the Characterization of Cultural Heritage Surfaces. In Sensing the Past: From Artifact to Historical Site; Masini, N., Soldovieri, F., Eds.; Springer International Publishing: Cham, Switzerland, 2017; pp. 289–311. [Google Scholar] [CrossRef]
  6. Menges, F. Spectragryph-Optical Spectroscopy Software, Version 1.2.14. 2020. Available online: http://www.effemm2.de/spectragryph/ (accessed on 1 December 2020).
  7. Christidis, G.E. Validity of the structural formula method for layer charge determination of smectites: A re-evaluation of published data. Appl. Clay Sci. 2008, 42, 1–7. [Google Scholar] [CrossRef]
  8. García-Romero, E.; Manchado, E.; Suárez, M.; García-Rivas, J. Spanish Bentonites: A Review and New Data on Their Geology, Mineralogy, and Crystal Chemistry. Minerals 2019, 9, 696. [Google Scholar] [CrossRef]
  9. Burns, R.G. Mineralogical Applications of Crystal Field Theory; Cambridge University Press: Cambridge, UK, 1993. [Google Scholar] [CrossRef]
  10. Bishop, J.L.; Lane, M.D.; Dyar, M.D.; Brown, A.J. Reflectance and emission spectroscopy study of four groups of phyllosilicates: Smectites, kaolinite-serpentines, chlorites and micas. Clay Miner. 2008, 43, 35–54. [Google Scholar] [CrossRef]
  11. Bishop, J.L.; Pieters, C.M.; Edwards, J.O. Infrared spectroscopic analyses on the nature of water in montmorillonite. Clays Clay Miner. 1994, 42, 702–716. [Google Scholar] [CrossRef]
  12. Bishop, J. Visible and Near-Infrared Reflectance Spectroscopy: Laboratory Spectra of Geologic Materials. In Remote Compositional Analysis: Techniques for Understanding Spectroscopy, Mineralogy, and Geochemistry of Planetary Surfaces; Bishop, J., Bell, J., III, Moersch, J., Eds.; Cambridge University Press: Cambridge, UK, 2019; pp. 68–101. [Google Scholar] [CrossRef]
Figure 1. XRD-Powder patterns of representative samples APA and COU(V).
Environsciproc 06 00023 g001
Figure 2. Spectral response of the samples in the visible near wavelength.
Environsciproc 06 00023 g002
Figure 3. Spectra of the samples in the short-wave zone.
Environsciproc 06 00023 g003
Table 1. Samples selected with their localization.
SamplesLocalization
APAArizona, USA (Clay Repository)
COU(V)Washington, USA (Clay Repository)
PUTPutifigari, Italy
R4Esquivias, Spain
SANArizona, USA (Clay Repository)
SUDCabo de Gata, Spain
CGACabo de Gata, Spain
Table 2. Oxide percentage of the major elements.
SamplesSiO2Al2O3Fe2O3FeOMgOMnOCaONa2OK2OTiO2P2O5LOI
APA51.9514.181.230.005.040.082.480.080.170.200.0322.89
COU(V)49.907.4118.170.501.410.021.610.020.020.510.0319.74
PUT50.5214.025.060.004.110.071.170.500.180.680.1921.90
R452.911.830.001.0025.810.010.460.030.320.080.0317.27
SAN53.7114.520.980.405.160.092.570.160.170.230.0422.35
SUD53.8216.603.150.404.270.021.261.050.560.150.0218.77
CGA53.0316.822.200.205.100.061.380.990.340.140.0220.57
Publisher’s Note: MDPI stays neutral with regard to jurisdictional claims in published maps and institutional affiliations.