Next Article in Journal
Mineralizing Events of the World-Class Volta Grande Gold Deposit, Southeastern Amazonian Craton, Brazil
Previous Article in Journal
A Cautionary Note on Amphibole Geobarometry
 
 
Please note that, as of 4 December 2024, Environmental Sciences Proceedings has been renamed to Environmental and Earth Sciences Proceedings and is now published here.
Proceeding Paper

Increasing the Efficiency of Vacuum Belt Filter in Gol-E-Gohar Iron Ore Concentrate Production by Adding Surfactants †

by
Ahmad Azargoon Jahromi
1,*,
Hojat Naderi
2 and
Ali Dehghani
3
1
M.Sc Mineral Processig Engineering, Yazd University, Yazd 8915818411, Iran
2
Department of Mining and Metallurgical Engineering, Yazd University, Yazd 8915818411, Iran
3
Department of Mining Weir Minerals Europe, Glasgow OL14 5AD, UK
*
Author to whom correspondence should be addressed.
Presented at the 2nd International Electronic Conference on Mineral Science, 1–15 March 2021; Available online: https://iecms2021.sciforum.net/.
Environ. Sci. Proc. 2021, 6(1), 18; https://doi.org/10.3390/iecms2021-09384
Published: 2 March 2021
(This article belongs to the Proceedings of The 2nd International Electronic Conference on Mineral Science)

Abstract

:
In this research, filtration experiments were carried out by four types of surfactants as filter aid. Sodium dodecyl sulfate and sodium lauryl ether sulfate as anionic surfactant (SDS and SLES), polyethylene glycol as nonionic surfactant (PEG) and cetyl trimethylammonium bromide as cationic surfactant (CTAB) were used to were used in order to evaluate their effects on moisture reduction of concentrate and improvement of the filtration process. All of the tests were done at the optimal conditions include 60 KPa vacuum pressure, 120 s filtration time, 105 microns particle size and 60% (w/w) solid content of pulp. Results showed that in all of the tests, cake moisture decreased by adding surfactants; however, anionic surfactants SDS and SLES were better than other chemicals. By adding 100 g/t SDS and SLES to the pulp, the filter cake moisture content was reduced by 2%. SDS and SLES improves filtration performance by increasing the ratio of throughput to moisture. At the concentration of 100 g per ton SDS and SLES, the highest throughput and lowest moisture was achieved. Although both of SDS and SLES have similar chemical structure and action, SLES was selected due to better solubility in hard water, economic justification and availability.

1. Introduction

In general, the variables affecting the filtration process can be classified into three groups: the technical specifications of the filtration device used (such as the maximum difference between the pressures produced on both sides of the filtration media, filtration time, type of filtration media, device volume, and filtration area), the characteristics of the materials to be filtered (such as the pulp present, pulp temperature, pulp viscosity and specific gravity, pulp pH, particle size, and particle shape), and the type of material used to improve the performance of the filtration process, which is called the filtration chemistry (such as the flocculant, coagulant, and filter aid) [1,2,3].
Patra et al. (2016) have studied and improved dewatering of iron ore fines by the usage of surfactants. In their primary studies, they found that the main problem with the dewatering process was adherence of the ultra-fine particles to the iron particles. Surfactants improved dewatering by increasing the hydrophobicity. The surfactant cetyl trimethyl ammonium bromide (CTAB) was used to neutralize the particle charge. By adding CTAB, the moisture dropped from 12–13% to 9–10% [4].
Castro and Laskowski (2015) have studied the effect of flocculants on flotation of copper-molybdenum ore. The results obtained showed that the flocculant polyacrylamide (PAM) had a negative effect on the recovery. It was also found that the flocculent polyethylene oxide (PEO) was an effective one for molybdenum in a wide range of pH values, but in any case affected the molybdenum flotation efficiency [5].
Fan et al. (2015) have studied the effect of particle properties on the filtration of fine-grained coal pulp and the structure of cake formed. Their studies postulated that the addition of kerosene to the pulp led to an increase in the cake hydrophobicity and a decrease in the moisture content of cake to 4.41%. Addition of the flocculent to the pulp, due to bridging between the particles or neutralizing the particle surface charge, could form large clots so that the filter cake resistance decreased and the permeability increased [6].
Garmsiri and Shirazi (2014) have examined the effect of grain size on the preparation of flocculants. In this work, the effect of the size of solid flocculant particles, grain size reduction, and their solubility with high molecular weight anionic flocculant were studied. The results obtained showed that with smaller particles, less time was required to achieve a high settlement rate. The dissolution heterogeneity decreased due to the presence of gels by filtration. By increasing the grain size, the preparation time of the flocculant increased, and, on the other hand, reducing the amount of coarse grains led to a reduction in the preparation time [7].
Sarkar et al. (2014) have examined a polymeric flocculant based on amylopectin grafted with poly (acrylic acid) (g-AP) for the treatment of a synthetic effluent as well as various industrial wastewaters. The results obtained showed that g-AP could be used as an effective flocculant for removing the suspended silica particles, as well as the cationic and anionic colors of aqueous solutions under different pH conditions [8].
Liu et al. (2014) have examined the effect of an effective eco-friendly cellulose-based flocculant, BPC-gPAM, for the treatment of effluent from paper mill waste. Results obtained showed that in neutral and acidic conditions, the BPC-gPAM flocculant had a better efficiency than polyacrylamide for the treatment of plant wastewater. The BPC-gPAM flocculant is a suitable option for usage in industries due to its biodegradability, low cost, and removal of cadmium particles from paper plant waste [9].
Wang et al. (2014) have studied the characterization of the dewatering process of activated sludge assisted by cationic surfactants. During the experiments, it was found that surfactant cetyl trimethyl ammonium bromide (CTAB) was more effective than the surfactant dodecyl trimethyl ammonium bromide (DTAB) for the release of water bonded to solid particles. The surfactant significantly increased the dewatering efficiency of the pulp due to reduction in the resistance and moisture [10].
Lihong et al. (2011) have studied the enhancement of the efficiency of the filtration process with filter aids such as diatomaceous earth and wood pulp cellulose. Investigations showed that by adding filter aids, the filtration rate increased and the moisture content of cake decreased due to changes in the structure, porosity, compressibility, hydraulic resistance, and cake permeability [11].
Wang et al. (2009) have examined the effect of a novel flocculant with a high water-solubility (Chitosan-g-PDMC) on the factory effluent. The studies have shown that Chitosan-g-PDMC has an excellent flocculation capacity and that the flocculation efficiency is much better than polyacrylamide [12].
The aim of this work was to investigate the effect of different surfactants on the filtration responses such as the cake moisture content, cake formation time, water recovery and throughput. The vacuum top-feed method was applied for dewatering the magnetite concentrate.

2. Materials and Methods

The sample used for the filtration experiments was originated from line 5 of Gol-E-Gohar mining and industrial Complex. The sampling was performed at 1 h intervals after the beginning of each shift and during 20 days from the concentrate of final LIMS (filter input). At the end of each workday, the samples were transferred to the mineral processing laboratory of the Gol-E- Gohar Iron Ore and Steel Research Institute, and were packed and dried after calculating their solid percent. Line 5 of the concentrator plant has about 6000-ton production per day, and its concentrate is entered into the HPGR for increasing blain. The optimal performance of the horizontal vacuum belt filter bye produce dry concentrate is led to make suitable feed with 1800 g/cm2 blain by HPGR for pelletizing plants.
In this research, four surfactants were used in order to evaluate the filtration experiments. The chemicals used in the experiments were sodium dodecyl sulfate and sodium lauryl ether sulfate as anionic surfactant (SDS and SLES), polyethylene glycol as nonionic surfactant (PEG) and cetyl trimethylammonium bromide as cationic surfactant (CTAB). Absorption of the surfactant in the gas–liquid interface reduces the surface tension of the liquid and also increases the hydrophobicity of the solid particles.
Filter aids are materials that, by forming a porous layer on the filter media, improve the flow of water from the media. Dissolving filter aids are nonpolymeric compounds and include one or more hydrophiles (sulfonate, carboxylate, ethoxylate) and hydrophobic groups, and usually have a long chain of hydrocarbons [13,14].
The filter aid reduces the compressibility and increases the porosity of the cake, which leads to a decrease in the specific cake resistance and an increase in the cake formation rate and improving the dewatering condition. At higher concentrations of the filter aid in the liquid phase, due to the effect of its molecular weight, the increase in the viscosity of the pulp, the drop in the cake formation rate, and the increase in the moisture content of the filter cake were observed. Obviously, a higher viscosity is created by the filter aid with a higher molecular weight, so in this research these surfactants were used as filter aids.
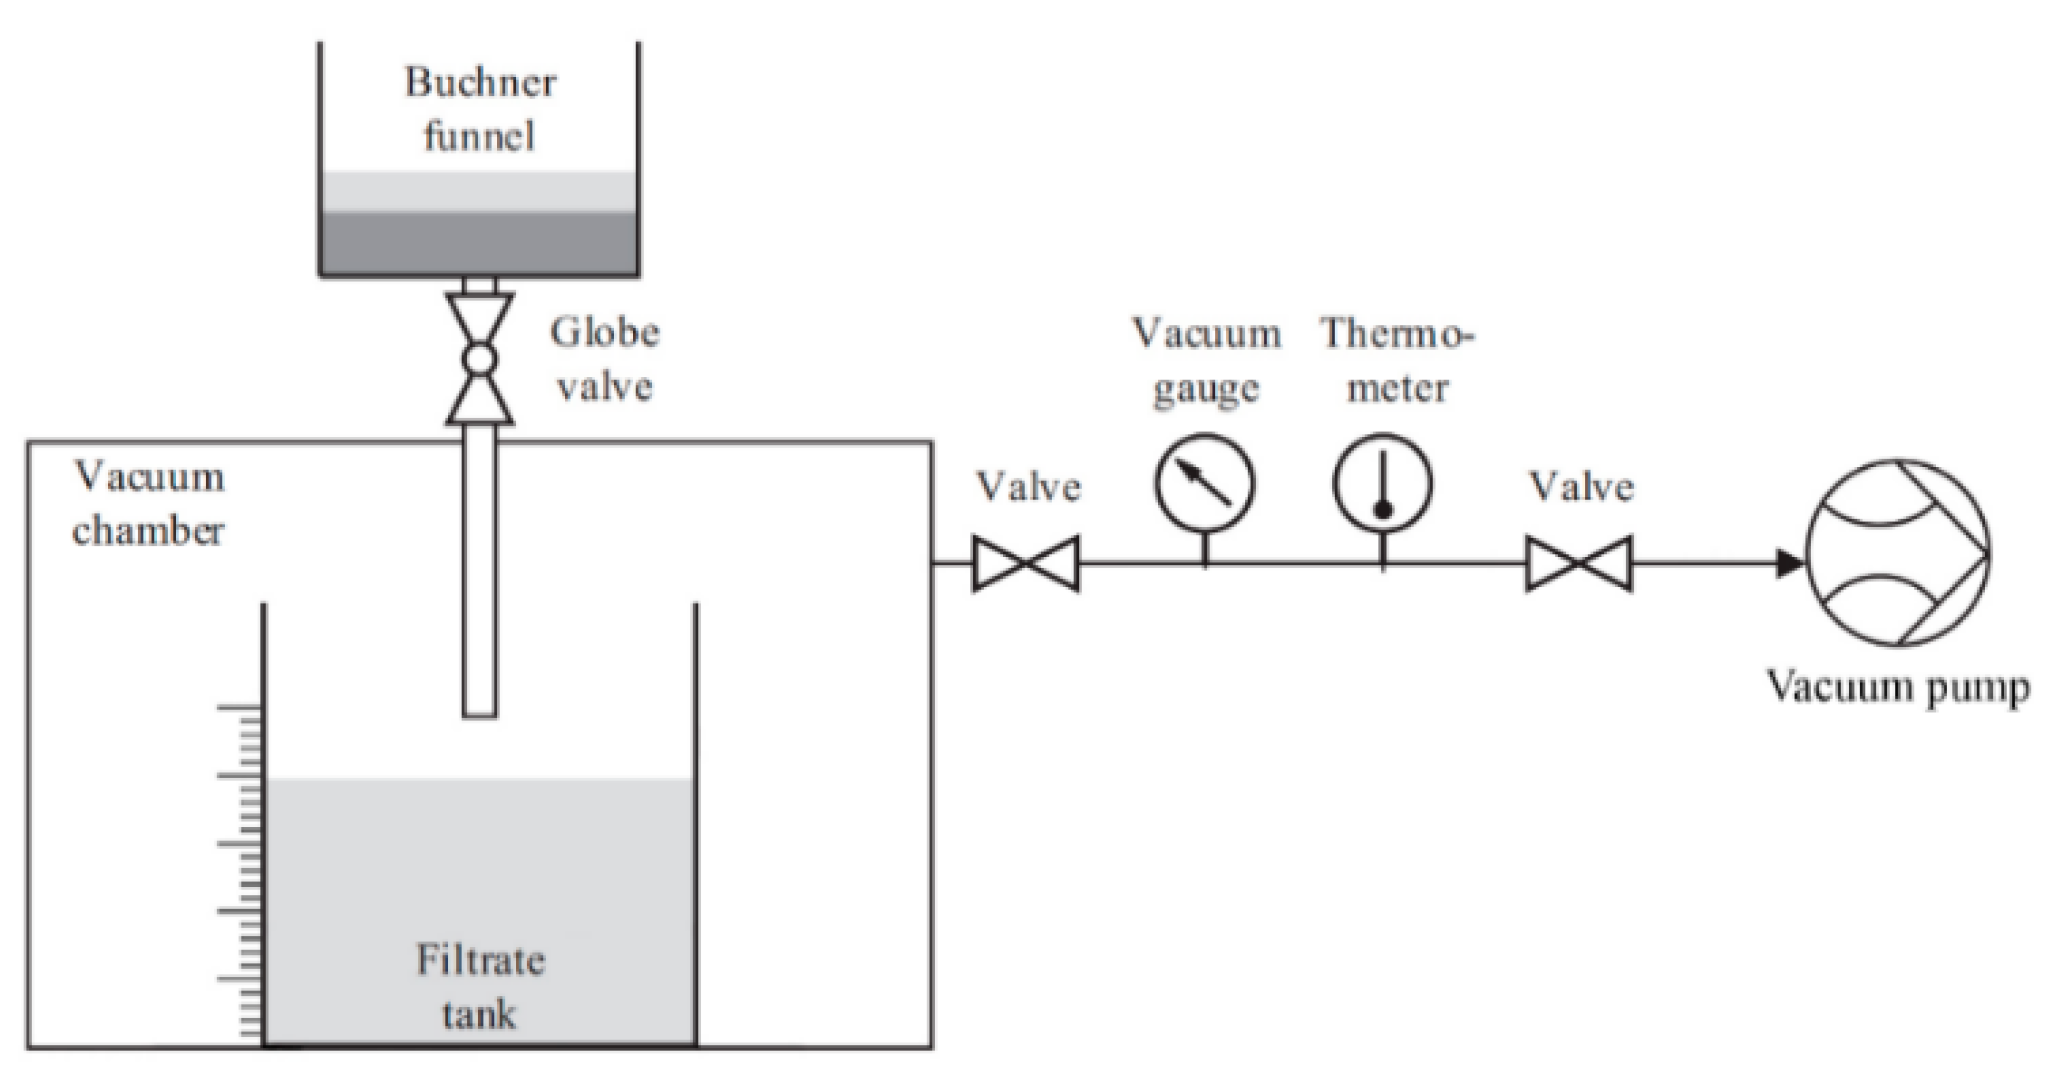
The vacuum filtration experiment was performed via the vacuum top-feed leaf method using a Buchner funnel, a graduated cylinder and a vacuum manufacturing system (Figure A1 in Appendix A). The purpose of performing the experiment with this method was to evaluate the filtration responses, such as cake moisture content, cake formation time and water recovery.
Vacuum was applied to the filtrate flask by means of a vacuum pump, and its level measured by a vacuum gage and regulated to 60 KPa by using a control valve. Each test was performed by reconstituting the iron ore concentrate slurry with water to give a suspension containing 60% solids by weight. All the surfactants investigated in this study were water soluble and were prepared by dissolving 1 g of the reagent in 500 ml of distilled water. Surfactant with appropriate dose was added to the slurry and mixed well for 2 min. Then the slurry was poured into the Buchner funnel and the vacuum was applied. Filtration was stopped 120 s after cake formation time (the time that disappearance of water from the upper surface of the filter cake). At the end of each test, the moist cake was placed in a dryer for 24 h at a temperature of 90 °C. The filtrate volume was measured during the test.
The moisture content based on the wet weight is calculated as equation (1). Moisture and throughput are commonly used to evaluate filtration performance. The moisture content of the cake was calculated using Equation (1), where M is the weight of the cake. Throughput or filter capacity indicates the amount of cake produced per unit area per unit time, usually expressed in tons per hour per square meter. Equation (2) indicates the throughput at which MD is the weight of the dried cake formed on the filter cloth (kg), T is the total time of a complete filtration cycle (s), and A is the surface area of the filter cloth (m2). Cake porosity was also calculated from Equation (3), where VP cake porosity, WS and WD are wet and dry cake weight, respectively, and DW is water density.
Moisture = M wet     M dry M wet 100
Throughput = M dry A . T
V P = W S     W D D W

3. Results

3.1. Sample Characterization Study

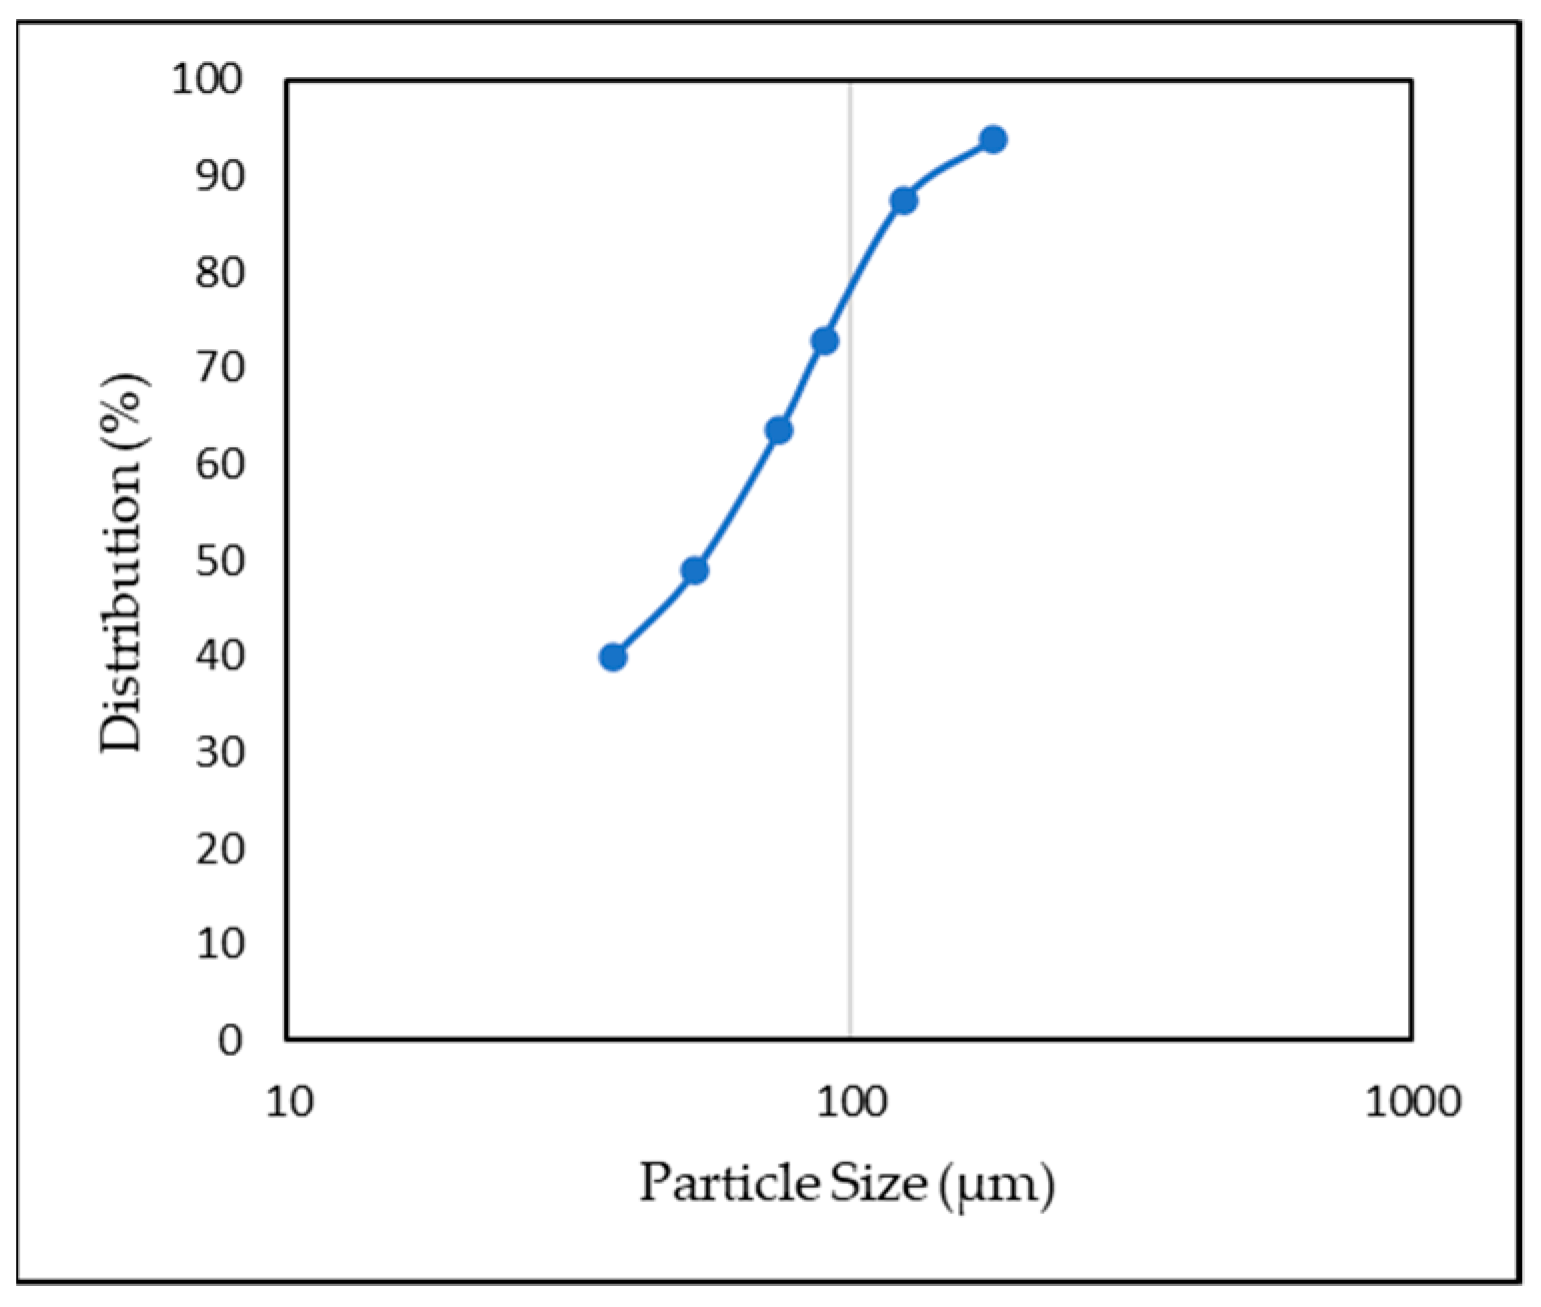
The representative sample was analyzed using the X-ray fluorescence (XRF) technique in order to determine the major and minor elements and oxides. The result of XRF analysis showed that Fe, FeO, S and Al2O3 were the major components, and other oxides such as CaO, MgO and Si2O were the minor components presented in the concentrate sample. The XRF analysis results are presented in Table 1. More than 70% of the original sample was formed from that Fe, Al2O3 and S. Figure 1 shows sample particle size distribution curve. It can be seen in Figure 1, the D80 of the sample was 105 µm.

3.2. Effect of Surfactants on Moisture

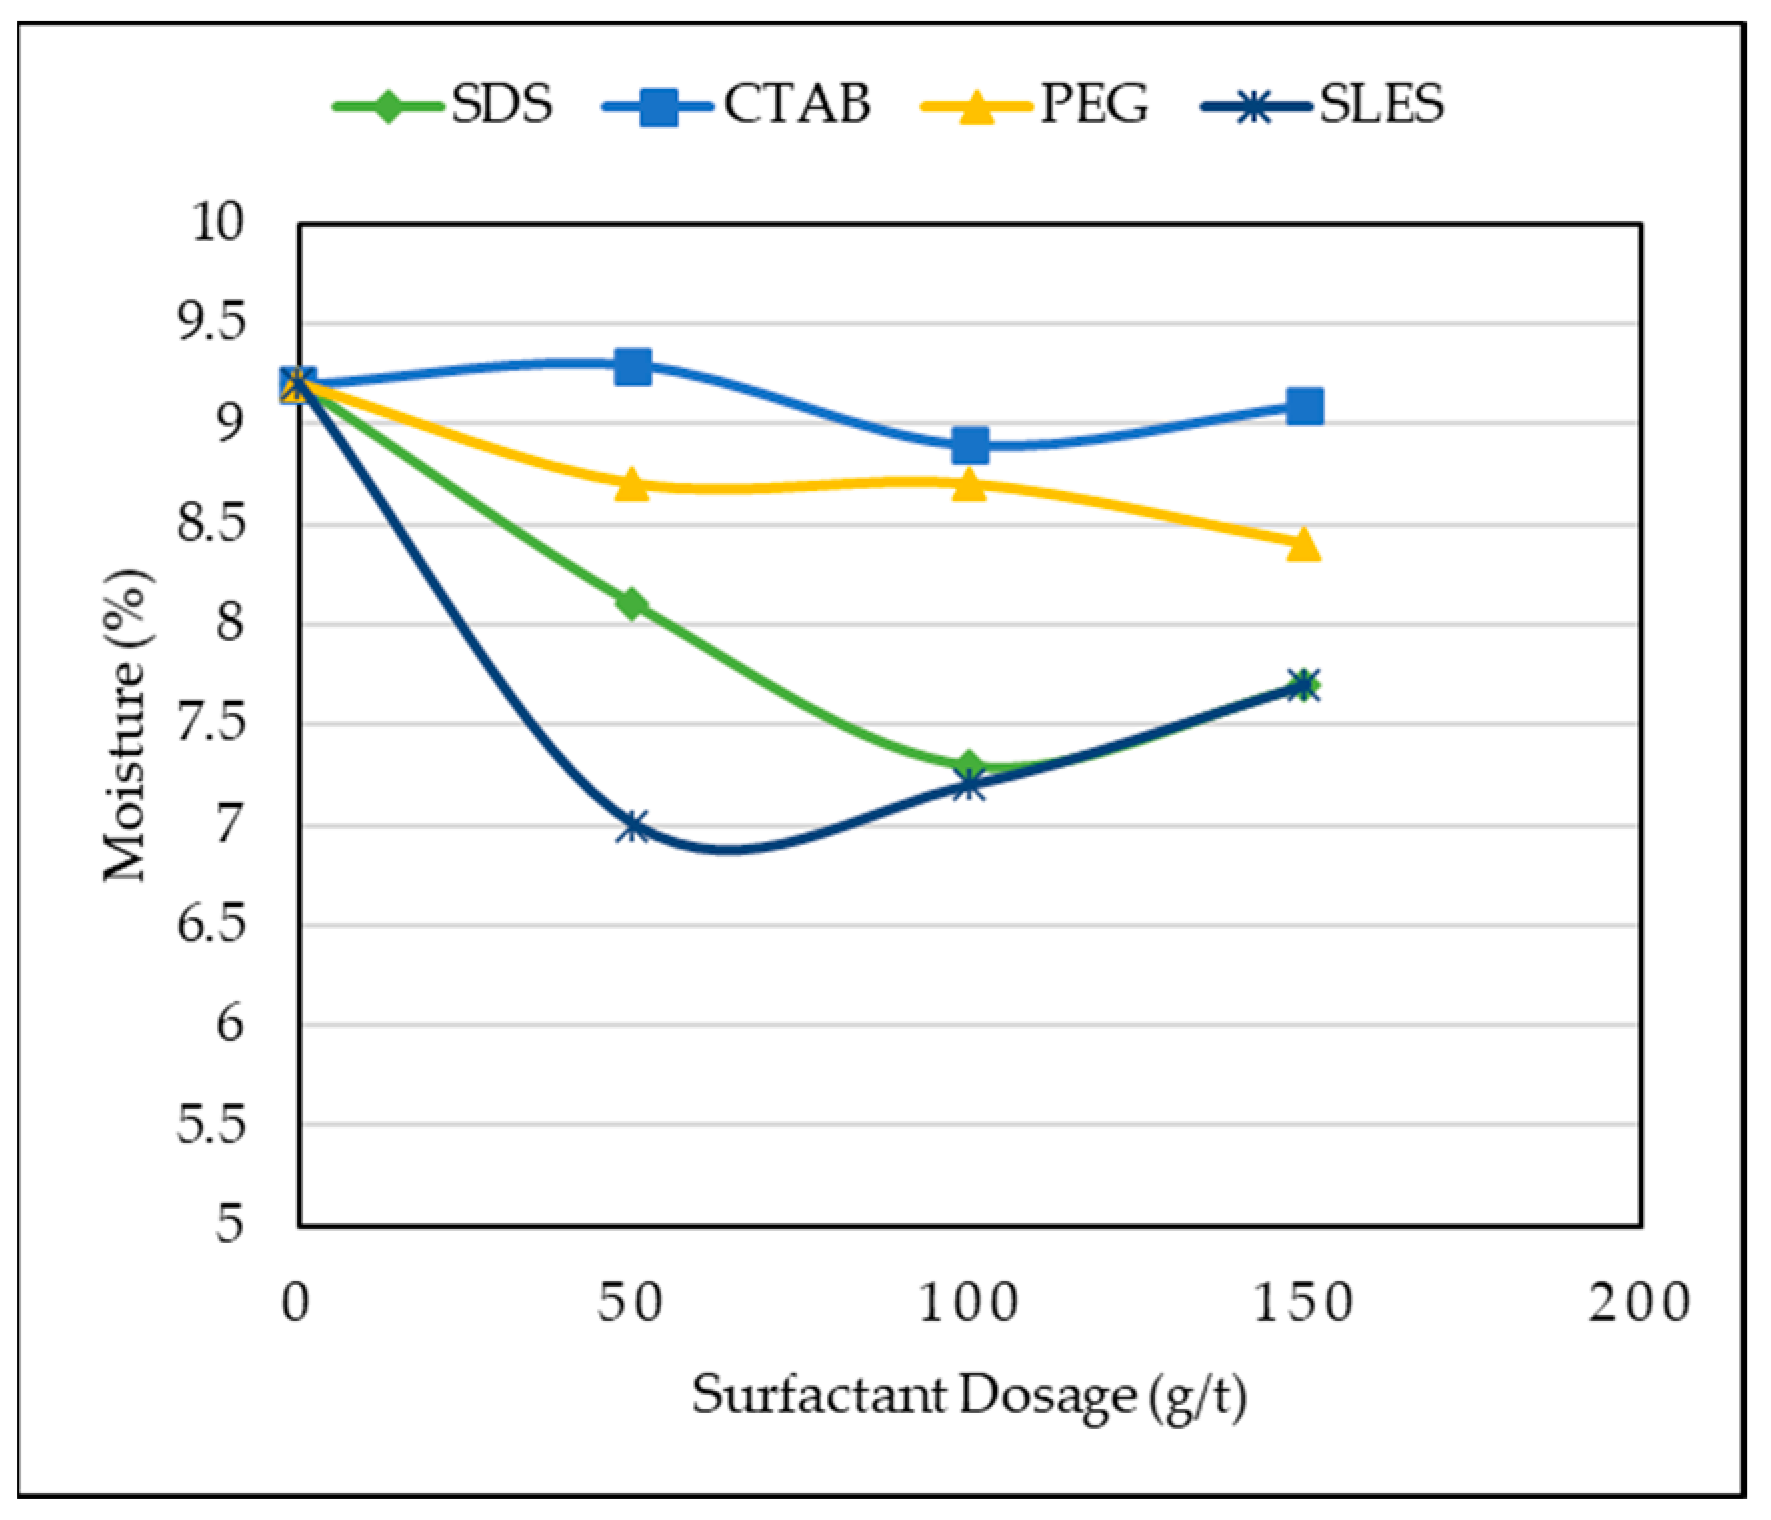
The effect of surfactants on moisture is shown in Figure 2. In the case of no additive, the moisture content of the filter cake was 9.2% at a dose of 50 g per ton, all of the surfactants reduced moisture except PEG. In this dosage, SLES caused the greatest decrease in moisture and reached 7%. At a dose of 100 g per ton SDS and SLES, the moisture content of the concentrate was the lower than others and that was 7.2%. At a dose of 150 g per ton, increasing the surfactant concentration increased the moisture. The lowest moisture in this dosage was the value of 7.7% obtained for SDS and SLES.

3.3. Effect of Surfactants on Water Recovery

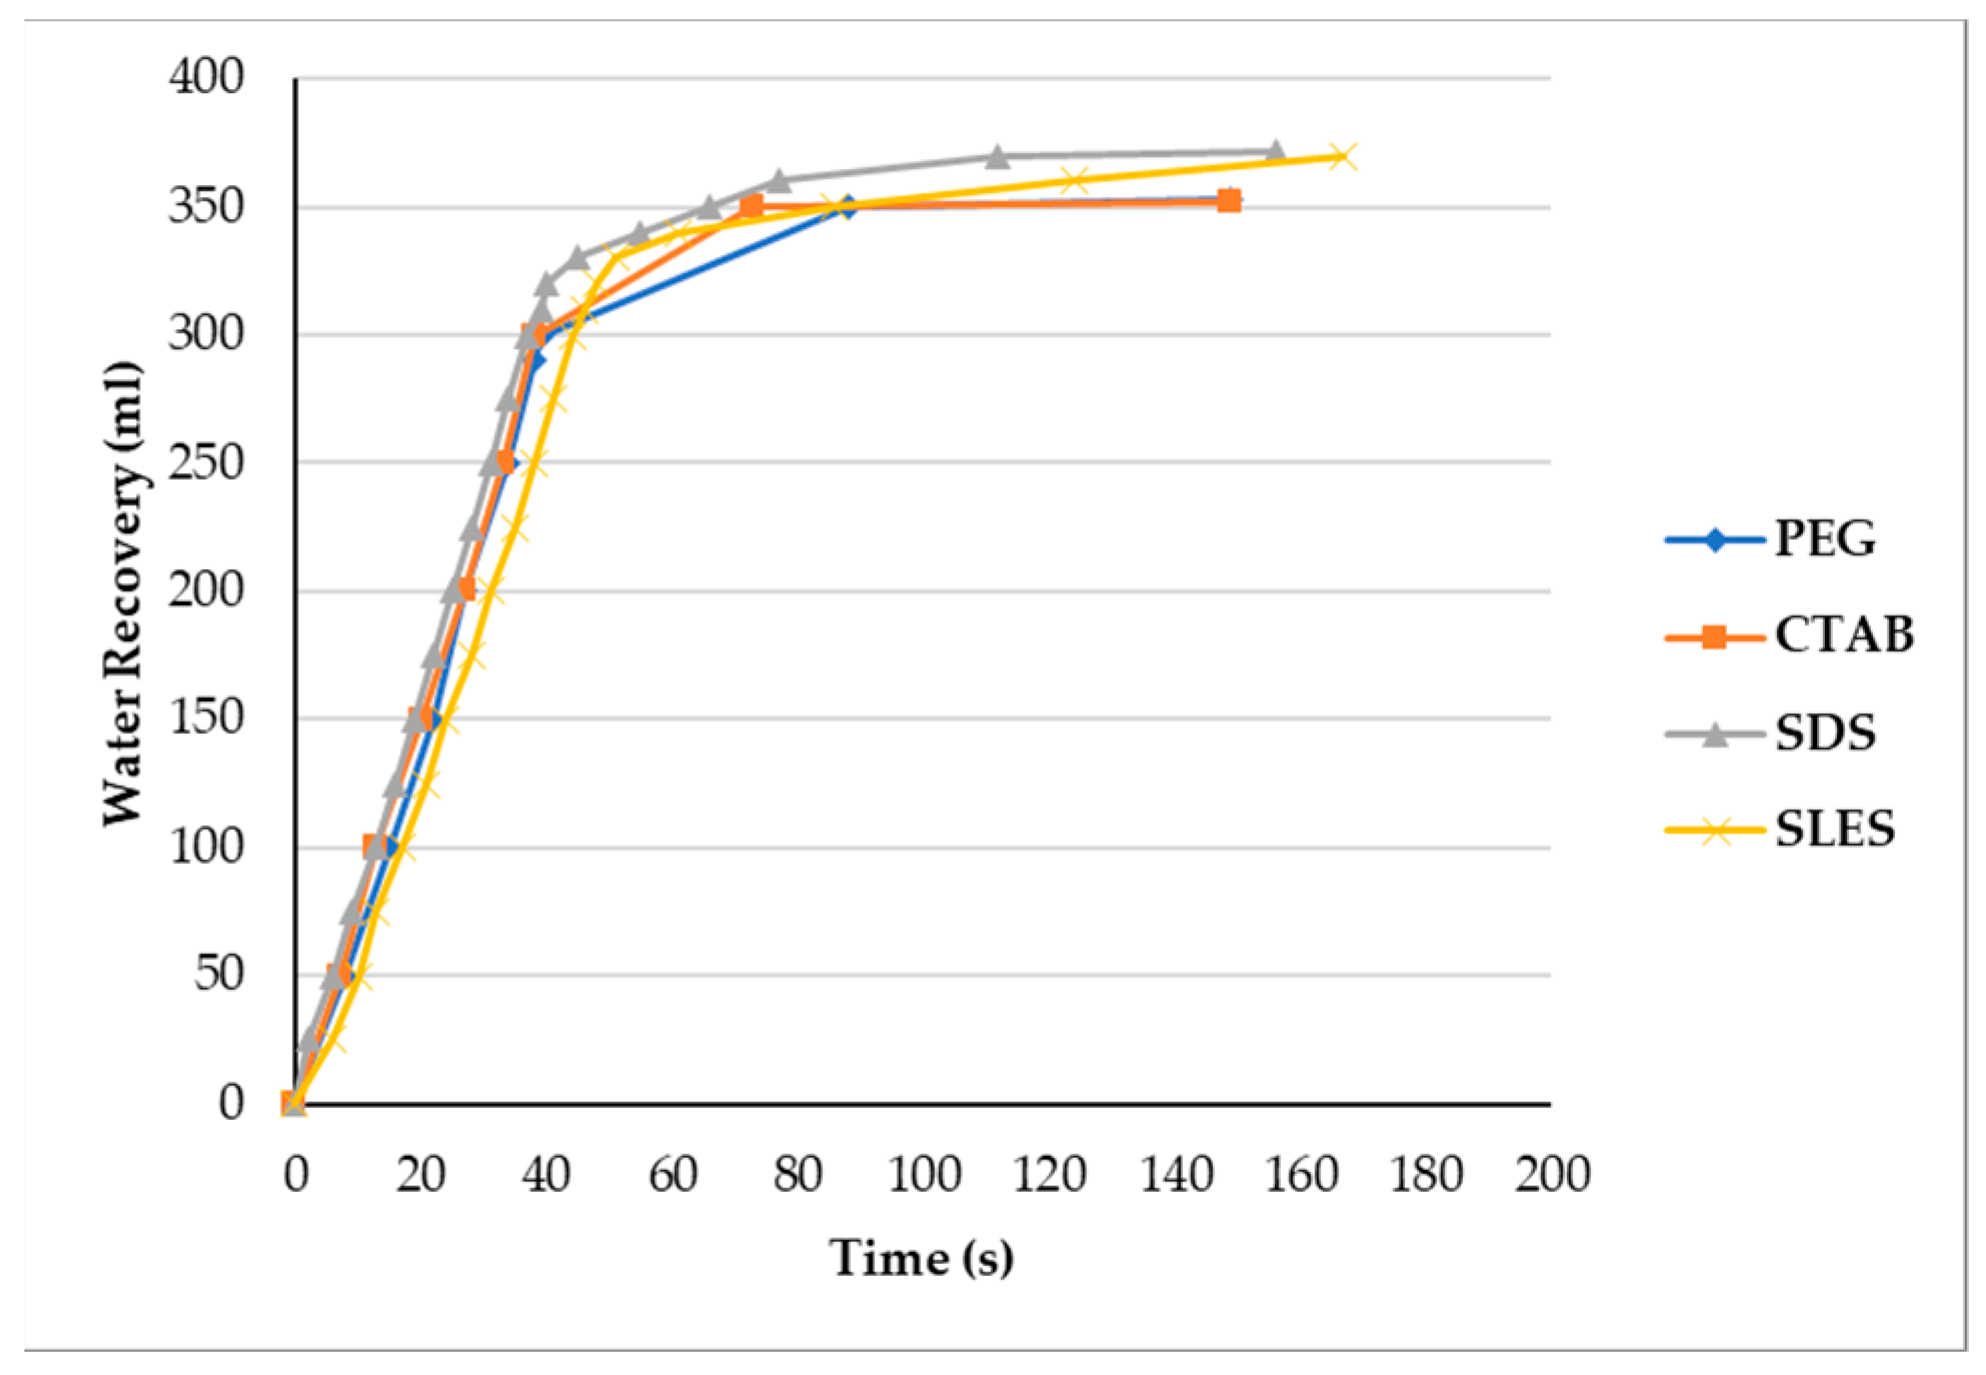
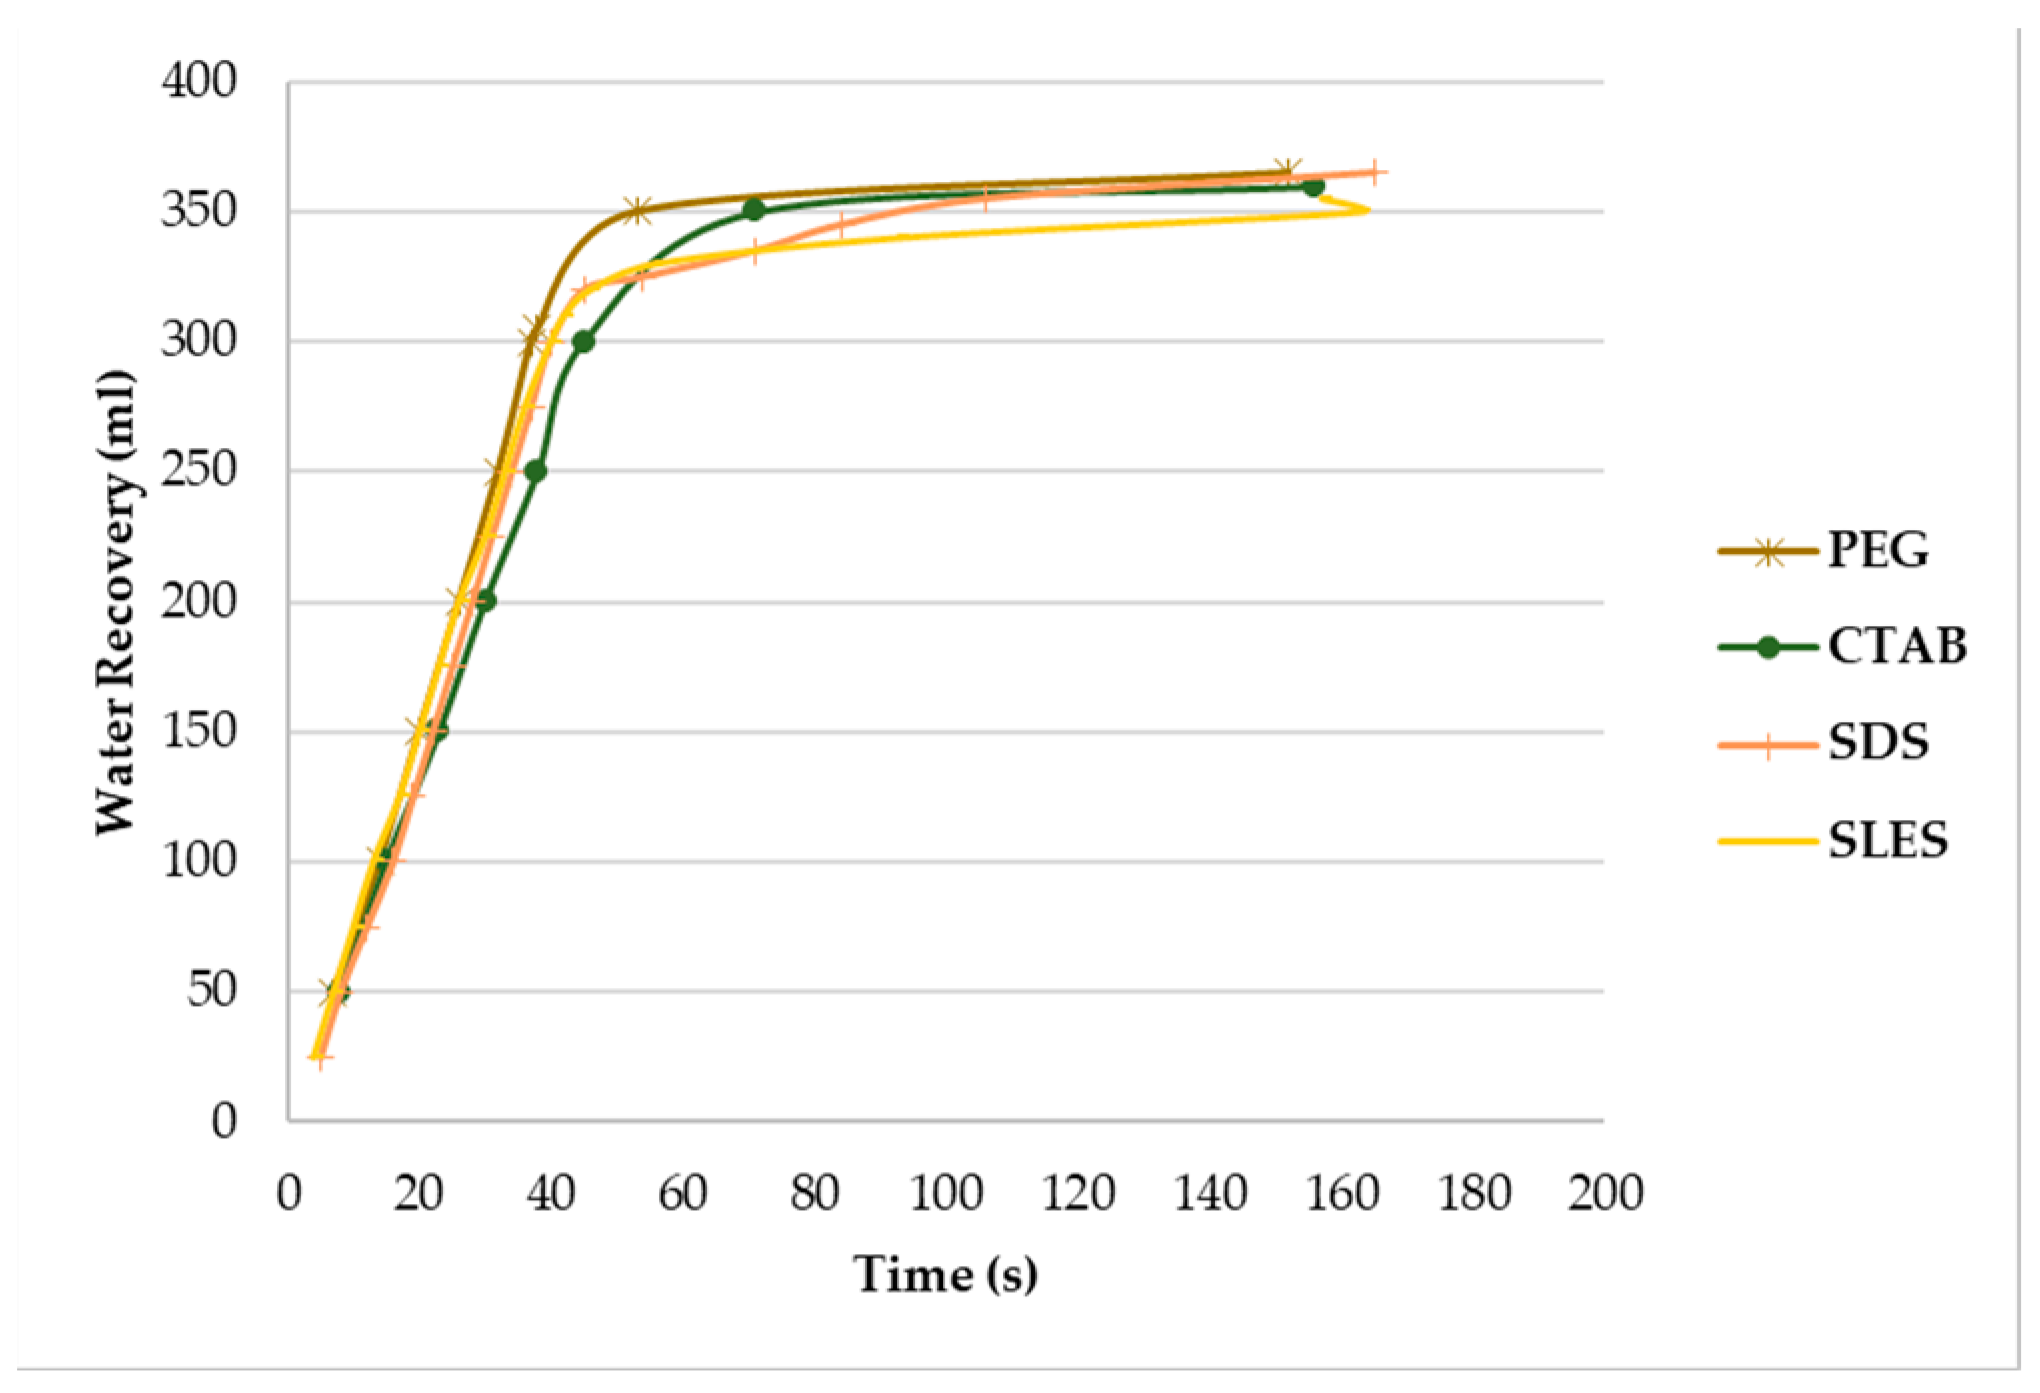
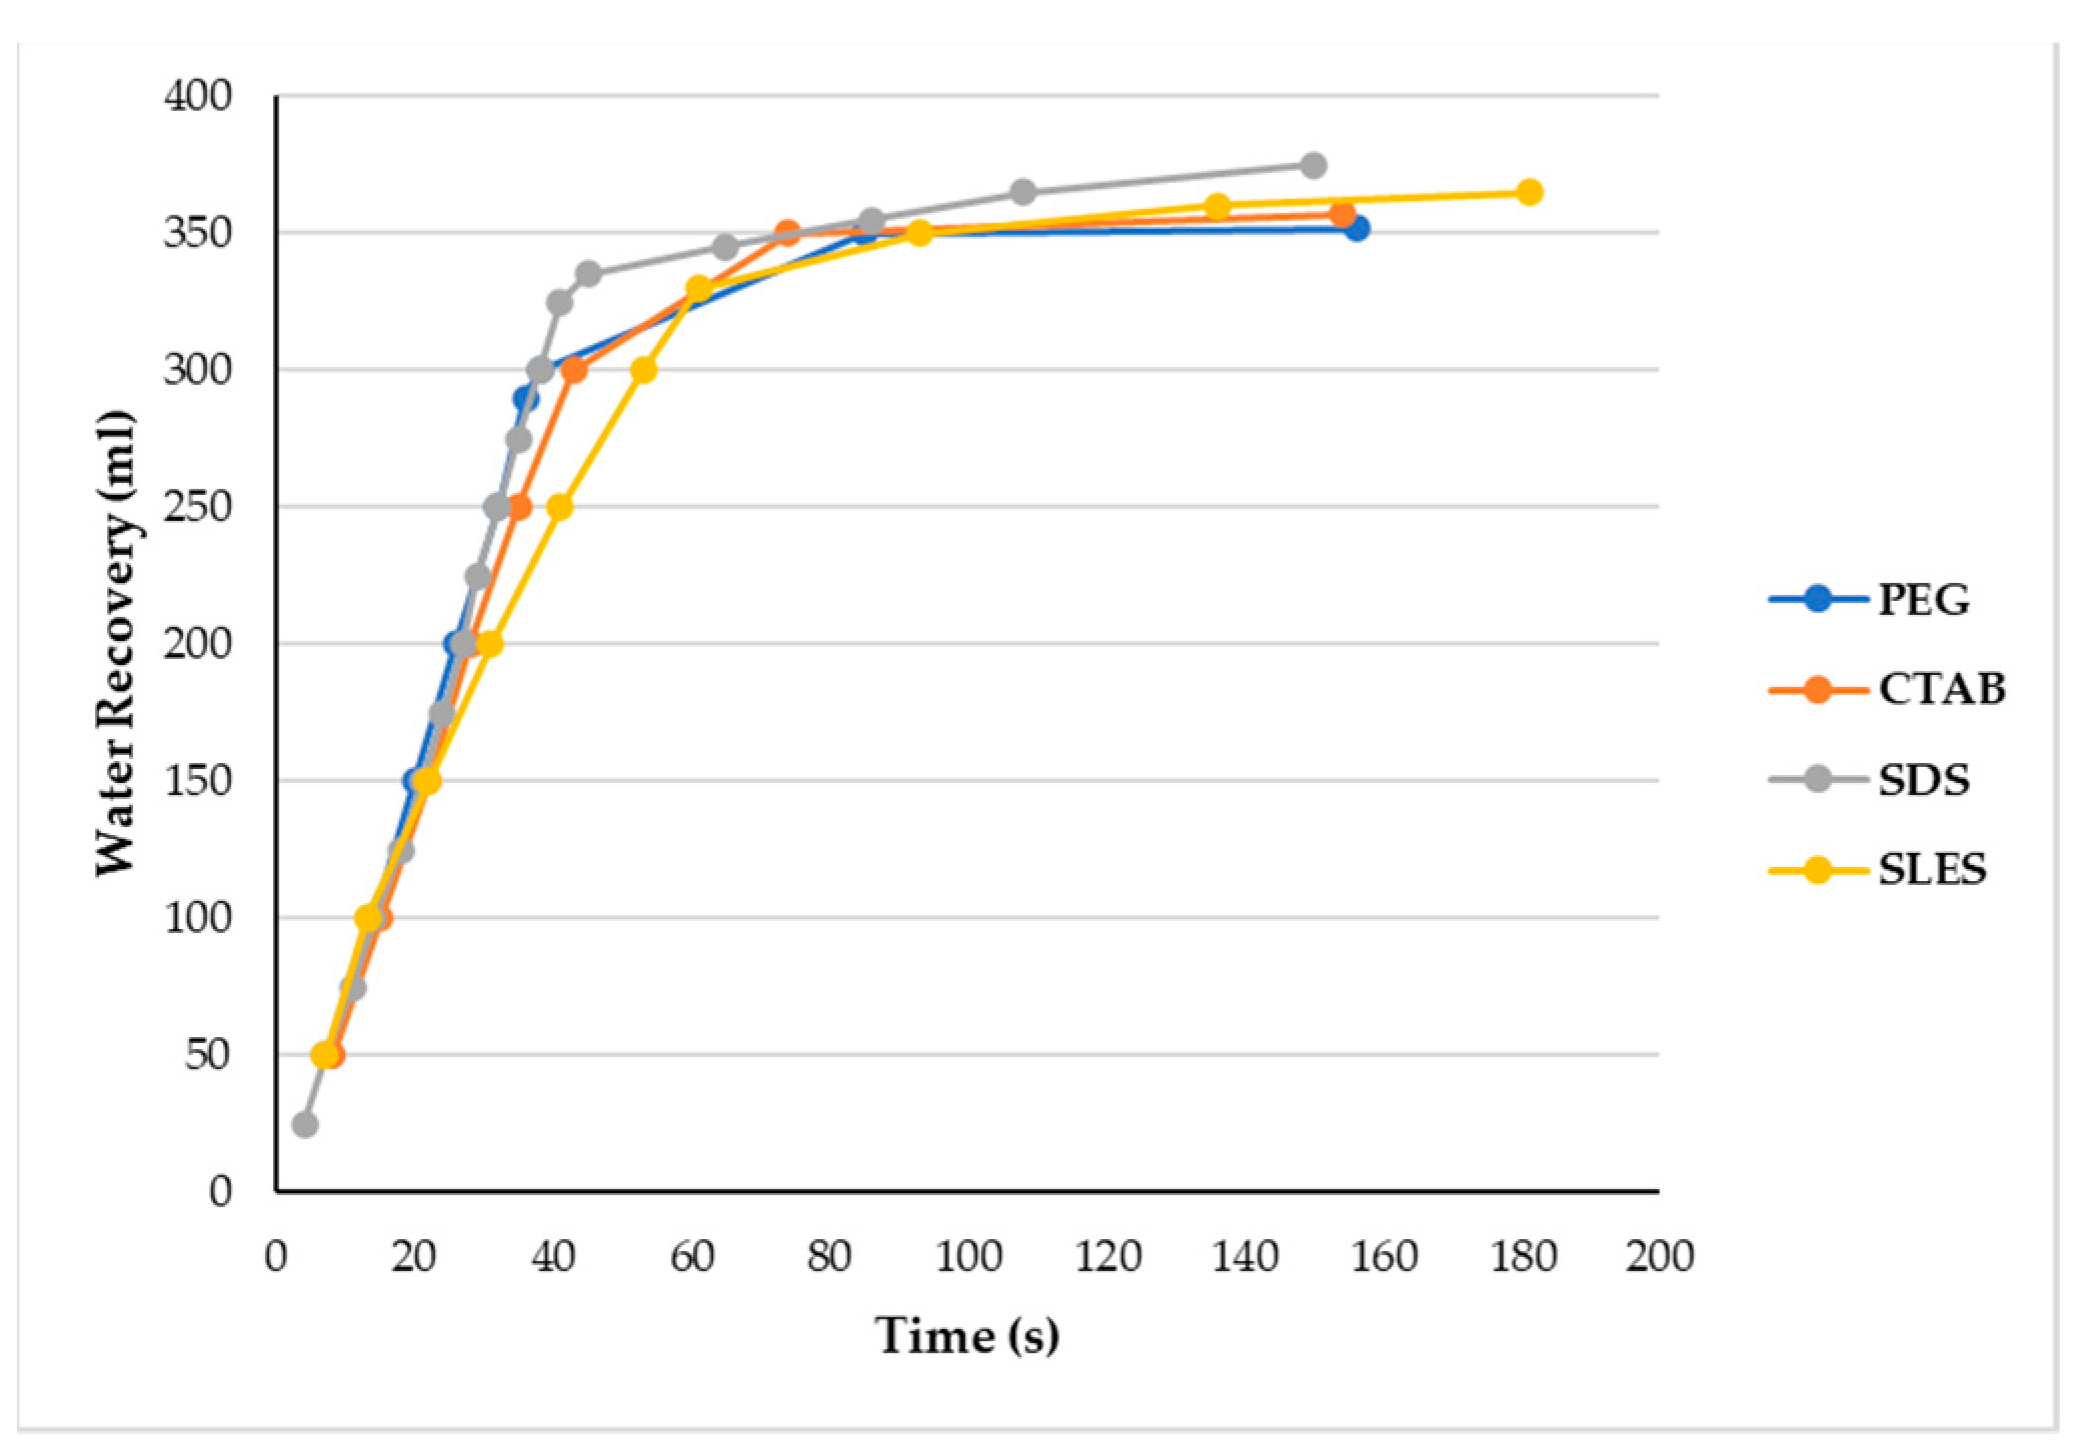
The recovery of water for each dosage of surfactants was calculated, in which results are presented in Figure 3, Figure 4 and Figure 5. As it can be seen in the Figure 5, by increasing the surfactant concentration of 50–150 g/t, water recovery was increased. The maximum water recovery was obtained at 375 and 365 ml for SDS and SLES at 150 g/t dosage. Figure 3, Figure 4 and Figure 5 shows the amount of water recovery for each of the surfactants at concentrations of 50, 100 and 150 g per ton. Charts have two parts—linear section and curved section. The linear part of the graph is related to the water recovery rate from the beginning of filtration to the time of cake formation. As the slope of the graph increases, the speed of cake formation increases after the cake is formed, the rate of water recovery is reduced and the filtration process continues for 120 s.
Water recovery indicates the amount of water separated from the suspension. However, this factor is not enough to evaluate the filtration performance, but including factors such as cake formation time and filter volume at the moment of cake forming can give us more accurate information to evaluate the effects of surfactants.

3.4. Effect of Surfactants on Cake Formation Time

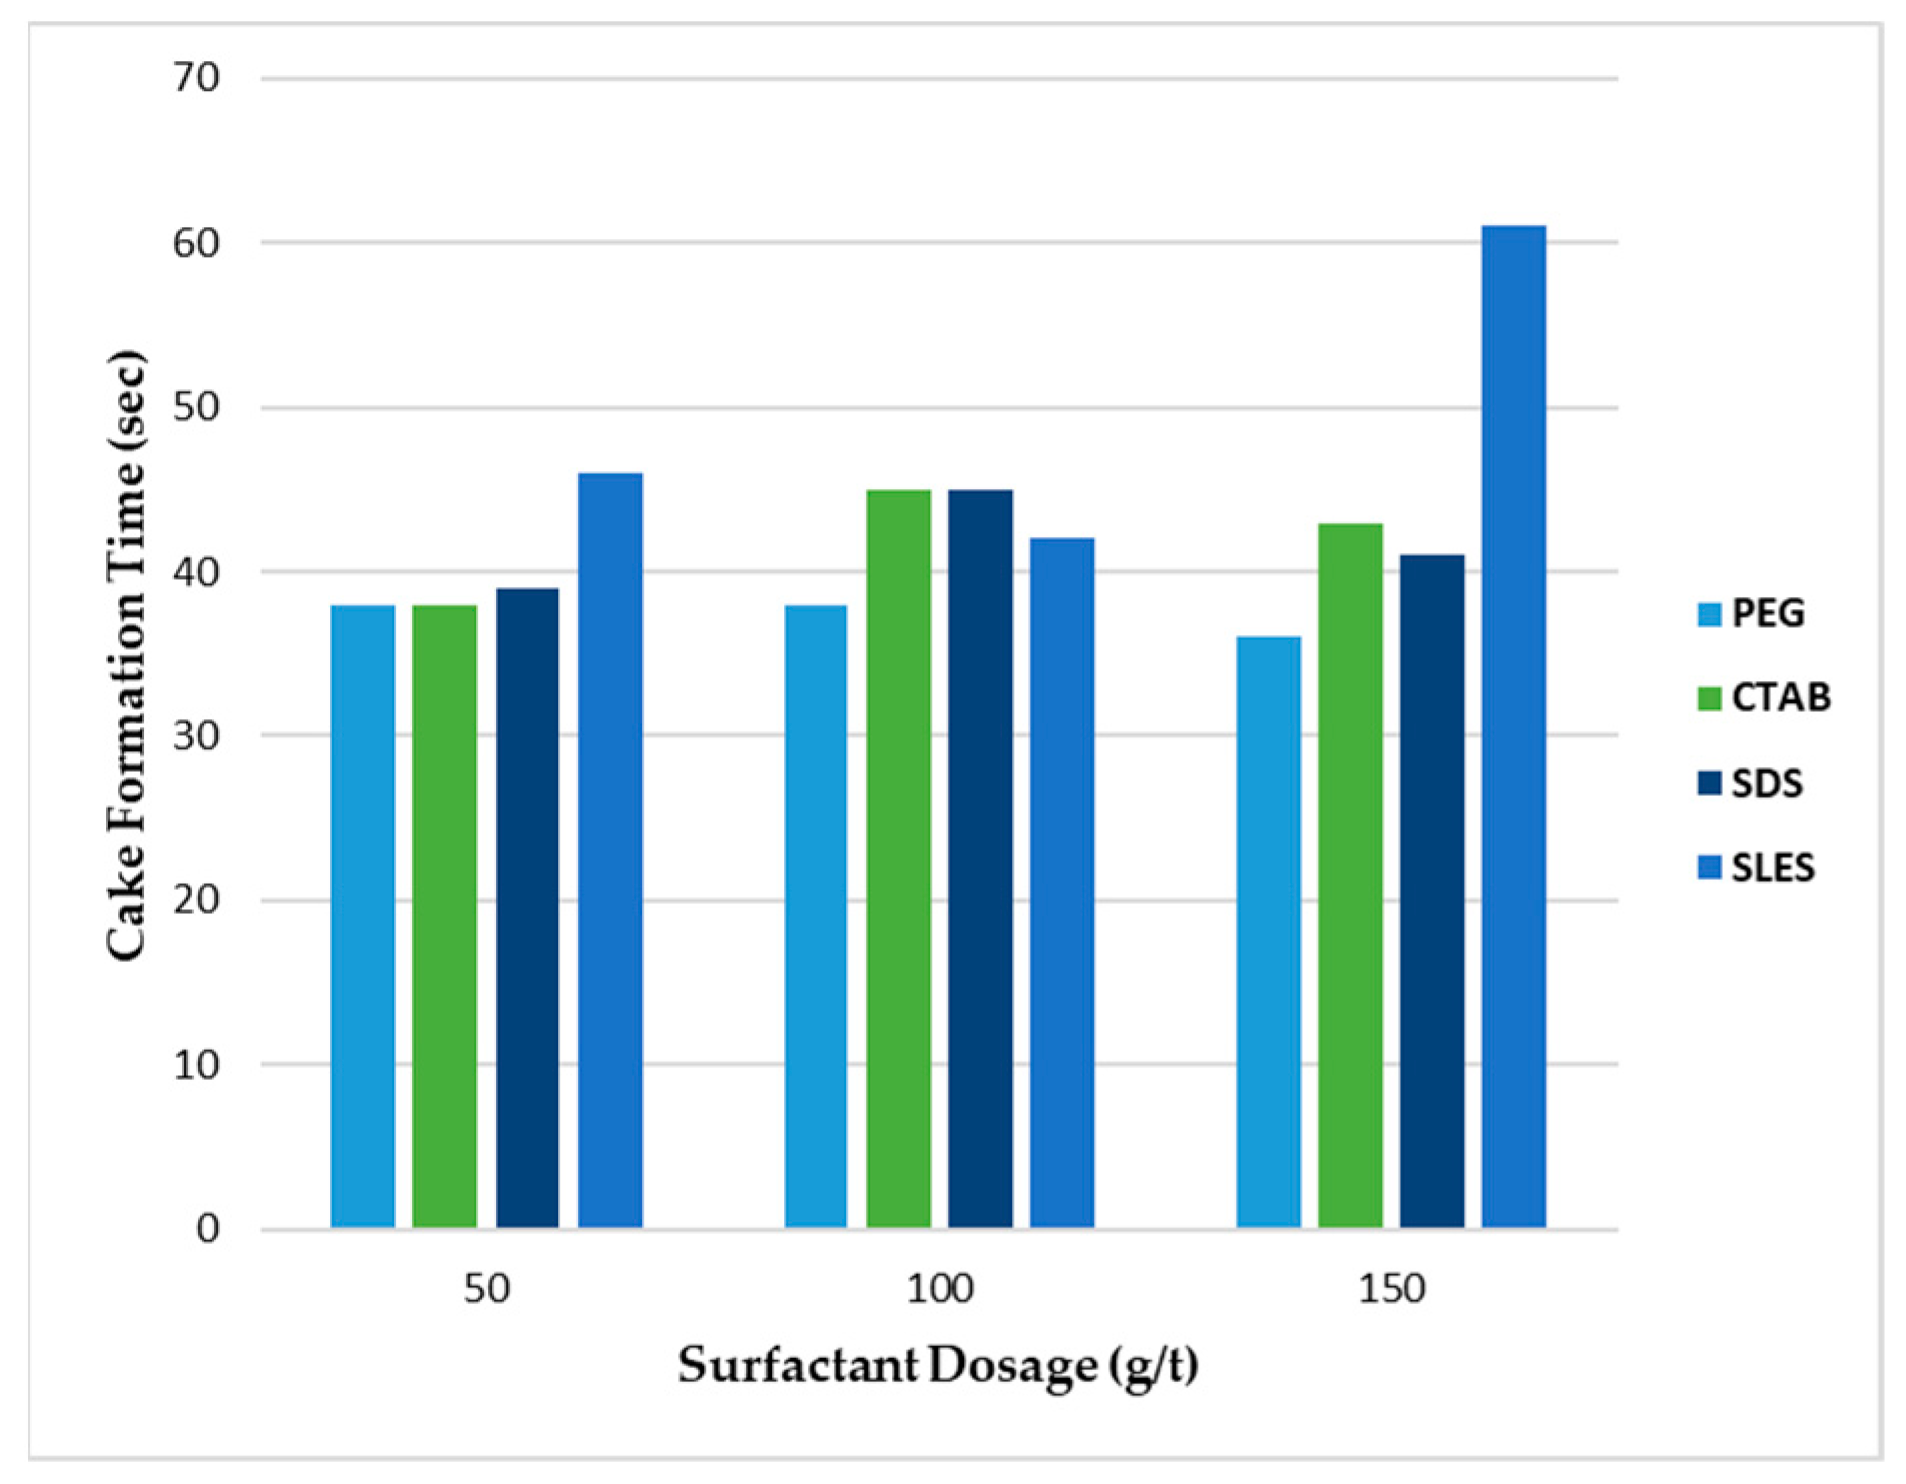
Figure 6 shows the cake formation time for surfactants in different doses. Cake forming time without additive was 36 s. In all dosage of additive, cake formation time was increased. At concentrations of 50, 100 and 150 g per ton, the minimum cake formation time was for the addition PEG. As the dosage increased, the cake formation time increases. However, this factor is one of several factors to evaluate filtration performance. SLES at a dose of 150 g per ton had the longest cake formation time.

Volume Filtrate at the Moment of Formation Cake

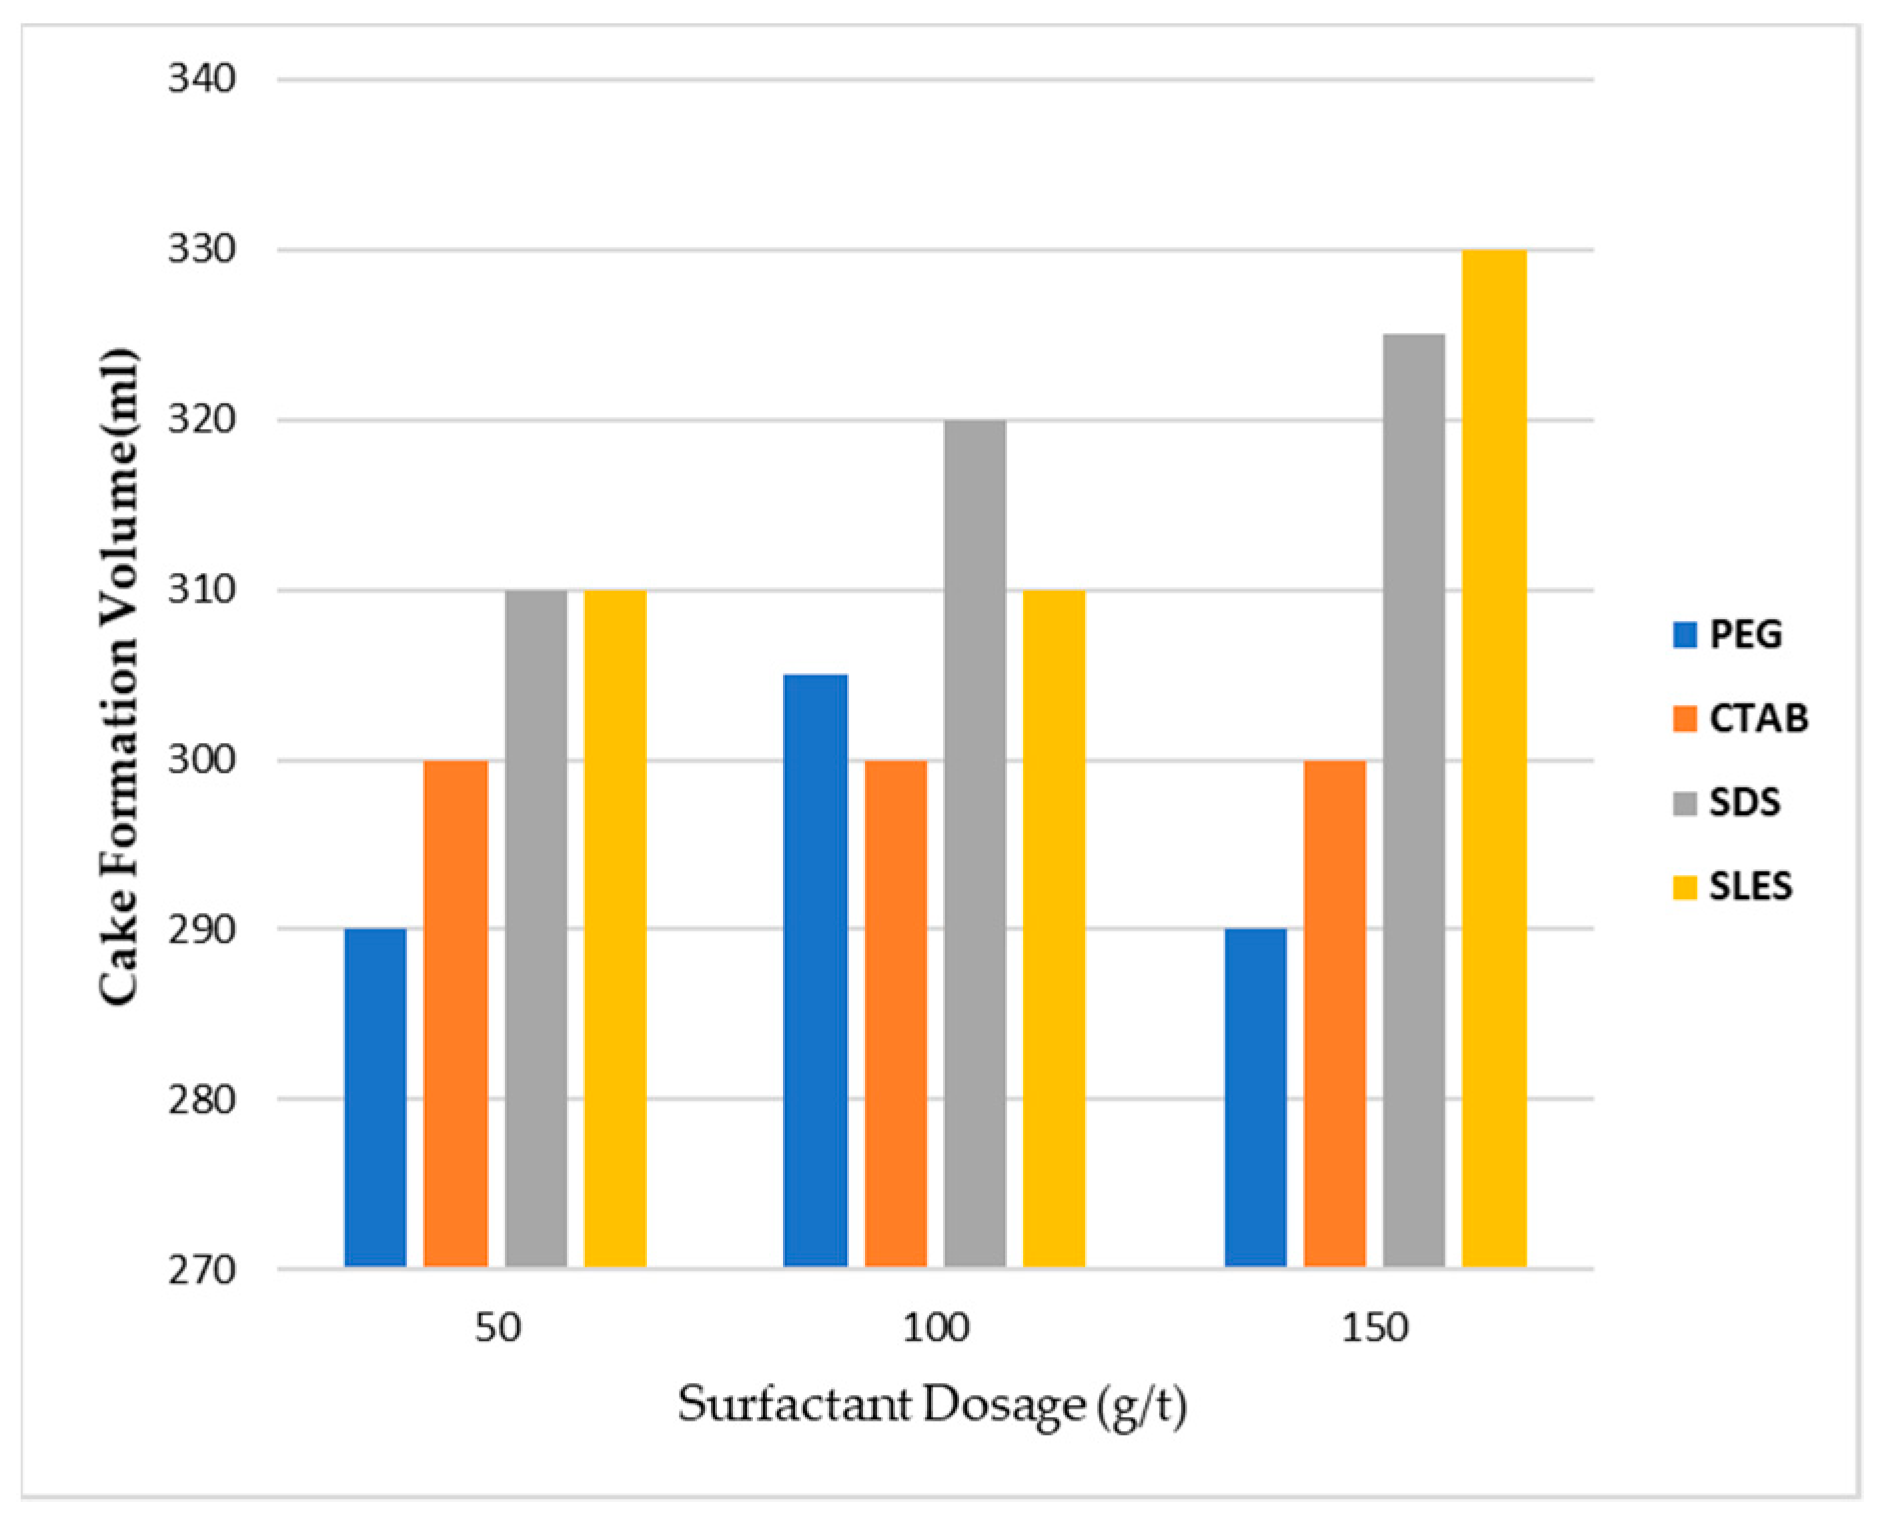
Figure 7 shows the volume of filtrate at the time of cake formation for different doses of surfactants. In the case of no additive, the volume of filtrate was 285 mL. By adding surfactant at all concentrations, the filtrate volume at the moment of cake formation increased. At dose 100 g per ton, the maximum volume was SDS. The highest volumes were 330 and 325 mL for surfactants SLES and SDS, respectively, at a dose of 150 g per ton.

3.5. Effect of Surfactants on Throughput

Throughput is the amount of fluid that will pass through a filter before the filter blocks or the flow rate is reduced to a point that is unacceptable. Throughput or filter capacity indicates the amount of cake produced per area per time. In this research, throughput expressed in Kg/m2·h.
Figure 8 shows the power for surfactants at different concentrations. The amount of throughput without additive was equal to 962 Kg/m2·h, which is marked in the diagram with a dashed line. The maximum throughput was obtained by adding 50 g per ton of PEG. At a dose of 100 g per ton, the throughput for all surfactants had a decreasing trend except SLES. At a concentration of 150 g per ton, the highest throughput was obtained by adding SDS.

4. Discussion

  • Moisture
Surfactants increase the contact angle between liquid and solid particles. Increasing the contact angle increases a particle’s hydrophobicity. Therefore, the capillary forces are reduced and the surface tension of the water is reduced. The length of the hydrocarbon chain usually determines the relative hydrophobicity of the surfactants. Therefore, the use of surfactants with longer hydrocarbon chains causes more hydrophobicity and improves filtration performance [15,16].
The zeta potential of magnetite is zero at pH = 5.7 and negative at higher pH. In use of SDS, as long as the sulfate groups have a negative charge, the two mineral surfaces repel each other and the repulsive effect increases. However, due to the absorption of water in hydrophilic groups, the retention of moisture by the mineral surface gradually increases. In the presence of SDS, the isoelectric point of the magnetite is the lowest. At natural pH, interionic repulsive forces dominate the SDS, which has a high hydrodynamic radius, thus a starch chain is produced so the adsorption factor is more due to the bridging mechanism between the particles.
The main mechanism of adsorption of CTAB on magnetite is charge neutralization. This is due to the positive charge of CTAB and the negative charge of the magnetite surface of SDS and PEG surfactants is often bridging. In CTAB, the adsorption mechanism is interaction of electrostatic and neutral loads prevails [4]. Thus, based on the Figure 2, it can be concluded that surfactants SDS and SLES, by the mentioned mechanism, cause hydrophobicity of particles and, as a result, achieve the lowest moisture content.
  • Moisture vs. cake formation time vs. filtrate volume
At the time of cake formation, two factors are important—time and volume of filtrate. The shorter the cake formation time, the higher the cake production per unit time and throughput. In cases where the final moisture is not important, this factor affects the production capacity of the plant.
The volume of filtrate at the time of cake formation determines the final moisture content of the concentrate. Therefore, in cases where the final moisture of the product is important, this factor is very effective. Therefore, in order to maintain the balance between production capacity and final moisture, a surfactant should be selected for which the cake formation time is the shortest and the filtered volume is the highest.
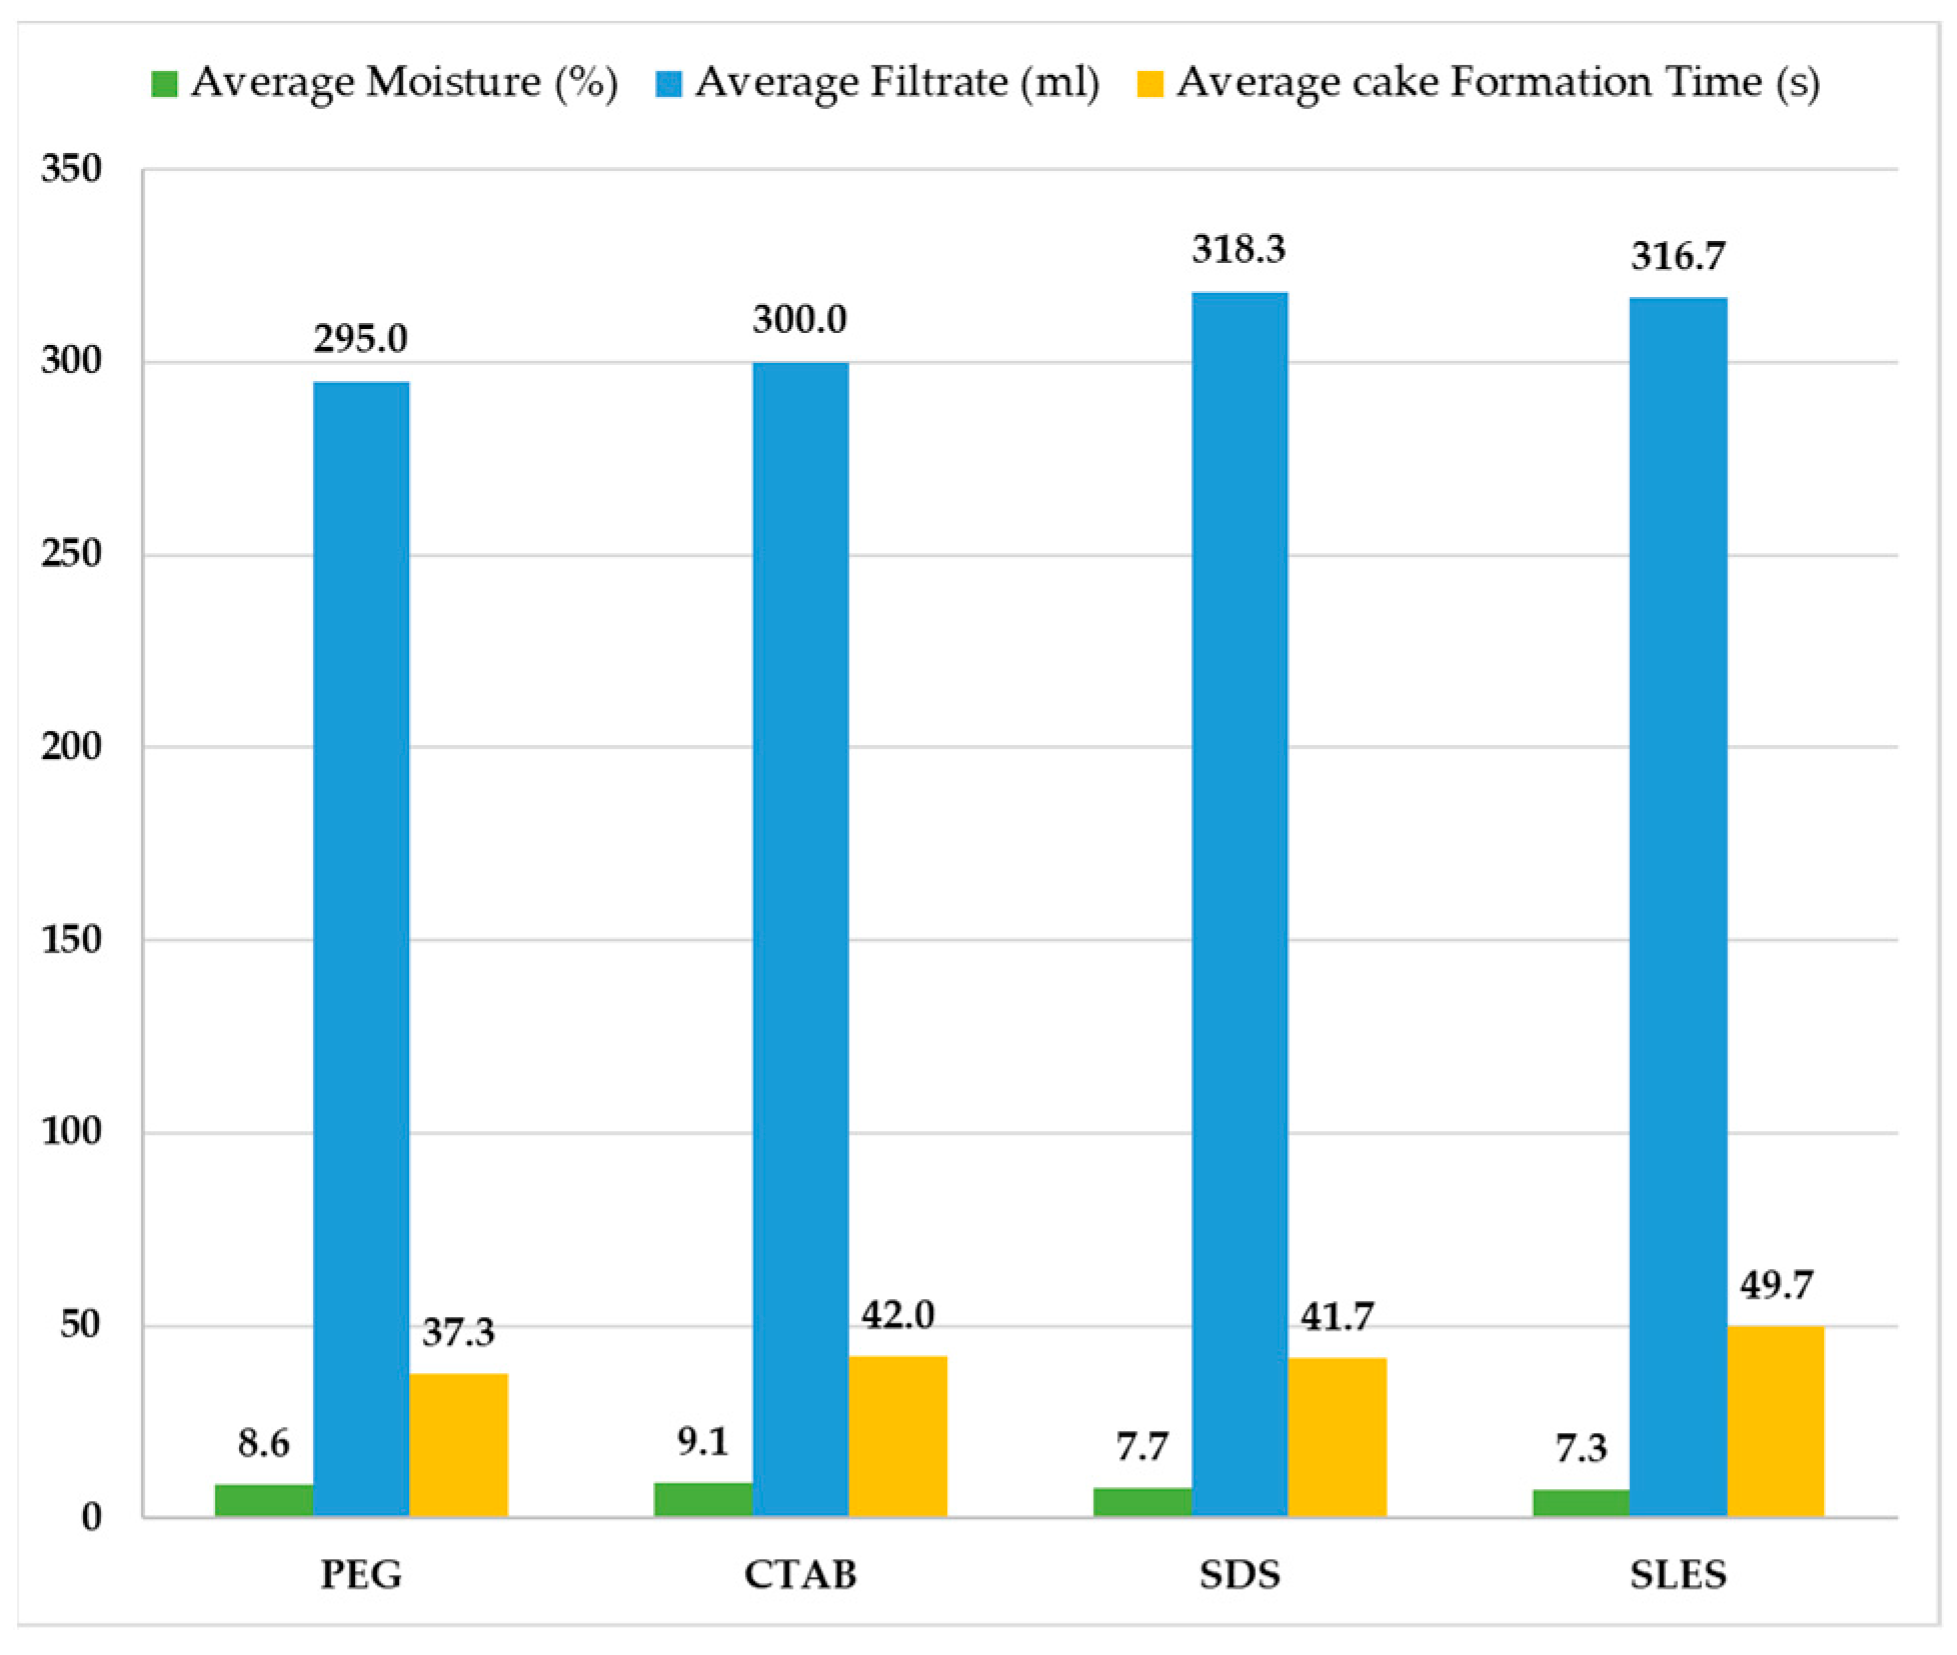
According to Figure 2, the average moisture in three dosages for PEG, CTAB, SDS and SLES surfactants are 8.6%, 9.1%, 7.7% and 7.3%, respectively.
According to Figure 6, the average cake formation times in three dosages for PEG, CTAB, SDS and SLES surfactants are 37.3, 42, 41.5 and 49.5 s, respectively.
According to Figure 7, the average volumes of water separated at the cake formation in three dosages for PEG, CTAB, SDS and SLES surfactants are 295 mL, 300 mL, 318 mL and 316.5 mL, respectively.
Figure 9 shows the average values of moisture, filtrate volume and cake formation time for each surfactant So it can be concluded that in the presence of SDS, all three factors are in balance; however, SLES is preferable to SDS because of better solubility in hard water, economic justification and availability.
  • Ratio of throughput to moisture (ϕ)
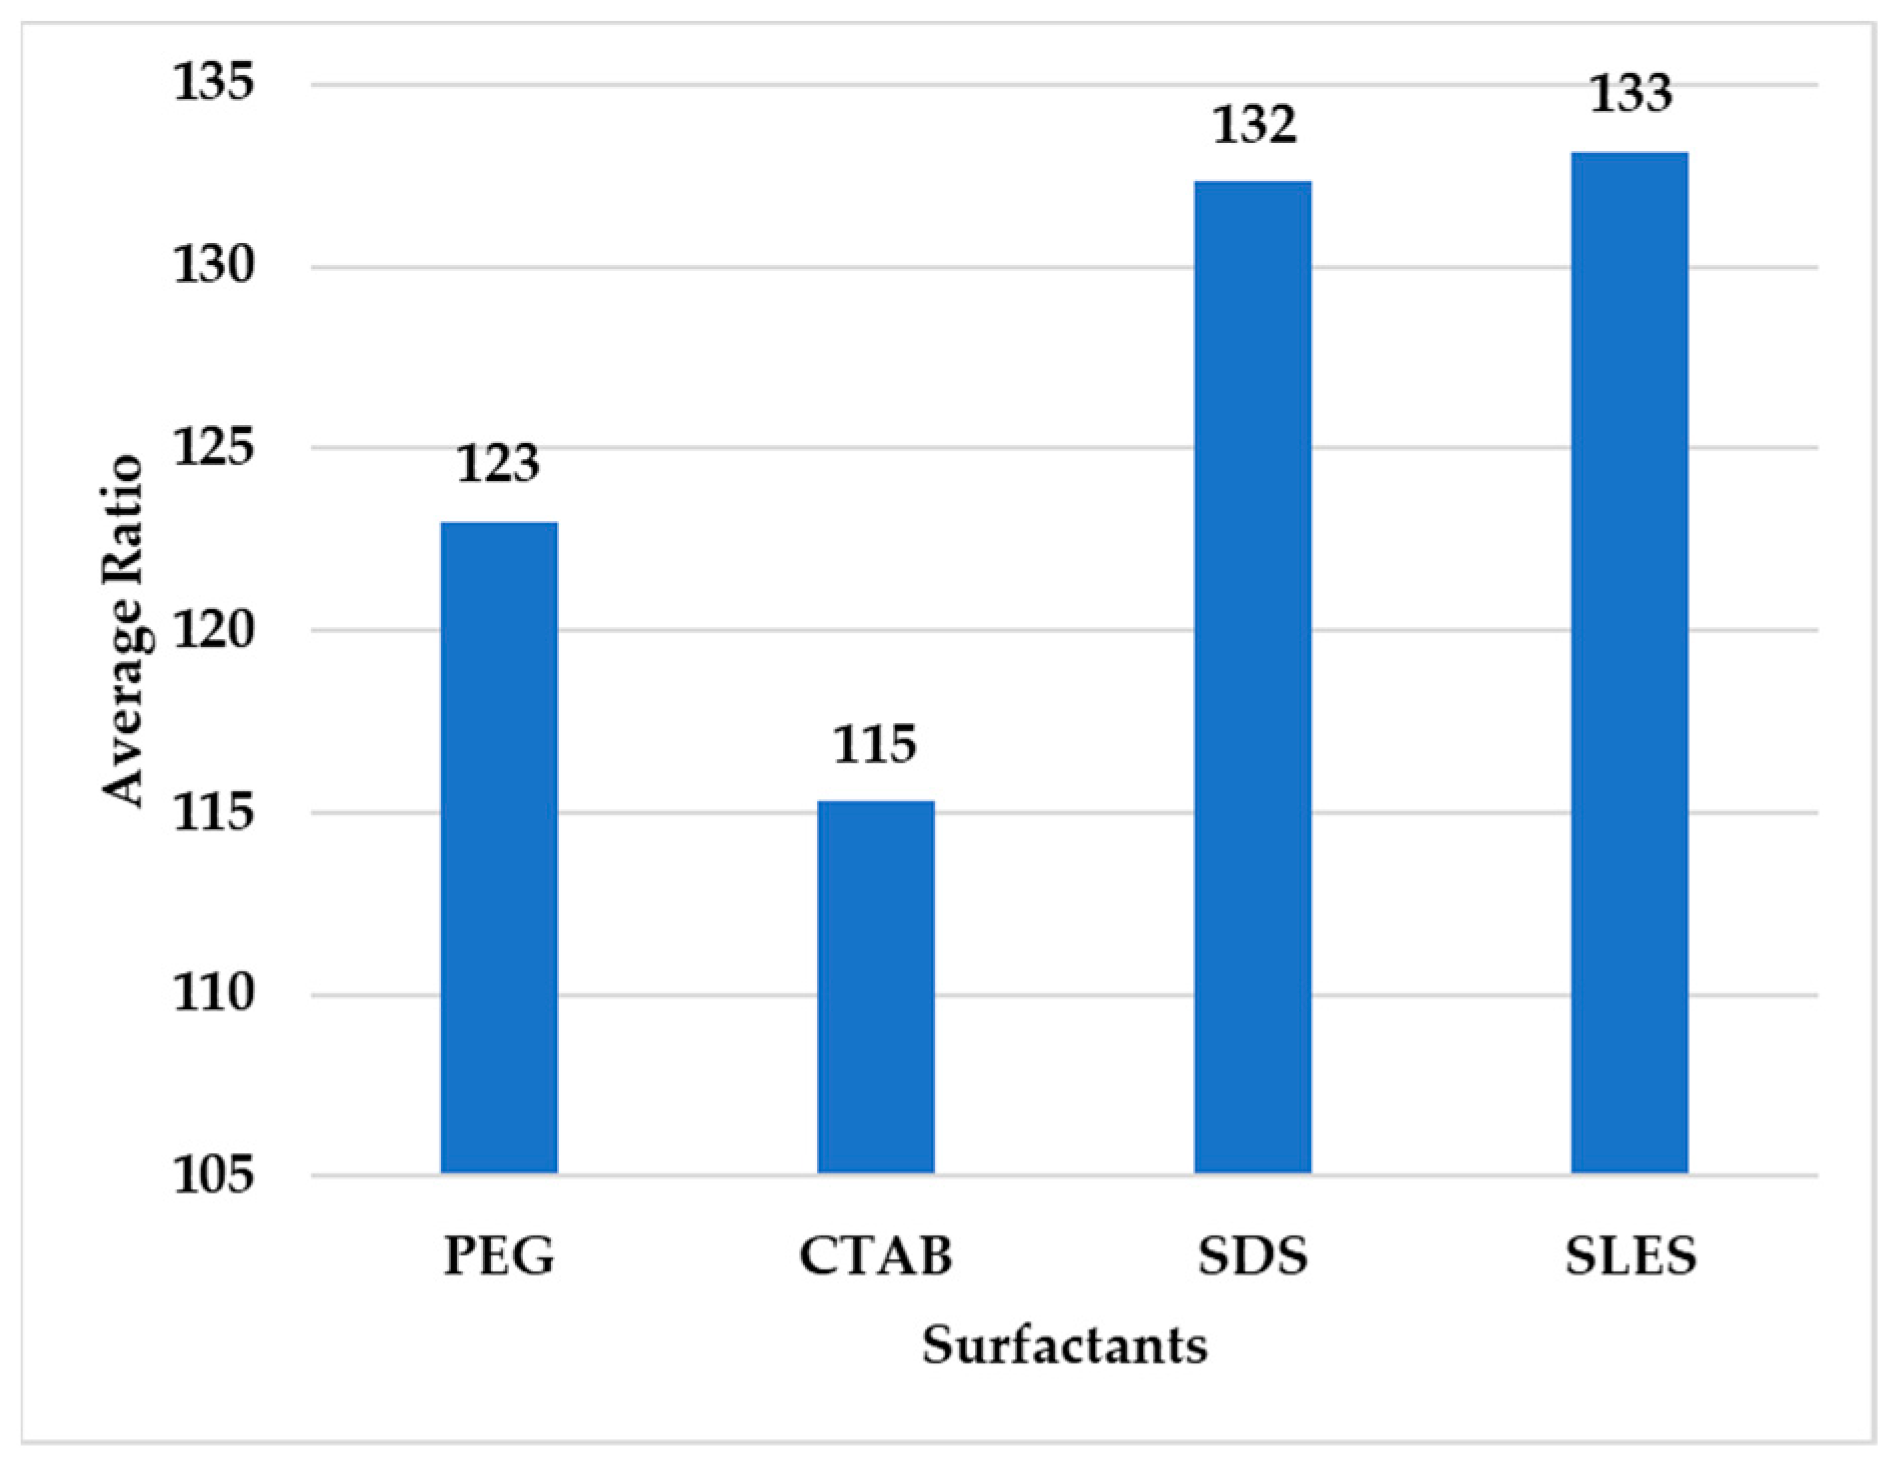
A ratio of throughput to moisture was used to compare the performance of surfactants. Figure 10 shows the ratio of throughput to moisture for different doses of surfactants. Figure 11 shows the average of this ratio for surfactants. According to Figure 11, the average ratio (ϕ) in three dosages for PEG, CTAB, SDS and SLES surfactants are 123, 115, 132 and 133, respectively.
According to Figure 11, the highest average for this ratio is obtained by adding SLES and SDS respectively. Due to the economic superiority of 1 over 2, 1 was chosen as the final surfactant. Therefore, SDS and SLES are suitable for filtration of iron concentrate. Although both of them have similar chemical structure and function, but SLES was selected due to better solubility in hard water, economic justification and availability.
The ratio of throughput to moisture of SLES at a concentration of 100 g per ton was higher than other dosages, so the concentration of 100 g per ton was selected as the optimal dosage for the best performance of the filtration process.
5. Conclusions

Results showed that, in all of the tests, cake moisture decreased by adding surfactants; however, anionic surfactants SDS and SLES were better than other chemicals. By adding 100 g/t SDS and SLES to the pulp, the filter cake moisture content was reduced by 2%. The SDS and SLES increased filtration efficiency by decreasing cake formation time and increasing the total separated water from pulp, especially at the cake formation time. SDS and SLES improve filtration performance by increasing the ratio of throughput to moisture. At a concentration of 100 grams per ton SDS and SLES, the highest throughput and lowest moisture were achieved and this result was the best compared to other surfactants. Therefore, SDS and SLES are suitable for filtration of iron concentrate. Although both of them have similar chemical structure and function, SLES was selected due to better solubility in hard water, economic justification and availability.

Funding

This research was funded by Gol-E-Gohar mining and industrial Complex (Sirjan, Iran).

Institutional Review Board Statement

Not applicable.

Informed Consent Statement

Not applicable.

Acknowledgments

Authors consider it necessary to thank and appreciate all the staff of Gol-E-Gohar Iron Ore and Steel Research Institute and Gol-E-Gohar Mining and Industrial Complex who have sincerely co-operated in conducting this research.

Conflicts of Interest

The funders had no role in the design of the study; in the collection, analyses, or interpretation of data; in the writing of the manuscript, or in the decision to publish the results.

Appendix A

Figure A1. Operational apparatus of the filtration process in the lab.
Environsciproc 06 00018 g0a1
Table A1. Specifications of the surfactants used in the experiments.
SurfactantTypeMolar MassHydrophobic GroupHydrophilic Group
PEGNonionic3600–4400--
CTABCationic364.4 Cetyl
SDSAnionic288.4SulfateDodecyl
SLESAnionic420SulfateDodecyl

References

  1. Dong, K.; Zou, R.; Yang, R.; Yu, A.; Roach, G. DEM simulation of cake formation in sedimentation and filtration. Miner. Eng. 2009, 22, 921–930. [Google Scholar] [CrossRef]
  2. Ni, L.; Yu, A.; Lu, G.; Howes, T. Simulation of the cake formation and growth in cake filtration. Miner. Eng. 2006, 19, 1084–1097. [Google Scholar] [CrossRef]
  3. Day, A. Mining Chemicals Handbook; CYTEC, Horton Printing Company: Meriden, CT, USA.
  4. Patra, A.; Makhija, D.; Mukherjee, A.; Tiwari, R.; Sahoo, C.; Mohanty, B. Improved dewatering of iron ore fines by the use of surfactants. Powder Technol. 2016, 287, 43–50. [Google Scholar] [CrossRef]
  5. Castro, S.; Laskowski, J. Depressing effect of flocculants on molybdenite flotation. Miner. Eng. 2015, 74, 13–19. [Google Scholar] [CrossRef]
  6. Fan, Y.; Dong, X.; Li, H. Dewatering effect of fine coal slurry and filter cake structure based on particle charac-teristics. Vacuum 2015, 114, 54–57. [Google Scholar] [CrossRef]
  7. Garmsiri, M.; Shirazi, H.H.A. The effect of grain size on flocculant preparation. Miner. Eng. 2014, 65, 51–53. [Google Scholar] [CrossRef]
  8. Sarkar, A.K.; Ghorai, S.; Patra, A.S.; Mishra, B.K.; Mandre, N.; Pal, S. Modified amylopectin based flocculant for the treatment of synthetic effluent and industrial wastewaters. Int. J. Biol. Macromol. 2015, 72, 356–363. [Google Scholar] [CrossRef] [PubMed]
  9. Liu, H.; Yang, X.; Zhang, Y.; Zhu, H.; Yao, J. Flocculation characteristics of polyacrylamide grafted cellulose from Phyllostachys heterocycla: An efficient and eco-friendly flocculant. Water Res. 2014, 59, 165–171. [Google Scholar] [CrossRef] [PubMed]
  10. Wang, L.-F.; He, D.-Q.; Tong, Z.-H.; Li, W.-W.; Yu, H.-Q. Characterization of dewatering process of activated sludge assisted by cationic surfactants. Biochem. Eng. J. 2014, 91, 174–178. [Google Scholar] [CrossRef]
  11. Lihong, D.; Xu, C.; Wenping, L.; Qixin, Z. A study on enhancement of filtration process with filter aids diato-maceous earth and wood pulp cellulose. Chin. J. Chem. Eng. 2011, 19, 792–798. [Google Scholar]
  12. Wang, J.P.; Chen, Y.Z.; Yuan, S.J.; Sheng, G.P.; Yu, H.Q. Synthesis and characterization of a novel cationic chi-tosan-based flocculant with a high water-solubility for pulp mill wastewater treatment. Water Res. 2009, 43, 5267–5275. [Google Scholar] [CrossRef] [PubMed]
  13. Besra, L.; Singh, B.; Reddy, P.; Sengupta, D. Influence of surfactants on filter cake parameters during vacuum filtration of flocculated iron ore sludge. Powder Technol. 1998, 96, 240–247. [Google Scholar] [CrossRef]
  14. Mackenzie, M.; Malhotra, D.; Riggs, W.F. Chemical Reagents in the mineral Processing Industry; Society of Mineral Engineering: Colorado, CO, USA; pp. 139–145.
  15. Singh, B. The influence of surface phenomena on the dewatering of fine clean coal. Filtr. Sep. 1997, 34, 159–163. [Google Scholar] [CrossRef]
  16. Sparks, T. Solid-liquid filtration: Understanding filter presses and belt filters. Filtr. Sep. 2012, 49, 20–24. [Google Scholar] [CrossRef]
Figure 1. Particle size distribution of the sample.
Environsciproc 06 00018 g001
Figure 2. Effect of surfactants on moisture.
Environsciproc 06 00018 g002
Figure 3. Effect of surfactants on water recovery at 50 g/t dosage.
Environsciproc 06 00018 g003
Figure 4. Effect of surfactants on water recovery at 100 g/t dosage.
Environsciproc 06 00018 g004
Figure 5. Effect of surfactants on water recovery at 150 g/t dosage.
Environsciproc 06 00018 g005
Figure 6. Effect of surfactants on cake formation time at different dosage.
Environsciproc 06 00018 g006
Figure 7. Effect of surfactants on filtrate volume at the moment of formation cake with different dosages.
Environsciproc 06 00018 g007
Figure 8. Effect of surfactants on throughput with different dosages.
Environsciproc 06 00018 g008
Figure 9. Average values of moisture, filtrate volume and cake formation time for each surfactant.
Environsciproc 06 00018 g009
Figure 10. Ratio of throughput to moisture (ϕ) at different dosages.
Environsciproc 06 00018 g010
Figure 11. Average ratio of throughput to moisture (ϕ).
Environsciproc 06 00018 g011
Table 1. XRF analysis of the concentrate sample prepared from the Gol-E-Gohar concentrate production plant.
TiO2SiO2Al2O3FeOFeComponent
0.040.261.312669%
LOI *PSMgOCaOComponent
2.510.050.30.220.31%
* Loss-On-Ignition (LOI).
Publisher’s Note: MDPI stays neutral with regard to jurisdictional claims in published maps and institutional affiliations.