
Optical Properties and Direct Radiative Effects of Aerosol Species at the Global Scale Based on the Synergistic Use of MERRA-2 Optical Properties and the FORTH Radiative Transfer Model †

 ,
,  ,
, 
Abstract
:1. Introduction
2. Methods
3. Results and Discussion
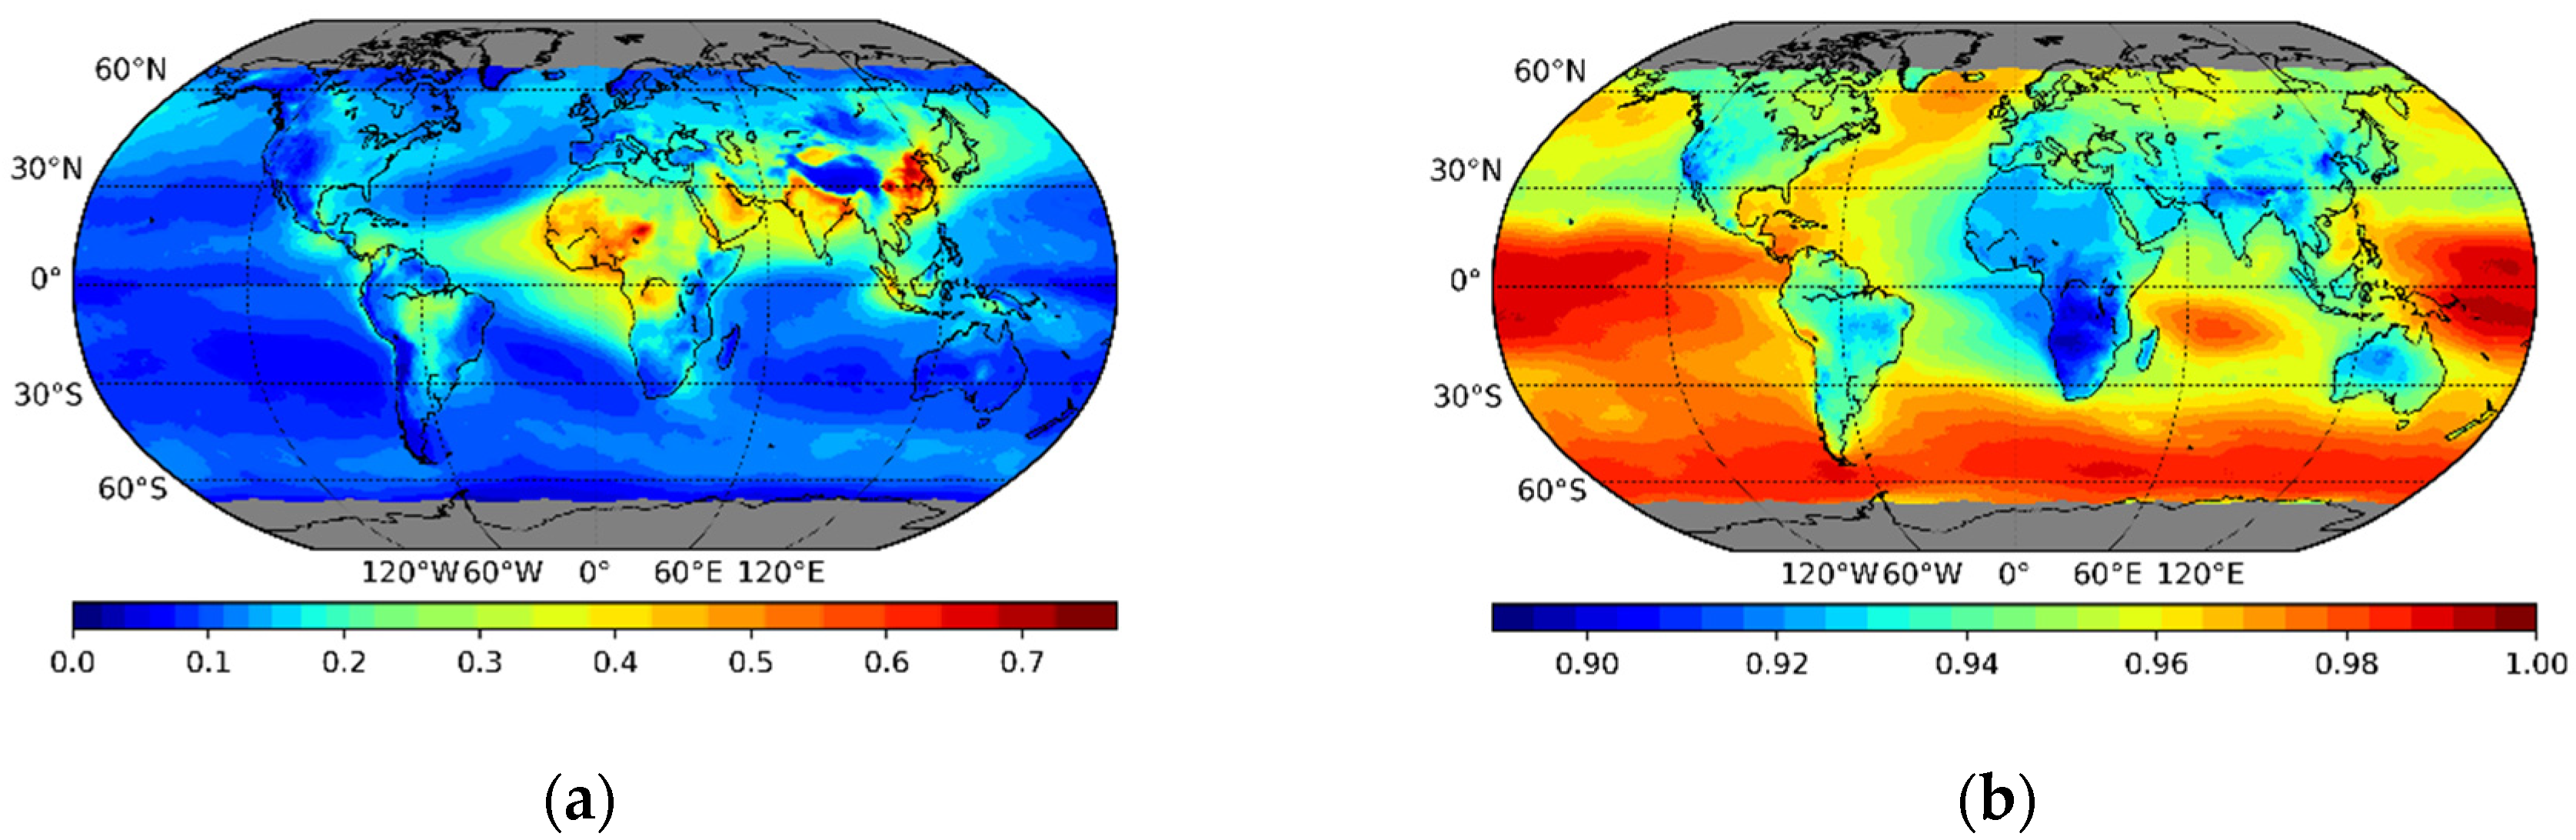
3.1. Aerosol Optical Properties for the Year 2015
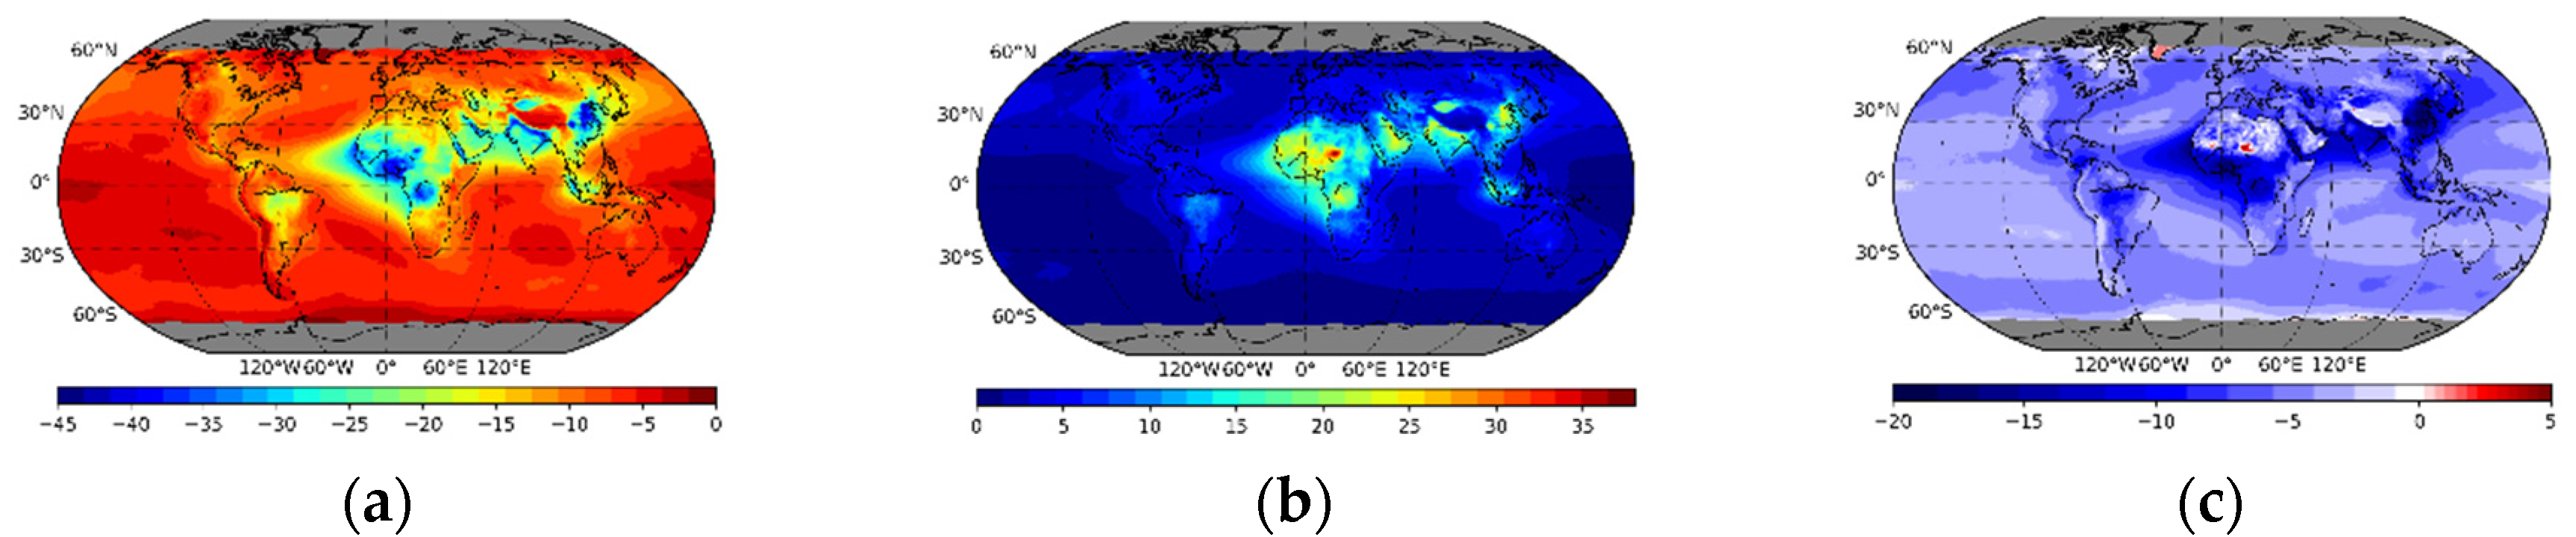
3.2. Aerosol Radiative Effects for the Year 2015
4. Conclusions
Author Contributions
Funding
Institutional Review Board Statement
Informed Consent Statement
Data Availability Statement
Acknowledgments
Conflicts of Interest
References
- Boucher, O.; Randall, D.; Artaxo, P.; Bretherton, C.; Feingold, G.; Forster, P.; Kerminen, V.-M.; Kondo, Y.; Liao, H.; Lohmann, U.; et al. Clouds and Aerosols. In Climate Change 2013: The Physical Science Basis, Contribution of Working Group I to the Fifth Assessment Report of the Intergovernmental Panel on Climate Change; Stocker, T.F., Qin, D., Plattner, G.-K., Tignor, M., Allen, S.K., Boschung, J., Nauels, A., Xia, Y., Bex, V., Midgley, P.M., Eds.; Cambridge University Press: Cambridge, UK; New York, NY, USA, 2013; pp. 571–658. [Google Scholar]
- Gelaro, R.; McCarty, W.; Suárez, M.J.; Todling, R.; Molod, A.; Takacs, L.; Randles, C.A.; Darmenov, A.; Bosilovich, M.G.; Reichle, R.; et al. The Modern-Era Retrospective Analysis for Research and Applications, Version 2 (MERRA-2). J. Clim. 2017, 30, 5419–5454. [Google Scholar] [CrossRef] [PubMed]
- Randles, C.A.; da Silva, A.M.; Buchard, V.; Colarco, P.R.; Dar-menov, A.; Govindaraju, R.; Smirnov, A.; Holben, B.; Ferrare, R.; Hair, J.; et al. The MERRA-2 aerosol reanalysis, 1980 onward. Part I: System description and data assimilation evaluation. J. Clim. 2017, 30, 6823–6850. [Google Scholar] [CrossRef] [PubMed]
- Hatzianastassiou, N.; Matsoukas, C.; Drakakis, E.; Stackhouse, P., Jr.; Koepke, P.; Fotiadi, A.; Pavlakis, K.; Vardavas, I. The direct effect of aerosols on solar radiation based on satellite observations, reanalysis datasets, and spectral aerosol optical properties from Global Aerosol Data Set (GADS). Atmos. Chem. Phys. 2007, 7, 2585–2599. [Google Scholar] [CrossRef]
- Vardavas, I.; Carver, J.H. Solar and terrestrial parameterizations for radiative convective models. Planet. Space Sci. 1984, 32, 1307–1325. [Google Scholar] [CrossRef]
- Korras-Carraca, M.B.; Pappas, V.; Hatzianastassiou, N.; Vardavas, I.; Matsoukas, C. Global vertically resolved aerosol direct radiation effect from three years of CALIOP data using the FORTH radiation transfer model. Atmos. Res. 2019, 224, 138–156. [Google Scholar] [CrossRef]
- Hatzianastassiou, N.; Katsoulis, B.; Vardavas, I. Sensitivity analysis of aerosol direct radiative forcing in ultraviolet–visible wavelengths and consequences for the heat budget. Tellus B 2004, 56, 368–381. [Google Scholar]
- Wild, M. Enlightening Global Dimming and Brightening. Bull. Am. Meteorol. Soc. 2012, 93, 27–37. [Google Scholar] [CrossRef]
- Hatzianastassiou, N.; Matsoukas, C.; Fotiadi, A.; Stackhouse, P.W., Jr.; Koepke, P.; Pavlakis, K.G.; Vardavas, I. Modelling the direct effect of aerosols in the solar near-infrared on a planetary scale. Atmos. Chem. Phys. 2007, 7, 3211–3229. [Google Scholar] [CrossRef]
- Hansen, J.; Sato, M.; Ruedy, R. Radiative forcing and climate response. J. Geophys. Res. 1997, 102, 6831–6864. [Google Scholar] [CrossRef]
- Gkikas, A.; Obiso, V.; Pérez García-Pando, C.; Jorba, O.; Hatzianastassiou, N.; Vendrell, L.; Basart, S.; Solomos, S.; Gassó, S.; Baldasano, J.M. Direct radiative effects during intense Mediterranean desert dust outbreaks. Atmos. Chem. Phys. 2018, 18, 8757–8787. [Google Scholar] [CrossRef]


| DRETOA | DREatm | DREsurfnet | AOD | SSA | |
|---|---|---|---|---|---|
| Global | −4.79 | 3.94 | −8.73 | 0.137 | 0.957 |
| Land | −5.33 | 6.66 | −11.98 | 0.172 | 0.938 |
| Ocean | −4.55 | 2.72 | −7.27 | 0.121 | 0.965 |
| N. Hemisphere | −5.64 | 5.41 | −11.05 | 0.171 | 0.950 |
| S. Hemisphere | −3.96 | 2.50 | −6.46 | 0.104 | 0.963 |
| DRETOA | DREatm | DREsurfnet | AODsct | AODabs | |
|---|---|---|---|---|---|
| Global | −0.96 | 0.46 | −1.42 | 0.036 | 0.000 |
| Land | −1.46 | 0.43 | −1.90 | 0.054 | 0.000 |
| Ocean | −0.73 | 0.48 | −1.21 | 0.028 | 0.000 |
| N. Hemisphere | −1.41 | 0.45 | −1.86 | 0.051 | 0.000 |
| S. Hemisphere | −0.51 | 0.48 | −0.99 | 0.021 | 0.000 |
| DRETOA | DREatm | DREsurfnet | AODsct | AODabs | |
|---|---|---|---|---|---|
| Global | −0.61 | 1.72 | −2.33 | 0.028 | 0.002 |
| Land | −1.24 | 3.13 | −4.36 | 0.056 | 0.004 |
| Ocean | −0.33 | 1.09 | −1.41 | 0.015 | 0.001 |
| N. Hemisphere | −1.27 | 2.69 | −3.96 | 0.049 | 0.004 |
| S. Hemisphere | 0.04 | 0.77 | −0.73 | 0.007 | <0.001 |
| DRETOA | DREatm | DREsurfnet | AODsct | AODabs | |
|---|---|---|---|---|---|
| Global | −1.23 | 0.59 | −1.82 | 0.042 | 0.000 |
| Land | −0.14 | 0.47 | −0.61 | 0.014 | 0.000 |
| Ocean | −1.73 | 0.64 | −2.37 | 0.055 | 0.000 |
| N. Hemisphere | −0.92 | 0.55 | −1.47 | 0.035 | 0.000 |
| S. Hemisphere | −1.55 | 0.63 | −2.17 | 0.049 | 0.000 |
| DRETOA | DREatm | DREsurfnet | AODsct | AODabs | |
|---|---|---|---|---|---|
| Global | −0.72 | 0.73 | −1.45 | 0.025 | <0.001 |
| Land | −1.36 | 0.87 | −2.22 | 0.039 | 0.001 |
| Ocean | −0.44 | 0.66 | −1.10 | 0.018 | <0.001 |
| N. Hemisphere | −0.85 | 0.73 | −1.58 | 0.028 | <0.001 |
| S. Hemisphere | −0.60 | 0.72 | −1.33 | 0.022 | <0.001 |
| DRETOA | DREatm | DREsurfnet | AODsct | AODabs | |
|---|---|---|---|---|---|
| Global | 0.69 | 2.33 | −1.64 | 0.002 | 0.004 |
| Land | 0.97 | 3.48 | −2.51 | 0.002 | 0.007 |
| Ocean | 0.57 | 1.81 | −1.24 | 0.001 | 0.003 |
| N. Hemisphere | 0.83 | 2.78 | −1.94 | 0.002 | 0.005 |
| S. Hemisphere | 0.56 | 1.90 | −1.34 | 0.001 | 0.004 |
Publisher’s Note: MDPI stays neutral with regard to jurisdictional claims in published maps and institutional affiliations. |
© 2020 by the authors. Licensee MDPI, Basel, Switzerland. This article is an open access article distributed under the terms and conditions of the Creative Commons Attribution (CC BY) license (https://creativecommons.org/licenses/by/4.0/).
Share and Cite
Korras-Carraca, M.-B.; Gkikas, A.; Silva, A.M.D.; Matsoukas, C.; Hatzianastassiou, N.; Vardavas, I. Optical Properties and Direct Radiative Effects of Aerosol Species at the Global Scale Based on the Synergistic Use of MERRA-2 Optical Properties and the FORTH Radiative Transfer Model. Environ. Sci. Proc. 2021, 4, 4. https://doi.org/10.3390/ecas2020-08151
Korras-Carraca M-B, Gkikas A, Silva AMD, Matsoukas C, Hatzianastassiou N, Vardavas I. Optical Properties and Direct Radiative Effects of Aerosol Species at the Global Scale Based on the Synergistic Use of MERRA-2 Optical Properties and the FORTH Radiative Transfer Model. Environmental Sciences Proceedings. 2021; 4(1):4. https://doi.org/10.3390/ecas2020-08151
Chicago/Turabian StyleKorras-Carraca, Marios-Bruno, Antonis Gkikas, Arlindo M. Da Silva, Christos Matsoukas, Nikolaos Hatzianastassiou, and Ilias Vardavas. 2021. "Optical Properties and Direct Radiative Effects of Aerosol Species at the Global Scale Based on the Synergistic Use of MERRA-2 Optical Properties and the FORTH Radiative Transfer Model" Environmental Sciences Proceedings 4, no. 1: 4. https://doi.org/10.3390/ecas2020-08151
APA StyleKorras-Carraca, M.-B., Gkikas, A., Silva, A. M. D., Matsoukas, C., Hatzianastassiou, N., & Vardavas, I. (2021). Optical Properties and Direct Radiative Effects of Aerosol Species at the Global Scale Based on the Synergistic Use of MERRA-2 Optical Properties and the FORTH Radiative Transfer Model. Environmental Sciences Proceedings, 4(1), 4. https://doi.org/10.3390/ecas2020-08151