Proceeding Paper

Moisture Sources for Tropical Cyclones Genesis in the Coast of West Africa through a Lagrangian Approach †

by
Albenis Pérez-Alarcón
1,2,*,
Rogert Sorí
1,3,
José Carlos Fernández-Alvarez
1,2,
Raquel Nieto
1 and
Luis Gimeno
1
1
Environmental Physics Laboratory (EPhysLab), CIM-UVigo, Universidade de Vigo, 32004 Ourense, Spain
2
Department of Meteorology, Higher Institute of Technologies and Applied Sciences, University of Havana, 10400 Havana, Cuba
3
Instituto Dom Luiz, Faculdade de Ciências da Universidade de Lisboa, 1749-016 Campo Grande, Portugal
*
Author to whom correspondence should be addressed.
Presented at the 3rd International Electronic Conference on Atmospheric Sciences, 16–30 November 2020; Available online: https://ecas2020.sciforum.net/.
Environ. Sci. Proc. 2021, 4(1), 3; https://doi.org/10.3390/ecas2020-08126
Published: 13 November 2020
(This article belongs to the Proceedings of The 3rd International Electronic Conference on Atmospheric Sciences)

Abstract

:
Atmospheric moisture transport plays an important role in the genesis of tropical cyclones (TCs). In this study, the moisture sources associated with the genesis of TCs in the tropical Atlantic Ocean near West Africa, from June to November in the period 1980–2018, were identified. To detect the location of the TCs geneses, the HURDAT2 database from the National Hurricane Center was used. Additionally, global outputs of the Lagrangian FLEXPART model were used to determine the moisture sources that provided water vapor for the genesis of TCs. This model permitted us to track backward in time the air masses from the genesis region of the TCs and identify regions where air masses uptake moisture before reach the target regions. The results reveal that 18.1% (108 TC) of the total number of TCs that formed in the North Atlantic basin were originated in the region of study. The largest frequency for the TCs geneses was observed in August and September, with each one representing approximately 45% of the total. The transport of moisture associated with the genesis of TCs mainly comes from the east of the North and South Atlantic Ocean, as well as from West Africa and the Sahel region. The patterns of moisture uptake confirmed an interhemispheric moisture transport. Finally, during the El Niño, the moisture uptake is more intense over the Atlantic Ocean close to West Africa around 15° N of latitude, while during La Niña, the pattern is slightly weaker but covers a wider area over the Atlantic Ocean and the north of Africa.

1. Introduction

Tropical cyclones (TCs) are the atmospheric phenomena most likely to cause natural disasters [1]. These systems form over warm regions in tropical oceans and strengthen when environmental conditions are favorable [2].
The annual variability observed in the genesis of TCs in the different ocean basins is attributed to the combination of thermodynamic and dynamic factors [3]. Palmen [4] showed that for TC formation, the sea surface temperature (SST) must be higher than 26 °C, while Riehl [5] suggested that the vertical shear of the horizontal wind is an environmental factor that inhibits the genesis of TCs.
During the cyclonic season in the North Atlantic (NATL) basin from June to November, many disturbances travel over tropical oceans in each cyclogenetic basin; however, very few become TCs. This occurs because some preconditions defined by Gray [6] for TC genesis do not occur simultaneously [7]. According to Gray [6], for the formation of a TC, the SST must be higher than 26.5 °C at an ocean depth of approximately 50 m [7], there must be sufficient atmospheric instability that favors the thunderstorms formation for the release of latent heat, there must be a high content of water vapor in layers of the middle atmosphere, and there must be an atmospheric disturbance generally above 5 degrees of latitude (north or south), which obtains from the Earth’s spin a background rotation that can later be amplified, and finally, there must be low vertical wind shear from the surface to the tropopause.
Gray [6] defined a TC formation parameter as the product of thermodynamic and dynamic terms. The effects of the SST and humidity at the upper mid-level were included in the thermodynamic term, while the effects of vertical shear and low-level vorticity were included in the dynamic term. Results of McBride [8] showed a significant correlation between the climatological values of this parameter and the global regions of TC formation. Another parameter for the estimate the genesis of TCs in the NATL basin between the coast of West Africa (WA) and the Lesser Antilles Arc was developed by DeMaria et al. [3]. Similar to that in Gray [6], this genesis parameter is the combination of thermodynamic and dynamic factors, defined as the product of appropriately scaled 5-day running mean vertical shear, vertical instability, and mid-level moisture variables.
The atmospheric moisture transport and its convergence play an important role in the latent heat distribution in TCs [9,10]. Thus, one of the key aspects to correctly understand the contribution of dynamic mechanisms, air–sea interaction, and large-scale processes interactions in the genesis and development of TCs, is the water circulation and budgets inside and outside the TC system [11]. Numerical sensitive experiments performed by Yoshida et al. [12] showed that, despite the existence of medium and low-level vortices, the disturbance did not become a TC, due to the low content of water vapor. Furthermore, Fujiwara et al. [11], through a regional cloud resolution model and Lagrange diagnostics, found a positive feedback between the TC intensity in the Western North Pacific basin and the moisture transport transported from the Indian Ocean, the Sea of South China, and the Philippine Sea. Numerical simulations with the Weather Research and Forecasting (WRF) model have also revealed that environmental moisture modifications had insignificant impacts on the storm unless it changed the moisture transport into it [13].
The main fuel for TCs is the release of latent heat derived from the condensation of water vapor [11]. Therefore, water vapor from the surface ocean water evaporation due to high SST, and the moisture transport through local and global patterns of atmospheric circulation, favor the genesis and intensification of TCs. The identification of moisture sources can be performed through the analysis of the particle path by applying different techniques. Both Lagrangian and Eulerian methods can be used with a good approximation to study the moisture source-sink relationship and its influence on atmospheric processes [14,15,16,17].
Climatological statistics show that the highest number of TC geneses occur between mid-August to mid-November, in which TCs generally form from tropical waves between the West African coast and the Lesser Antilles Arc [3,18]. According to DeMaria et al. [3], this region is the source of 40% of TC geneses in the NATL basin, of which 60% become major hurricanes. In a recent study, Pazos and Gimeno [19] utilized a Lagrangian approach to identify the anomalies in the moisture uptake by air masses before reaching the region of the genesis of 110 TCs within the region between 15–45° W and 8–20° N, from 1979–2012. These anomalies allowed them to identify those areas from which the moisture uptake was greater than the climatological average for the respective hour and day of the year. These are the central and eastern tropical North Atlantic Ocean, extending to the north along the African coast, the eastern South Atlantic Ocean, WA, and the Sahel. These two terrestrial sources (WA and Sahel) involve complex hydroclimatic interactions in several atmospheric processes on different time scales such as the low-level atmospheric moisture transport and the West African Monsoon [20,21,22].
Considering these previous findings, in this study, we aim to identify the moisture sources for TCs formed in the eastern tropical Atlantic Ocean near the coast of WA, and assess the role of the El Niño Southern Oscillation (ENSO) on the genesis of TCs at the study regions and the determine the role of moisture sources. In addition, other parameters such as the SST are taken into account.

2. Material and Methods

2.1. Data

The position of the genesis of TCs between 1980 and 2018 was extracted from the Atlantic hurricane database (HURDAT2) from the National Hurricane Center, which is freely available at https://www.nhc.noaa.gov/data/#hurdat (Accessed on 14 July 2020). This database is a text format with information every six hours on the position, intensity, and critical wind radii in the northeast, southeast, southwest, and northwest quadrants of all tropical and subtropical cyclones originating in the NATL basin [23].
Global outputs from the FLEXible PARTicle dispersion model (FLEXPART) v9.0 [24] were utilized to investigate the sources of moisture for TCs. This model was reinforced with the global reanalysis ERA-Interim [25] datasets from the European Center for Medium-Range Weather Forecasts (ECMWF) available at 6 h intervals at 1° horizontal resolutions on 60 vertical levels from 0.1 to 1000 hPa.
The target region for each TC was considered as the area enclosed by the outer radius of the TC. The size of the storm was extracted from the TC Size database [26], which contains information every six hours of the position and intensity, as well as the maximum wind radius, the critical wind radii, and the storm size estimated using the methodology described by Pérez-Alarcón et al. [27].
The monthly precipitation from the National Center for Environmental Prediction—National Center for Atmospheric Research (NCEP-NCAR) [28] and the SST from the Centennial Time Scale (COBE SST2) dataset [29], with a horizontal resolution of 2.5° × 2.5° and 1° × 1°, respectively, were also utilized. Finally, the unsmoothed monthly values of the AMO (Atlantic Multidecadal Oscillation) Index [30], available at https://www.psl.noaa.gov/data/timeseries/AMO (Accessed on 19 July 2020), and the Bivariate ENSO Timeseries (BEST) ENSO Index [31] were used.

2.2. Methodology

2.2.1. Cluster Analysis

With the information of the position of the TCs genesis, obtained from the HURDAT2 database, a K-means [32] cluster analysis was performed, applying the silhouette coefficient to determine the optimum number of clusters of TCs that formed in the NATL basin following the criteria of Corporal-Lodangco et al. [33].

2.2.2. The Lagrangian Model FLEXPART

The Eulerian techniques have been used in numerous studies to investigate atmospheric moisture transport [34]. Nevertheless, this technique has multiple disadvantages, such as the poor representation of short-timescale hydrological cycle parameters and does not include the remote sources of water for a region [35]. Therefore, these authors recommend the use of computationally more complex Lagrangian techniques. Thus, to investigate the sources of moisture for TCs genesis, global outputs from the FLEXPART v9.0 were used [24,36]. In this experiment, the model considers the atmosphere homogeneously divided into approximately 2 million particles. Air masses residing over the area enclosed by the outer radius of each TC were tracked backward in time up to 10 days; which is considered the residence time of the water vapor in the atmosphere [37]. Along the trajectories and every 6 h, the gain (through evaporation from the environment e) or loss (through precipitation p) of specific humidity (q) by each parcel was calculated using Equation (1):
( e p ) = m ( d q d t )
where m is the mass of each parcel assumed as constant. By adding the individual changes of specific humidity of each particle in the vertical column, the total balance of atmospheric humidity (EP) was estimated, where E represents evaporation and P precipitation [38]. Values of (EP) > 0 mean that air masses on average gained rather than lost moisture. Thus, those regions where moisture uptake occurred are considered sources of moisture.

3. Results and Discussion

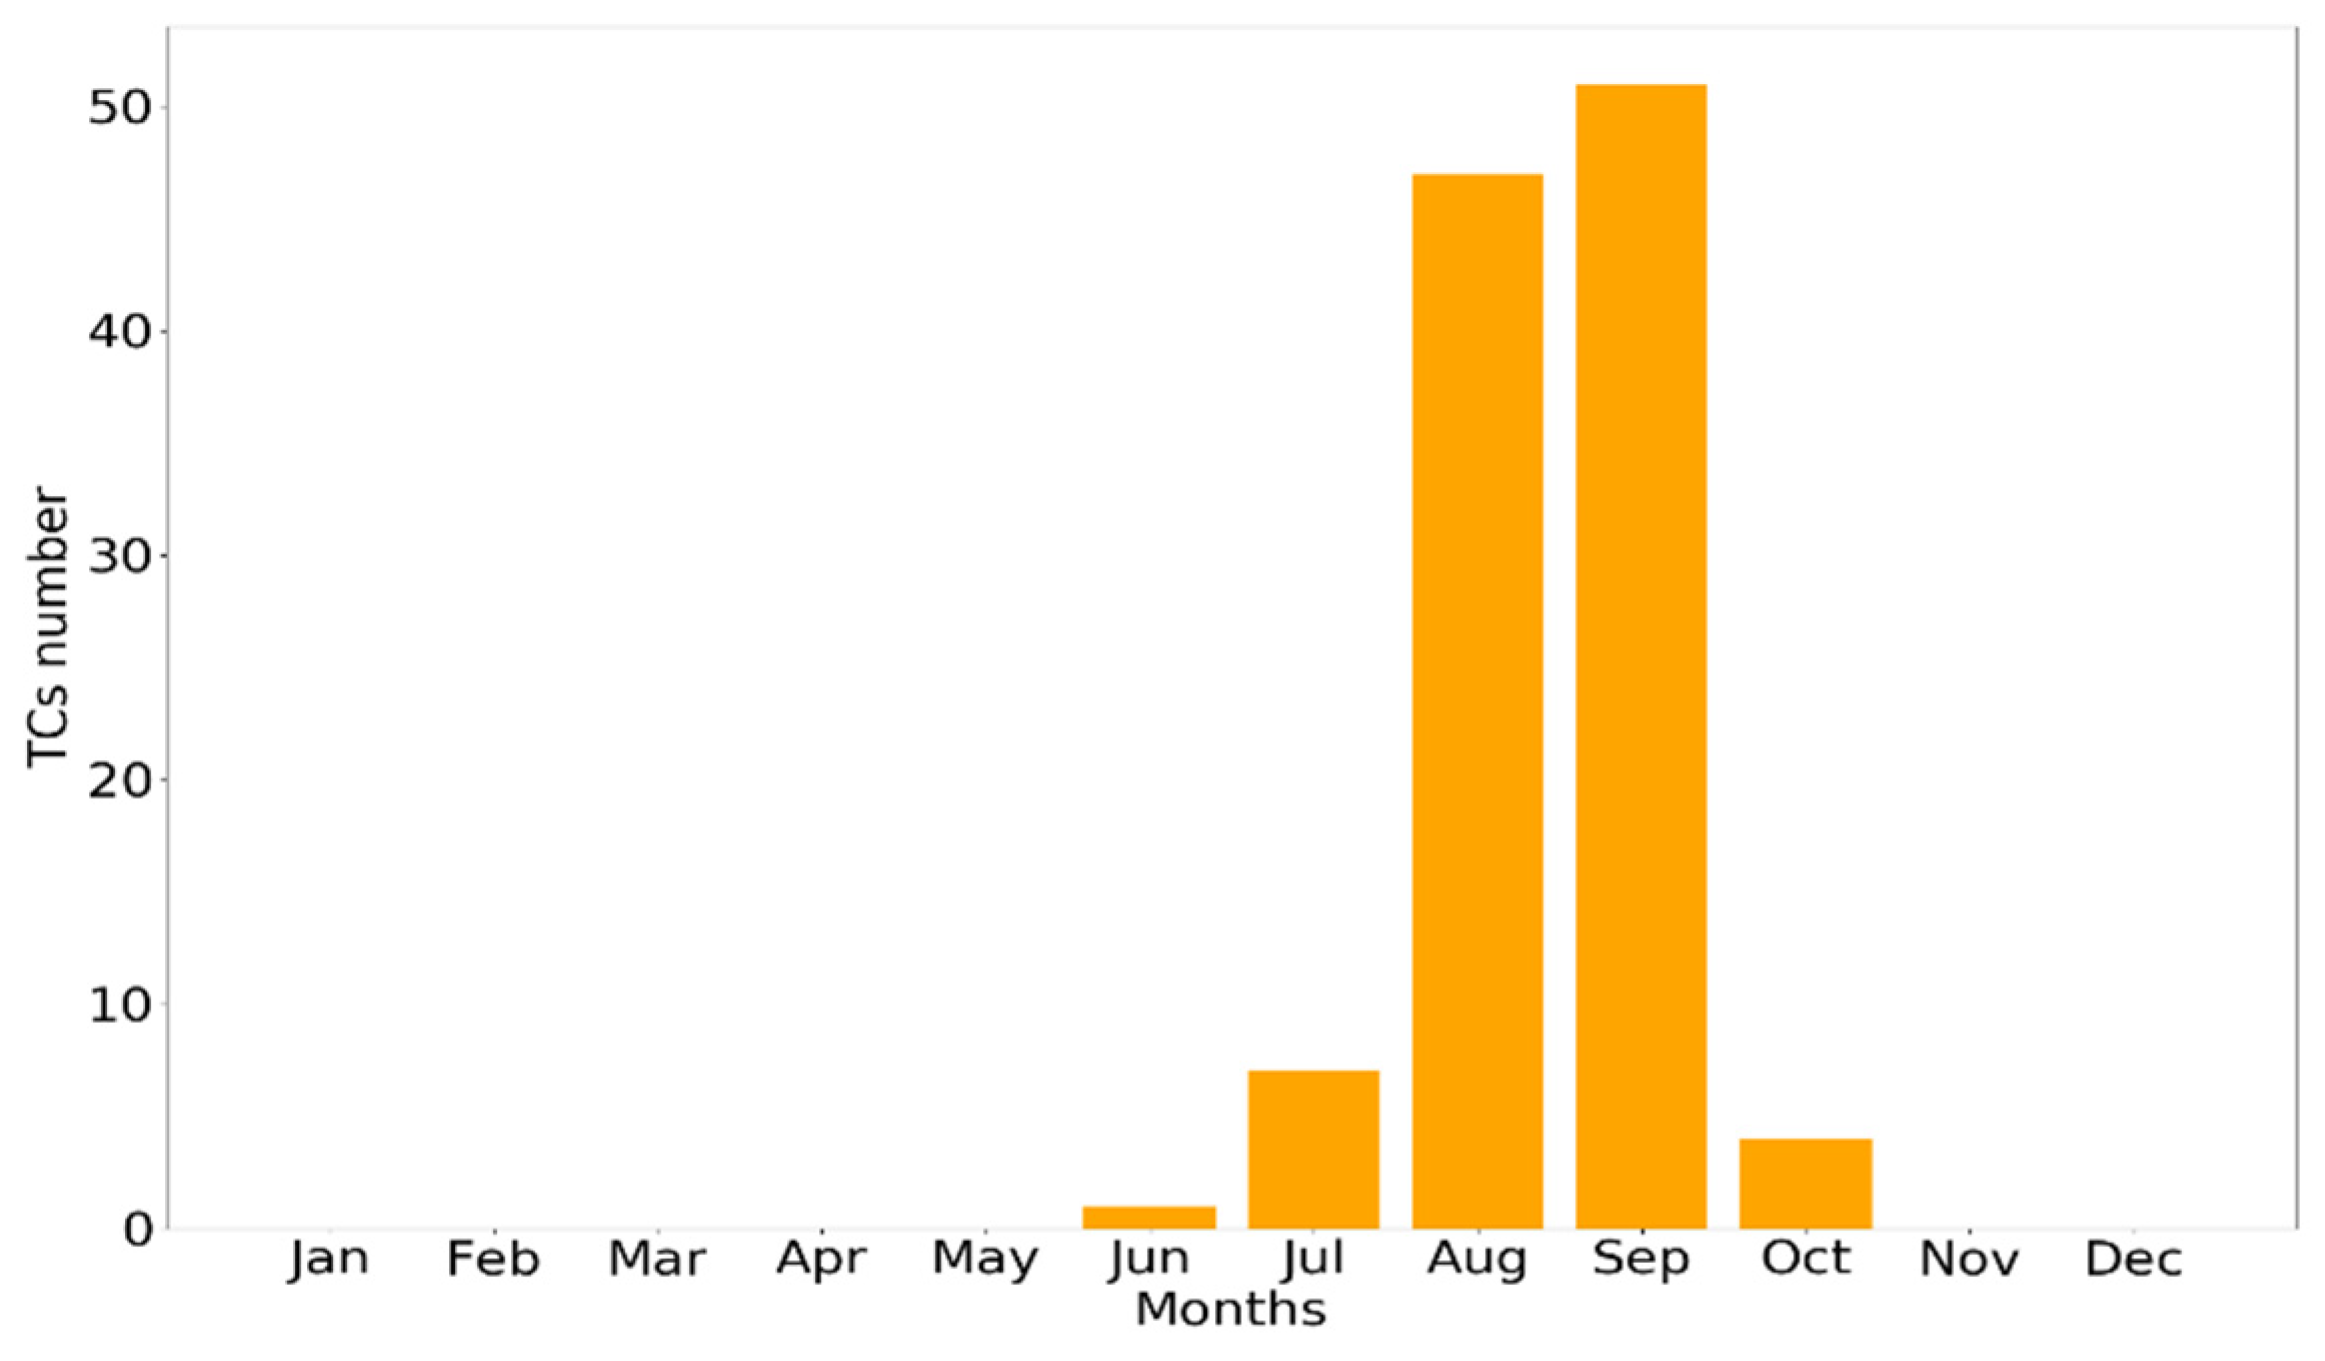
3.1. TC Genesis near the Coast of West Africa

By applying the K-means cluster analysis, through the silhouette coefficient, seven regions of TCs genesis were determined in the NATL basin, in agreement with results obtained by Corporal-Lodangco et al. [33]. These are the Gulf of Mexico (purple), the western Caribbean Sea (black), the Central North Atlantic (blue), the West North Atlantic (brown), the Tropical Central North Atlantic (yellow), the Lesser Antilles Arc (green), and the region near the WA coast (orange), as shown in Figure 1.
A total number of 108 (18.1%) of the 598 TCs formed over the NATL basin from 1980 to 2018 originated in the eastern tropical North Atlantic near WA (the region bounded by the red dashed lines in Figure 1). In the monthly distribution, a significant frequency of geneses was observed in August and September, with 43.2% and 46.7% respectively, while in June (0.9%), July (6.4%), and October (2.8%), there were low frequencies of geneses in this area (Figure 2). Moreover, it is notable that no TC geneses occurred in November or out of the hurricane season. This behavior has been attributed to the fact that the TCs that formed near the WA coast originated from tropical waves, in agreement with DeMaria et al. [3]. Annually, an average of 2.8 TCs were formed in this region. The highest number of geneses were observed in 1980 and 2010, with six TCs, while in 1986, 1992, and 1997, no TCs were formed in the study period.
The climatological precipitation for the hurricane season for the period 1981–2010 is shown in Figure 3. It shows a rainfall pattern characterized with values ranging from 2 to 4 mm/day over the region of study and between 10 and 12 mm/day over the southern WA. This pattern is attributed to the influence of the Intertropical Convergence Zone (ITCZ) and therefore the moisture transport from the north and south hemispheres. As Gray and Landsea [39] showed, the African rainfall before August 1 has a significant correlation with subsequent intense hurricane activity. Therefore, the cyclone activity in the eastern tropical Atlantic Ocean has been related to the intensity of the WAM and the positional shifts in the African easterly jet (AEJ) and African easterly waves [40].

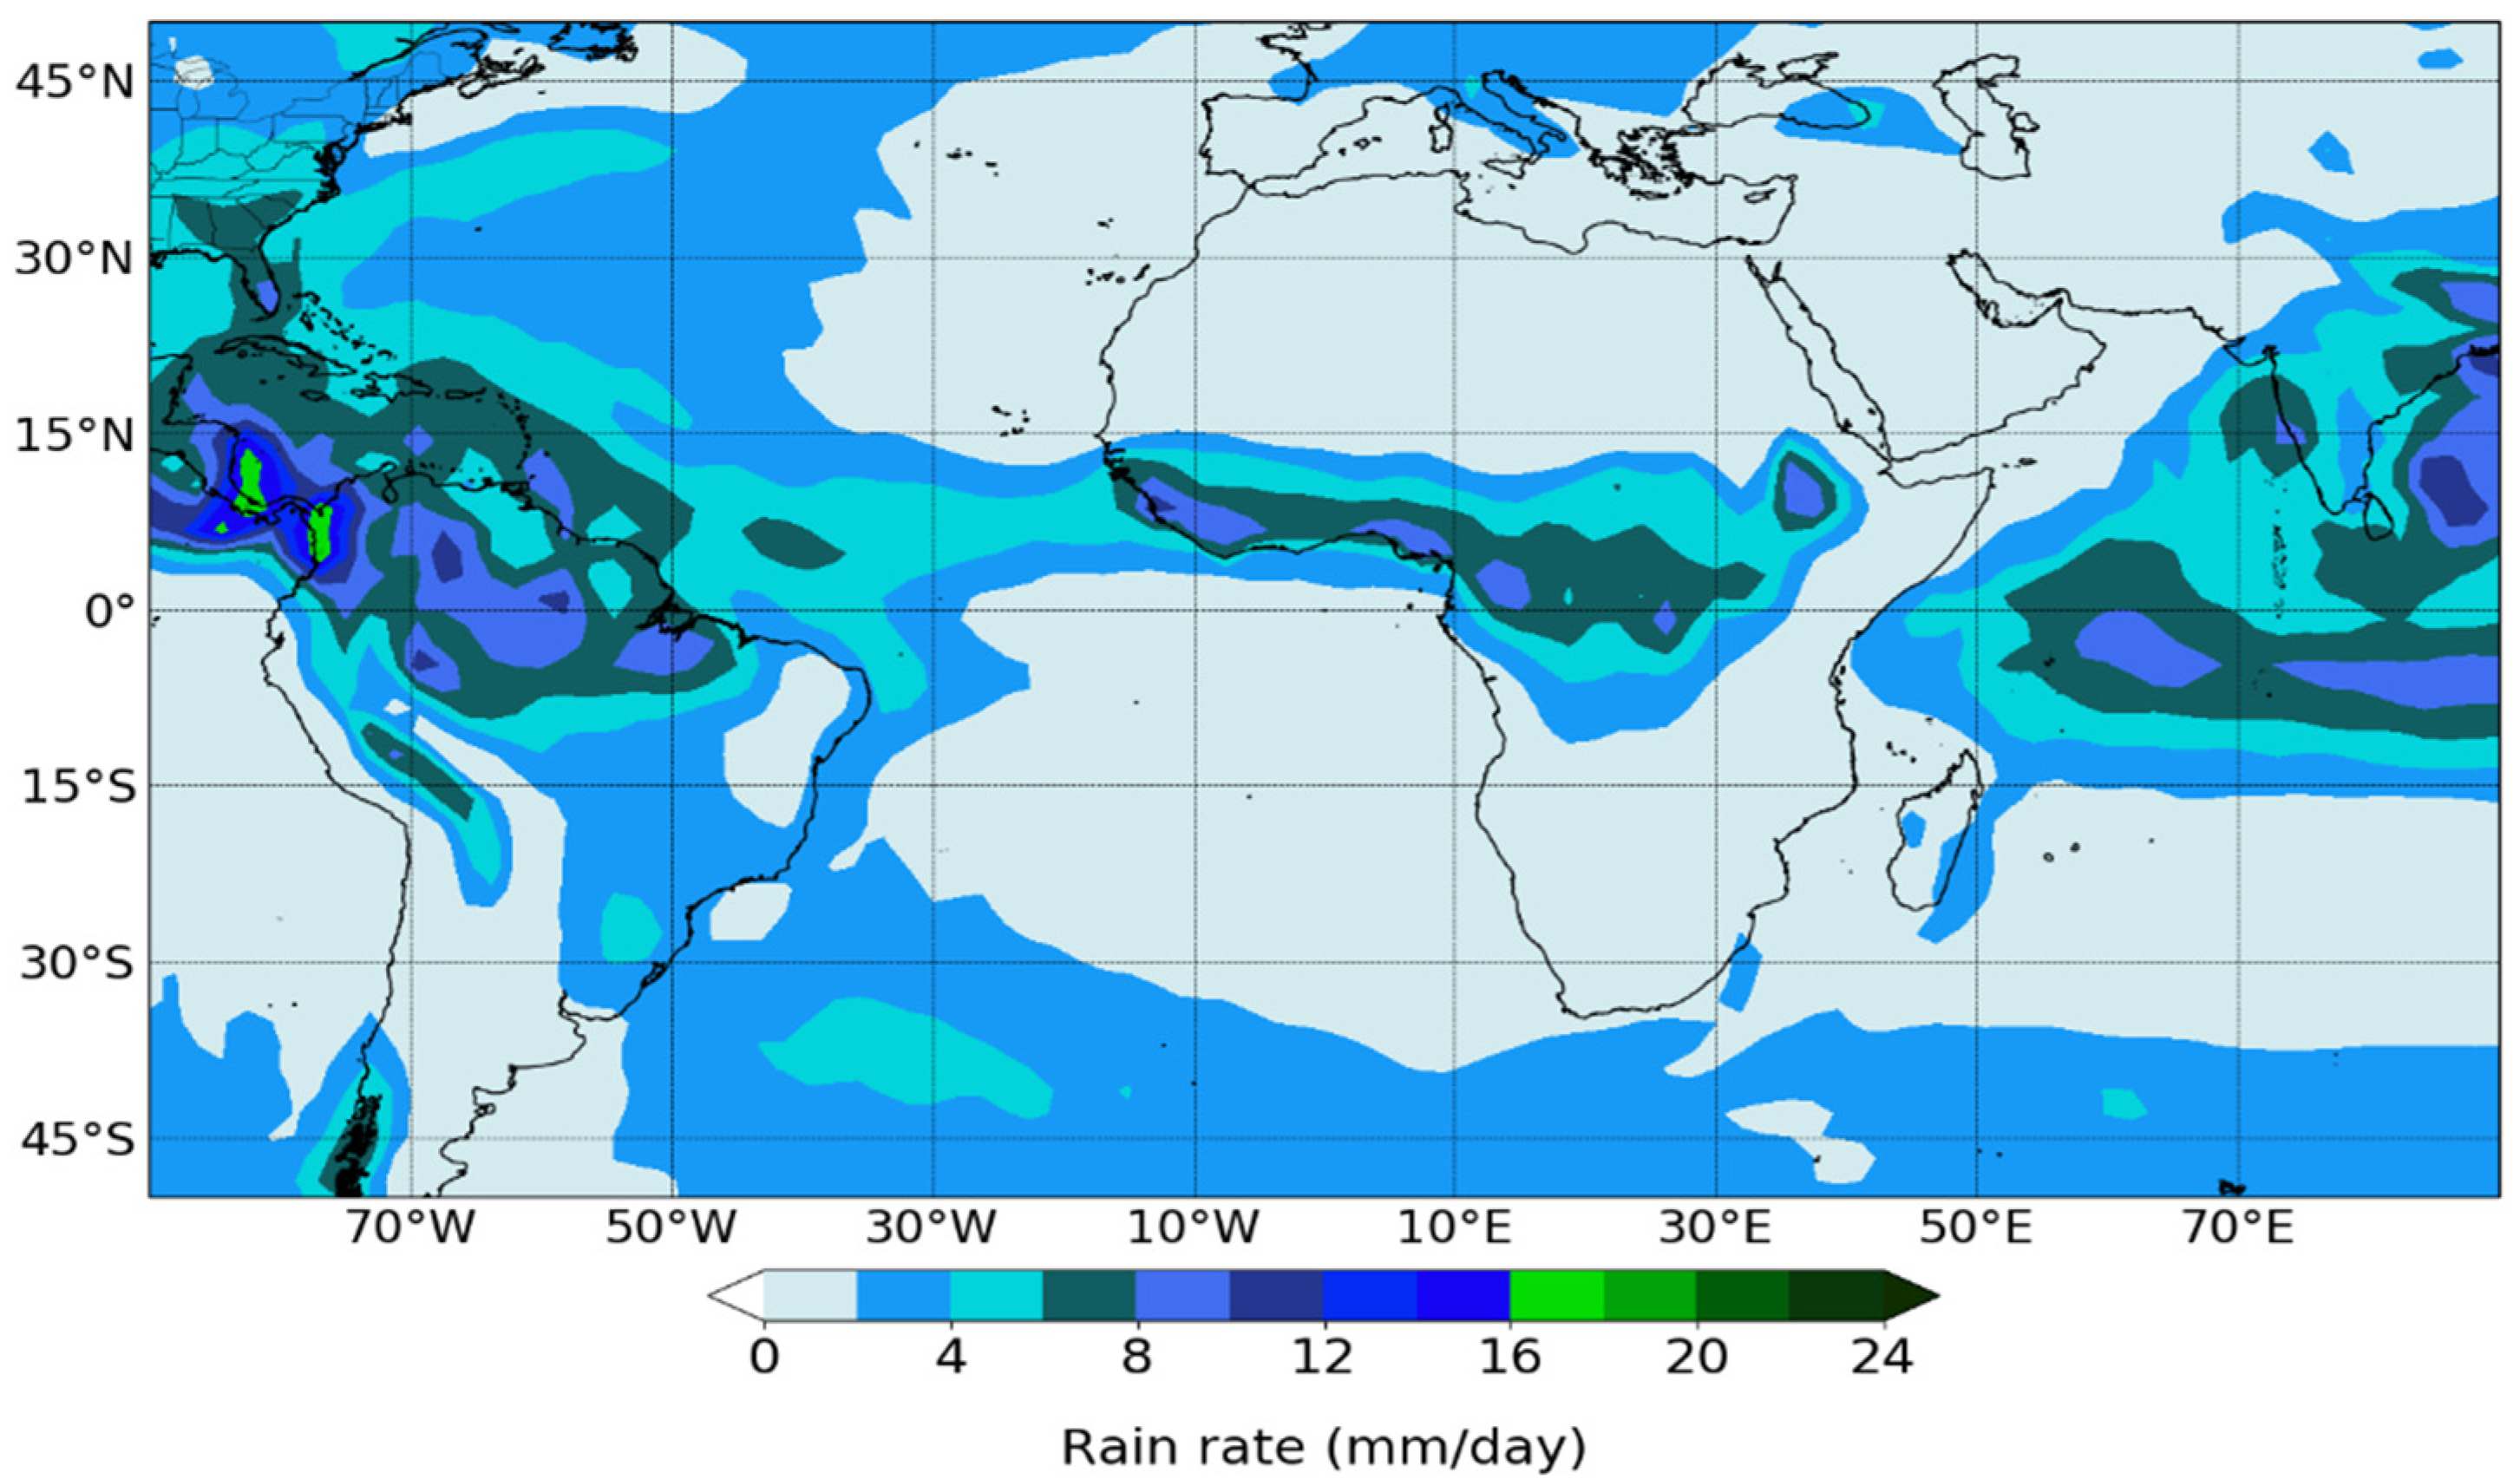
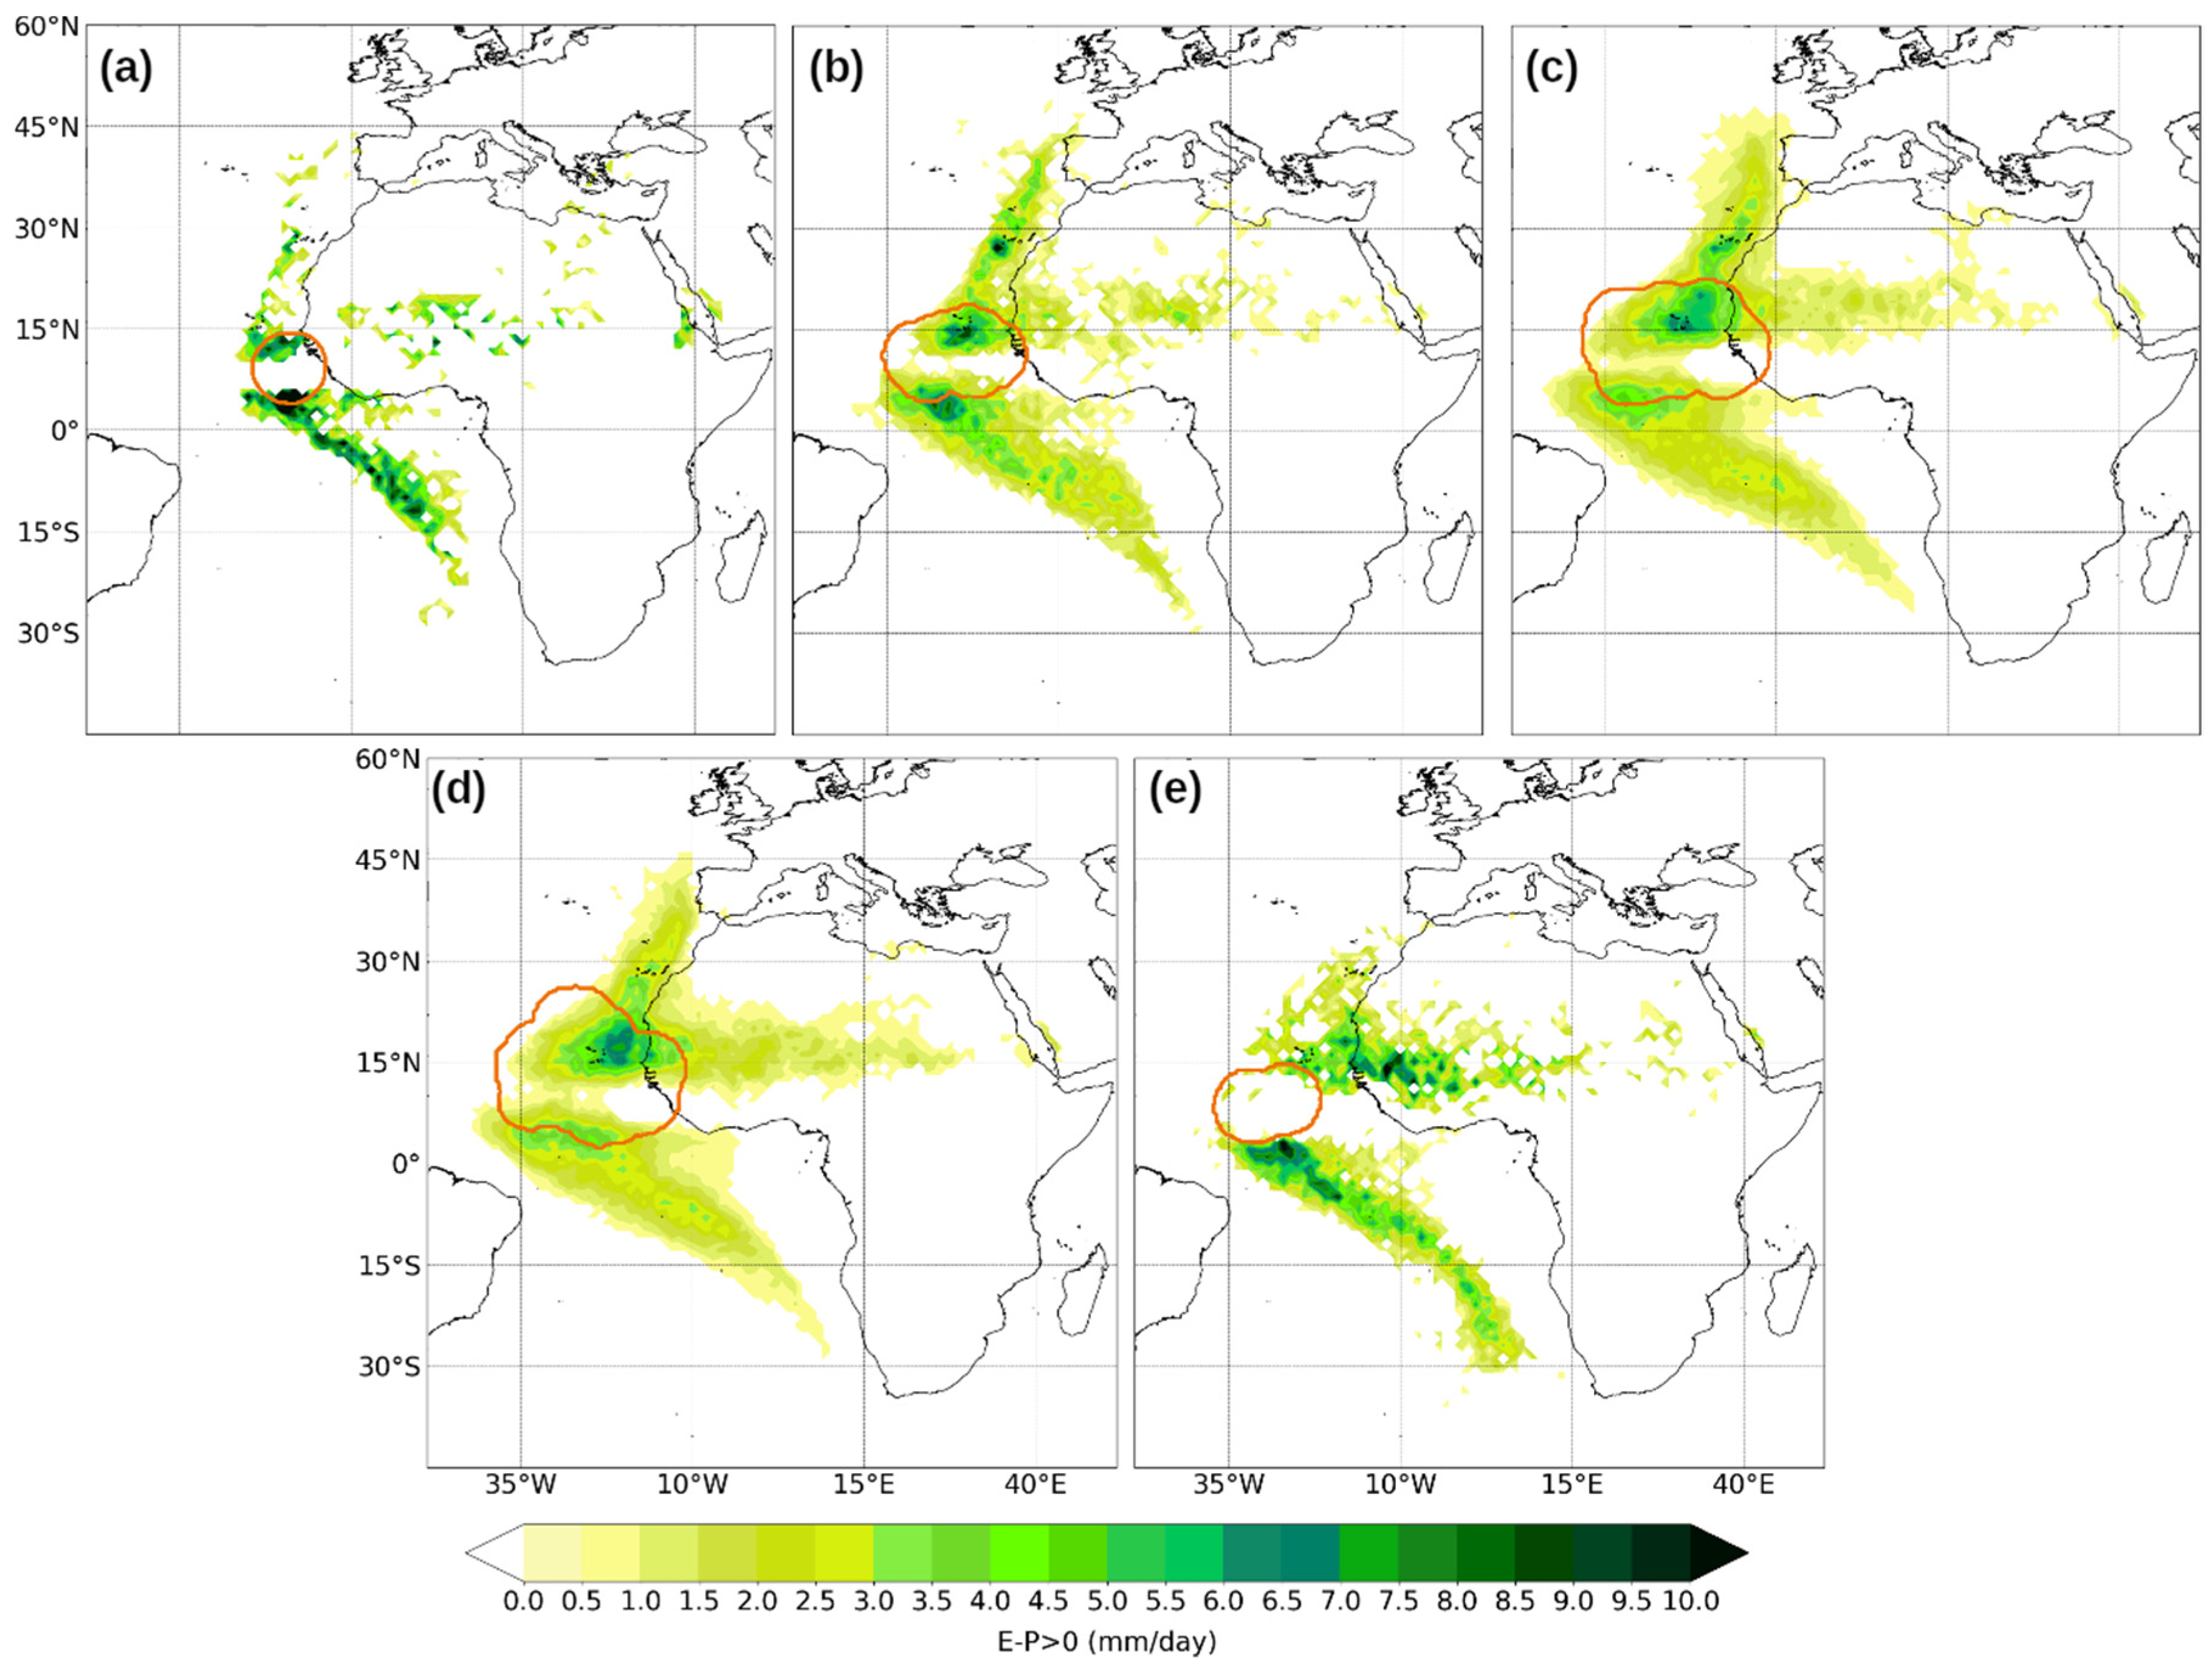
3.2. Moisture Transport

Figure 4a shows the relative frequency of the area delimited by the outer radius of each TC formed within the red box shown in Figure 1, and the orange line boundary represents frequency pattern. As can be seen, the highest number of geneses occurred around 12° N in latitude. Individual target regions delimited by the outer radius of each TC were utilized to compute the average pattern of (EP) > 0, which is shown in Figure 4b. This figure shows the climatological pattern of moisture uptake associated with the genesis of TCs in the study region. The South Atlantic from the vicinity of the Gulf of Guinea, the North Atlantic from the Iberian Peninsula and the Mediterranean Sea bordering the north coast of WA, and the tropical region of north WA and the Sahel are sources of moisture that provide the necessary water vapor to initiate the convective activity in our study region, which, combined with the other preconditions described by Gray [6], can lead to the TC genesis, as shown in Figure 4b. The spatial configuration of the (EP) > 0 pattern suggests a north–south division caused by the ITCZ. This pattern is similar to that obtained by Pazos and Gimeno [19]. Furthermore, these results are in agreement with Lélé et al. [22] and Meynadier et al. [41], who pointed out that WA is a moisture source rather than a sink during the summer season.
The average patterns of (EP) > 0 computed for composites of TCs formed during each month from June to October in the period 1980–2018, are shown in Figure 5, since no TC was formed in the study region in November. A visual analysis allows us to conclude that the extension of the patterns may be related to the number of systems per month. The moisture uptake associated with the genesis of TCs formed in June occurred mainly from the North Atlantic Ocean along the coast of WA and the tropical east South Atlantic Ocean (Figure 5a). Over the African continent, it is just observed in small areas with (EP) > 0. In July, August, and September, the patterns of (EP) > 0 are quite similar (Figure 5b–d). Compared to June, in these months, the (EP) > 0 patterns are more extended over the North and South Atlantic Ocean and through WA and the Sahel. In these months, the moisture uptake occurred even from high latitudes near the Iberian Peninsula through the west coast of northern Africa and from the South Atlantic Ocean up to 30° S.
In August and September, a large number of TCs formed in the tropical eastern North Atlantic Ocean, near WA (Figure 2). In these months, the spatial pattern of (EP) > 0 reveals an increase of moisture uptake from WA and the Sahel (Figure 5c,d) compared to that obtained for TCs formed in July. However, in both August and September, WA becomes an important moisture sink associated with the WAM [41,42]. In the dynamics and variability of the WAM, the transport of water vapor plays an important role [22]. During the WAM peak in August, moisture transport towards the south-west from the Gulf of Guinea weakens while the trade winds over the west coast intensify and feed the Sahel region with considerable water vapor, as was previously demonstrated by Lélé et al. [22]. The content of humidity increased, and the wind patterns favored an interhemispheric moisture transport (south–north) along the tropical eastern Atlantic Ocean.
In October, the spatial extension of the (EP) > 0 pattern is less than that obtained for the previous 3 months (Figure 5e), particularly from the North Atlantic Ocean. However, the magnitude of the moisture uptake is higher over WA. This confirms previous findings (e.g., [42,43]) that showed the important role of evapotranspiration, recycling, and the westward moisture transport in the lower troposphere by the AEJ, which are factors that favor the cyclogenesis over the Atlantic Ocean near WA. In this month, the moisture transport towards the area associated with the genesis of TCs also occurred from the tropical east North Atlantic Ocean around 15° N. However, an intense band of moisture uptake is observed from 5° N to 30° S, which is clearly modulated by the South Atlantic Subtropical High circulation.

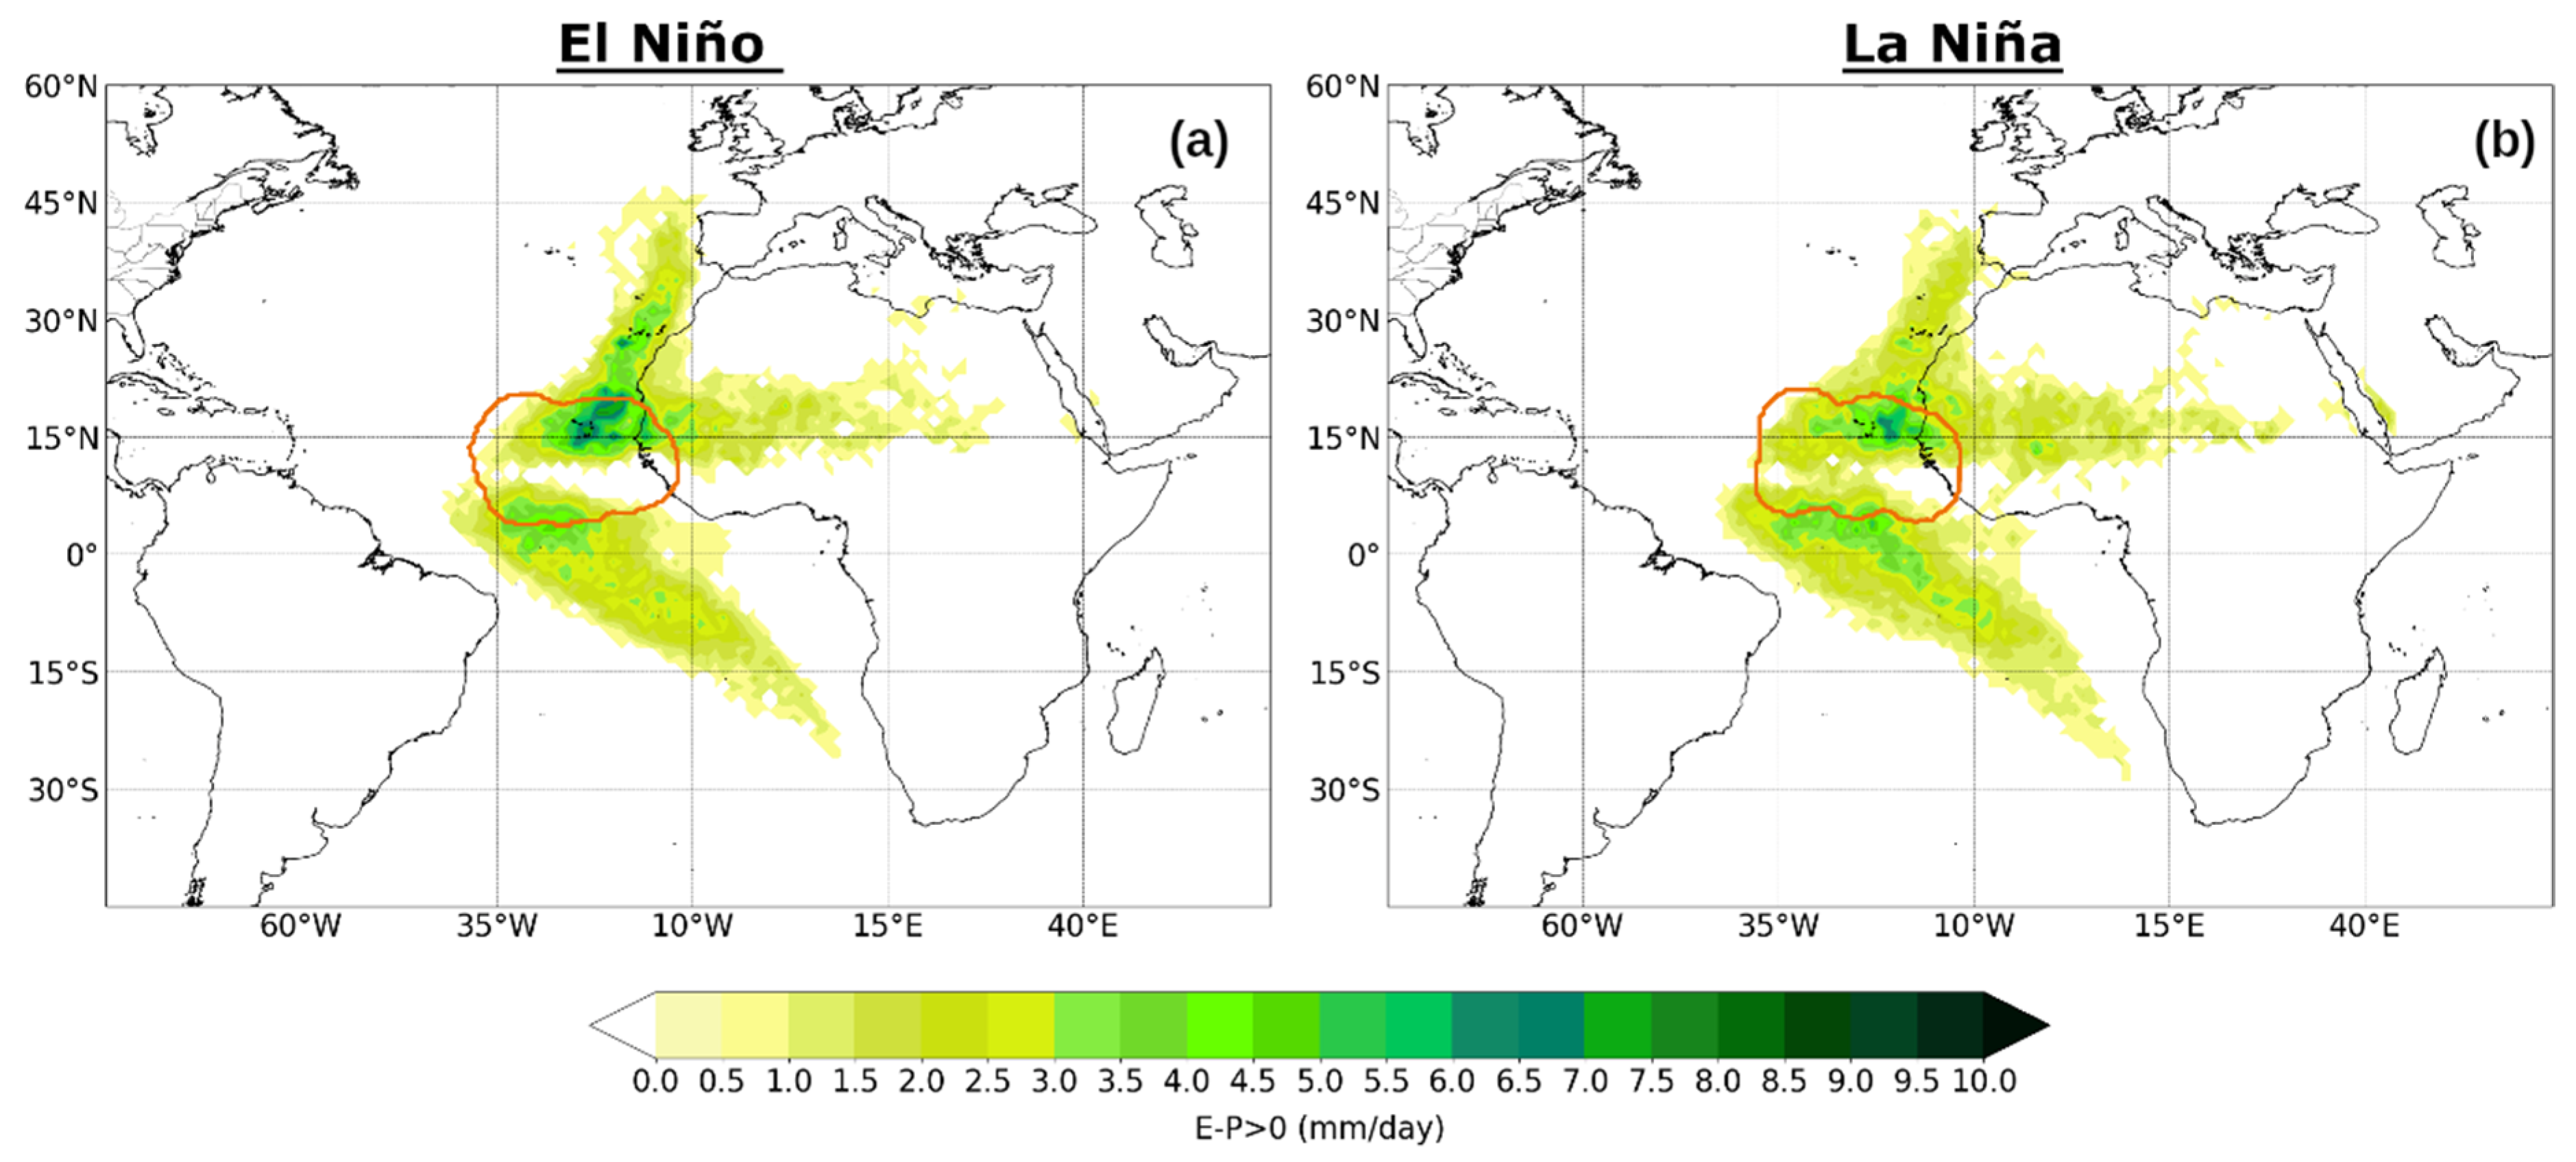
3.3. Identification of Moisture Sources during the Warm and Cold Phases of the ENSO Phenomenon

In this section, we address the possible influence of the main mode of climate variability on the genesis of TCs near the WA coast, through atmospheric moisture transport. The positive ENSO phase is characterized by positive SST anomalies over the tropical east Pacific, positive SST anomalies over the extratropical Atlantic, and negative anomalies across the tropical Atlantic and Caribbean, which contribute to unfavorable conditions for the TC genesis, while an opposite pattern is observed in the negative phase [44]. Indeed, under the influence of La Niña, the greatest number of TCs were formed in the hurricane season of 2010 (six TCs). Nevertheless, according to the BEST index during the period of study, 24 TCs were formed under the influence of El Niño and 20 under La Niña within the target region delimited by a red box in Figure 2. For composites of TCs formed under each phase, the (EP) > 0 was computed in a backward analysis from the genesis region. The results shown in Figure 6 reveal that the geographical extension of the outer radios for TCs formed under each phase is very similar. Likewise, the location of the spatial pattern of (EP) > 0 obtained for each composite is very similar. However, during the El Niño, the moisture uptake is more intense over the Atlantic Ocean close to WA around 15°N latitude (Figure 6a), while during La Niña, the pattern is slightly weaker, but it covers a wide area over the Atlantic Ocean and the north of Africa (Figure 6b).

4. Conclusions

During the period 1980–2018, 108 TCs formed in the region near the coast of WA, with a major frequency in August and September, each one representing approximately 45% of the total TC geneses. The Lagrangian method utilized allowed us to determine the main sources of moisture associated with the geneses of these TCs. The results showed that air masses uptake humidity from the east of the North and South Atlantic Ocean, WA, and the Sahel before reaching the region of the genesis, providing the necessary water vapor to initiate the convective activity. The results confirmed that moisture transport from the southern hemisphere also plays a crucial role in the formation of TCs in the NATL basin. A monthly analysis for each month of the hurricane season revealed a similar spatial configuration of the pattern of moisture uptake, but differences in the extension and magnitude. A composite analysis of TCs formed during El Niño and La Niña revealed great similarity in the spatial location of the regions acting as moisture sources, but the difference between both patterns of moisture uptake showed that under El Niño, the TCs formed near WA received more humidity from the North Atlantic Ocean above ~10° N than those formed under La Niña; while for the geneses of TCs during La Niña, the pattern of moisture uptake was greater but less intense. Currently, work is being done on the delimitation of sources to quantify the moisture uptake from oceanic and terrestrial sources individually, as well as to differentiate the role of moisture transport from the South Atlantic and the influence of other modes of climate variability in the genesis of TCs throughout the NATL basin.

Author Contributions

A.P.-A., R.S., R.N. and L.G. conceived the idea of the study. A.P.-A., J.C.F.-A. and R.S. processed the data and made the figures. A.P.-A. analyzed the results and wrote the manuscript. All authors have read and agreed to the published version of the manuscript.

Funding

The LAGRIMA project (grant no. RTI2018-095772-B-I00) funded by the Ministerio de Ciencia, Innovación y Universidades, Spain. Partial support was also obtained from the Xunta de Galicia under the project “Programa de Consolidación e Estructuración de Unidades de Investigación Competitivas (Grupos de Referencia Competitiva)” (no. ED431C 2017/64-GRC).

Institutional Review Board Statement

Not applicable.

Informed Consent Statement

Not applicable.

Data Availability Statement

Several data sources were used in this study: HURDAT2 database from https://www.nhc.noaa.gov/data/#hurdat (Accessed on 14 July 2020); the AMO (Atlantic Multidecadal Oscillation) Index from https://www.psl.noaa.gov/data/timeseries/AMO/ (Accessed on 19 July 2020) and the Bivariate ENSO Timeseries from https://psl.noaa.gov/people/cathy.smith/best/ (Accessed on 21 July 2020).

Acknowledgments

The authors acknowledge NHC for freely providing the HURDAT2 database and the NCEP-NCAR Reanalysis. A.P-A acknowledges the PhD fellowship from the University of Vigo. J.C.F-A and R.S acknowledge the support from the Xunta de Galicia (Galician Regional Government) under the grants no. ED481A-2020/193 and ED481B 2019/070, respectively.

Conflicts of Interest

The authors declare no conflict of interest.

References

  1. Ankur, K.; Busireddy, N.K.R.; Osuri, K.K.; Niyogi, D. On the relationship between intensity changes and rainfall distribution in tropical cyclones over the North Indian Ocean. Int. J. Climatol. 2020, 40, 2015–2025. [Google Scholar] [CrossRef]
  2. Ren, J.; Zhang, J.A.; Vigh, J.L.; Zhu, P.; Liu, H.; Wang, X.; Wadler, J.B. An Observational Study of the Symmetric Boundary Layer Structure and Tropical Cyclone Intensity. Atmosphere 2020, 11, 158. [Google Scholar] [CrossRef]
  3. DeMaria, M.; Knaff, J.A.; Connell, B.H. A Tropical Cyclone Genesis Parameter for the Tropical Atlantic. Wea. Forecast. 2001, 16, 219–233. [Google Scholar] [CrossRef]
  4. Palmen, E. On the formation and structure of tropical cyclones. Geophysics 1948, 3, 26–38. [Google Scholar]
  5. Riehl, H. On the formation of typhoons. J. Meteor. 1948, 5, 247–264. [Google Scholar] [CrossRef]
  6. Gray, W.M. Global view of the origin of tropical disturbances and storms. Mon. Wea. Rev. 1968, 96, 669–700. [Google Scholar] [CrossRef]
  7. Montgomery, M.T. Recent Advances in Tropical Cyclogenesis. In Advanced Numerical Modeling and Data Assimilation Techniques for Tropical Cyclone Prediction; Mohanty, U.C., Gopalakrishnan, S.G., Eds.; Springer: Dordrecht, The Netherlands, 2016. [Google Scholar] [CrossRef]
  8. McBride, J.L. Tropical cyclone formation. In Global Perspectives on Tropical Cyclones; WMO/TD No. 693, Rep. TCP-38; World Meteorological Organization: Geneva, Switzerland, 1995; pp. 63–105. [Google Scholar]
  9. Huang, H.L.; Yang, M.J.; Sui, C.H. Water budget and precipitation efficiency of Typhoon Morakot (2009). J. Atmos. Sci. 2014, 71, 112–129. [Google Scholar] [CrossRef]
  10. Makarieva, A.M.; Gorshkov, V.G.; Nefiodov, A.V.; Chikunov, A.V.; Sheil, D.; Donato Nobre, A.; Li, B.L. Fuel for cyclones: The water vapor budget of a hurricane as dependent on its movement. Atmos. Res. 2017, 193, 216–230. [Google Scholar] [CrossRef]
  11. Fujiwara, K.; Kawamura, R.; Hirata, H.; Kawano, T.; Kato, M.; Shinoda, T. A positive feedback process between tropical cyclone intensity and the moisture conveyor belt assessed with Lagrangian diagnostics. J. Geophys. Res. Atmos. 2017, 122, 12502–12521. [Google Scholar] [CrossRef]
  12. Yoshida, R.; Miyamoto, Y.; Tomita, H.; Kajikawa, Y. The effect of water vapor on tropical cyclone genesis: A numerical experiment of a non-developing disturbance observed in PALAU 2010. J. Meteor. Soc. Jpn. 2017, 95, 35–47. [Google Scholar] [CrossRef]
  13. Wu, L.; Su, H.; Fovell, R.G.; Dunkerton, T.J.; Wang, Z.; Kahn, B.H. Impact of environmental moisture on tropical cyclone intensification. Atmos. Chem. Phys. 2015, 15, 14041–14053. [Google Scholar] [CrossRef]
  14. Bosilovich, M.G.; Schubert, S.D. Water vapor tracers as diagnostics of the regional hydrologic cycle. J. Hydrometeorol. 2002, 3, 149–165. [Google Scholar] [CrossRef]
  15. van der Ent, R.J.; Savenije, H.H.G.; Schaefli, B.; SteeleDunne, S.C. Origin and fate of atmospheric moisture over continents. Water Resour. Res. 2010, 46, W09525. [Google Scholar] [CrossRef]
  16. de Leeuw, J.; Methven, J.; Blackburn, M. Physical factors influencing regional precipitation variability attributed using an airmass trajectory method. J. Clim. 2017, 30, 7359–7378. [Google Scholar] [CrossRef]
  17. Guo, L.; Klingaman, N.P.; Demory, M.-E.; Vidale, P.L.; Turner, A.G.; Stephan, C.C. The contributions of local and remote atmospheric moisture fluxes to East Asian precipitation and its variability. Clim. Dyn. 2018, 51, 4139–4156. [Google Scholar] [CrossRef]
  18. Neumann, C.J. Global climatology. In Global Guide to Tropical Cyclone Forecasting; WMO/TD No. 560, Rep. TCP-31; World Meteorological Organization: Geneva, Switzerland, 1993; p. 1. [Google Scholar]
  19. Pazos, M.; Gimeno, L. Identification of moisture sources in the Atlantic Ocean for cyclogenesis processes. In Proceedings of the 1st International Electronic Conference on Hydrological Cycle (ChyCle-2017), MDPI Sciforum Electronic Conference Series, Basel, Switzerland, 12–16 November 2017; Volume 1. [Google Scholar]
  20. Redelsperger, J.L.; Diongue, A.; Diedhiou, A.; Ceron, J.P.; Diop, M.; Gueremy, J.F.; Lafore, J.P. Multiscale description of a Sahelian synoptic weather system representative of the West African monsoon. Quart. J. R. Meteor. Soc. 2002, 128, 1229–1257. [Google Scholar] [CrossRef]
  21. Redelsperger, J.L.; Thorncroft, C.D.; Diedhiou, A.; Lebel, T.; Parker, D.J.; Polcher, J. African monsoon multidisciplinary analysis: An international research project and field campaign. Bull. Amer. Meteor. Soc. 2006, 87, 1739–1746. [Google Scholar] [CrossRef]
  22. Lélé, M.I.; Leslie, L.M.; Lamb, P.J. Analysis of Low-Level Atmospheric Moisture Transport Associated with the West African Monsoon. J. Clim. 2015, 28, 4414–4430. [Google Scholar] [CrossRef]
  23. Landsea, C.W.; Franklin, J.L. Atlantic Hurricane Database Uncertainty and Presentation of a New Database Format. Mon. Wea. Rev. 2013, 141, 3576–3592. [Google Scholar] [CrossRef]
  24. Stohl, A.; Forster, C.; Frank, A.; Seibert, P.; Wotawa, G. Technical Note: The Lagrangian particle dispersion model FLEXPART version 6.2. Atmos. Chem. Phys. 2005, 5, 2461–2474. [Google Scholar] [CrossRef]
  25. Dee, D.P.; Uppala, S.M.; Simmons, A.J.; Berrisford, P.; Poli, P.; Kobayashi, S.; Andrae, U.; Balmaseda, M.A.; Balsamo, G.; Bauer, P.; et al. The ERA-Interim reanalysis: Configuration and performance of the data assimilation system. Q. J. R. Meteorol. Soc. 2011, 137, 553–597. [Google Scholar] [CrossRef]
  26. Pérez-Alarcón, A.; Fernández-Alvarez, J.C.; Sorí, R.; Nieto, R.; Gimeno, L. Dataset of outer tropical cyclone size from a radial wind profile. Data Brief. 2020. under review. [Google Scholar] [CrossRef] [PubMed]
  27. Pérez-Alarcón, A.; Fernández-Alvarez, J.C.; Sorí, R.; Nieto, R.; Gimeno, L. Comparative climatology of outer tropical cyclone size using radial wind profiles. Atmos. Res. 2020. under review. [Google Scholar] [CrossRef]
  28. Kalnay, E.; Kanamitsu, M.; Kistler, R.; Collins, W.; Deaven, D.; Gandin, L.; Iredell, M.; Saha, S.; White, G.; Woollen, J.; et al. The NCEP/NCAR 40-Year Reanalysis Project. Bull. Amer. Meteor. Soc. 1996, 77, 437–472. [Google Scholar] [CrossRef]
  29. Hirahara, S.; Ishii, M.; Fukuda, Y. Centennial-scale sea surface temperature analysis and its uncertainty. J. Clim. 2014, 27, 57–75. [Google Scholar] [CrossRef]
  30. Enfield, D.B.; Mestas-Nunez, A.M.; Trimble, P.J. The Atlantic Multidecadal Oscillation and its relationship to rainfall and river flows in the continental U.S. Geophys. Res. Lett. 2001, 28, 2077–2080. [Google Scholar] [CrossRef]
  31. Smith, C.A.; Sardeshmukh, P. The Effect of ENSO on the Intraseasonal Variance of Surface Temperature in Winter. Int. J. Climatol. 2000, 20, 1543–1557. [Google Scholar] [CrossRef]
  32. MacQueen, J. Some methods for classification and analysis of multivariate observations. In Proceedings of the Fifth Berkeley Symposium on Mathematical Statistics and Probability, Berkeley, CA, USA, 27 December 1965–7 January 1966; pp. 281–297. [Google Scholar]
  33. Corporal-Lodangco, I.; Richman, M.B.; Leslie, L.M.; Lamb, P.J. Cluster Analysis of North Atlantic Tropical Cyclones. Procedia Comput. Sci. 2014, 36, 293–300. [Google Scholar] [CrossRef]
  34. Jakobson, E.; Vihma, T. Atmospheric moisture budget in the Arctic based on the ERA-40 reanalysis. Int. J. Climatol. 2010, 30, 2175–2194. [Google Scholar] [CrossRef]
  35. Gimeno, L.; Stohl, A.; Trigo, R.M.; Dominguez, F.; Yoshimura, K.; Yu, L.; Drumond, A.; Durán-Quesada, A.M.; Nieto, R. Oceanic and terrestrial sources of continental precipitation. Rev. Geophys. 2012, 50, RG4003. [Google Scholar] [CrossRef]
  36. Stohl, A.; James, P. A Lagrangian Analysis of the Atmospheric Branch of the Global Water Cycle. Part I: Method Description, Validation, and Demonstration for the August 2002 Flooding in Central Europe. J. Hydrometeor. 2004, 5, 656–678. [Google Scholar] [CrossRef]
  37. Numaguti, A. Origin and recycling processes of precipitating water over the Eurasian continent: Experiments using an atmospheric general circulation model. J. Geophys. Res. 1999, 104, 1957–1972. [Google Scholar] [CrossRef]
  38. Stohl, A.; James, P. A Lagrangian analysis of the atmospheric branch of the global water cycle. Part II: Moisture transports between the Earth’s ocean basins and river catchments. J. Hydrometeorol. 2005, 6, 961–984. [Google Scholar] [CrossRef]
  39. Gray, V.M.; Landsea, C.W. African Rainfall as a Precursor of Hurricane-Related Destruction on the U.S. East Coast. Bull. Am. Meteorol. Soc. 1992, 73, 1352–1364. [Google Scholar] [CrossRef]
  40. Wang, S.-Y.; Gillies, R.R. 40. Wang, S-Y.; Gillies, R.R. Observed Change in Sahel Rainfall, Circulations, African Easterly Waves, and Atlantic Hurricanes Since 1979. Int. J. Geophys. 2011, 2011, 259529. [Google Scholar] [CrossRef]
  41. Meynadier, R.; Bock, O.; Guichard, F.; Boone, A.; Roucou, P.; Redelsperger, J.-L. West African monsoon water cycle: 1. A hybrid water budget dataset. J. Geophys. Res. 2010, 115, D19106. [Google Scholar] [CrossRef]
  42. Niang, C.; Mancho, A.M.; García-Garrido, V.J.; Mohino, E.; Rodriguez-Fonseca, B.; Curbelo, J. Transport pathways across the West African Monsoon as revealed by Lagrangian Coherent Structures. Sci. Rep. 2020, 10, 12543. [Google Scholar] [CrossRef]
  43. Dieng, A.L.; Sall, S.M.; Eymard, L.; Leduc-Leballeur, M.; Lazar, A. Trains of African Easterly Waves and Their Relationship to Tropical Cyclone Genesis in the Eastern Atlantic. Mon. Wea. Rev. 2017, 145, 599–616. [Google Scholar] [CrossRef]
  44. Deser, C.; Alexander, M.A.; Xie, S.-P.; Phillips, A.S. Sea surface temperature variability: Patterns and mechanisms. Annu. Rev. Mar. Sci. 2010, 2, 115–143. [Google Scholar] [CrossRef]
Figure 1. Colored dots represent the tropical cyclone (TC) geneses clustered according to the K-means method. The region bounded by the red dashed lines (6° N–22° N of latitude and 15° W–34° W of longitude) corresponds to the target region. Period 1980–2018.
Environsciproc 04 00003 g001
Figure 2. Number of TCs per month formed within the region delimited by the red box shown in Figure 1 during the period 1980–2018.
Environsciproc 04 00003 g002
Figure 3. Climatological precipitation rate for the cyclonic season (June- November) from the National Center for Environmental Prediction—National Center for Atmospheric Research (NCEP-NCAR) reanalysis. Period 1981–2010.
Environsciproc 04 00003 g003
Figure 4. (a) Relative frequency of the outer radius of each TC formed from June to November in the period 1980–2018 within the red box illustrated in Figure 1. The orange line is the boundary of the frequency pattern; (b) Climatological pattern of (EP) > 0 integrated from 1 to 10 days backward in time computed from individual target regions within the frequency pattern a). Period of study 1980–2018.
Environsciproc 04 00003 g004
Figure 5. The climatological pattern of (EP) > 0 obtained in a backward experiment from the outer radio of TCs formed in the study region during (a) June, (b) July, (c) August, (d) September, (e) and October. The orange line delimits the relative frequency of the outer radius of each TC. Note that no TC geneses occurred in November. Period 1980–2018.
Environsciproc 04 00003 g005
Figure 6. Climatological moisture uptake obtained in a backward experiment from the outer radio of TCs formed within the study area during (a) El Niño and (b) La Niña.
Environsciproc 04 00003 g006
Publisher’s Note: MDPI stays neutral with regard to jurisdictional claims in published maps and institutional affiliations.

