Proceeding Paper

Synergy of CALIOP and Ground-Based Solar Radiometer Data to Study Statistical Characteristics of Aerosols in Regions with a Low Aerosol Load †

1
Institute of Physics of the NAS of Belarus, 220072 Minsk, Belarus
2
Laboratoire d’Optique Atmosphérique, Département de Physique, Université de Lille, 59655 Villeneuve d’Ascq, France
3
State Environment Protection Key Laboratory of Satellite Remote Sensing, Aerospace Information Research Institute, Chinese Academy of Sciences, Beijing 100101, China
*
Author to whom correspondence should be addressed.
Presented at the 5th International Electronic Conference on Remote Sensing, 7–21 November 2023; Available online: https://ecrs2023.sciforum.net/.
Environ. Sci. Proc. 2024, 29(1), 70; https://doi.org/10.3390/ECRS2023-16860
Published: 6 June 2024
(This article belongs to the Proceedings of ECRS 2023)

Abstract

:
The statistical characteristics of combined lidar and radiometric measurements obtained from satellite lidar CALIOP and ground-based sun-radiometer stations were used as input datasets to retrieve the altitude profiles of aerosol parameters (LRS-C technique). The signal-to-noise ratio of the input satellite lidar signals increased when averaging over a large array of measured data. An algorithm and software package for processing the input dataset of the LRS-C sounding of atmospheric aerosol in regions with medium and low aerosol loads was developed. This paper presents the results of studying long-term changes in the concentration profiles of aerosol modes in regions of East Europe (AERONET site Minsk, 53.92° N, 27.60° E) and East Antarctic (AERONET site Vechernaya Hill, 67.66° S, 46.16° E).

1. Introduction

A method of combined lidar and radiometer atmospheric aerosol sounding through the application of CALIOP [1] lidar data measured in an area of radiometric stations (LRS-C technique) is proposed and developed in [2,3,4]. In comparison with aerosol sounding using ground-based integrated lidar and radiometric stations (LRS method) [5], the application of the LRS-C technique provides an increased number of potential measuring sites, up to 500 all over the planet, except for polar regions with a latitude greater than 80°, at which observations are not available due to the inclination of the CALIOP orbit plane, which is equal to 98.2°.
The LRS-C technique can be applied to studying large-scale aerosol changes over areas with ground-based sun radiometer stations that supplement or replace the data of stationary lidar systems. However, the main advantage of the LRS-C method is that it can be applied for the comprehensive analysis of large datasets obtained from regular radiometric measurements by the AERONET [6] and SONET [7] stations, and from CALIOP lidar sounding. The satellite lidar CALIOP was launched in June 2006.
Special algorithms and software are needed to work with large experimental datasets. Processing LRS-C data is sequentially performed through two relatively independent procedures—collection and statistical processing of LRS-C datasets; and retrieving mean values of aerosol parameters from the statistical characteristics of lidar and radiometric measured data.
The first procedure is easily performed using specialized programs. The number of calculations at the second stage of processing is limited to a list of statistical parameters that are required to characterize the process under study and only slightly depends on the amount of initial experimental data. So, the statistical version of the LRS-C technique is optimal for processing large radiometric and lidar datasets when a region with a large number of radiometric stations is studied.
The lidar part of the input data at the stage of solving the ill-posed inverse problem is presented by an ensemble-averaged lidar signal. The signal-to-noise ratio of the averaged lidar signals is much higher than the corresponding values for individual measurements. As a result, the statistical variant of the LRS-C technique can be used to study aerosol layers with an extremely low aerosol load, like in Antarctic and mountain regions.

2. Method and Processing Procedure

2.1. Idea of the Method

The idea behind the statistical variant of the LRS-C technique is to use the statistical characteristics of lidar and radiometric sounding datasets as input information for calculating the statistical characteristics of aerosol parameters. It was necessary to make changes to the LRS-C data processing algorithm, LIRIC-2 [2], the main of which were as follows:
adding statistical characteristics of aerosol particles to the aerosol optical model;
defining the equations of relation between the statistical characteristics of input datasets and the parameters of the aerosol optical model;
correcting the algorithms for the final stage of LRS-C data processing, i.e., determination of the target parameters of the aerosol model, which minimize the differences between the measured and calculated statistical characteristics of the input datasets.
The lidar equation that determines the relationship between the lidar signal and the parameters of the aerosol optical model is a linear form applied to the aerosol optical parameters only for small values of the aerosol optical depth. Otherwise, the relation between the statistical characteristics of the lidar signal and the aerosol optical parameters should be determined by taking into account the probability density function (PDF) of the corresponding optical parameters. Similarly to [8], we used the normal PDF function to characterize aerosol optical parameters.

2.2. Statistical Ensemble of Input Data

The first step in the LRS-C data processing procedure is the collection of input statistical dataset. Certain requirements have been defined for the procedure of coordinated ground-based and satellite LRS-C measurements. For each radiometric station, a “measuring circle” with a radius ΔR of the order of 100–200 km is defined. The section of the CALIOP trajectory with length Δl, of which projection forms the chord of the circle, is the “measuring segment”. The lidar signals registered within this segment are summed up after the “cloud-screen” procedure and form an element of the input array of lidar data. The multiparameter method for identifying clouds and aerosol types along the CALIOP sounding path is described in [9]. The results are presented in the “Vertical Feature Mask Product” file, which is available in [10] along with a package of lidar data.
The trajectory of the CALIPSO satellite is sun-synchronous. The sounding of the atmosphere by the CALIOP lidar in the area of the radiometric station approximately occurs at the same Coordinated Universal Time (UTC).
The array of aerosol optical parameters calculated from radiometric measurements within the time window Δt = ±2 h from the satellite overpass time form an element of the input radiometric dataset.

3. Results

3.1. Temporal Aerosol Changes

The statistical variant of the LRS-C technique was used to study aerosol changes in the region of the AERONET site “Minsk”, 53.920° N, 27.601° E, between 2006 and 2023. The radius of measuring circle was 200 km. So, the “measuring circle” covered almost the entire territory of Belarus. The sun-synchronous orbit of the CALIPSO crosses the measuring circle approximately 90 times a year at 11:00 UTC.
The input statistical ensemble of lidar and sun-radiometer data includes day-time measured lidar signals at 11:00 UTC and radiometer data in the range 9:00–13:00 UTC.
A key stage of LRS-C data processing is the selection of an aerosol optical model of which parameters need to be retrieved. Two variants of the LRS-C data processing algorithm were tested. They differ in the initial aerosol model and sets of input data:
the AERONET two-mode aerosol model with fine (F) and coarse (C) aerosol modes; the ensemble of input data includes arrays of lidar signals at 532 and 1064 nm and column optical parameters of aerosol modes calculated from radiometric observations;
the more detailed three-mode aerosol model in which the coarse mode is divided into two submodes of coarse spherical (C1) and coarse non-spherical (C2) particles; the ensemble of input data is supplemented with rows of the depolarized lidar signals at 532 nm and column values of the “sphericity” (ratio of the column concentration of C1 particles to the column concentration of total coarse particles).
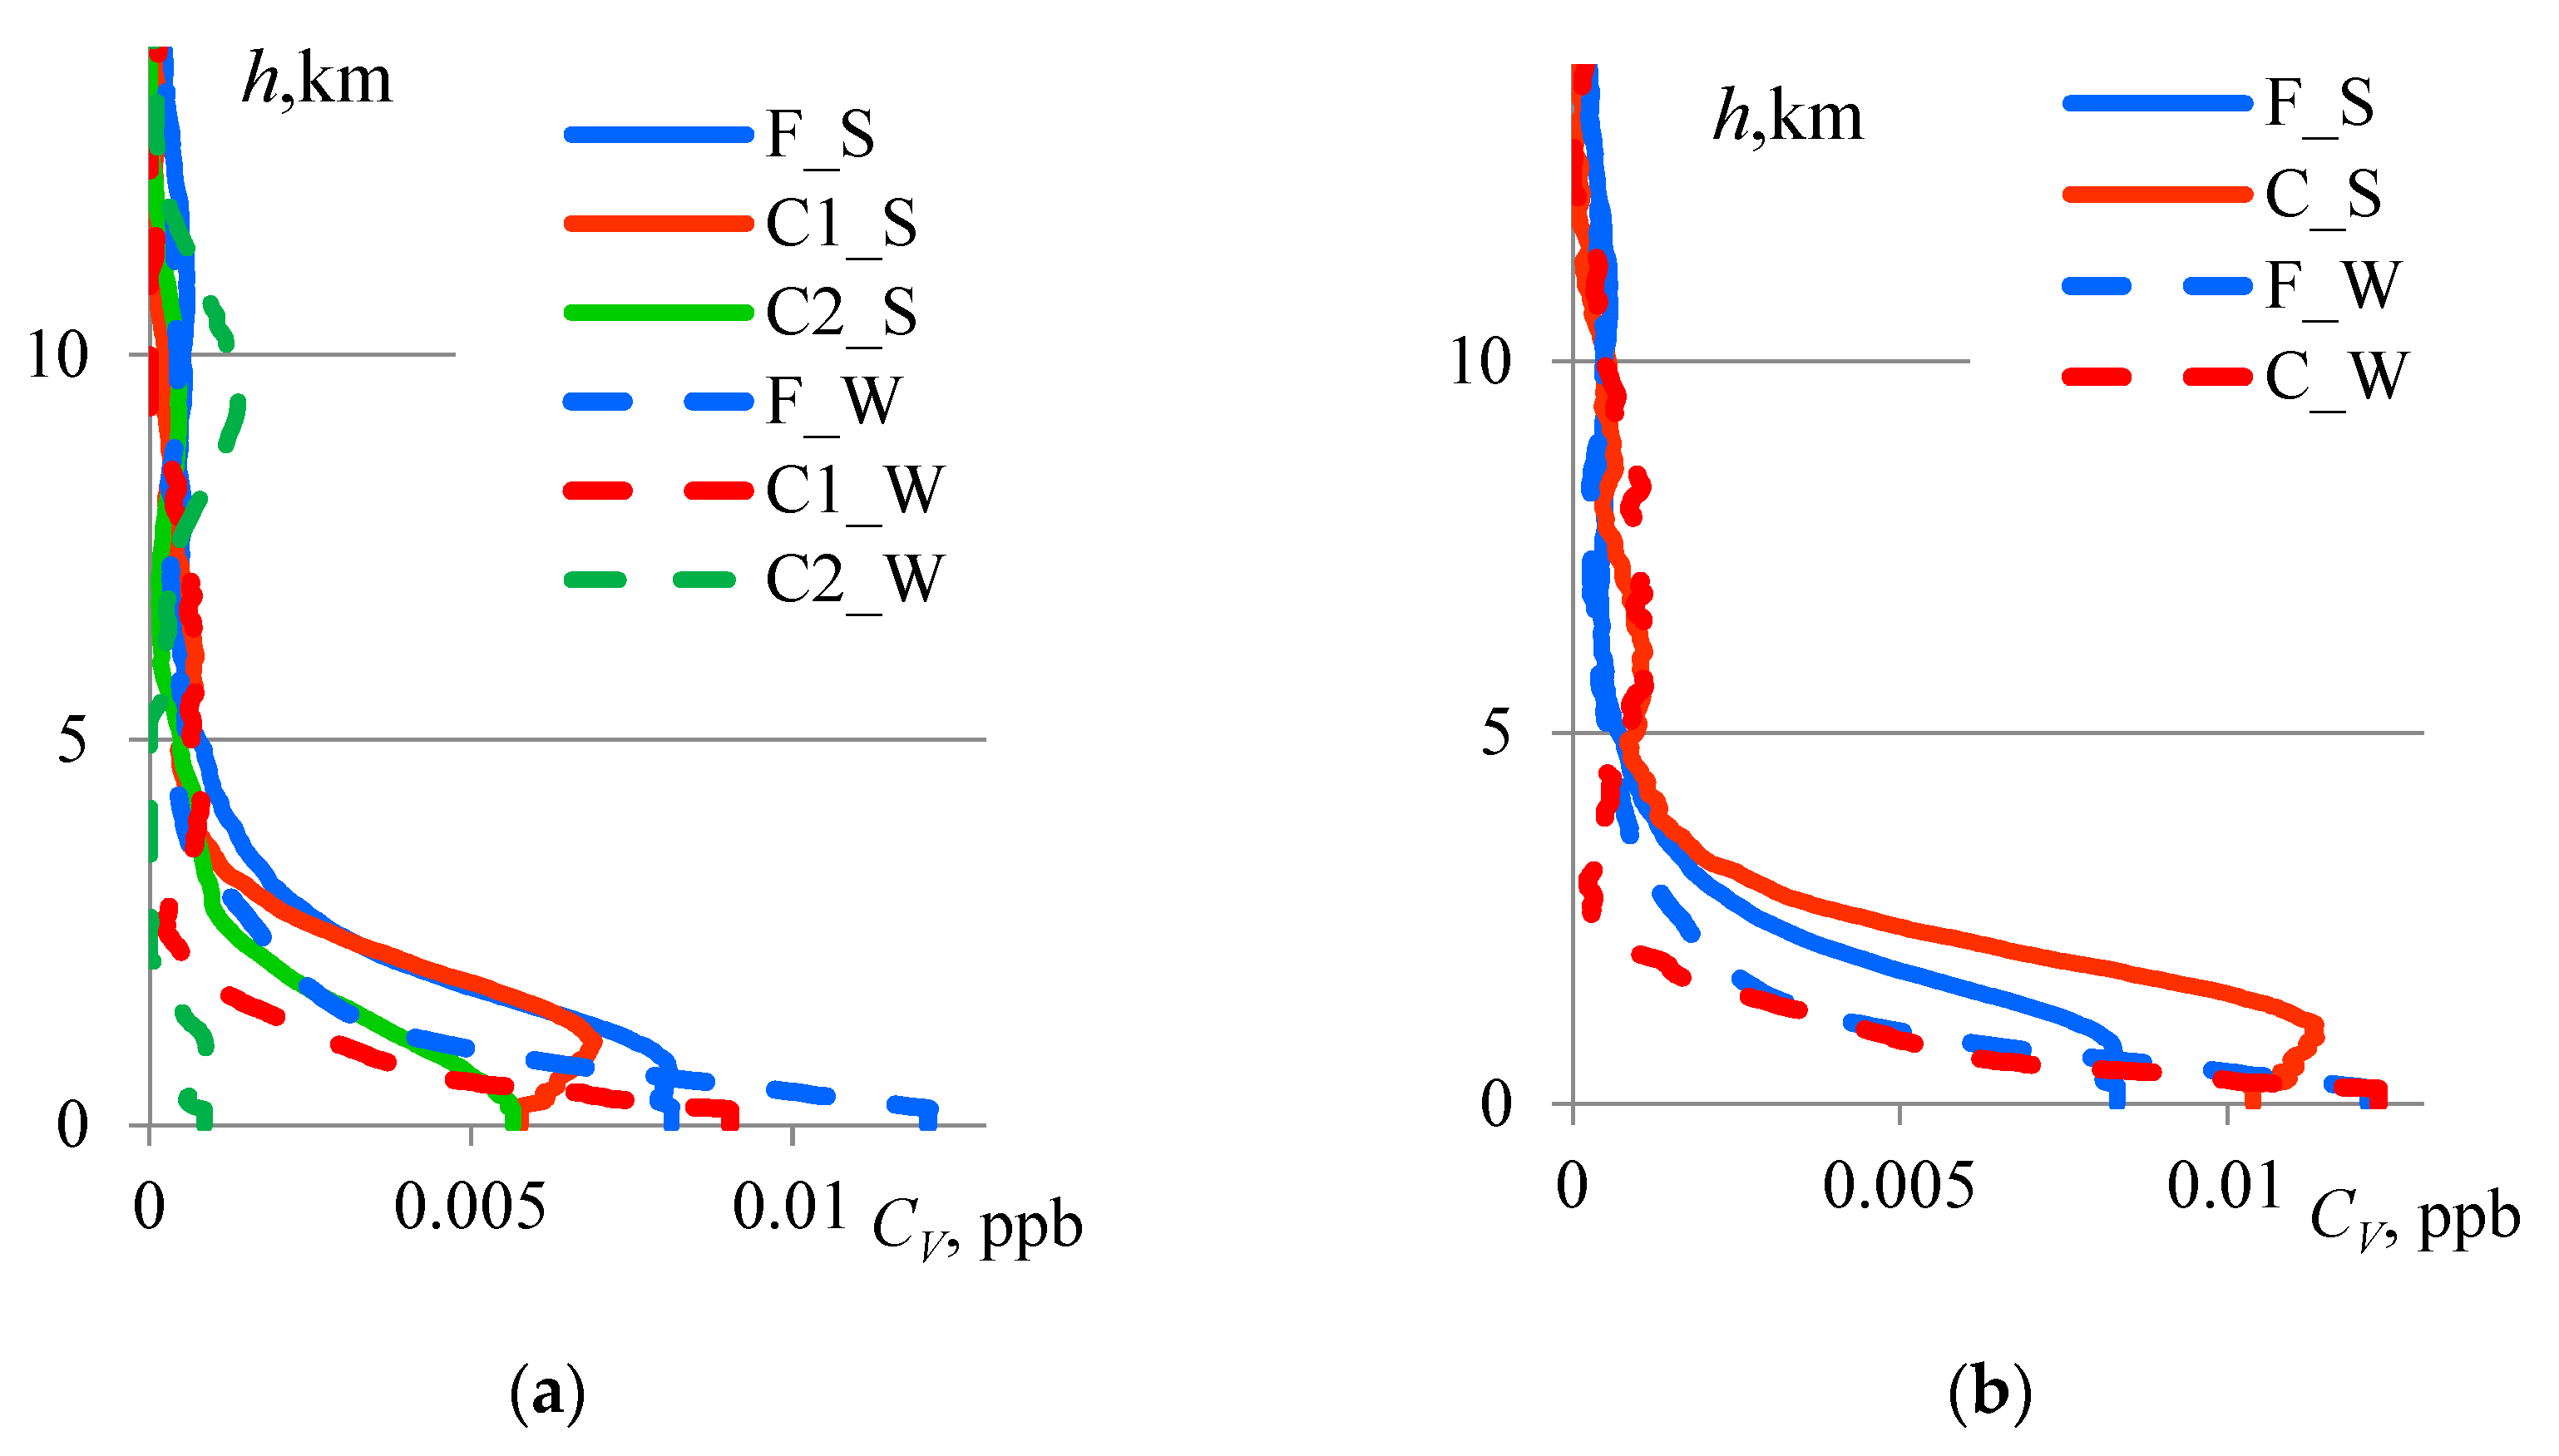
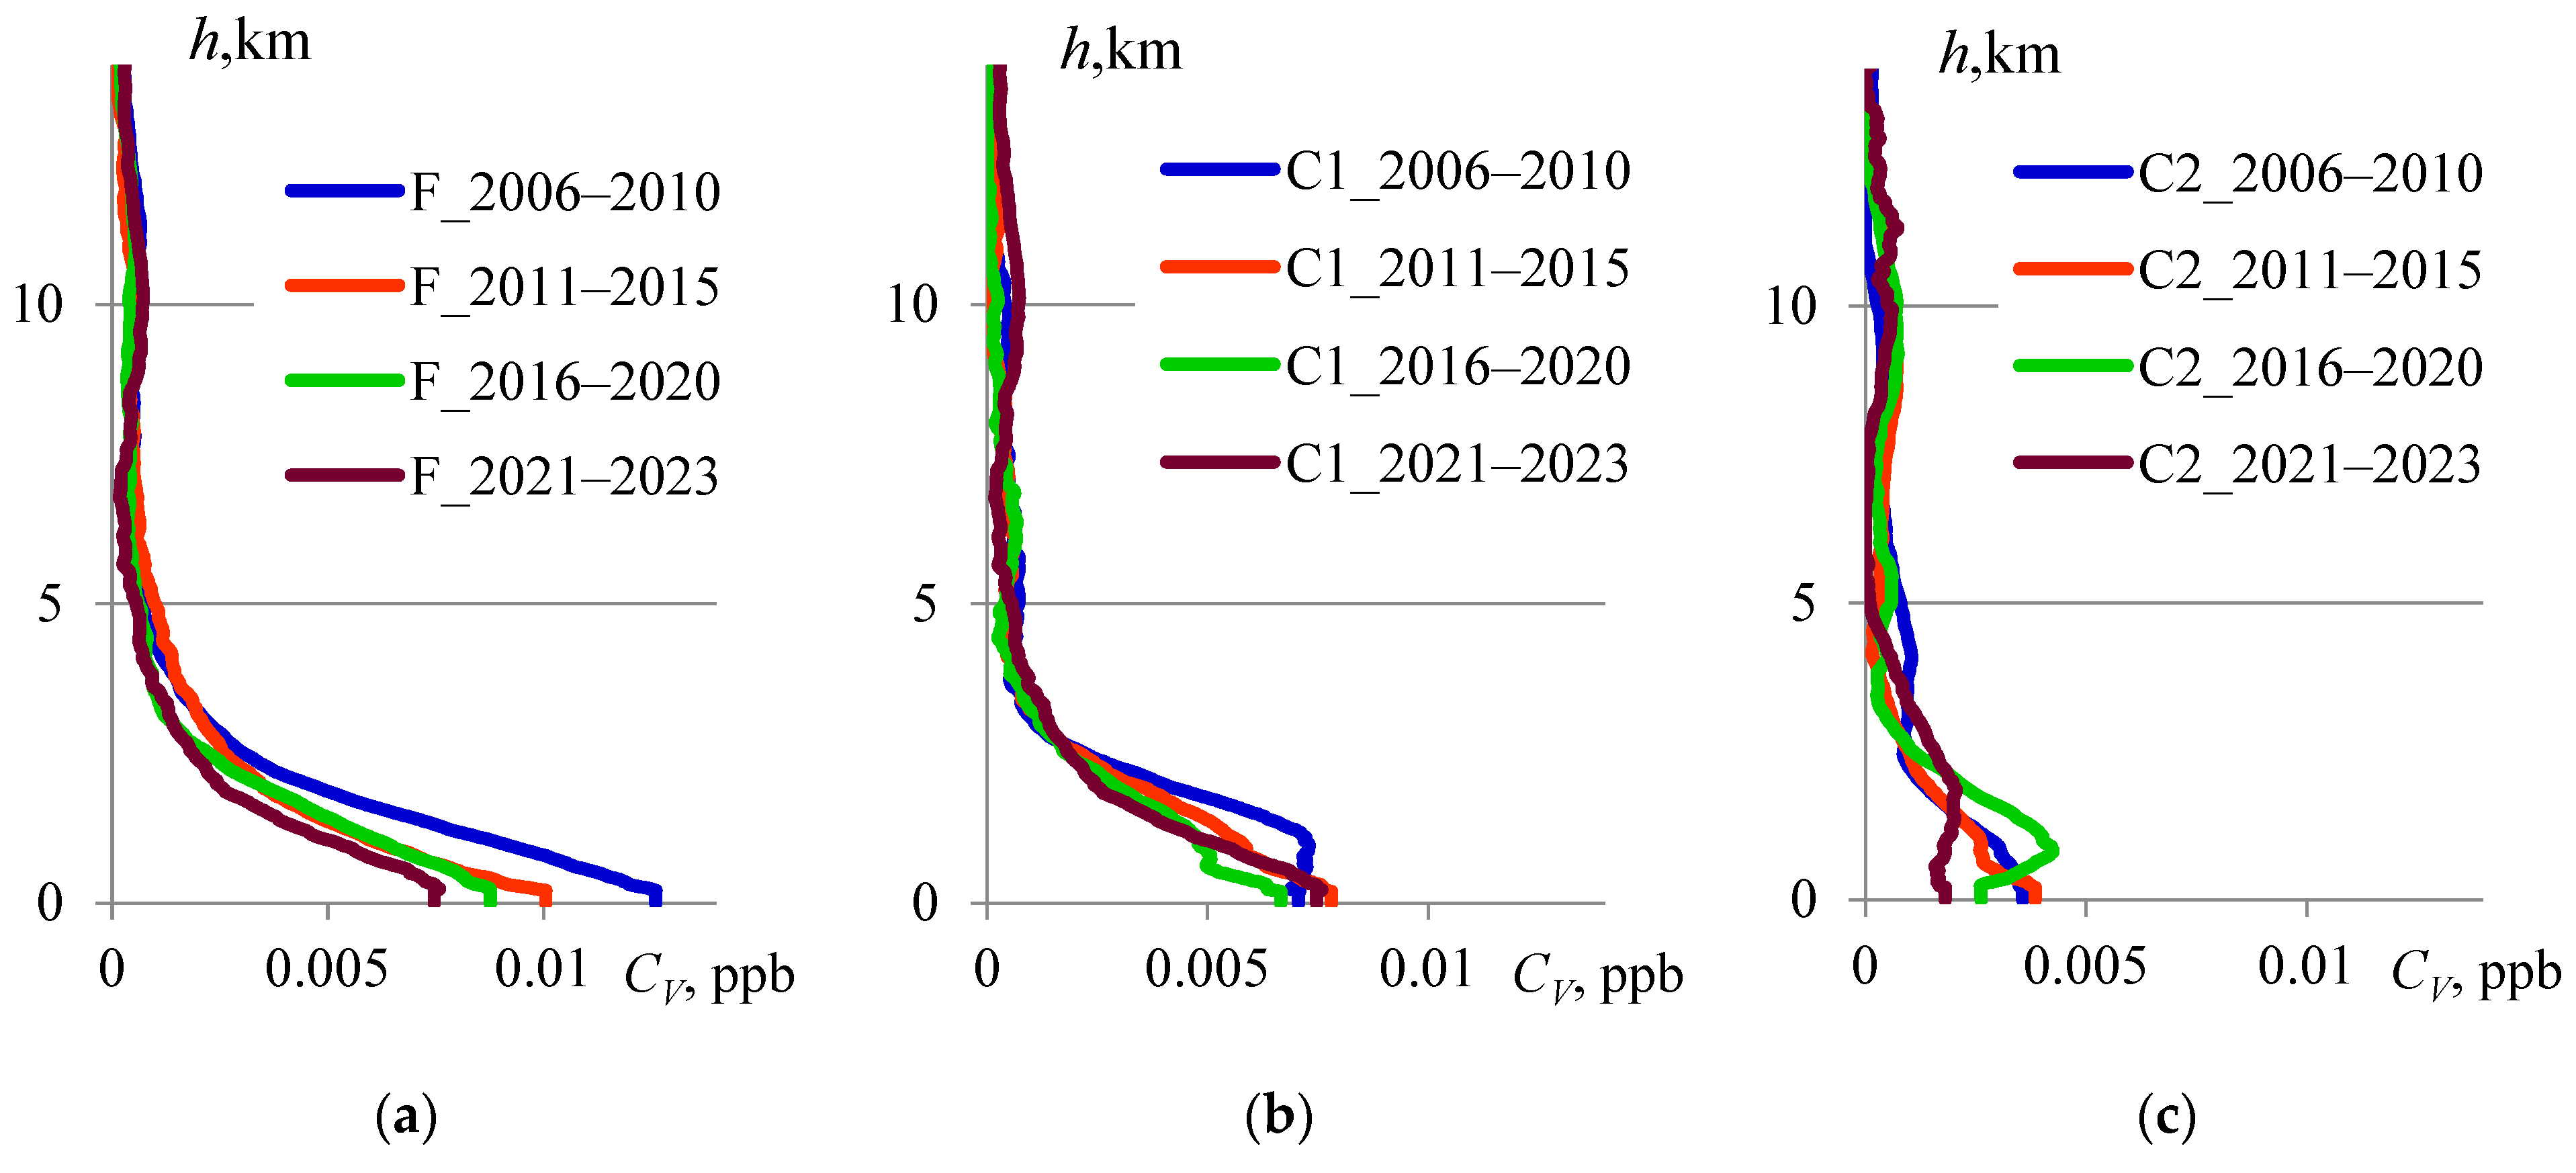
The results of the processing and analysis of the LRS-C data are presented in Figure 1, Figure 2 and Figure 3.
The fine-particle concentration profiles are almost identical for both variants for the total period and seasons, as seen in Figure 1 and Figure 2. The sum of the (C1) and (C2) concentration profiles is close to the profile of the total concentration of coarse particles.
The formation of average concentration profiles shown in Figure 1 occurs under the influence of processes that determine the total amount of aerosol matter as a result of emissions from regional, natural, and anthropogenic sources and the long-range transport of atmospheric impurities, as well as features of geophysical characteristics.
These factors are subject to seasonal changes. The seasonal mean concentration profiles of the aerosol fractions are shown in Figure 2. The upper boundary of the mixing layer shifts from 0.6–0.8 km (W) to 2–2.5 km (S). The concentration of non-spherical aerosol particles is weak in the lower atmospheric layer during the cold time of the year.
The total LRS-C data were divided into four periods. Changes in the concentration profiles of the aerosol fractions, their column concentrations, and AOD (532) are presented in Figure 3 and Table 1. There was a trend towards a decreasing total amount of small particles (fine mode) and their concentration in the lower layer.

3.2. Aerosol Concentration Profiles in the East Antarctic Region

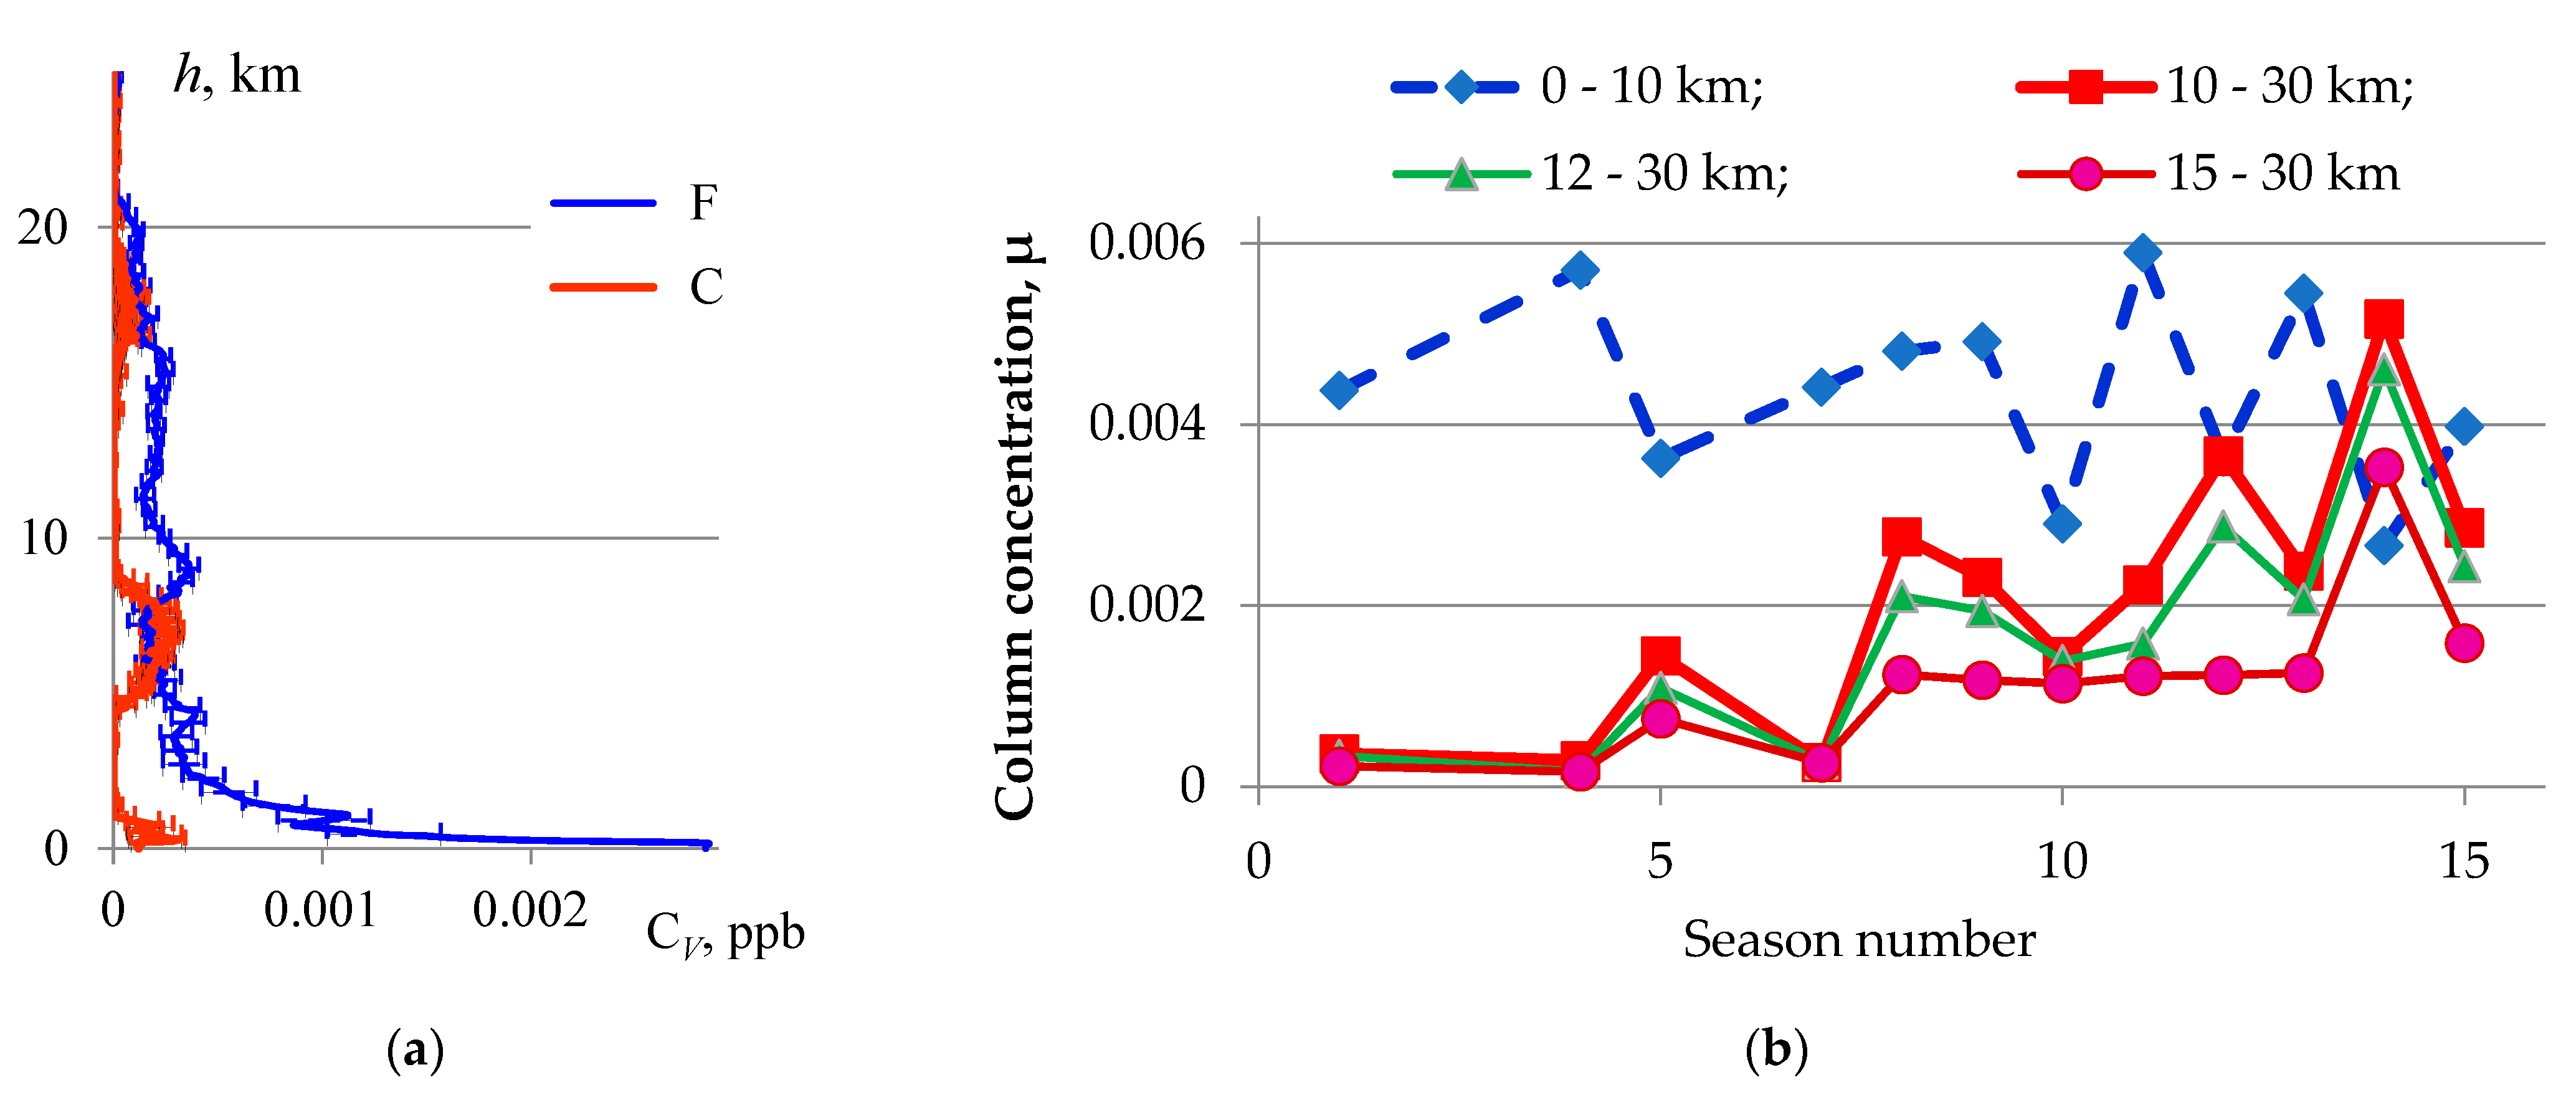
The results of the radiometric measurements at the AERONET site Vechernaya Hill, 67.66° S, 46.16° E, and the CALIOP lidar data in this region during the Antarctic summer seasons (December–March) from 2008 to 2023 are presented in Figure 4. Day-time CALIOP measurements were carried out in Vechernaya Hill at about 12:00 UTC.
Figure 4a shows the altitude profiles of the aerosol average volume concentrations for the fine and coarse modes. Small particles make up the dominant aerosol fraction. The maximum concentration value was recorded in the lower layer. Course particles are often found in the middle troposphere. Their column concentration is much lower, and the variability is much higher in comparison with the parameters of fine particles.
Figure 4b demonstrates the temporal changes in the total amounts of small particles in the tropospheric and stratospheric aerosol layers during the measurement seasons. The 1st measurement season was held in 2008–2009, etc., last 15th season—in 2022–2023. The increase in the column amount of small particles in the stratosphere during the 12th measuring season (2019–2020) was probably a consequence of the rise in forest fire smoke into the stratosphere in Australia [11]. Hunga Tonga–Hunga Haʻapai volcano eruption in December 2021–January 2022 sent clouds of ash about 60 km high into the atmosphere and could have increased the amount of matter in the stratosphere in the Antarctic area, including in the Vechernaya Hill region.

4. Discussion and Conclusions

The synergy of data from ground-based radiometric measurements and satellite lidar sensing has led to new information on large-scale spatial and temporal changes in aerosol fractions.
A statistical variant of the LRS-C technique and LIRIC-2 software can be used as a comprehensive tool for processing large datasets of combined ground-based radiometer observations from AERONET and SONET stations, as well as satellite lidar CALIOP sounding.
This new technique allows for studying the altitude distribution of average aerosol parameters in regions with a low atmospheric aerosol load.

Author Contributions

Conceptualization, A.C., P.G. and Z.L.; methodology, A.C., A.B., P.G., Z.L., V.P. A.M. and N.M.; software, V.P., A.M., N.M., A.B. and Y.Z.; data curation, A.C., V.P., A.M., N.M., T.P. and Y.Z.; investigation, F.A., L.B., G.D., M.K., A.L., T.P. and V.P.; validation, V.P., F.A., L.B., G.D., T.P., M.K., A.L. and Y.Z.; writing—review and editing, A.C., A.B., P.G., Z.L.,V.P., A.M. and N.M.; formal analysis, Y.Z., F.A., L.B., G.D., M.K. and A.L.; writing—original draft, A.C., A.M., N.M., P.G. and Z.L.; supervision, A.C., P.G. and Z.L. All authors have read and agreed to the published version of the manuscript.

Funding

This work was partly supported by the Belarusian Republican Foundation for Fundamental Research through the projects F22KИ-035 and F22TUB-001.

Institutional Review Board Statement

Not applicable.

Informed Consent Statement

Not applicable.

Data Availability Statement

AERONET data are freely available from https://aeronet.gsfc.nasa.gov (accessed on 4 September 2023). CALIOP data are freely available from https://www.opendap.org (accessed on 4 September 2023).

Acknowledgments

The authors thank NASA CALIPSO team for the data products used in this publication. The authors thank Brent Holben, Pawan Gupta, Elena Lind, and David Giles (NASA/GSFC) for advancement and managing of the AERONET program.

Conflicts of Interest

The authors declare no conflicts of interest.

References

  1. The Cloud-Aerosol Lidar and Infrared Pathfinder Satellite Observation (CALIPSO). Available online: https://www-calipso.larc.nasa.gov/ (accessed on 31 October 2023).
  2. Chaikovsky, A.; Chaikovskaya, L.; Denishchik-Nelubina, N.; Fedarenka, A.; Oshchepkov, S. Lidar&radiometer inversion code (LIRIC) for synergetic processing of EARLINET, AERONET and CALIPSO lidar data. EDJ Web Conf. 2018, 176, 1–4. [Google Scholar] [CrossRef]
  3. Chaikovsky, A.; Bril, A.; Fedarenka, A.; Goloub, P.; Hu, Q.; Lopatin, A.; Lapyonok, T.; Miatselskaya, N.; Torres, D.; Fuertes, D.; et al. Synergetic Observations by Ground-Based and Space Lidar Systems and Aeronet Sun-Radiometers: A Step to Advanced Regional Monitoring of Large Scale Aerosol Changes. EPJ Web Conf. 2020, 237, 1–4. [Google Scholar] [CrossRef]
  4. Chaikovsky, A.P.; Bril, A.I.; Fedarenka, A.S.; Peshcharankou, V.A.; Denisov, S.V.; Dick, V.P.; Asipenka, F.P.; Miatselskaya, N.S.; Balin, Y.S.; Kokhanenko, G.P.; et al. Synergy of ground-based and satellite optical remote measurements for studying atmospheric aerosols. J. Appl. Spectrosc. 2020, 86, 1092–1099. [Google Scholar] [CrossRef]
  5. Chaikovsky, A.; Dubovik, O.; Holben, B.; Bril, A.; Goloub, P.; Tanré, D.; Pappalardo, G.; Wandinger, U.; Chaikovskaya, L.; Denisov, S.; et al. Lidar-Radiometer Inversion Code (LIRIC) for the retrieval of vertical aerosol properties from combined lidar/radiometer data: Development and distribution in EARLINET. Atmos. Meas. Tech. 2016, 9, 1181–1205. [Google Scholar] [CrossRef]
  6. NASA; Goddard Space Flight Center; AERONET; Aerosol Robotic Network. Available online: https://aeronet.gsfc.nasa.gov/ (accessed on 5 September 2023).
  7. Li, Z.Q.; Xu, H.; Li, K.T.; Li, D.H.; Xie, Y.S.; Li, L.; Zhang, Y.; Gu, X.F.; Zhao, W.; Tian, Q.J. Comprehensive study of optical, physical, chemical and radiative properties of total columnar atmospheric aerosols over China: An overview of Sun-sky radiometer Observation NETwork (SONET) measurements. Bull. Am. Meteorol. Soc. 2018, 99, 739–755. [Google Scholar] [CrossRef]
  8. Chaikovsky, A.P.; Bril, A.I.; Pescherenkov, V.A.; Meтeльcкaя, N.S.; Malinka, A.V.; Ocипeнкo, F.P.; Korol, M.M.; Goloub, P.; Podvin, T.; Blarel, L.; et al. A statistical approach to the synergy of data from CALIOP and ground-based radiometric stations for studying altitude profiles of aerosol parameters. J. Appl. Spectrosc.. 2024, 49, 367–377. [Google Scholar] [CrossRef]
  9. Liu, Z.; Vaughan, M.A.; Winker, D.M.; Hostetler, C.H.; Poole, L.R.; Hlavka, D.; Hart, W.; McGill, M. Use of probability distribution functions for discriminating between cloud and aerosol in lidar backscatter data. J. Geophys. Res. 2004, 109, D15202. [Google Scholar] [CrossRef]
  10. OPeNDAP [Electronic Resource]: Advanced Software for Remote Data Retrieval. Mode of Acc. Available online: https://www.earlinet.org (accessed on 31 October 2023).
  11. González, R.; Toledano, C.; Román, R.; Mateos, D.; Asmi, E.; Rodríguez, E.; Lau, I.C.; Ferrara, J.; D’Elia, R.; Antuña-Sánchez, J.C.; et al. Characterization of Stratospheric Smoke Particles over the Antarctica by Remote Sensing Instruments. Remote Sens. 2020, 12, 3769. [Google Scholar] [CrossRef]
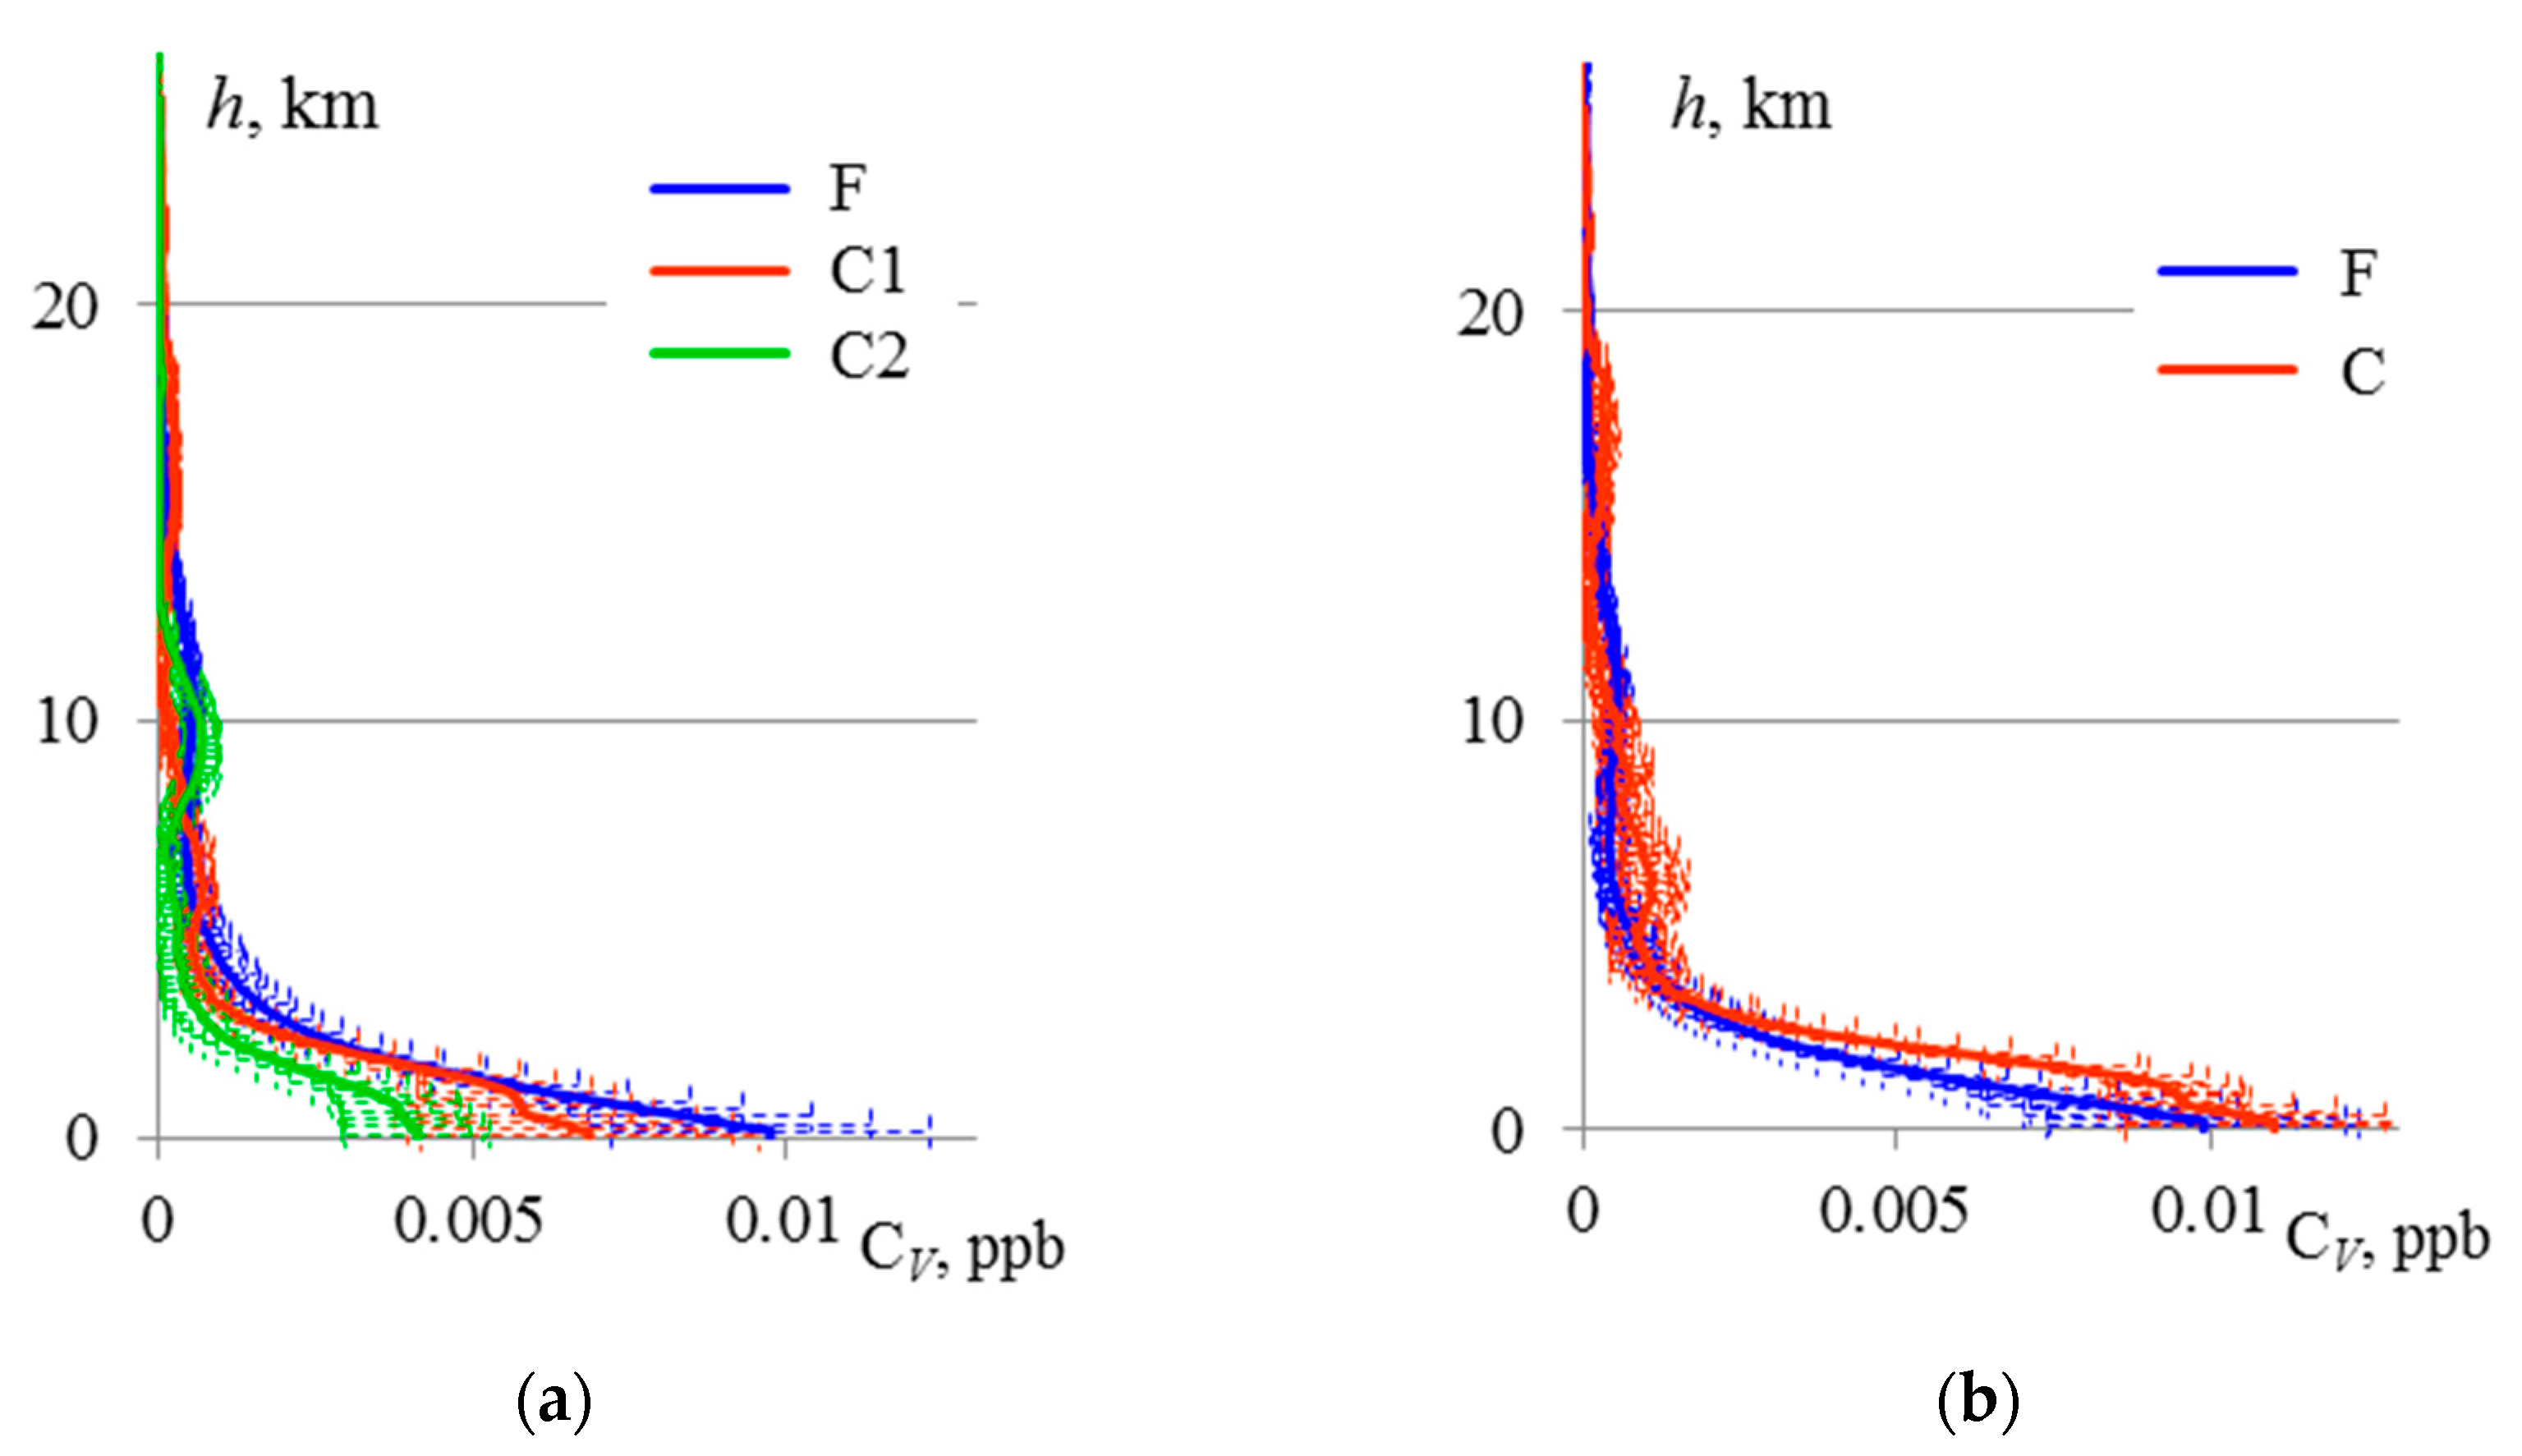
Figure 1. Altitude profiles of the aerosol average volume concentrations, CV [cm3/cm3] (a)—the three-mode aerosol model, (b)—the two-mode aerosol model; horizontal bars are uncertainties of concentration; the total number of overpass events, N = 1384; AOD = 0.15/0.11 (average/standard deviation, 532 nm).
Environsciproc 29 00070 g001
Figure 2. Seasonal changes in aerosol volume concentration profiles; similar to Figure 1. (a)—the three-mode aerosol model, (b)—the two-mode aerosol model. Additional letters, S/W, indicate half-year seasons: S − Apr. ÷ Sept., N = 709; AOD = 0.16/0.12; W − Oct. ÷ March; N = 675; AOD (532) = 0.13/0.10.
Environsciproc 29 00070 g002
Figure 3. Temporal variations in aerosol mode volume concentration profiles; similar to Figure 1. (a) Fine mode; (b) coarse spherical mode; (c) coarse spheroid mode. Time periods are indicated in the legends; N = 379; 415; 401; 188.
Environsciproc 29 00070 g003
Figure 4. (a) Altitude profiles of the aerosol average volume concentrations, (F) fine mode, (C) coarse mode; N = 482; AOD = 0.045/0.017. (b) Temporal changes in column concentrations of fine aerosol mode. The boundaries of the aerosol layers are indicated in the legend of the diagram.
Environsciproc 29 00070 g004
Table 1. Temporal changes in column concentrations of aerosol modes and AOD (aver./st. dev.).
Time PeriodFine (F)Coarse Spherical (C1)Coarse Spheroid (C2)AOD (532)
2006–20100.0290.0220.0110.19/0.15
2011–20150.0230.0190.0110.15/0.11
2016–20200.0210.0180.0120.14/0.10
2021–20230.0190.0190.0100.12/0.08
Disclaimer/Publisher’s Note: The statements, opinions and data contained in all publications are solely those of the individual author(s) and contributor(s) and not of MDPI and/or the editor(s). MDPI and/or the editor(s) disclaim responsibility for any injury to people or property resulting from any ideas, methods, instructions or products referred to in the content.