1. Introduction
The digital elevation model is a visualization of the bare Earth’s surface elevations [
1]. DEMs are generated from numerous sources including contour lines, topographic maps, stereo photogrammetry, SAR interferometry, DGPS points, etc. Amongst all the techniques to create DEMs, high-resolution laser altimetry (LiDAR) is proven to generate higher accuracy DEMs [
2]. Various terrain-related studies including hydrological modelling, flood inundation mapping, monitoring volcanic activities, etc. use DEM as an integral input data. Therefore, the accuracy of the input DEMs for various applications is an important parameter to yield good quality results [
3]. Systematic errors in DEM products are still possible due to equipment precision limitations, which is time consuming, costly and difficult to rectify [
4]. To enhance the quality and accuracy of the available open-source DEMs various studies have been conducted [
5].
An Earth Observation System satellite, the Ice, Cloud, and Land Elevation Satellite (ICESat-2), was launched by NASA. Highly accurate data from ICESat-2 provides extensive and sufficient reference data for quality analyzing different DEMs [
6].
Interpolation is the process of estimating the value of attributes at unsampled sites from measurements made at point locations within the same area or region, but it often leads to over-smoothening [
7]. Simulation technique can be defined as a statistical way to generate data, where unavailable, based on the statistical models like linear regression which correlates the input and output of the sample/training data and calculates the statistical relationship between the two and implements the same for other input points to generate their corresponding output. This study hence utilizes the CartoDEM and ICESat-2 LiDAR data to simulate a higher accuracy DEM using machine learning algorithms.
Various studies have shown that for the Indian region, good-quality and best accuracy terrain data are available via Cartosat-1 DEM [
8]. This study focusses on simulating a higher accuracy spaceborne LiDAR DEM by correlating it with the CartoDEM measurements. The simulated DEM is then validated using DGPS data. The accuracy of the simulated output DEM is higher than the CartoDEM and closer to the LiDAR measurements.
2. Methods
2.1. Study Area
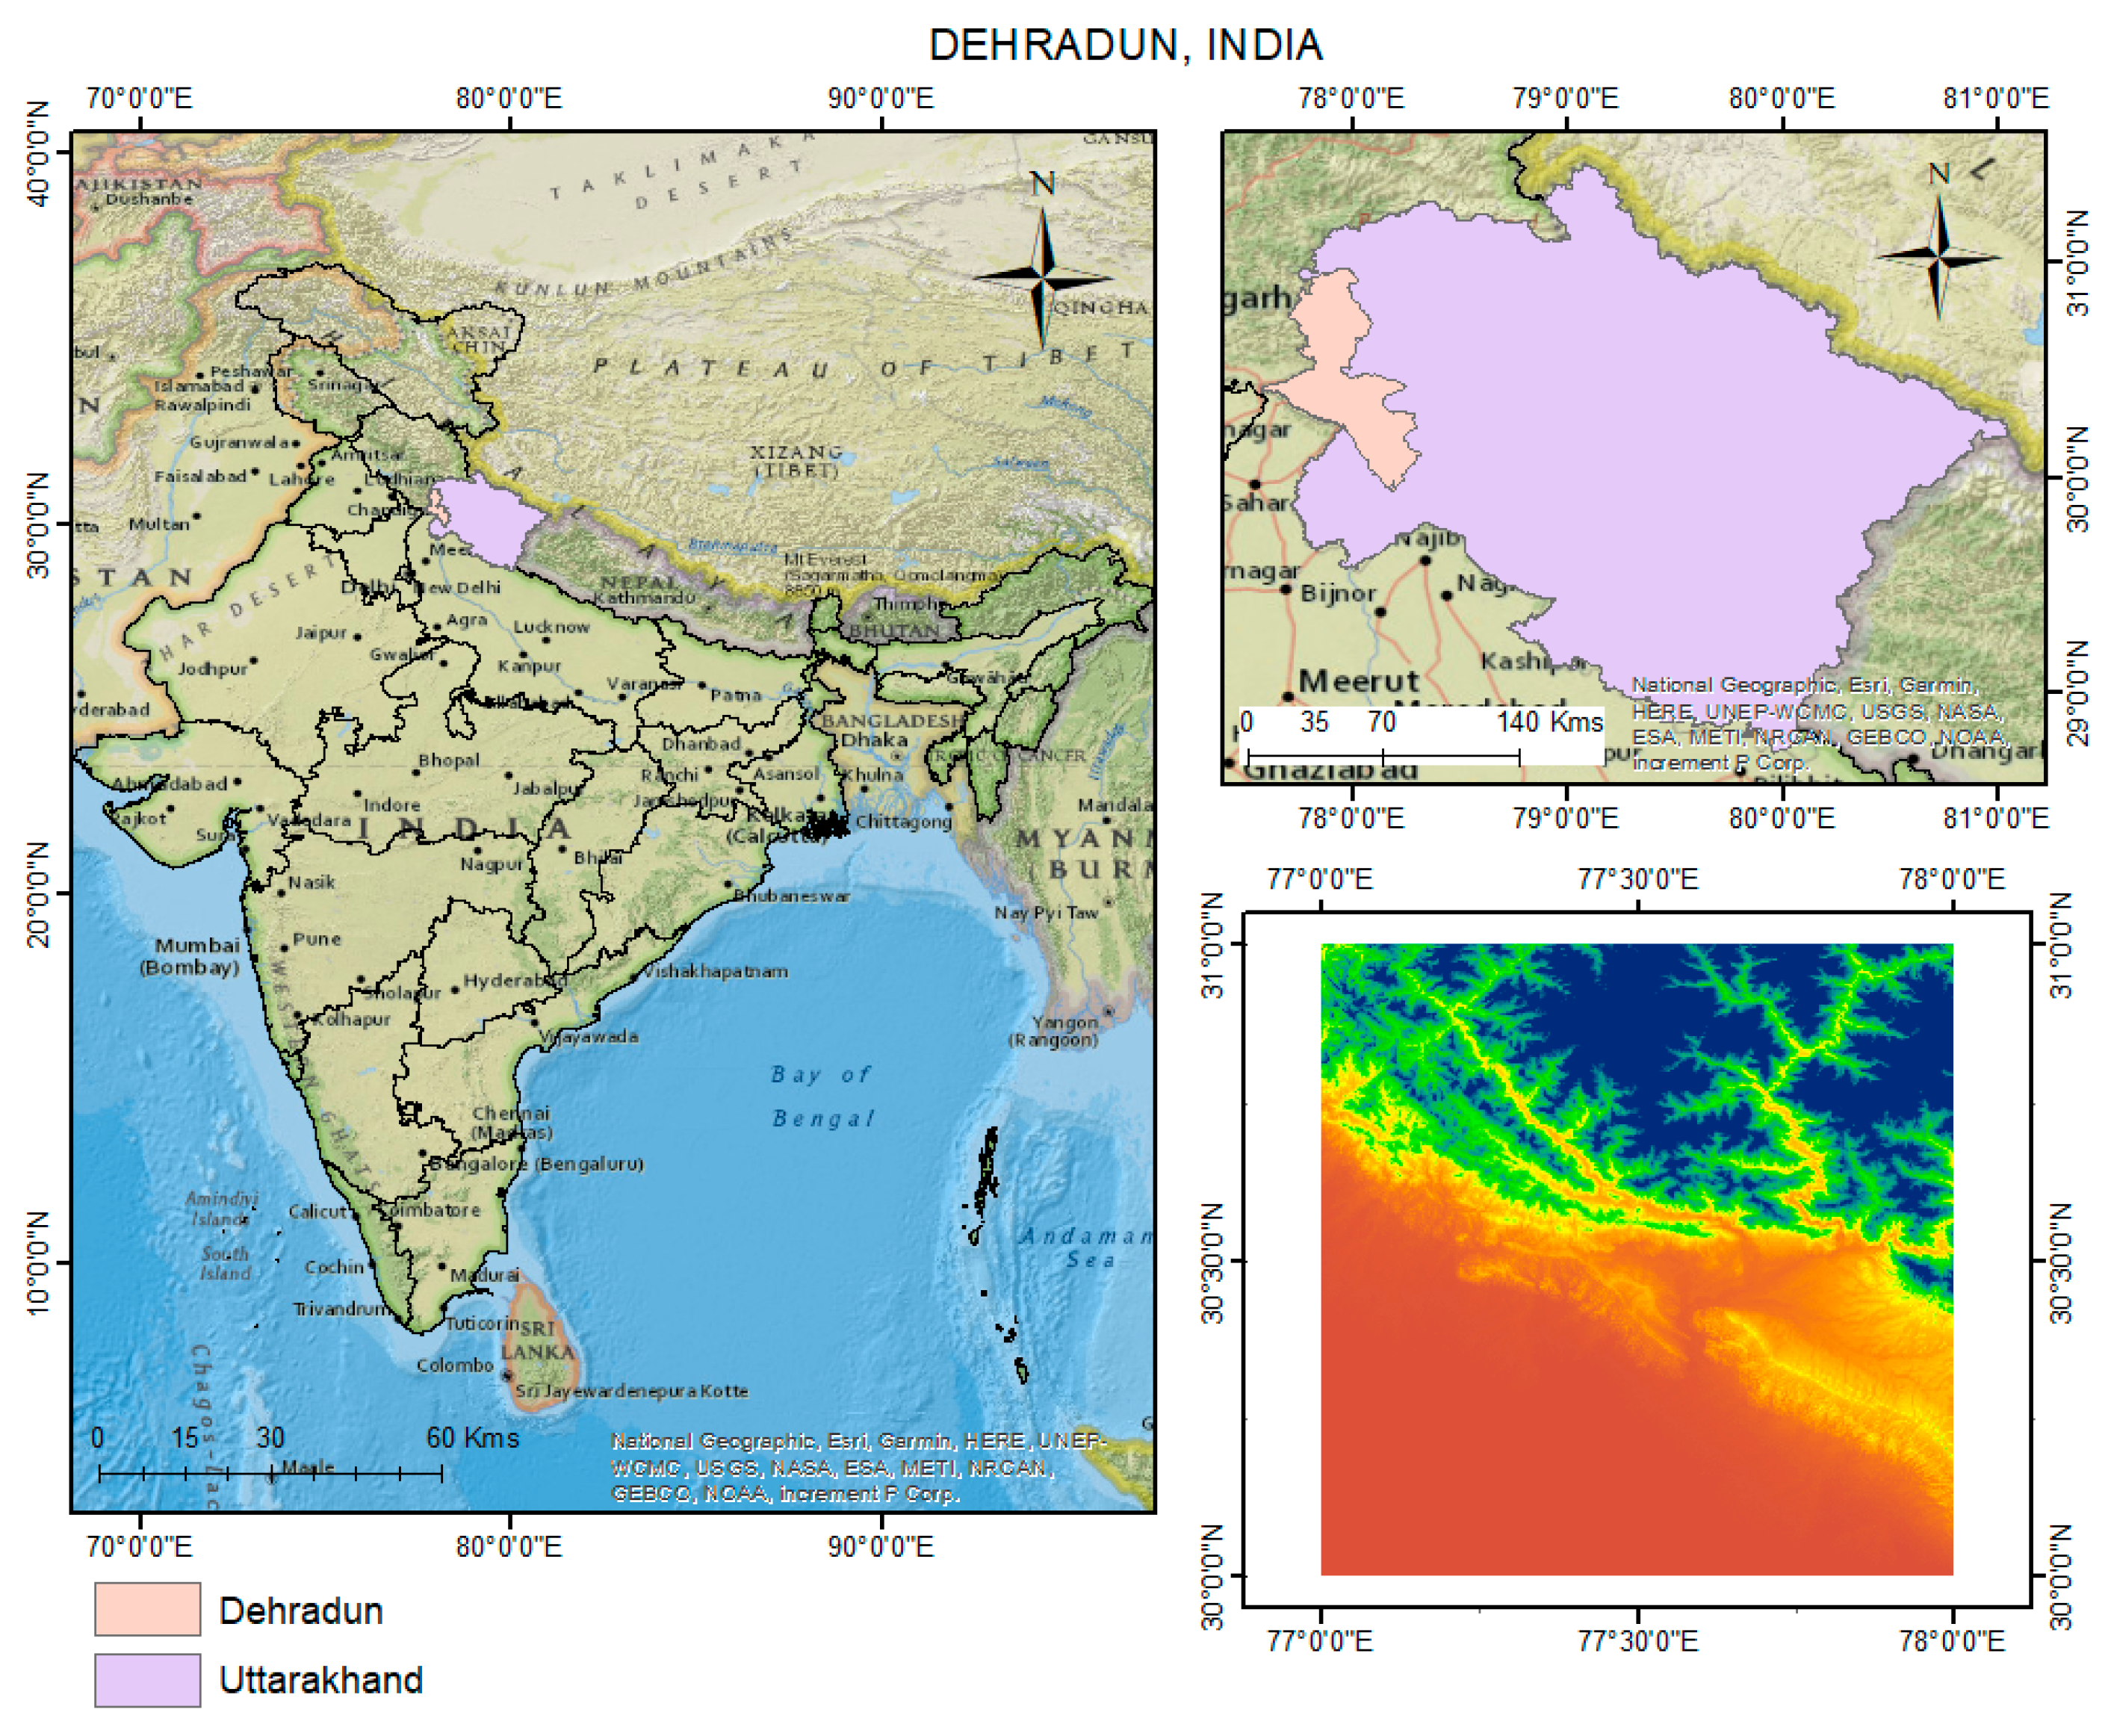
This study was conducted over the hilly terrain of the Dehradun region in the foothills of the Himalayas. The study area lies between latitudes 30°01′ N and 31°2′ N and longitudes 77°34′ E and 78°18′ E (
Figure 1).
2.2. Datasets
2.2.1. CartoDEM V3 R1
Using the CartoDEM V3 R1 product, the corresponding LiDAR DEM was generated to enhance the vertical accuracy of the CartoDEM. The Cartosat-1 satellite is the first Indian remote sensing satellite that can provide stereo visualization in orbit. A number of products derived from Cartosat-1 can be used for various geographical information system (GIS) applications, including digital elevation models (
Figure 1), orthoimage products, and value-added products for GIS.
2.2.2. ICESat-2
In ICESat-2, the ATLAS instrument provides all of the topographic data through its advanced topographic laser altimetry system. A total of three relatively strong beams and three relatively weak beams are present [
9]. In the context of the accurate analysis of different DEMs, it provides enough and high-quality reference data [
10].
2.2.3. Ground Control Points (GCPs)
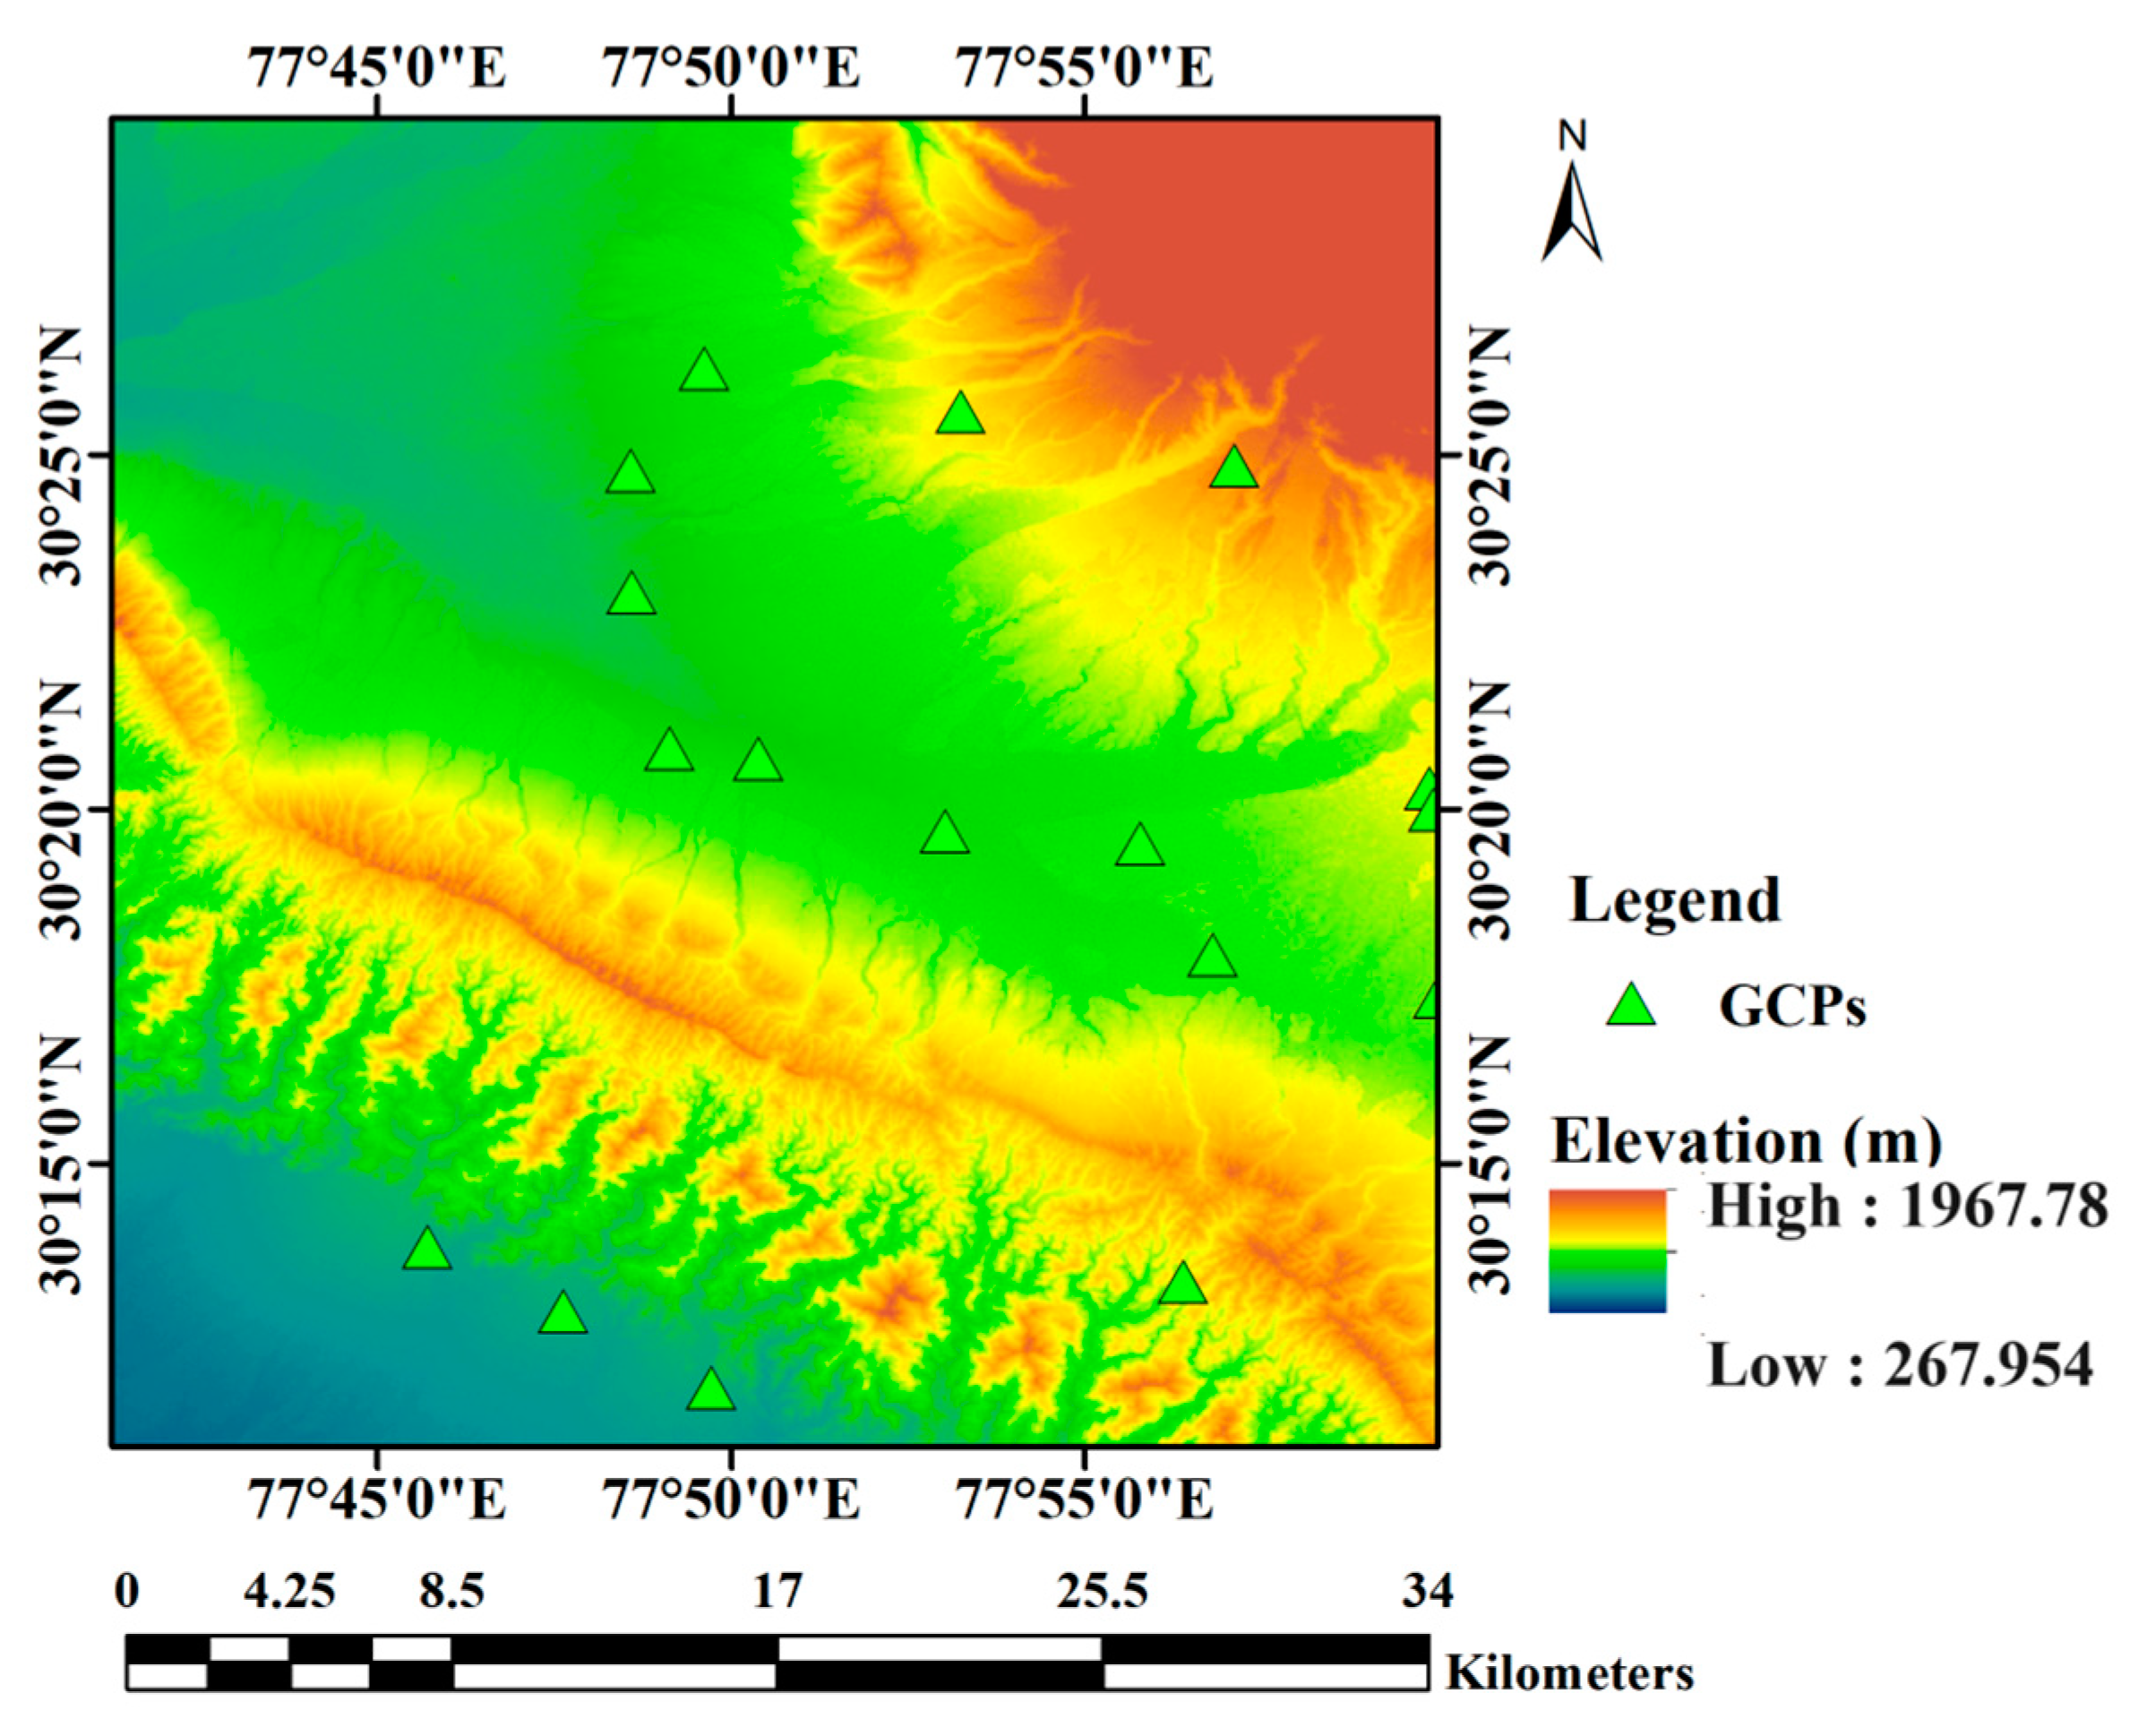
The Trimble R7 GNSS receivers and Leica 500 series receivers were used for the collection of the field data. A total of 16 GCPs were collected over the Dehradun region and utilized for the validation of the simulated DEM.
2.3. Methodology
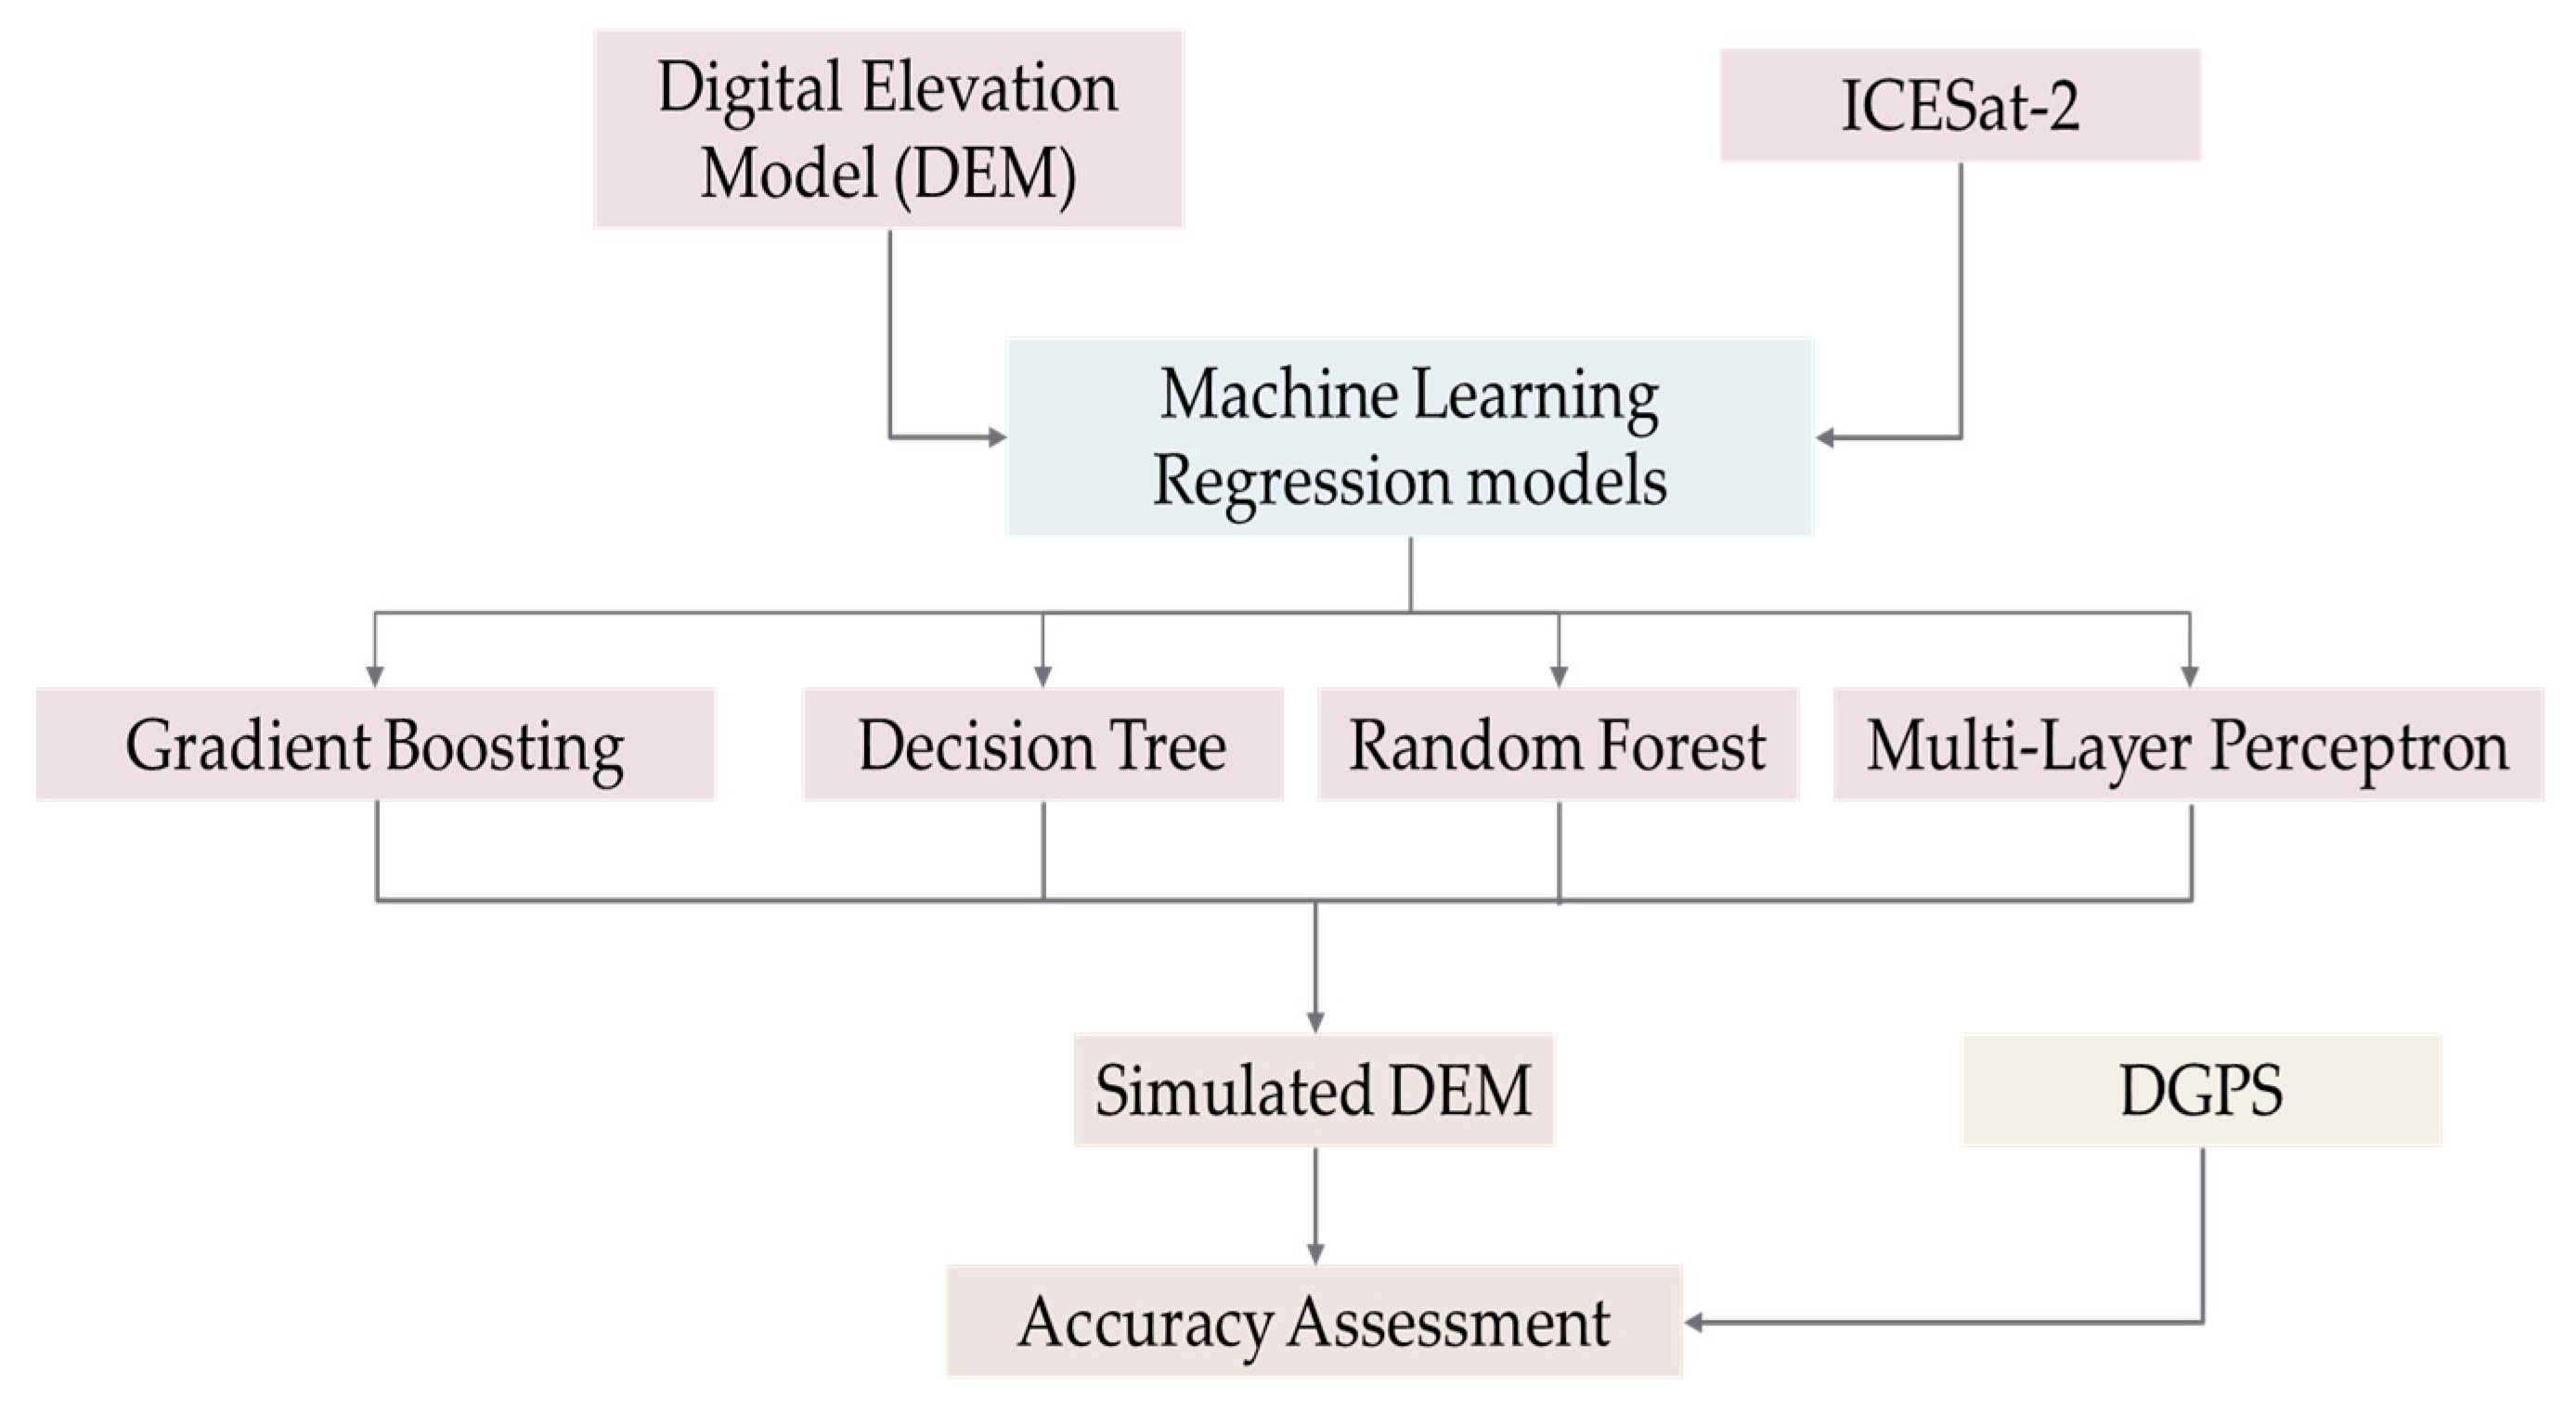
The overall methodology followed for this study is depicted in
Figure 2. Pancholi et al. has successfully generated DEM using the machine learning models of decision tree (DT), random forest, gradient boosting machine (GBM), and multi-layer perceptron (MLP) [
11], out of which the MLP model gave minimal error output.
2.3.1. Machine Learning Models
This section describes the machine learning models used for this study.
The decision tree model, which finds a foundation in machine learning theory, is a potent tool for dealing with regression and classification challenges. In contrast to other classification approaches that use a group of features (or bands) together to complete classification/regression in a single decision step, it relies on a multilevel or hierarchical decision strategy or a tree-like structure. It consists of leaves, internal nodes, and the root node. Each decision tree node uses a top–down technique to perform binary classification, separating one or more classes from the others by progressing down the tree until the leaf node is reached. In essence, a complicated problem statement is divided into lesser problems by a decision tree, and the simpler decisions that follow lead to the complex conclusion. The decision tree model is chosen for the study because it effectively resolves problems involving both linear and non-linear interactions [
12].
The ensemble machine learning model random forest has two or more decision trees, which together form a “decision forest”. Finding the majority by voting on the individual decision tree outcomes yields the random forest model’s outcome. The design of each decision tree that makes up random forest affects how well it performs. There are two steps in this process that include random selection. The first step uses a bootstrap technique to randomly select about two-thirds of the training dataset before beginning to build each decision tree. Out-of-bag (OOB) data, which make up the final third of the dataset, are utilized for inner cross-validation to assess the precision of the mode [
13].
Gradient boosting is a unique ensemble machine learning approach that utilizes the predictive capability of boosting on a decision tree. It has several decision trees constructed sequentially, each of which is a “weak” learner. These following learners draw lessons from the preceding model’s errors to create the final model, which is a “strong” one. The first model is given some initial constant values that are calculated by averaging all of the target values. Residuals are the calculated differences between the anticipated value and the actual target values. The goal values for the following decision tree are these residuals r1, and the residuals r2 are computed from the anticipated value and r1. This carries on until every decision tree is trained [
14].
An artificial neural network (ANN) is a nonlinear nonparametric framework that uses neural network propagation across layers based on gradient learning techniques to simulate human brain receptors and information processing. The input layer, hidden layer, and output layer are the three layers that make it up. Through synapses, the input layer receives the input and transmits it to the hidden levels; likewise, the hidden layers transmit the data to the output layer. The weights that the synapses hold regulate how information moves from one layer to the next. Equation (1) mathematically describes a neuron in the hidden layer or output layer.
where
w denotes synaptic weights,
x denotes the input to neurons,
y denotes the output from neurons,
u denotes a linear combiner of input signals, b denotes bias, and
() is the activation function used to restrict the input range.
2.3.2. Hyperparameters Used
Some variables must be put up in advance and cannot be changed while training. These variables or parameters are called hyperparameters. They are the factors that control how a learning algorithm learns and determine the final outcome of the models [
15]. The goal of hyperparameter optimization is to find the optimal settings for hyperparameters to provide good results from data as rapidly as feasible. Hyperparameter optimization is performed as the parameters tuned during this process (
Table 1) are not optimized by the models during training and has to be provided to the models before the training actually begins.
2.3.3. Accuracy Assessment
Utilizing the coefficient of determination (R2), root mean square error (RMSE), and mean absolute error (MAE) in comparison to the simulated DEM and DGPS data, the machine learning model was statistically evaluated for the Dehradun region. The regression model performance is often evaluated using the R2 and RMSE of the predicted and actual values. For estimating accuracy metrics over an area’s elevation values, a higher R2 and lower MAE and RMSE are correlated with higher precision and accuracy, respectively. To obtain a clearer result, the LE90 value was also calculated for the simulated DEM using the MLP regressor model. The formula extensively used for LE90 is given in Equation (2) [
16,
17].
3. Results and Discussion
In this study, an implementation of machine learning models was conducted to simulate a higher accuracy DEM providing elevation values closer to the ICEsat-2. The accuracy of the simulation was evaluated primarily using the 20% testing data that is unseen by the model and is shown in
Table 2.
The ANN model displayed the best results in terms of RMSE and MAE followed by RF, GBM, and DT.
Figure 3 shows the simulated DEM using the four models. The validation of the simulated output using MLP was conducted using DGPS GCPs (shown in
Figure 4). The accuracy of the simulated DEM using DGPS yielded an RMSE of 6.58 m which is very promising, on a hilly terrain in the foothills of the Himalayas, for the simulated DEM product. The LE90 score for the simulated DEM was 10.82 m, signifying the confidence that a minimum of 90% of the vertical error falls within the limit of 10.82 m. The variation in the RMSE while comparing the RMSE derived from ICESat-2 and DGPS can be attributed to the lower uncertainty of DGPS on collecting the elevation data when compared to ICESat-2 points, which need the filtering of footprints (elevation values) based on the deviations. Furthermore, ICESat-2 footprints are not evenly distributed throughout the study area and are more concentrated in plane areas and less concentrated in hilly areas.
The highest values of elevation are 1950.87 m, 1975 m, 1964.77 m, and 1967.78 m for DT, GBM, RF, and MLP machine learning models, whereas the highest elevation value in the ICESat-2 footprint is 1976.87 m. This is a realistic representation of elevation with respect to the training data used in the model. However, since the ICESat-2 data points are not densely distributed in the study area and very sparsely distributed in the high elevation zones, there are possibilities of the under-representation of elevation in zones higher than 1976.87 m.
An even distribution of ICESat-2 data in plane and hilly terrains while training the model can potentially improve the accuracy of the models. Including ICESat-2 points in the hilly terrain of a nearby area for training the models or using the same for developing a deeper neural network based on the transfer learning approach can evenly balance training data in all elevation ranges and improve the results of the model.
4. Conclusions
The current study attempted to simulate an ICESat-2 DEM over a 388 km2 area in the hilly terrain of Dehradun located in the foothills of the Himalayas. Four machine learning algorithms, DT, RF, GBM, and MLP, were used for the simulation using CartoDEM and ICESat-2 data and produced promising results with MLP performing the best. The accuracy assessment was initially conducted using ICESat-2 points and validated using DGPS GCPs. The study concluded that although DGPS points provide a planned way of validating DEMs, the collection of a large number of DGPS points is time consuming and a costly issue, whereas the ICESat-2 dataset not only provide a large number of high accuracy elevation points for the simulation. Further investigations must be carried out to improve the accuracy of the DEM at the centimeter scale. Increasing the number of training points in all elevation zones and land use or land cover areas, the transfer learning ML approach is suggested for future improvements.
Author Contributions
Conceptualization, A.A. and A.B.; methodology, A.A. and A.B.; software, S.P. and A.A.; validation, S.P., A.B. and S.M.; resources, S.M. and A.B.; writing—original draft preparation, S.P. and A.A.; writing—review and editing, A.B.; visualization, S.P.; supervision, S.M. and A.B. All authors have read and agreed to the published version of the manuscript.
Funding
This research received no external funding.
Institutional Review Board Statement
Not applicable.
Informed Consent Statement
Not applicable.
Data Availability Statement
Open-source data were used for this article as explained in the dataset section.
Acknowledgments
The authors would like to thank the Director of the Indian Institute of Remote Sensing for providing the laboratory facility for carrying out this study. The authors would like to thank the Indian Space Research Organization (ISRO) and National Aeronautics and Space Administration (NASA) for making the openly accessible data available to the researchers through their data sharing platforms.
Conflicts of Interest
The authors declare no conflicts of interest.
References
- What Is a Digital Elevation Model (DEM)?|U.S. Geological Survey. Available online: https://www.usgs.gov/faqs/what-digital-elevation-model-dem (accessed on 11 September 2023).
- Rayburg, S.; Thoms, M.; Neave, M. A comparison of digital elevation models generated from different data sources. Geomorphology 2009, 106, 261–270. [Google Scholar] [CrossRef]
- Liu, X. Airborne LiDAR for DEM generation: Some critical issues. Prog. Phys. Geogr. Earth Environ. 2008, 32, 31–49. [Google Scholar] [CrossRef]
- Wang, M.; Yu, H.; Chen, J.; Zhu, Y.; Zhang, Y.; Yu, W. Comparison of DEM Super-Resolution Methods Based on Interpolation and Neural Networks. Sensors 2022, 22, 745. [Google Scholar] [CrossRef] [PubMed]
- Patel, A.; Jena, P.P.; Khatun, A.; Chatterjee, C. Improved Cartosat-1 Based DEM for Flood Inundation Modeling in the Delta Region of Mahanadi River Basin, India. J. Indian Soc. Remote Sens. 2022, 50, 1227–1241. [Google Scholar] [CrossRef]
- Neuenschwander, A.L.; Magruder, L.A. Canopy and Terrain Height Retrievals with ICESat-2: A First Look. Remote Sens. 2019, 11, 1721. [Google Scholar] [CrossRef]
- Setiyoko, A.; Arymurthy, A.M.; Basaruddin, T.; Arief, R. Semivariogram fitting based on SVM and GPR for DEM interpolation. IOP Conf. Ser. Earth Environ. Sci. 2019, 311, 012076. [Google Scholar] [CrossRef]
- Agarwal, R.; Sur, K.; Rajawat, A.S. Accuracy assessment of the CARTOSAT DEM using robust statistical measures. Model. Earth Syst. Environ. 2020, 6, 471–478. [Google Scholar] [CrossRef]
- Neumann, T.A.; Martino, A.J.; Markus, T.; Bae, S.; Bock, M.R.; Brenner, A.C.; Brunt, K.M.; Cavanaugh, J.; Fernandes, S.T.; Hancock, D.W.; et al. The Ice, Cloud, and Land Elevation Satellite—2 mission: A global geolocated photon product derived from the Advanced Topographic Laser Altimeter System. Remote Sens. Environ. 2019, 233, 111325. [Google Scholar] [CrossRef] [PubMed]
- Zhu, J.; Yang, P.F.; Li, Y.; Xie, Y.Z.; Fu, H.Q. Accuracy assessment of ICESat-2 ATL08 terrain estimates: A case study in Spain. J. Cent. South Univ. 2022, 29, 226–238. [Google Scholar] [CrossRef]
- Pancholi, S.; Abhinav, A.; Bhardwaj, A. Simulation of ICESat-2 DEM using Machine Learning Algorithms. Preprints 2023, 2023010381. [Google Scholar] [CrossRef]
- Kotsiantis, S.B. Decision trees: A recent overview. Artif. Intell. Rev. 2011, 39, 261–283. [Google Scholar] [CrossRef]
- Cutler, A.; Cutler, D.R.; Stevens, J.R. Random Forests. Ensemble Mach. Learn. 2012, 157–175. [Google Scholar] [CrossRef]
- Ayyadevara, V.K. Gradient Boosting Machine. Pro Mach. Learn. Algorithms 2018, 117–134. [Google Scholar] [CrossRef]
- Ali, Y.A.; Awwad, E.M.; Al-Razgan, M.; Maarouf, A. Hyperparameter Search for Machine Learning Algorithms for Optimizing the Computational Complexity. Processes 2023, 11, 349. [Google Scholar] [CrossRef]
- Gorokhovich, Y.; Voustianiouk, A. Accuracy assessment of the processed SRTM-based elevation data by CGIAR using field data from USA and Thailand and its relation to the terrain characteristics. Remote Sens. Environ. 2006, 104, 409–415. [Google Scholar] [CrossRef]
- Carabajal, C.C.; Harding, D.J. ICESat validation of SRTM C-band digital elevation models. Geophys. Res. Lett. 2005, 32, 1–5. [Google Scholar] [CrossRef]
| Disclaimer/Publisher’s Note: The statements, opinions and data contained in all publications are solely those of the individual author(s) and contributor(s) and not of MDPI and/or the editor(s). MDPI and/or the editor(s) disclaim responsibility for any injury to people or property resulting from any ideas, methods, instructions or products referred to in the content. |
© 2023 by the authors. Licensee MDPI, Basel, Switzerland. This article is an open access article distributed under the terms and conditions of the Creative Commons Attribution (CC BY) license (https://creativecommons.org/licenses/by/4.0/).


