1. Introduction
The study area focuses on the core zone of the Cerro Azul Meámbar National Park (PANACAM), which was declared as such in 1987, under decree No. 87-87, by the National Congress of the Republic of Honduras. Since then, it has been part of the National System of Protected Areas of Honduras (SINAPH), decree No. 87-87, which was initially established for the protection of the countryʹs cloud forests, since these are the main producers of water for the different communities that are settled in its surroundings [
1].
Territorially, PANACAM is located between the departments of Comayagua and Cortés, reaching a maximum height of 2080 m above sea level and an area of 31,339.08 hectares, covering four municipalities, and is co-managed by the Global Village Project (PAG), the Forest Conservation Institute (ICF) and local municipalities. It corresponds to the South Central Zone, according to the division of Chapters of the Table of NGOs Co-managers of Protected Areas of Honduras (MOCAPH) [
2].
PANACAM is an area with great potential for the development of a Biological Corridor, since it is close to Lake Yojoa, La Montaña de Santa Bárbara and the Francisco Morazán Dam (Alias El Cajón), providing a wider space for resource management in a sustainable way, where the community can participate to obtain goods and services, with the guarantee of an adequate management of existing resources [
3].
This research aims to show the stress in the vegetation cover of the core zone of the Cerro Azul Meámbar National Park, by applying principal component analysis (PCA) with geomatics methods of remote sensing with passive sensors of Landsat 8 OLI-TIRS from the year 2018, used for the monitoring of conservation objectives [
4]. This research sits within the framework of doctoral work in geomatics engineering: Analysis of environmental vulnerability in Central America using image spectrometry and differential SAR polarimetry from multi-sensor geospatial data, towards a resilience proposal for protected areas.
2. Materials and Methods
The methodology is based on a linear combination, where a set of correlated variables are transformed into a system of uncorrelated variables, which describe in a less complex space the total variability of the original data, where the total variance of the components will be equal to the variance of the original variables and the principal components are ordered according to decreasing variance [
5].
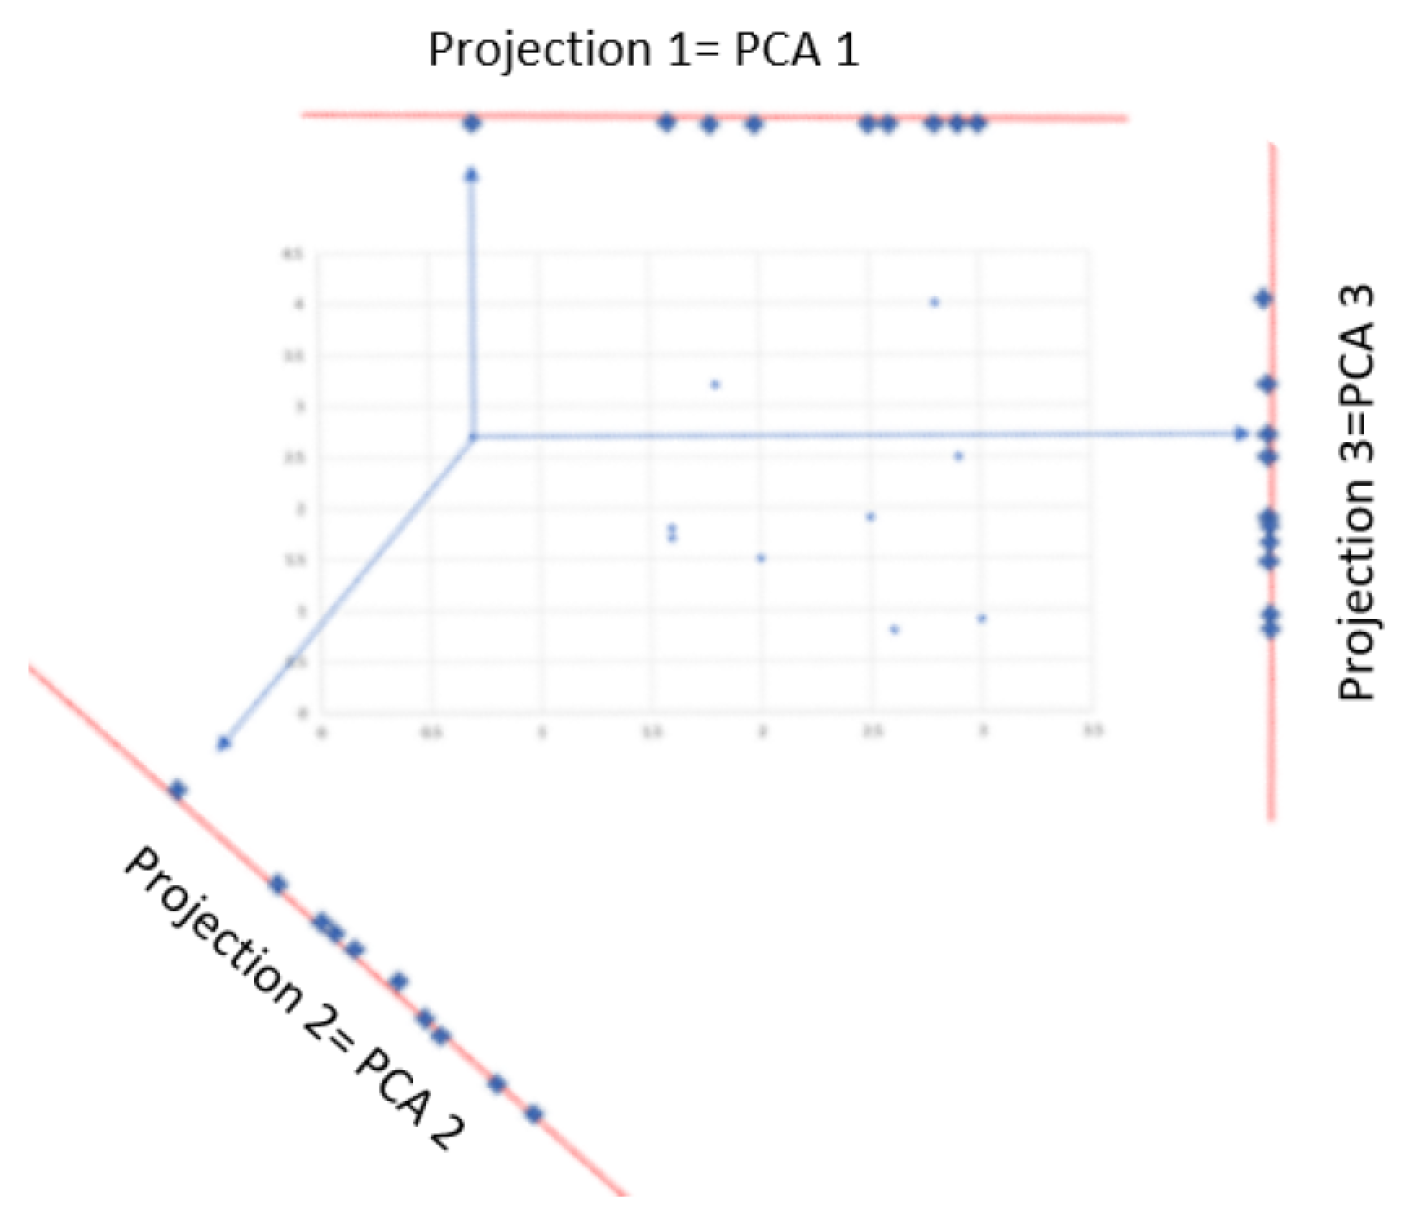
With a projection with the greatest variability, we can have a better recognition of the objects, for example with the application of a Principal Component Analysis (PCA), where the different dimensionalities are equivalent to a number of projections less than the original number, that is, the spectral resolution of the geodata in question, where the best projection is one that allows a greater separability of the objects. In summary, we seek to move from a multispectral image (3–9 Bands) to a monoband (1 Band), still containing the greatest separability, or discrimination of the data represented in each band. In the graph of
Figure 1, we can see three ACPs, each of them as a linear graphic projection, of the two-dimensionality of representation of the same data; the only thing that changes is the perspective of where we see these data. Statistically it is achieved through three methods: the average, variance, and covariance.
3. Results
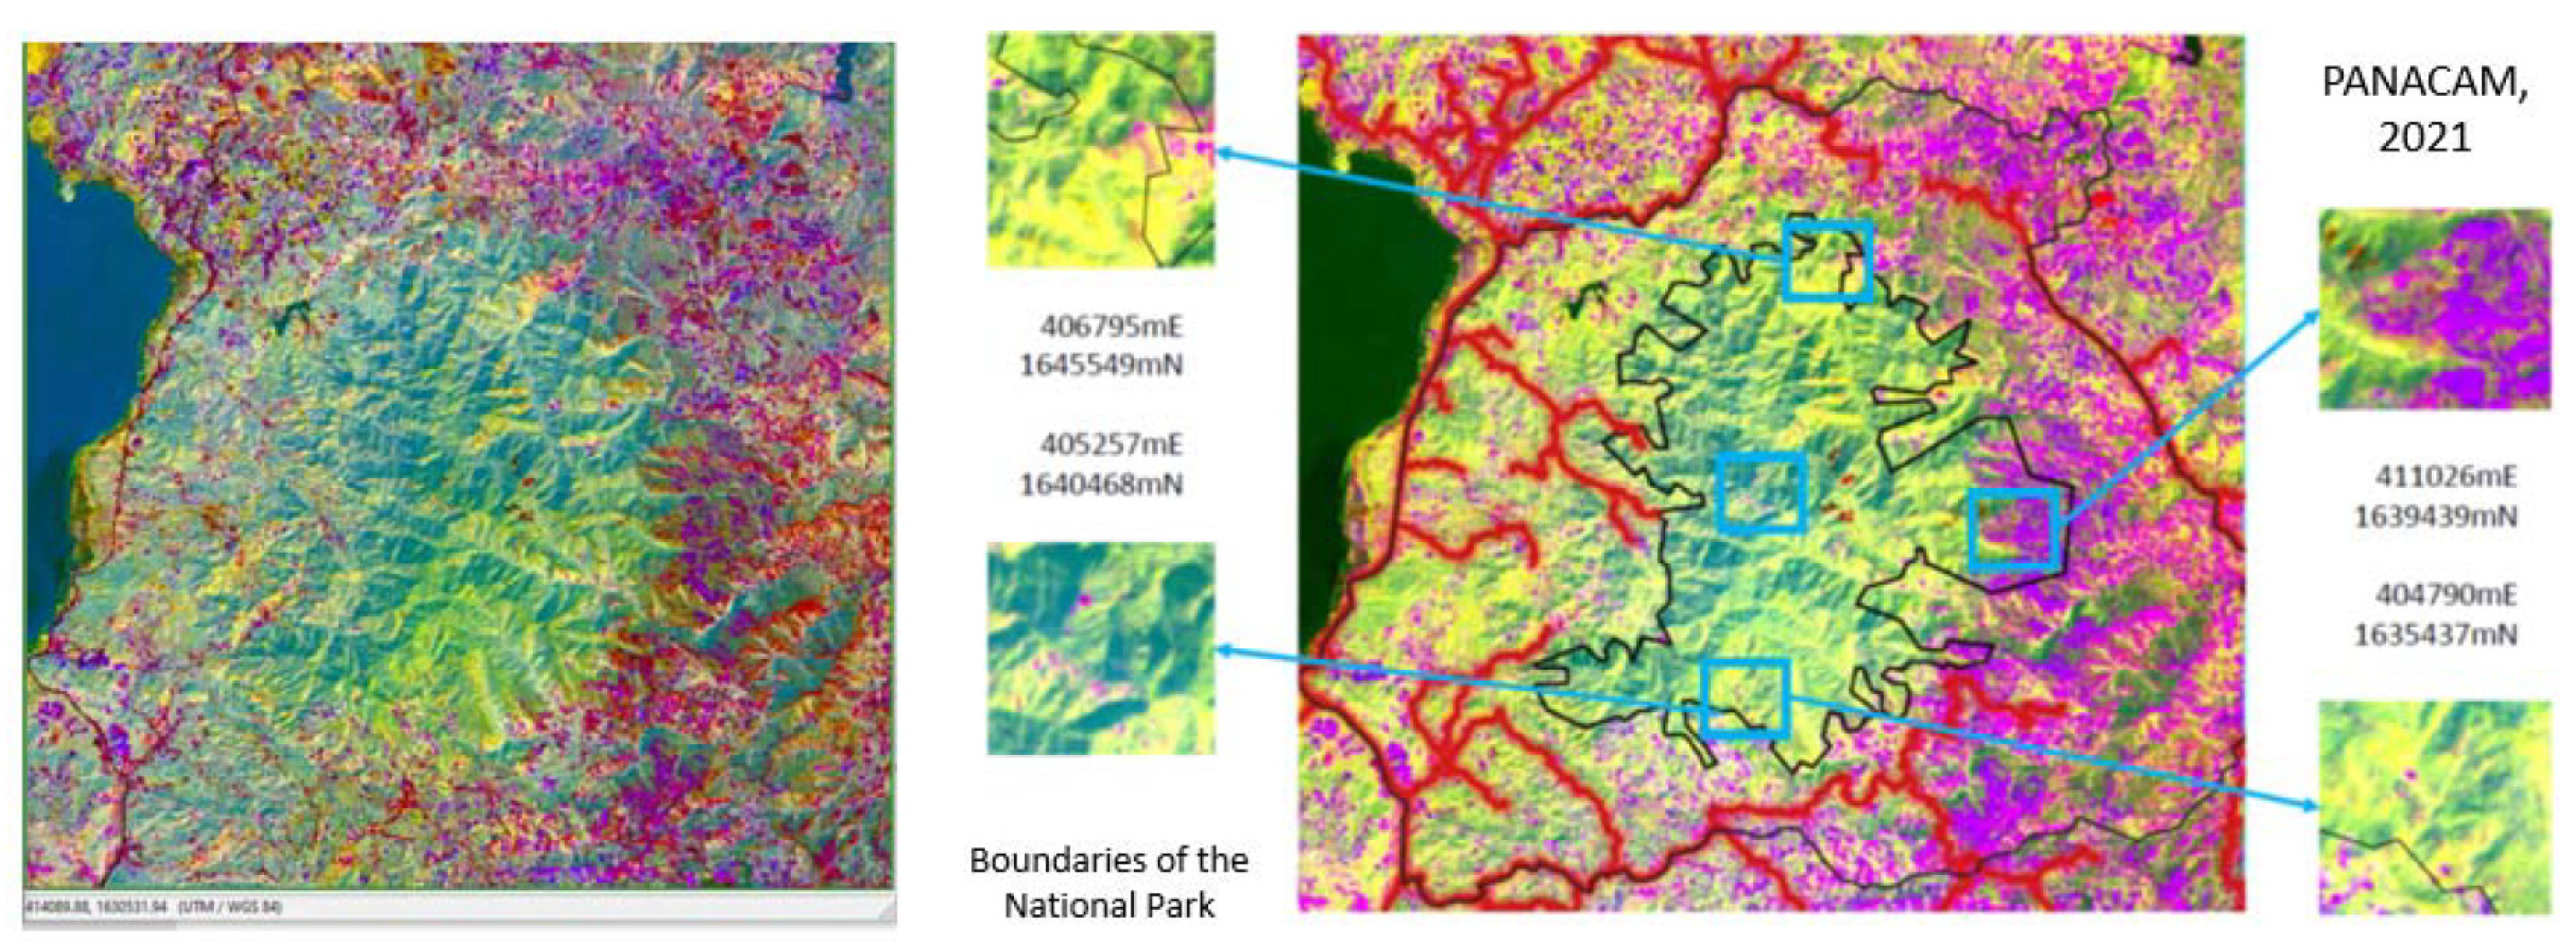
With the calculated PCA, the areas with vegetation stress were identified in the coverage of the segment of the Landsat 8 OLI TIR image (p18r50 of the year 2018) that corresponded to the administrative limits of PANACAM, prioritizing those located within the administrative limit of the core zone, with four sites of interest being used for monitoring the state of the vegetation cover (
Figure 2). Three of the four sites of interest were validated through field trips, previously discarding one because it corresponded to an area with soil detachment. Another one of the resulting products was a small geographic database, which will allow geolocating coverage for training samples for the establishment of future models of supervised classification of land cover and use (LC/LU) and models of dynamics of changes, in order to evaluate the management plan of PANACAM.
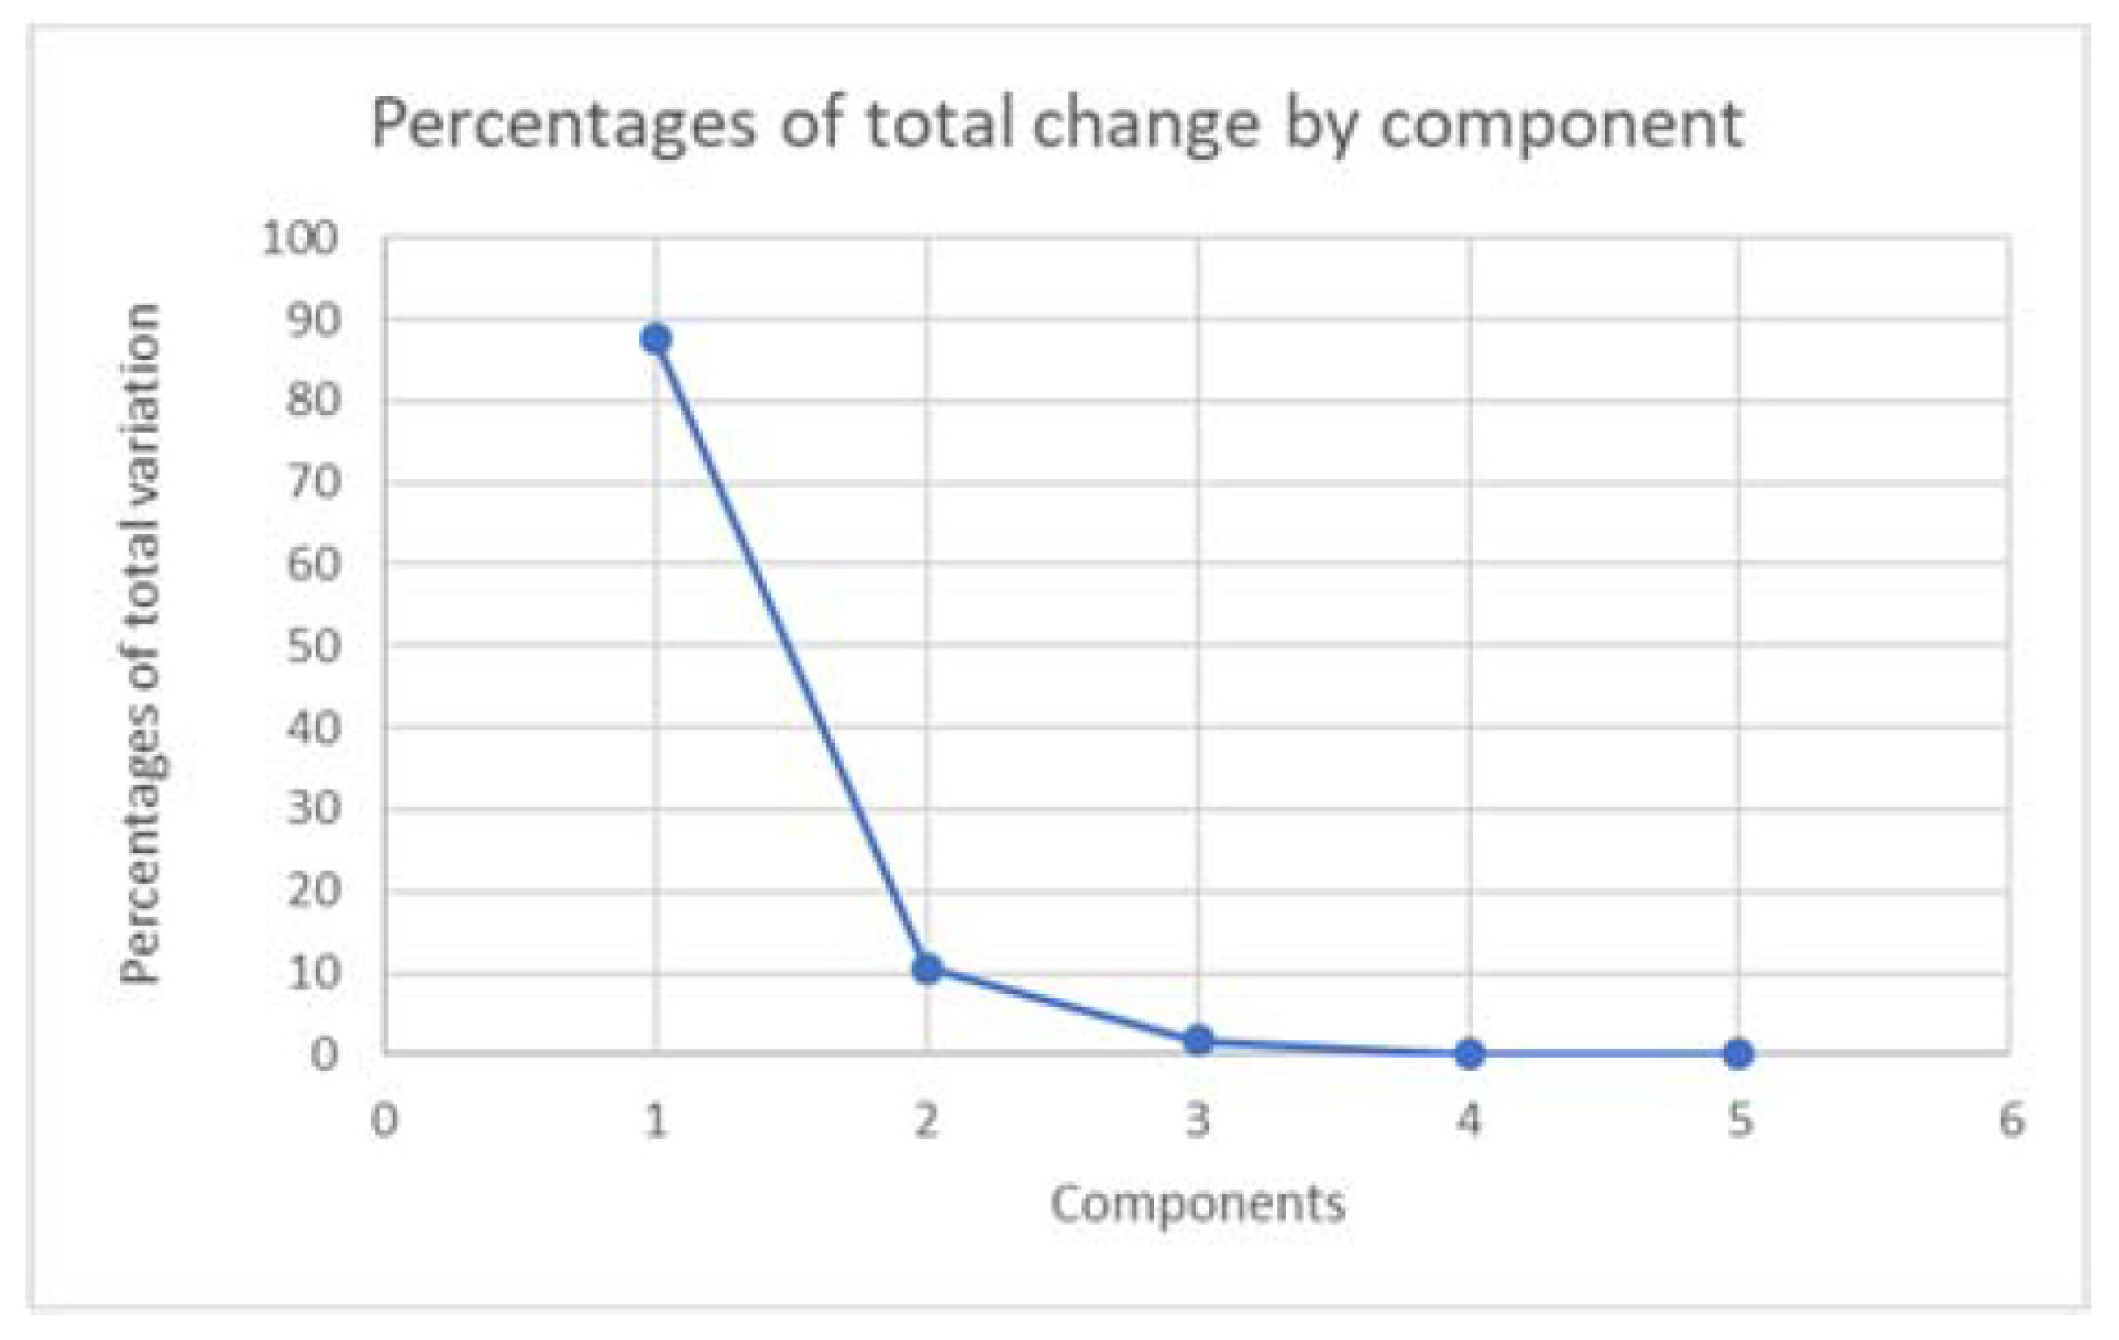
The results obtained were: (A) Percentages of the total variation for each of the five components (
Figure 3); (B) Eigenvalues and percentages of total variation (
Table 1).
The correlation between the principal components and the five bands of the sensor (
Table 2), where the best results were for Principal Component 3 with correlations of −0.61233 for Band 1 and 0.6637 for Band 5, and Component 5 with a correlation of 0.7941 for Band 2 and −0.5135 for Band 3, and by using these components we achieved separability between the vegetation cover and bare soil in the image.
4. Discussion
The analysis of principal components (PCA), as well as the application of ratios and indices of both vegetation and soils, allowed us to highlight changes in the coverage that we wanted to study. An advantage found when applying a PCA is that it was able to identify most of the different sensitivities of the bands to the various covers of the terrain, whereas on the other hand, with the application of indices, these had to be applied for each coverage [
6] we needed, taking more time for calculation, identification and comparative analysis, such as the Normalized Difference Vegetation Index (NDVI), or Soil Adjusted Vegetation Index (SAVI). Other authors [
5] established that generally, when we apply ACP in remote sensing, the bands are highly correlated, so with a smaller number of components almost all of the variability is preserved. They also highlight “That in the interpretation of the ACP results, it must be taken into account that, by performing linear transformations, the values do not correspond to ND and therefore should not be associated with the spectral response of the terrain”.
5. Conclusions
The best results were for PCA 3 with correlations of −0.61233 for Band 1 and 0.6637 for Band 5, and Component 5 with a correlation of 0.7941 for Band 2 and −0.5135 for Band 3, and by using these components we achieved a separability between the vegetation cover and the bare soil in the image.
In this case, when we use a PCA instead of a normal band of the electromagnetic spectrum of the sensor we would be interpreting the negative eigevalues in the lowest tones (close to the black color), and the positive eigevalues to the highest tones (close to the white color). In this way we can know if there are any identified fluctuations in the spectral separability of the bands with greater sensitivity to the reflectance of the vegetal vigor and to the reflectance of soils, thus allowing us to find anomalies in the patterns of spectral signatures for the covers of interest.
These preliminary results will help us to understand the dynamics in the vegetation cover of the core zone of the Cerro Azul Meámbar National Park, the management objectives and the anthropic interaction of the communities that are inside and outside the limits of the protected area, and the actions that should be taken with the citizens’ participation for the processes of conservation and the sustainable use of natural resources.
Author Contributions
Conceptualization, R.E.C. and J.G.R.; methodology, J.G.R.; software, R.E.C.; validation, J.G.R. and M.F.; formal analysis, R.E.C.; investigation, R.E.C.; resources, R.E.C.; data curation, J.G.R.; writing—original draft preparation, R.E.C.; writing—review and editing, R.E.C.; visualization, M.F.; supervision, J.G.R.; project administration, R.E.C. All authors have read and agreed to the published version of the manuscript.
Funding
This research received no external funding.
Data Availability Statement
Conflicts of Interest
The authors declare no conflict of interest.
References
- Ley de Bosques Nublados. Decreto 87-87. Available online: https://repositorio.credia.hn/handle/123456789/173 (accessed on 20 February 2023).
- Instituto Nacional de Conservación y Desarrollo Forestal, Áreas Protegidas y Vida Silvestre (ICF); Departamento de Áreas Protegidas (DAP). Plan de Manejo Parque Nacional Azul Meambar (PANACAM) 2012–2016; ICF: Tegucigalpa, Honduras, 2012; pp. 1–160.
- Midence, S.; (Proyecto Aldea Global, Siguatepeque, Comayagua, Honduras); Alvarado, I.; (Proyecto Aldea Global, Siguatepeque, Comayagua, Honduras). Personal communication, 2021.
- Portillo, H.; Secaira, E.; Lara, K. Plan de Conservación del Parque Nacional Cerro Azul Meámbar: Basado en el Análisis de Amenazas, de Situación y del Impacto del Cambio Climático; ICF, USAID ProParque and PAG: Tegucigalpa, Honduras, 2013; 52p.
- Ferrero, S.B.; Palacio, M.G.; Campanella, O.R. Análisis de componentes principales en teledetección. Consideraciones estadísticas para optimizar su interpretación. Revista de Teledetección 2002, 17, 43–54. [Google Scholar]
- Turner, M.G. Spatial and temporal analysis of landscape patterns. Landsc. Ecol. 1990, 4, 21–30. [Google Scholar] [CrossRef]
| Disclaimer/Publisher’s Note: The statements, opinions and data contained in all publications are solely those of the individual author(s) and contributor(s) and not of MDPI and/or the editor(s). MDPI and/or the editor(s) disclaim responsibility for any injury to people or property resulting from any ideas, methods, instructions or products referred to in the content. |
© 2023 by the authors. Licensee MDPI, Basel, Switzerland. This article is an open access article distributed under the terms and conditions of the Creative Commons Attribution (CC BY) license (https://creativecommons.org/licenses/by/4.0/).


