1. Introduction
According [
1,
2] in a tropospheric duct, a wave is trapped in a kind of natural guide between the earth’s surface and the layer in which the vertical gradient threshold is exceeded, or between two layers with the same condition. Due to this, the wave will propagate in jumps within the guide, with communication ranges that can reach hundreds of kilometers. While traveling through the troposphere, these waves experience a refraction due to the non-uniformity of the atmospheric layers, which manifests itself as a variation of the refractive index with height. When speaking of ducts, reference is made to the most important short-term mechanism. A troposphere duct may have a superficial or an elevated base. Taking as a starting point the research of [
3], it can be stated that the electromagnetic waves propagating in a surface-based duct bounce between the surface of the earth and the top of the duct layer. Within a high duct, the waves bounce between the top and bottom of the duct. For incoming electromagnetic waves to be trapped within a duct layer, their angle in the duct must be close to the paraxial direction or the direction of the duct.
One of the works that stands out the most in the study of tropospheric ducts with meteorological models is by [
4]. That investigation on the climatology of ducts, based on data obtained from the model of the European Center for Medium-Range Meteorological Forecasts (ECMWF), served as the basis for our extraction of the main characteristics of tropospheric ducts.
The study of ducts has also been explored by high spatial resolution simulations with mesoscalar models such as the WRF. Some of these studies, such as the one by [
5], have managed to represent the behavior of meteorological variables at the local scale. From these, a group of products focused on the detection of ducts was obtained, which were in turn used to evaluate the performance of radar observations and improve the quality of the data. In [
6], we found that the meteorological conditions of the Caribbean and more specifically of Cuba generated greater refractive gradients as a direct consequence of the occurrence of larger hypothetical ducts. In general, at the national level, research focused on the study of the occurrence of ducts is scarce, hence it is useful to study the occurrence of tropospheric duct events at the national level. Specifying what synoptic factors favor the appearance of such ducts would allow the creation of an early-warning tool.
There have been many investigations aimed at the study of ducts, but those investigations were not able to accurately determine which meteorological event generates these alterations in the atmosphere. In fact, at the international level, not many tools of this type have been found. Some are commercial and others, such as the Advanced Refractive Effects Prediction System (AREPS), are for military purposes. Several of these are implementations carried out by specialists in the Matlab software, which requires a commercial license. Furthermore, the Matlab software only provides modules with a limited number of applications, and free access is only available with DXINFO (available on [
7]). DXINFO is a web tool that provides real-time numerical forecasts of the Hepburn Tropo Index, which is an empirical index that provides information on the intensity of the pipelines. Unfortunately, the Hepburn Tropo Index has low spatial resolution and does not offer energy analysis and signal interference services.
Therefore, the development of a system for analyzing and forecasting interference in radio communications networks caused by anomalous meteorological conditions constitutes a novel study from a scientific point of view. Implementing this method will allow the generation of short, medium, and long-term alerts of possible interruptions in radio communications systems due to refractive anomalies. It is important to clarify that to our knowledge; no similar system has as yet been implemented. Therefore, research aimed at the forecast and detection of tropospheric ducts has a positive impact on the radiometeorological diagnosis of the functioning of existing communication links, representing a valuable contribution to the country’s economy. Knowledge of the meteorological conditions that can lead to the appearance of ducts can strategically support decision-making that ranges from the way antennas are installed, taking into account orientation and power parameters, to the management of the country’s telecommunications system. Knowing in advance the possibility of these events occurring allows operators to provide the public with special offers including preferential cost rates, which contribute to redirecting the flow of user connections to other types of networks that are not affected during an interruption. This enables better use of communications equipment, therefore saving material and human resources. Using a method of making predictions of the behavior of meteorological variables for an area based on meteorological models makes it possible to avoid carrying out lengthy field tests similar studies.
2. Materials and Methods
For the accomplishment of this work an ERA-5 reanalysis was used. The reanalysis provided hourly global estimates of atmospheric variables, with a horizontal resolution of 31 km and 137 hybrid (sigma/pressure) vertical levels from the surface to 0.01 hPa. The ERA5 was produced using the 4DVar data assimilation method in the Integrated Forecast System (IFS) of the European Center for Medium-Range Forecasting (ECMWF). This is the successor to the ERA-Interim reanalysis created by [
8]. These types of products provide extensive information on the state of the atmosphere and surface variables, and were built using a wide variety of meteorological observations, although it is also important to know the limitations of fields generated with this numerical model. One of the main limitations is the non-physical trends and the variability that may be present in the data series due to changes in the observation system. A second is that the climatology of some variables, such as surface energy flows, may not be well represented. Thanks to [
9], ERA5 provides daily updates; daily data are added approximately 5 days after they are gathered. Average monthly updates are available approximately 5 days after the end of the month.
Table 1 reflects a description for ERA5 reanalysis.
A group of duct parameter products and meteorological variables is available on the website [
10] for this reanalysis. They are listed below:
Duct base height.
Minimum vertical gradient of refractivity inside trapping layer.
Trapping layer top height.
Mean vertical gradient of refractivity inside trapping layer.
Trapping layer base height.
Atmospheric pressure adjusted to mean sea level.
Relative humidity at 2 m from the ground.
For this study, we used data on the occurrence of ducts obtained from records produced by the Ministry of Communications of Cuba. The incidence of ducts in a period of five years and one month (January 2017–January 2022) was recorded every day at the established synoptic times (00Z, 06Z, 12Z, 18Z). It can be affirmed that using a purely statistical method based on the Ducts History records to meet the objectives has its limitations, because these data do not constitute cases of confirmed ducts. In fact, they are generated from an algorithm that determines whether a duct has occurred. The procedure is only valid within a few kilometers of where the Key West survey is carried out, so it is not possible to establish whether the duct will really affect Cuba. Given these limitations, we decided to start using numerical modeling in this type of study. This way, in each cell of the grid it is as if there were many boreholes. This method would be much more realistic from the physical point of view.
Therefore, it was decided that to process the information from the ERA5 reanalysis and from the surveys carried out, it would be useful to write a script in the Python programming language. This script helped us combine the data obtained from both sources, achieving results more adjusted to the types of synoptic situations with conditions for the occurrence of ducts.
3. Results Discussion
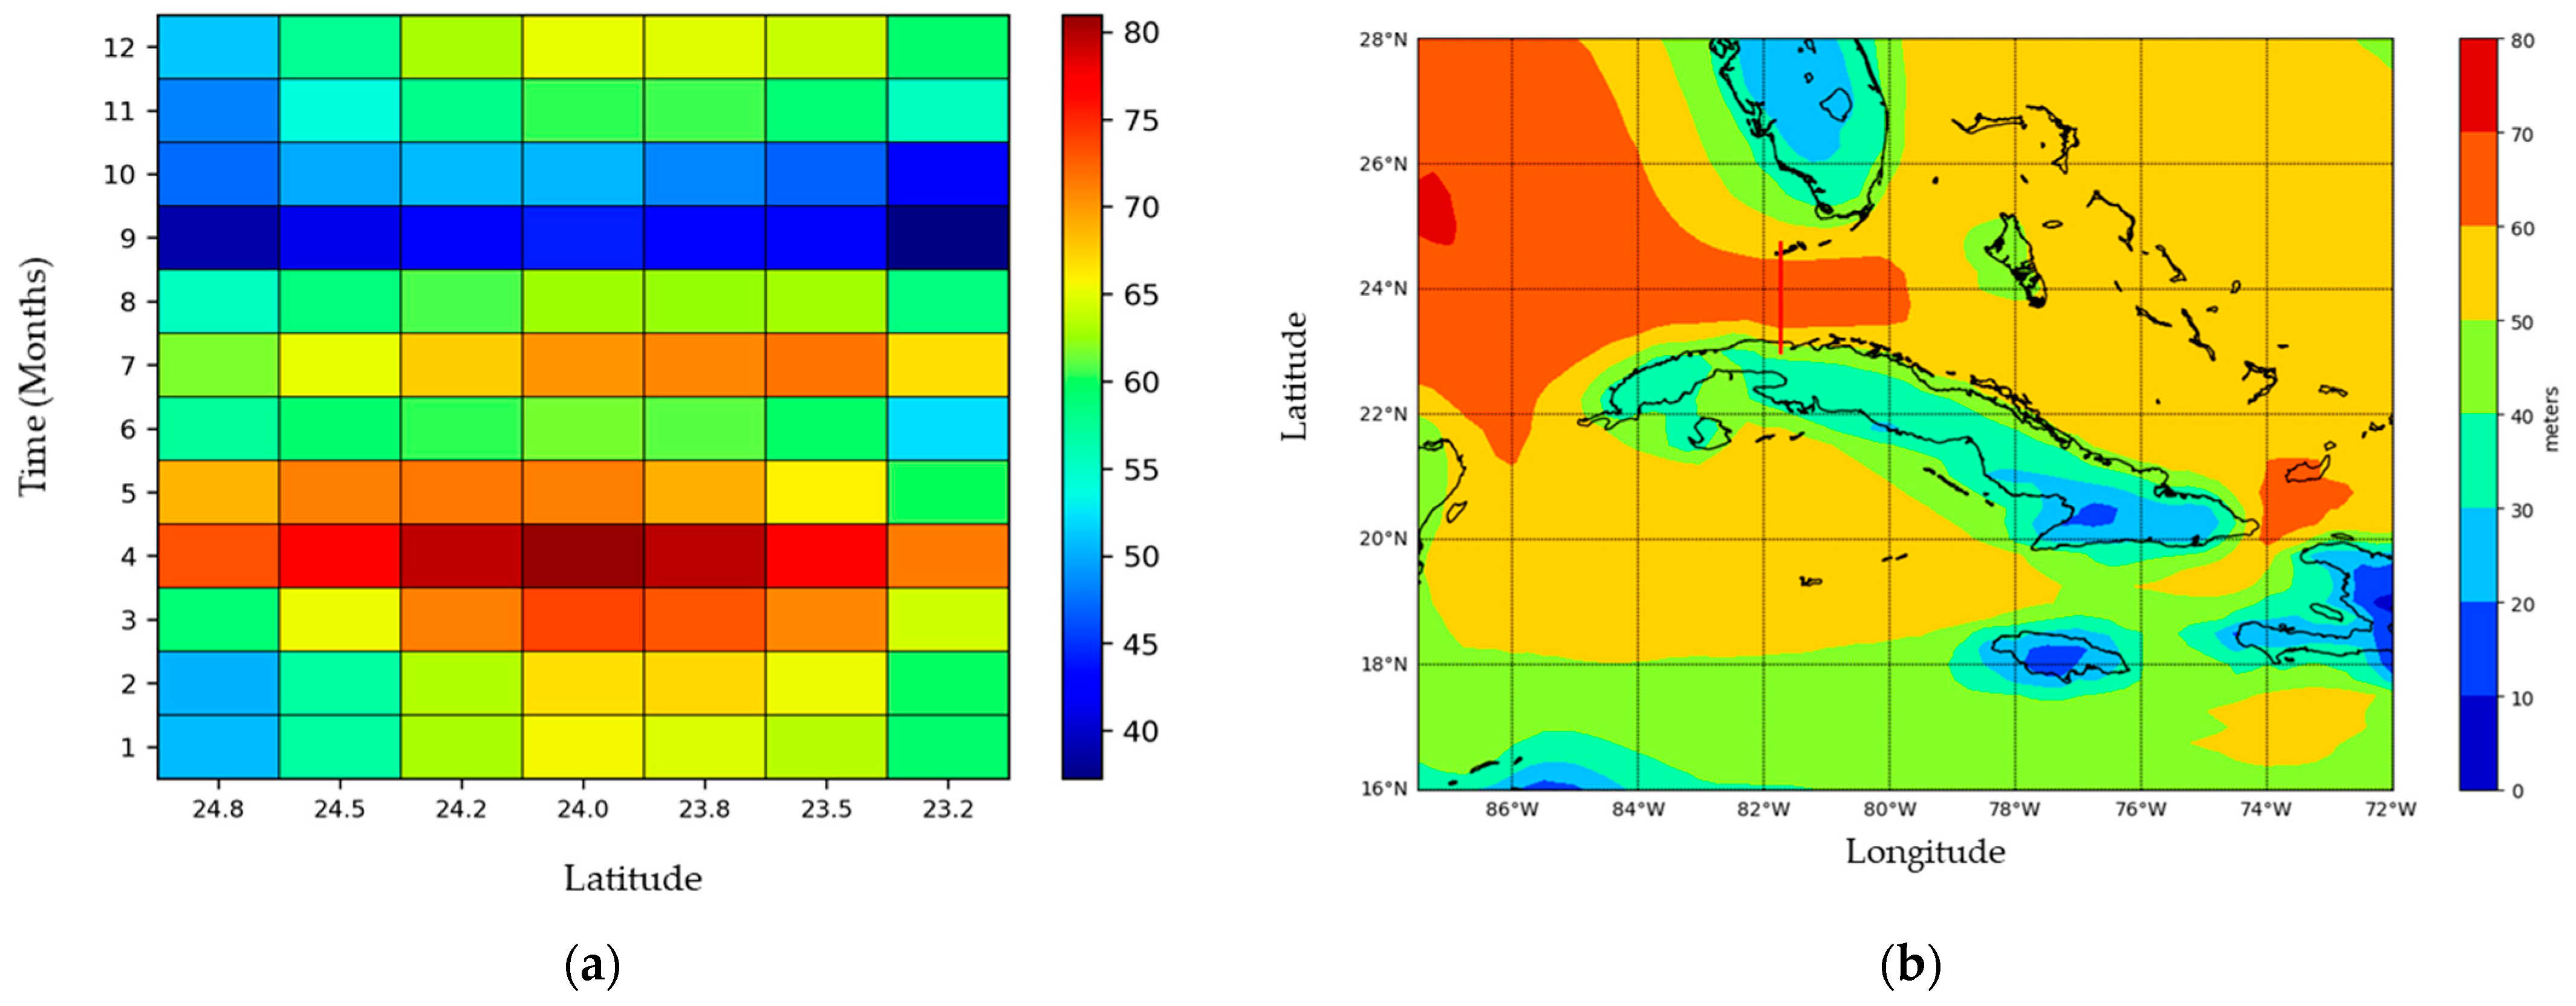
From the processing of the data series of duct parameters available in the ERA5 reanalysis using the Python programming language, the climatic behavior of these variables was obtained for the period 1981–2021. The section selected for the investigation corresponds to the Florida Straits area, due to the proximity of this area to the country’s capital, socioeconomic interests, and the impact that the occurrence of an interference in this area, which is the most populated in the country, has on communications. The selection of the cells described above allowed the plotting the ducts’ thickness segments for each month in the period between 1981–2021 (
Figure 1a), guaranteeing a better visualization of the monthly average values of the thickness of the ducts layer. Thanks to this type of graphs, it was possible to determine that in the Florida Strait, the greatest thicknesses of ducts are present during the months of March to May. The maximum values can be observed in April, where for all of the analyzed section marked with the red line in
Figure 1b, the duct layers are greater than 70 m thick on average. In this analysis, it is important to consider that the highest thicknesses are also associated with more intense ducts. It was possible to show from these maps that the greatest thicknesses occur at this time of the year, with average maximum values of 90 m in the months of April. To generalize the variable in question,
Figure 1b was prepared. It reflects the mean annual behavior of the ducts layer thickness around the archipelago. It is observed that the highest thickness values are located in the Yucatan Channel, the Florida Strait, and in Paso de los Vientos.
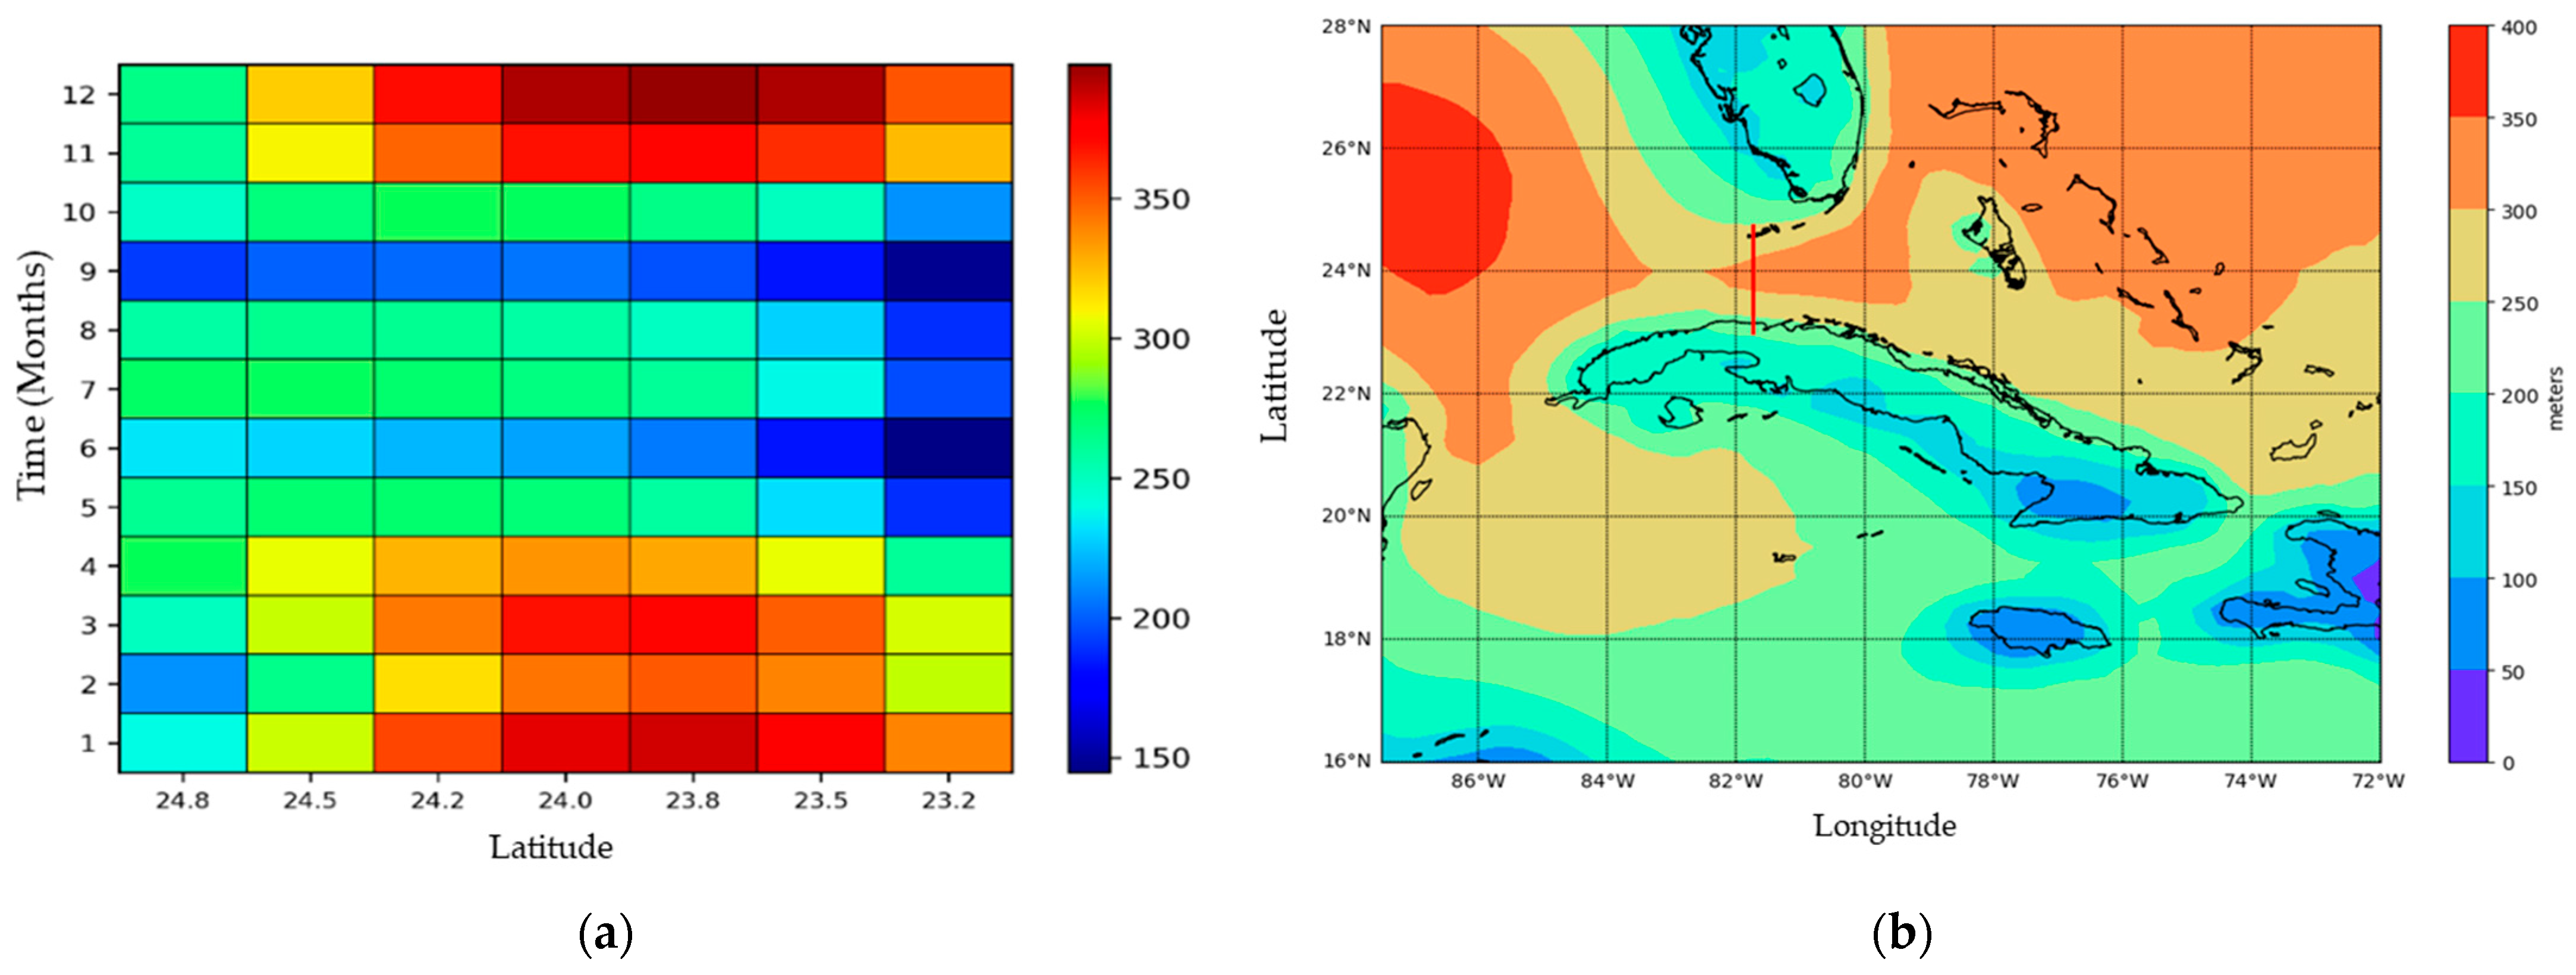
During the months included in the rainy season (May, June, July, August, September, and October) there is a predominance of the occurrence of ducts in which the mean height of the layer oscillates between approximately 150 m and 300 m, while during the dry period (January, February, March, and December) these heights are higher, generally between 300 m and 400 m.
This situation occurs because in this period there is a humid layer at low levels. In addition, throughout this time there is more instability and less stratification of the atmosphere, the influence of which causes less thermal stratification to predominate. Therefore, the incidence of the elevated ducts will be less compared to the incidence of surface ducts. The absence of forcing phenomena that generate uplift also makes it possible for the ducts to occur at lower heights in this period. When dry air predominates on the surface due to the advance of frontal systems over the Gulf of Mexico, the Florida Peninsula, and the Atlantic Ocean, it generates an uplift of this humid layer (
Figure 2). For this reason, the humid layer is not located only on the surface. That is why when the monthly averages of the height of the duct base are obtained (
Figure 3a) there are moments in the months of the dry season when the height of the base reaches high values (greater than 350 m) and others in which the values decrease (to between 150 m and 250 m). When analyzing this same variable, taking into account its behavior during an entire year, as shown in
Figure 3b, it is seen that during the year the average values of duct height range between 250 m and 350 m to the north and west of Cuba. The values are smaller to the south of the island.
Several studies have shown that the frequency of the occurrence of tropospheric ducts has a variable behavior and is dependent on factors such as geographic position, weather conditions, and time of year.
Figure 4a shows that in the case of Cuba and adjacent seas, this variable has an average annual behavior that presents values close to 0.56 higher in the Straits of Florida, southeast of the Gulf of Mexico, and southwest of Granma. When analyzing the sequence of maps corresponding to the average frequency of the occurrence of ducts in the period 1981–2021, it was observed that there was a tendency to increase in this variable in the last 10 years of the period (
Figure 4b). This happened because in recent years an observed expansion in the Atlantic Subtropical Anticyclone. Due to this change in circulation, the number of days with predominating stable atmospheric conditions has increased [
12].
When analyzing the average frequency of ducts by month of the year, it is noticeable that during the March-August semester there is an increase in this variable in the seas adjacent to the entire Cuban archipelago (
Figure 5). The seas to the east of the eastern provinces are where the highest frequency of the occurrence of these events are observed, with values above 0.85 in the month of July. On the other hand, the areas to the north of the western region show maximum values above 0.66 in the months of April and July.
Identification of the Meteorological Systems Present in the Synoptic Situations Taken from the Record of Days with Ducts Conditions between 2017–2021
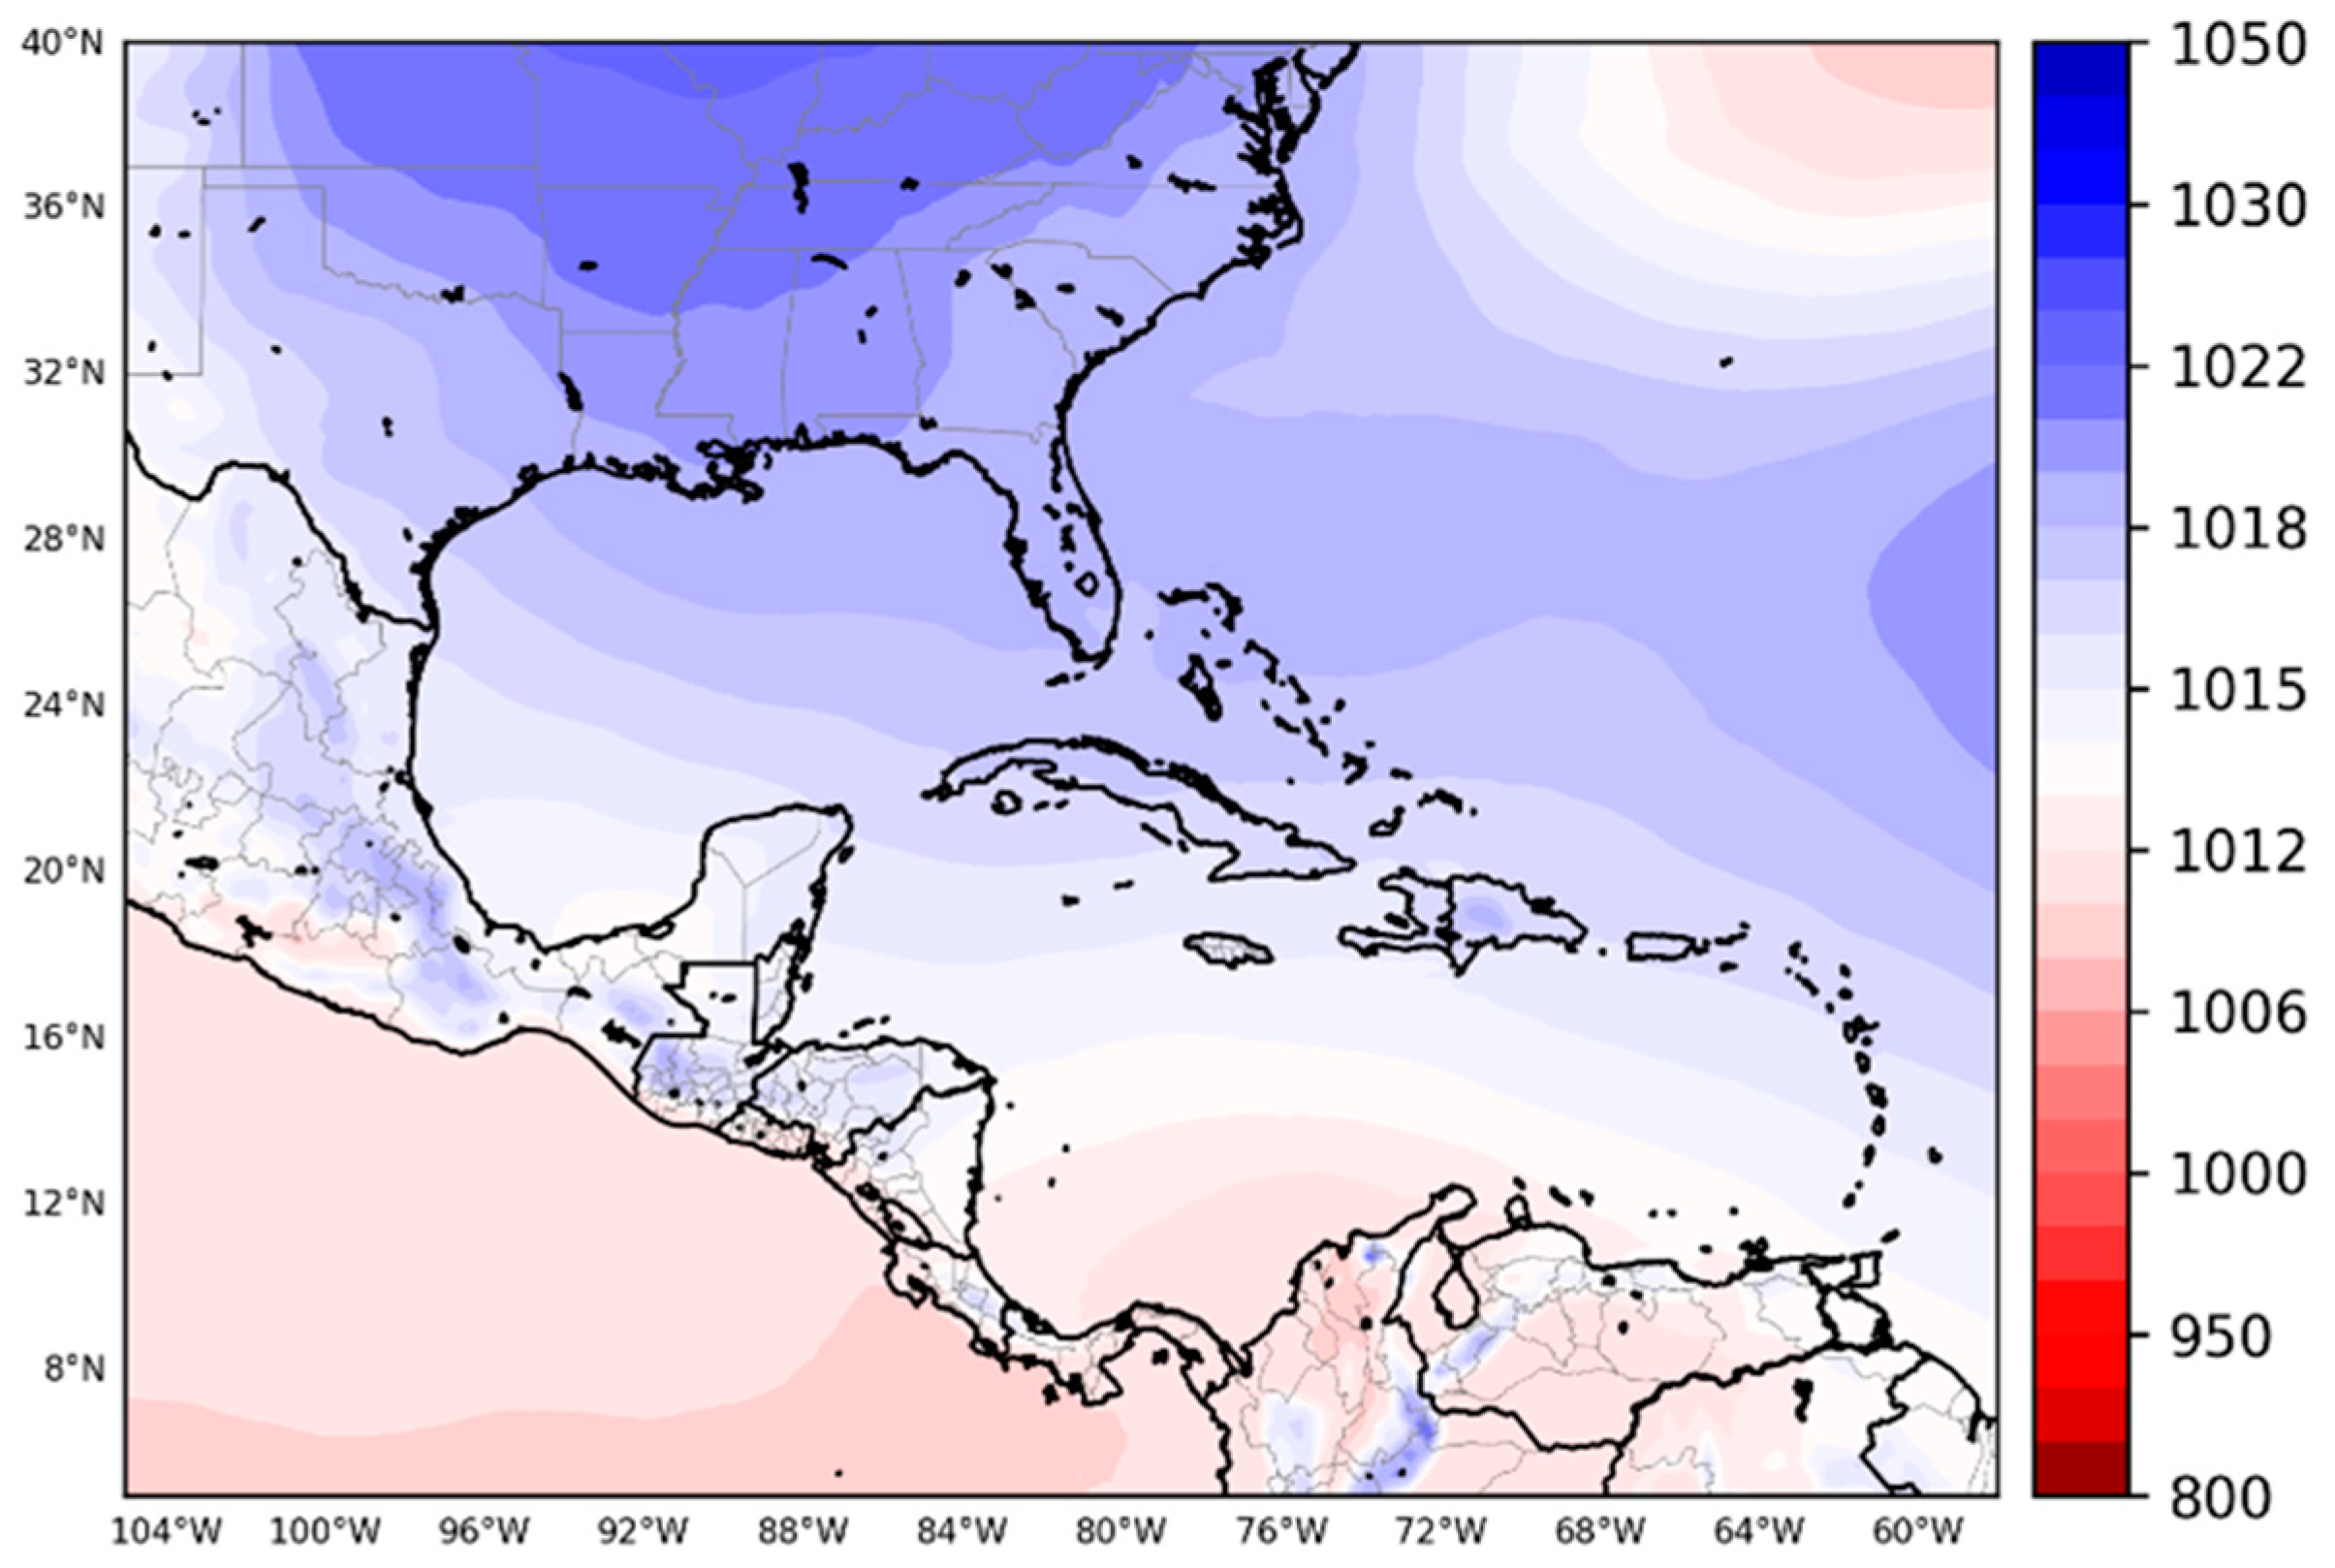
The Caribbean geographic basin is subject to the influence of continental anticyclones during the winter period. The centers that move to the southern part of the United States cause intense cold air transport from the center of the United States to the western half of Cuba. During this displacement process, the migratory air mass changes slightly. Consequently, it loses its representation on the surface and ends up being absorbed by the Atlantic Subtropical Anticyclone. The presence of these secondary centers of high pressure favors subsidence, helping moisture to accumulate on the surface. In March, when the subtropical anticyclone is withdrawn, a certain homogeneity is created between its ridge and the ridge of the migratory anticyclone (
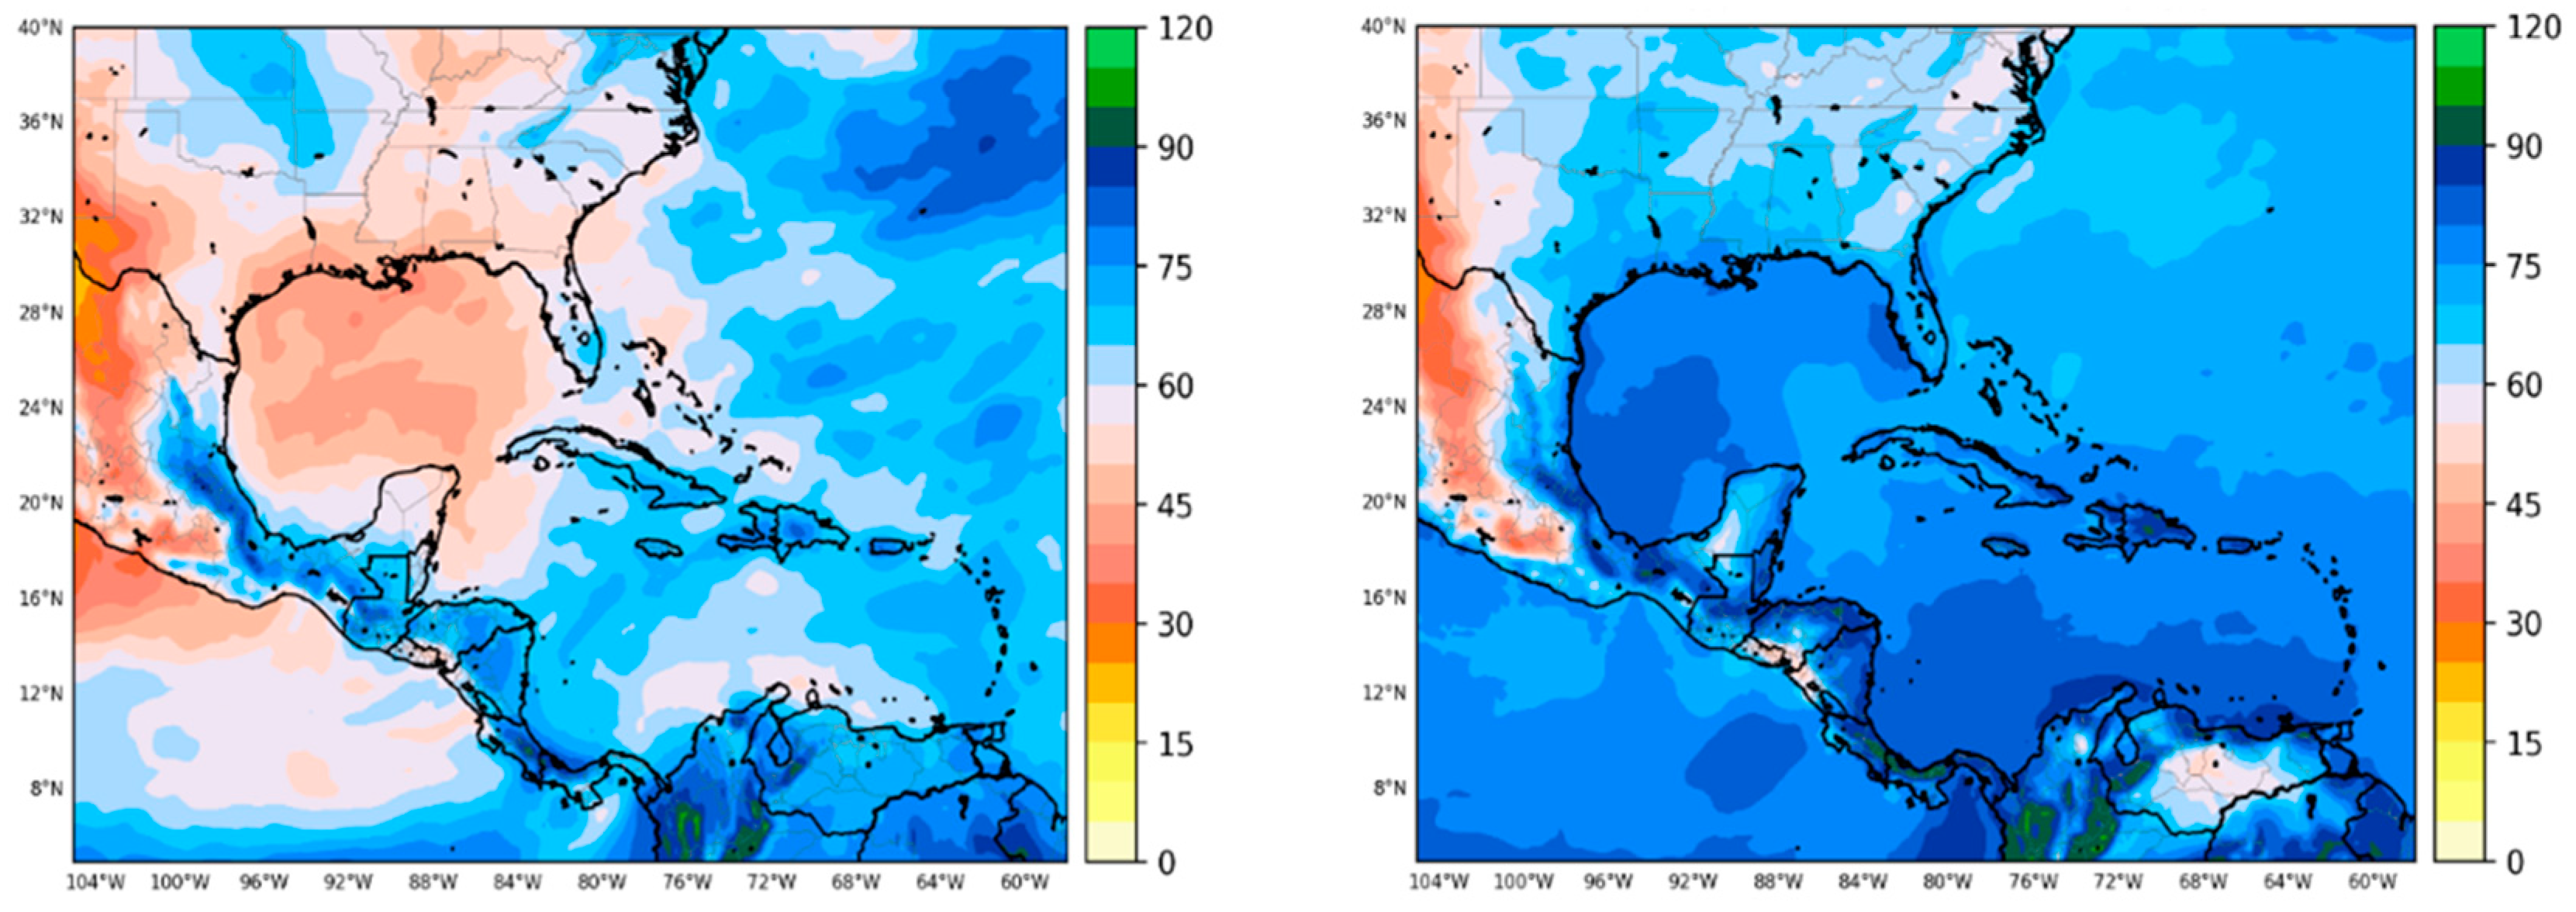
Figure 6). The latter is also weakened. Therefore, successive processes of air mass replacement begin to emerge. Since this cycle is repeated, an accumulation of air creates a dry layer in the heights, confining the humidity to the surface (
Figure 7).
In the months of June and July, the subtropical anticyclone reaches its maximum expansion in the ridge. During this period, there is no influence of migratory anticyclones either, but these months coincide with the maximum intensity and frequency of the tropical waves from the east, generating a pattern very similar to that observed in the month of March. It is well known that there is a divergence in front of the wave axis, and behind it there is convergence with southeasterly winds. When these waves approach Cuba, the divergence causes subsiding movements and good weather. Conditions of stability and east-northeast winds cause a layer of dry air to originate at height, which helps moisture accumulate on the surface. With the arrival of the month of August, the Subtropical Anticyclone begins to withdraw again to begin its interaction with the migratory anticyclones during the winter season.
4. Conclusions
In this investigation, we demonstrated that an ERA5 reanalysis to determine the behavior of the parameters associated with the tropospheric ducts in the area of the Caribbean Sea, Gulf of Mexico, and Florida Strait was feasible. It can be affirmed that in the period between 1981–2021, the greatest thicknesses of the ducts were observed during the March–May quarter. Average layer thicknesses between approximately 75 m and 80 m were reached in the March–May quarter. September and October were the months of lowest thickness, with mean values that oscillated between 40 m and 45 m. Based on the mean height values of the duct base, it shows that surface ducts are more frequent in the rainy months. In the dry season, although this type of ducts can also occur, elevated ducts predominate. The presence of atmospheric stability and the combination of a humid layer at low levels with a dry layer at altitude favors the formation of tropospheric ducts, increasing the possibility of interference in communications. The synoptic situations that most strongly influence the formation of tropospheric ducts are the interaction of the Atlantic Subtropical Anticyclone with migratory anticyclones during the winter period (mainly in the March–May quarter) and the interaction of the Atlantic Subtropical Anticyclone with eastern tropical waves during the month of July. These conditions allow a layer with relative humidity between 75% and 80% to exist on the surface, followed by a drier layer where the relative humidity does not exceed 70%.


 ,
, 


