1. Introduction
Agriculture is extremely sensitive to climate variability. Increases in temperature reduce yields and encourage pest proliferation, while decreases in precipitation patterns increase the likelihood of long-run production declines. Globally, olive cultivation is approximately limited between 30° to 45° parallels [
1]. According to Pliny the Elder [
2], Theophrastus defined the geographical boundaries of olive cultivation as a distance of no more than 300 stadia (53 km) from the Mediterranean coast, and Fabianus stated that the olive tree cannot grow in either very cold or very hot climates. Temperature is one of the main factors affecting olives’ phenological stages, controlling the emergence of the spring bud. Certain chilling unit requirements are essential to induce flower bud differentiation and flowering [
3], and they can explain the low rates of flowering in warm winter areas. Another important climate parameter is precipitation. About 90 percent of the olives in the Mediterranean Basin are grown mainly in dry and hot regions [
4,
5]. Although olives are drought-tolerant trees, their spread is limited in climatic zones where annual rainfall is lower than 350 mm [
6].
Recent studies show that olive trees can be significantly affected by climate change [
7]. The projected increase in temperatures may increase the length of the growing season [
8] resulting in changes in phenological stages, such as flowering [
9,
10]. Apart from the increase in temperature, the availability of water is also a critical point for olive production [
11]. Fraga et al. [
12], in a relevant study on the Portuguese region, demonstrated that changes in rainfall and evapotranspiration could lead to a general decline in olive tree yields by 2080. The present study aims to analyze the impacts of climate change on the olive tree of Chalkidiki, one of the most important olive cultivation regions in Greece.
2. Data and Methodology
Climate data of maximum and minimum temperature (°C), precipitation (mm), wind speed (m/sec), relative humidity (%), and solar radiation (W m
−2) were obtained from the Copernicus database (
https://cds.climate.copernicus.eu/cdsapp#!/dataset/reanalysis-era5-land?tab=overview, accessed on 15 January 2023). Re-analysis data from the ERA5 land and regional climate model data RCA4 from the Swedish Meteorological and Hydrological Institute (SMHI) were used. The climate data cover the reference period from 1981 to 2020 and two future time periods: 2031–2050 and 2051–2070 and cover the region of Halkidiki. The spatial resolution of ERA5 land is 0.1°, and of SMHI data, it is 0.11° (12 km).
The main methodological steps include (a) the calculation of reference evapotranspiration (eTo); (b) the estimation of crop evapotranspiration (eTc) and net irrigation requirements for different irrigation scenarios; and (c) the estimation of chilling units.
Many methods for calculating evapotranspiration, using meteorological data, have been developed over the last 50 years by many experts and scientists around the world. The FAO Penman–Monteith method is maintained as the only standard method for calculating evapotranspiration of reference culture (eTo) from meteorological data and is described by the equation below (1):
The model for calculating cold units used in this study is the Chandler model of chilling hours [
13,
14], which sums up all hours with temperatures between 0 and 7.2 °C.
3. Results
3.1. Climatic Characteristics of Halkidiki
The mean monthly and annual temperatures for all grids as well as for their ensemble were calculated to study the intra-annual variability of temperature parameters in the region of Halkidiki. Noticeable is the increased trend of annual temperature (
Figure 1) according to ERA5 land data; temperatures at the beginning of the period are close to 15 °C, and at the end of the study period, they are close to 16 °C.
Table 1 presents the mean monthly temperature for the ensemble grid of Halkidiki for the reference period (1981–2000) based on the ERA5 re-analysis as well as the RCA4 (from SMHI) RCM and the two future periods according to the two climatic scenarios based on RCA4 RCM. The mean annual temperature for the ensemble grid of Halkidiki is projected to increase by almost 1.5 °C according to the RCP4.5 scenario and 2.5 °C according to the RCP8.5 scenario by the end of the study period. The spatial analysis of the differences in annual temperature between the reference period and the two future periods (not shown) shows that for the RCP4.5 scenario, there will be a more uniform temperature increase in all areas of Halkidiki of 1.5 °C to 2.0 °C.
The annual rainfall variability for the region of Halkidiki presents a slightly increasing trend which is not statistically significant.
Figure 2 shows that September has seen a significant increase in rainfall over the last twenty years, and October is the month with the most intense extreme rainfall, resulting in an overall increase in rainfall in the autumn season. From the results of the regional climate model, the mean annual rainfall for the period 1981–2000 for the Halkidiki ensemble grid of 587 mm is projected to decrease by almost 90 mm in the next decade (2031–2050) but then stabilize close to the average rainfall according to the RCP 4.5 scenario. Conversely, under RCP8.5, the annual rainfall of Halkidiki seems to show a decrease ranging from 5% to 15% depending on the future decade.
3.2. Bioclimatic Characteristics of Olive in Halkidiki
The spatial distribution of monthly evapotranspiration (ET) is shown in
Figure 3 for the reference period and the two future periods (2031–2050 and 2051–2070). By the end of the study period, evapotranspiration appears to increase at a different rate depending on the month and climate. Indicatively, according to RCP8.5, for the month of May, evapotranspiration will show an average increase of 40% in almost the entire region of Halkidiki (
Figure 3). For the summer months, the increase will be in the order of 20% except for the three peninsulas where it will be slightly smaller.
The spatial distribution of irrigation needs for olive trees in the region of Halkidiki is presented in
Figure 4 for the reference period and future periods. The greatest water needs are observed in the south–southwestern regions of Halkidiki, which are characterized as dry regions. In these areas, olive groves require a very large amount of water, which may not be available in the future. Water needs for olive cultivation are expected to increase by 2070 everywhere in Halkidiki. According to RCP8.5, a total increase of 150–250 mm of approximately 25–35% is estimated throughout the region of Halkidiki, depending on the future decade. It is important to mention that there will also be a need for irrigation in areas where in the reference period they had relative adequacy. The north-central part of Halkidiki shows the largest increase in water needs (up to 200 mm), while in southern Halkidiki, water requirements will increase up to 100–150 mm per season. A similar increase in water requirements for the crop is expected with the RPC4.5 scenario.
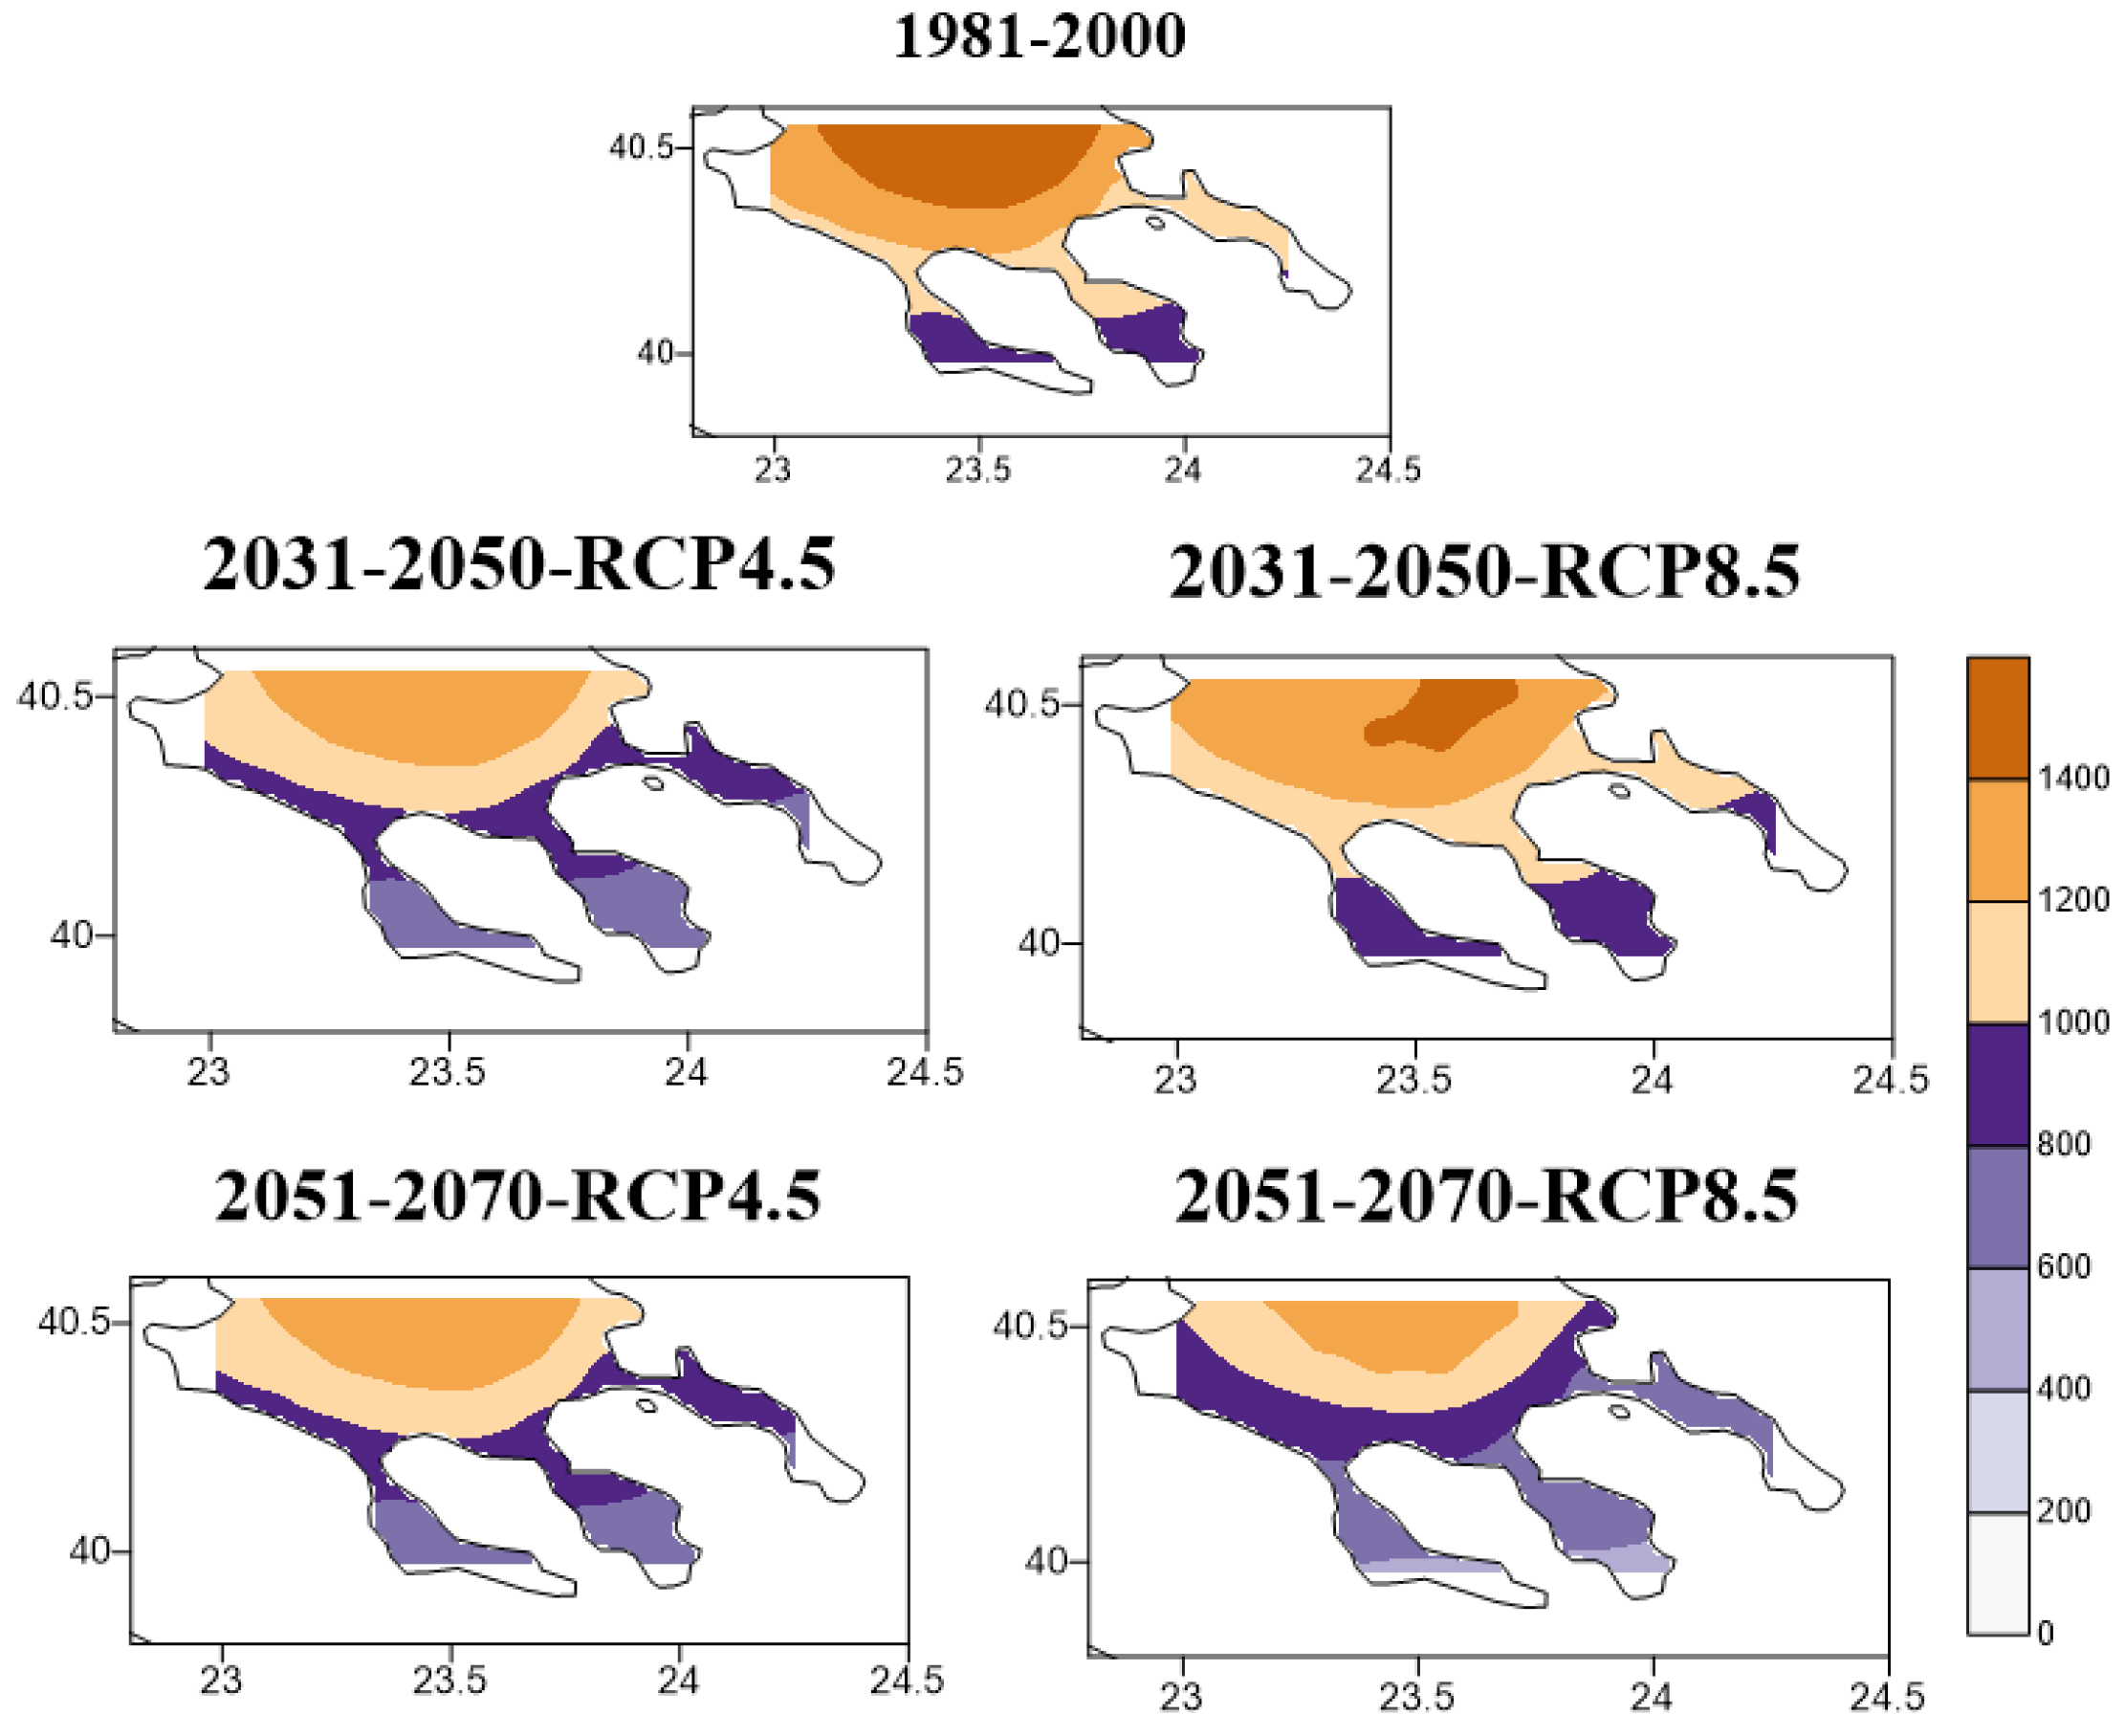
A decrease in chilling units is projected in future decades (
Figure 4) throughout the region of Halkidiki suitable for olive cultivation due to the projected temperature increase. The chilling units estimated by the Chandler model for the ensemble grid of Halkidiki reach almost 1200 units (
Figure 4) on average. In Halkidiki, the flowering of olives is recorded between April and May. The olive flowering dates are very close to dates reported in previous studies for different regions in the Mediterranean [
15]. In winter, olive trees require special chilling units to interrupt bud lethargy [
7]. This time period during which the chilling units are met is known as endodormancy. For the future decades, it is clear that due to the increase in the minimum temperature for the majority of years, olive trees will not meet the necessary chilling units to stop the lethargy of the olive blossom buds.
4. Conclusions
The aim of the present study was to analyze the impact of climate change on olive cultivation in the region of Halkidiki. The data used in this research are the climate data of the regional climate model, SMHI for both climate scenarios, the optimistic RCP4.5 and the pessimistic RCP8.5, as well as ERA5 land data for the historical period of 1981–2000. Some of the most important findings emerging from this study are that according to ERA5 land data, the average air temperature over Halkidiki shows an increase of 1.0 °C during the reference period 1981–2000.
There is an increase in average temperature of 1.5–2 °C according to the RCP 4.5 climate scenario. The corresponding increase for the RCP 8.5 climate scenario is around 3 °C.
There is a reduction in the rainfall regime in the region of Halkidiki, with most continental areas undergoing the greatest changes.
The main areas of olive cultivation are located in the driest areas of Halkidiki with high demands for irrigation. The deficit of available irrigation water will become more intense in the coming decades.
In the winter season, the minimum temperature will increase, resulting in the inability to accumulate the appropriate chilling units for achieving satisfactory levels of vernalization and flowering of the olive tree.
For the future period of 2031–2070, non-irrigated olive crops cannot be maintained in the Halkidiki region in terms of economic sustainability. We conclude that climate change may negatively impact the viability of olive groves in Halkidiki. Thus, adequate and timely planning of suitable adaptation measures is needed to ensure the sustainability of the olive sector.
Author Contributions
Conceptualization, I.K. and C.A.; methodology, I.K. and C.A.; software, E.M.M. and C.A.; validation, I.K., E.M.M. and C.A.; formal analysis, I.K., E.M.M. and C.A.; investigation, I.K., E.M.M. and C.A.; resources, I.K. and C.A.; data curation, E.M.M. and C.A.; writing—original draft preparation, I.K.; writing—review and editing, I.K., E.M.M., and C.A.; supervision, I.K. All authors have read and agreed to the published version of the manuscript.
Funding
This research was funded by National Grants supported by Halkidiki Chamber, Greece under the agreement No. 75085.
Institutional Review Board Statement
Not applicable.
Informed Consent Statement
Not applicable.
Data Availability Statement
The data presented in this study are available from the corresponding author upon reasonable request.
Conflicts of Interest
The authors declare no conflict of interest.
References
- Therios, I.N. Olives; CABI: Oxfordshire, UK, 2009; Volume 18. [Google Scholar]
- Doody, A. Pliny’s Encyclopedia: The Reception of the Natural History; Cambridge University Press: Cambridge, UK, 2010. [Google Scholar]
- Ayerza, R.; Sibbett, G.S. Thermal adaptability of olive (Olea europaea L.) to the Arid Chaco of Argentina. Agric. Ecosyst. Environ. 2001, 84, 277–285. [Google Scholar] [CrossRef]
- Gómez, J.A.; Giráldez, J.V.; Fereres, E. Rainfall interception by olive trees in relation to leaf area. Agric. Water Manag. 2001, 49, 65–76. [Google Scholar] [CrossRef]
- Gomez-Rico, A.; Salvador, M.D.; Moriana, A.; Perez, D.; Olmedilla, N.; Ribas, F.; Fregapane, G. Influence of different irrigation strategies in a traditional Cornicabra cv. olive orchard on virgin olive oil composition and quality. Food Chem. 2007, 100, 568–578. [Google Scholar] [CrossRef]
- Ponti, L.; Gutierrez, A.P.; Ruti, P.M.; Dell’Aquila, A. Fine-scale ecological and economic assessment of climate change on olive in the Mediterranean Basin reveals winners and losers. Proc. Natl. Acad. Sci. USA 2014, 111, 5598–5603. [Google Scholar] [CrossRef] [PubMed]
- Orlandi, F.; Ruga, L.; Romano, B.; Fornaciari, M. Olive flowering as an indicator of local climatic changes. Appl. Climatol. 2005, 81, 169–176. [Google Scholar] [CrossRef]
- Pérez-López, D.; Ribas, F.; Moriana, A.; Rapoport, H.F.; De Juan, A. Influence of temperature on the growth and development of olive (Olea europaea L.) trees. J. Hortic. Sci. Biotechnol. 2008, 83, 171–176. [Google Scholar] [CrossRef]
- Avolio, E.; Orlandi, F.; Bellecci, C.; Fornaciari, M.; Federico, S. Assessment of the impact of climate change on the olive flowering in Calabria (southern Italy). Theor. Appl. Climatol. 2012, 107, 531–540. [Google Scholar] [CrossRef]
- Aguilera, F.; Fornaciari, M.; Ruiz-Valenzuela, L.; Galán, C.; Msallem, M.; Dhiab, A.B.; de la Guardia, C.D.; del Mar Trigo, M.; Bonofiglio, T.; Orlandi, F. Phenological models to predict the main flowering phases of olive (Olea europaea L.) along a latitudinal and longitudinal gradient across the Mediterranean region. Int. J. Biometeorol. 2015, 59, 629–641. [Google Scholar] [CrossRef] [PubMed]
- Iglesias, A.; Garrote, L. Adaptation strategies for agricultural water management under climate change in Europe. Agric. Water Manag. 2015, 155, 113–124. [Google Scholar] [CrossRef]
- Fraga, H.; Pinto, J.G.; Santos, J.A. Olive tree irrigation as a climate change adaptation measure in Alentejo, Portugal. Agric. Water Manag. 2020, 237, 106193. [Google Scholar] [CrossRef]
- Henry, C.W. Deciduous Orchards; Lea & Febriger: Philadephia, PA, USA, 1942. [Google Scholar]
- Gabaldón-Leal, C.; Ruiz-Ramos, M.; de la Rosa, R.; León, L.; Belaj, A.; Rodríguez, A.; Santos, C.; Lorite, I.J. Impact of changes in mean and extreme temperatures caused by climate change on olive flowering in southern Spain. Int. J. Clim. 2017, 37, 940–957. [Google Scholar] [CrossRef]
- Tanasijevic, L.; Todorovic, M.; Pereira, L.S.; Pizzigalli, C.; Lionello, P. Impacts of climate change on olive crop evapotranspiration and irrigation requirements in the Mediterranean region. Agric. Water Manag. 2014, 144, 54–68. [Google Scholar] [CrossRef]
| Disclaimer/Publisher’s Note: The statements, opinions and data contained in all publications are solely those of the individual author(s) and contributor(s) and not of MDPI and/or the editor(s). MDPI and/or the editor(s) disclaim responsibility for any injury to people or property resulting from any ideas, methods, instructions or products referred to in the content. |
© 2023 by the authors. Licensee MDPI, Basel, Switzerland. This article is an open access article distributed under the terms and conditions of the Creative Commons Attribution (CC BY) license (https://creativecommons.org/licenses/by/4.0/).


