Next Article in Journal
The Impact of Climate Change on Olive Crop Production in Halkidiki, Greece
Previous Article in Journal
Synoptic, Dynamic Analysis and Numerical Simulations of Extreme Flood Cases in Pieria Region
 
 
Please note that, as of 4 December 2024, Environmental Sciences Proceedings has been renamed to Environmental and Earth Sciences Proceedings and is now published here.
Proceeding Paper

The Non-Boussinesq Taylor–Caulfield Instability †

by
Theodoros Tolidis
1,* and
Nikolaos A. Bakas
2
1
Department of Meteorology and Climatology, Aristotle University of Thessaloniki (AUTH), 54124 Thessaloniki, Greece
2
Laboratory of Meteorology and Climatology, Department of Physics, University of Ioannina, 45110 Ioannina, Greece
*
Author to whom correspondence should be addressed.
Presented at the 16th International Conference on Meteorology, Climatology and Atmospheric Physics—COMECAP 2023, Athens, Greece, 25–29 September 2023.
Environ. Sci. Proc. 2023, 26(1), 66; https://doi.org/10.3390/environsciproc2023026066
Published: 25 August 2023

Abstract

:
The study of the conditions under which a stratified shear flow becomes turbulent is important, as turbulence is the source of mixing and dissipation in the atmosphere and can significantly influence the momentum and temperature structure of the atmospheric circulation. Oftentimes, the density structure of atmospheric flows is organized in thick layers of constant density separated by thin layers of sharp density gradients. It has been shown by previous studies that such multilayered flows can become unstable under shear. In this work, we investigate Taylor–Caulfield Instability (TCI), which occurs in a three-layer fluid moving with a constant shear flow. Previous studies examined the instability under the Boussinesq approximation, which is not expected to hold in cases of sharp density gradients. The non-Boussinesq limit is therefore investigated in this work. TCI is studied using the classical perturbation theory, that is by examining the evolution of small perturbations to the base flow. The wavelength of the waves expected to dominate the flow as well as the time in which these waves will emerge are calculated. In addition, the characteristics of the unstable waves are studied under a variety of conditions for the shear and the stratification. It is found that under the Boussinesq approximation, the wavelength of the instability waves is underestimated and the time for the evolution of the waves is overestimated.

1. Introduction

Stratified shear instability is one of the main contributors of turbulence and mixing in the atmosphere. The understanding of the mechanisms and the evolution of the instability, as well as the efficiency of the produced mixing, are important in several phenomena such as urban pollution, sporadic mixing and the breaking of gravity waves. Therefore, there has been an enormous amount of research related to theoretical, numerical as well as observational aspects of the instability [1].
The necessary conditions for the instability of shear flows as well as the initial stage of evolution can be addressed using the perturbation theory, which was first introduced in 1880 by Rayleigh [2]. This method predicts the scale as well as the e-folding time of exponentially growing perturbations with an initially small amplitude that are expected to emerge and dominate the flow once their amplitude becomes large. These structures often take the shape of cusps or elliptical vortices such as the widely known Kelvin–Helmholtz billows.
There are three main types of stratified shear instability. The first is Kelvin–Helmholtz instability occurring when the density varies on scales much larger than the scale of the shear layer [3]. The second is Holmboe instability occurring when the density varies on scales shorter than the scale of the shear layer [4]. The third occurs in cases of a stratified fluid with multiple layers of constant density separated by sharp density gradients. Taylor first studied this instability by considering a constant shear flow in a fluid consisting of three layers of finite depth each [5]. Caulfield later investigated the instability of the same layered fluid but with varying shear [6,7]. The emerging instability is therefore termed as Taylor–Caulfield Instability (TCI) and is the focal point of this work.
The study of TCI is typically performed by employing the Boussinesq approximation, according to which the terms involving density variations in the flow are considered to be much smaller than the inertial terms and are ignored everywhere except in the buoyancy. However, in cases of realistic atmospheric multi-layered flows, the density gradients separating the homogeneous layers can be large and such an approximation might not be justified. In this work, we undertake the task of fully taking these gradients into account and investigate the Taylor–Caulfield Instability in the non-Boussinesq limit. Specifically, we consider Taylor’s initial setting with a three-layer fluid under a constant shear and study the evolution of small amplitude perturbations superposed on this flow. The goal is to investigate the conditions of the TCI and the characteristics of the emerging waves such as their spatial scale and the time scale for their evolution and to compare these characteristics to the corresponding characteristics obtained in the Boussinesq limit.

2. Perturbation Method

Consider an incompressible, inviscid, parallel shear flow with wind speed
U ~ z ~ = s z ~ ,
where s is the shear and the tildes denote dimensional variables. The fluid consists of three layers of different densities with a vertical density profile described using the following function:
ρ ~ ( z ~ ) = ρ 0 Δ ρ ,               z ~ > h 2 ρ 0 ,                       z ~ h 2 ρ 0 + Δ ρ ,               z ~ < h 2 ,
where ρ 0 is the mean density, Δ ρ is the density difference between adjacent layers and h is the depth of the middle layer. Both of these profiles are shown in Figure 1.
This state, that is hydrostatically balanced with the pressure P ~ ( z ~ ) , is an equilibrium of the Euler and the continuity equations for the atmospheric motions. In order to examine the stability of this equilibrium, we consider small perturbations around this state for the wind speed u ~ = ( U ~ z ~ + u ~ x j , u ~ z j ) and the pressure p ~ j = P ~ z ~ + p ~ j in the j = 1 (lower), j = 2 (middle) and j = 3 (upper) layers. The non-dimensional, linearized equations governing the evolution of small perturbations are
ρ j u x j t + z u x j x + u z j = p j x ,
ρ j u z j t + z u z j x = p j z ,
u x j x + u z j z = 0 ,
where functions without the tildes denote non-dimensional variables, and the density is ρ j = 2 j Δ + 1 with Δ = Δ ρ / ρ 0 being the relative density jump across the interfaces. The equations were non-dimensionalized assuming the depth of the middle layer h as the length scale, s h as the velocity scale, the advection time 1 / s as the time scale, the mean density ρ 0 as the density scale and ρ 0 ( s h ) 2 as the pressure scale. When the density jump is small Δ 1 , the mean density can be taken to be homogeneous. This is the Boussinesq approximation that is typically employed in studies of the TCI.
At the two interfaces separating the three layers z = 1 / 2 + η 1 x , t and z = 1 / 2 + η 2 ( x , t ) , the continuity of the vertical velocity
u z 1 z = 1 / 2 = u z 2 z = 1 / 2 , u z 2 z = 1 / 2 = u z 3 z = 1 / 2 ,
and pressure
J η 1 = p 1 z = 1 / 2 p 2 z = 1 / 2 , J η 2 = p 2 z = 1 / 2 p 3 z = 1 / 2 ,
must be satisfied. In (7), J = g Δ ρ / ρ 0 2 s 2 h is the bulk Richardson number quantifying the strength of buoyancy relative to the strength of the inertial forces. For the planar perturbations, we can express the velocities in terms of the stream function ψ j as
u x j = ψ j z ,     u z j = ψ j x .
In addition, due to the homogeneity of the flow in x and t , we seek the solution in terms of plane waves:
ψ j , η j = 1 2 π + ψ ^ j ( z ) , η ^ j e i k x + i ω t d k d ω ,
For these plane waves, the system of Equations (3)–(5) and the boundary conditions (6) and (7) yield an algebraic system for the frequency ω of the waves. The complex roots of the resulting third-order polynomial for ω determine the evolution of the perturbations. The flow is unstable if the imaginary part of ω is negative as the perturbations grow exponentially with the growth rate σ = i m a g ( ω ) . The growth rate is a function of the scale ( k ) of the perturbations. Thus, the perturbations that are expected to emerge in the flow are the ones with the largest growth rate as their amplitude will grow at a faster pace compared to all the others. In this work, we calculate the growth rate σ in the non-Boussinesq limit Δ 0 and compare it to the corresponding growth in the Boussinesq limit of Δ = 0 typically employed in studies of TCI.

3. Investigation of the Taylor–Caulfield Instability

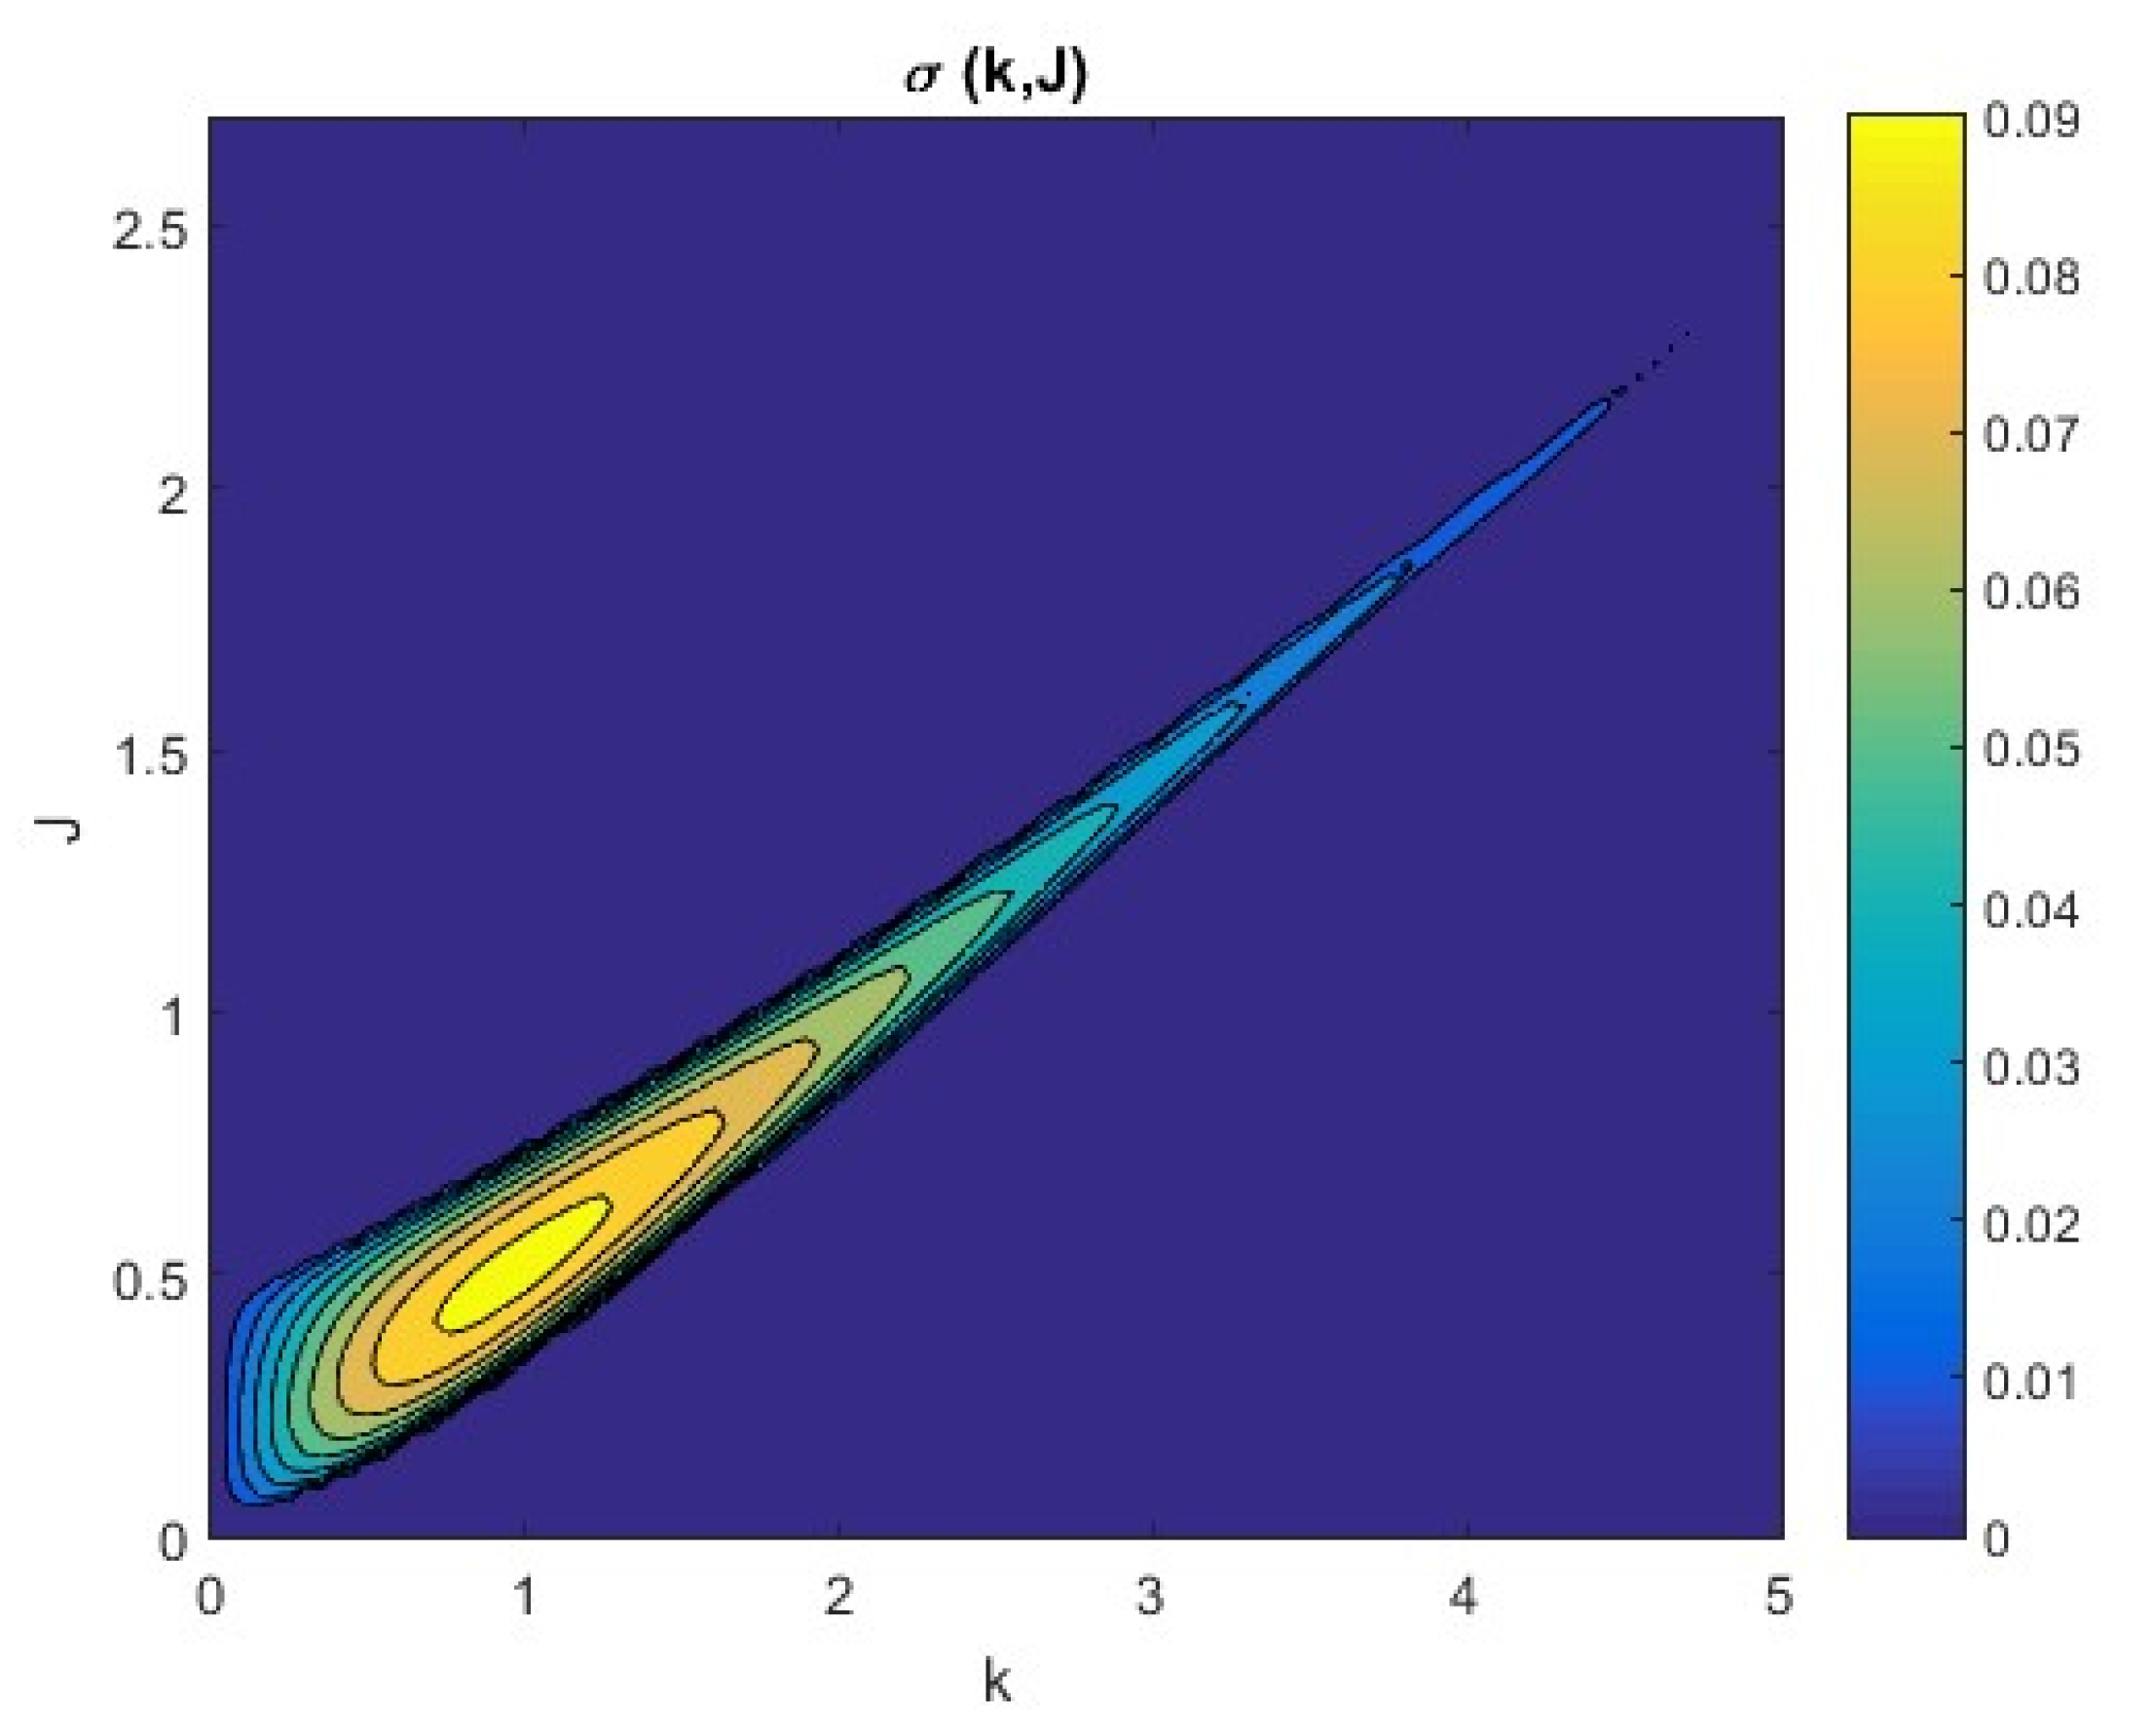
The exponential growth rate σ was calculated for various values of k , J and Δ . The growth rate σ is shown in Figure 2 as a function of the wavenumber k and the Richardson number J in the Boussinesq limit Δ = 0 . We observe that for every value of J , there is a finite range of wavenumbers, [ k l , k h ] , with a positive growth rate. Therefore, for each stratification, the perturbations that are expected to emerge have horizontal scales within the range [ 2 π / k h , 2 π / k l ] . This range shrinks as J increases and is shifted to larger wavenumbers and for large enough stratification ( J > 2 ) , the instability ceases.
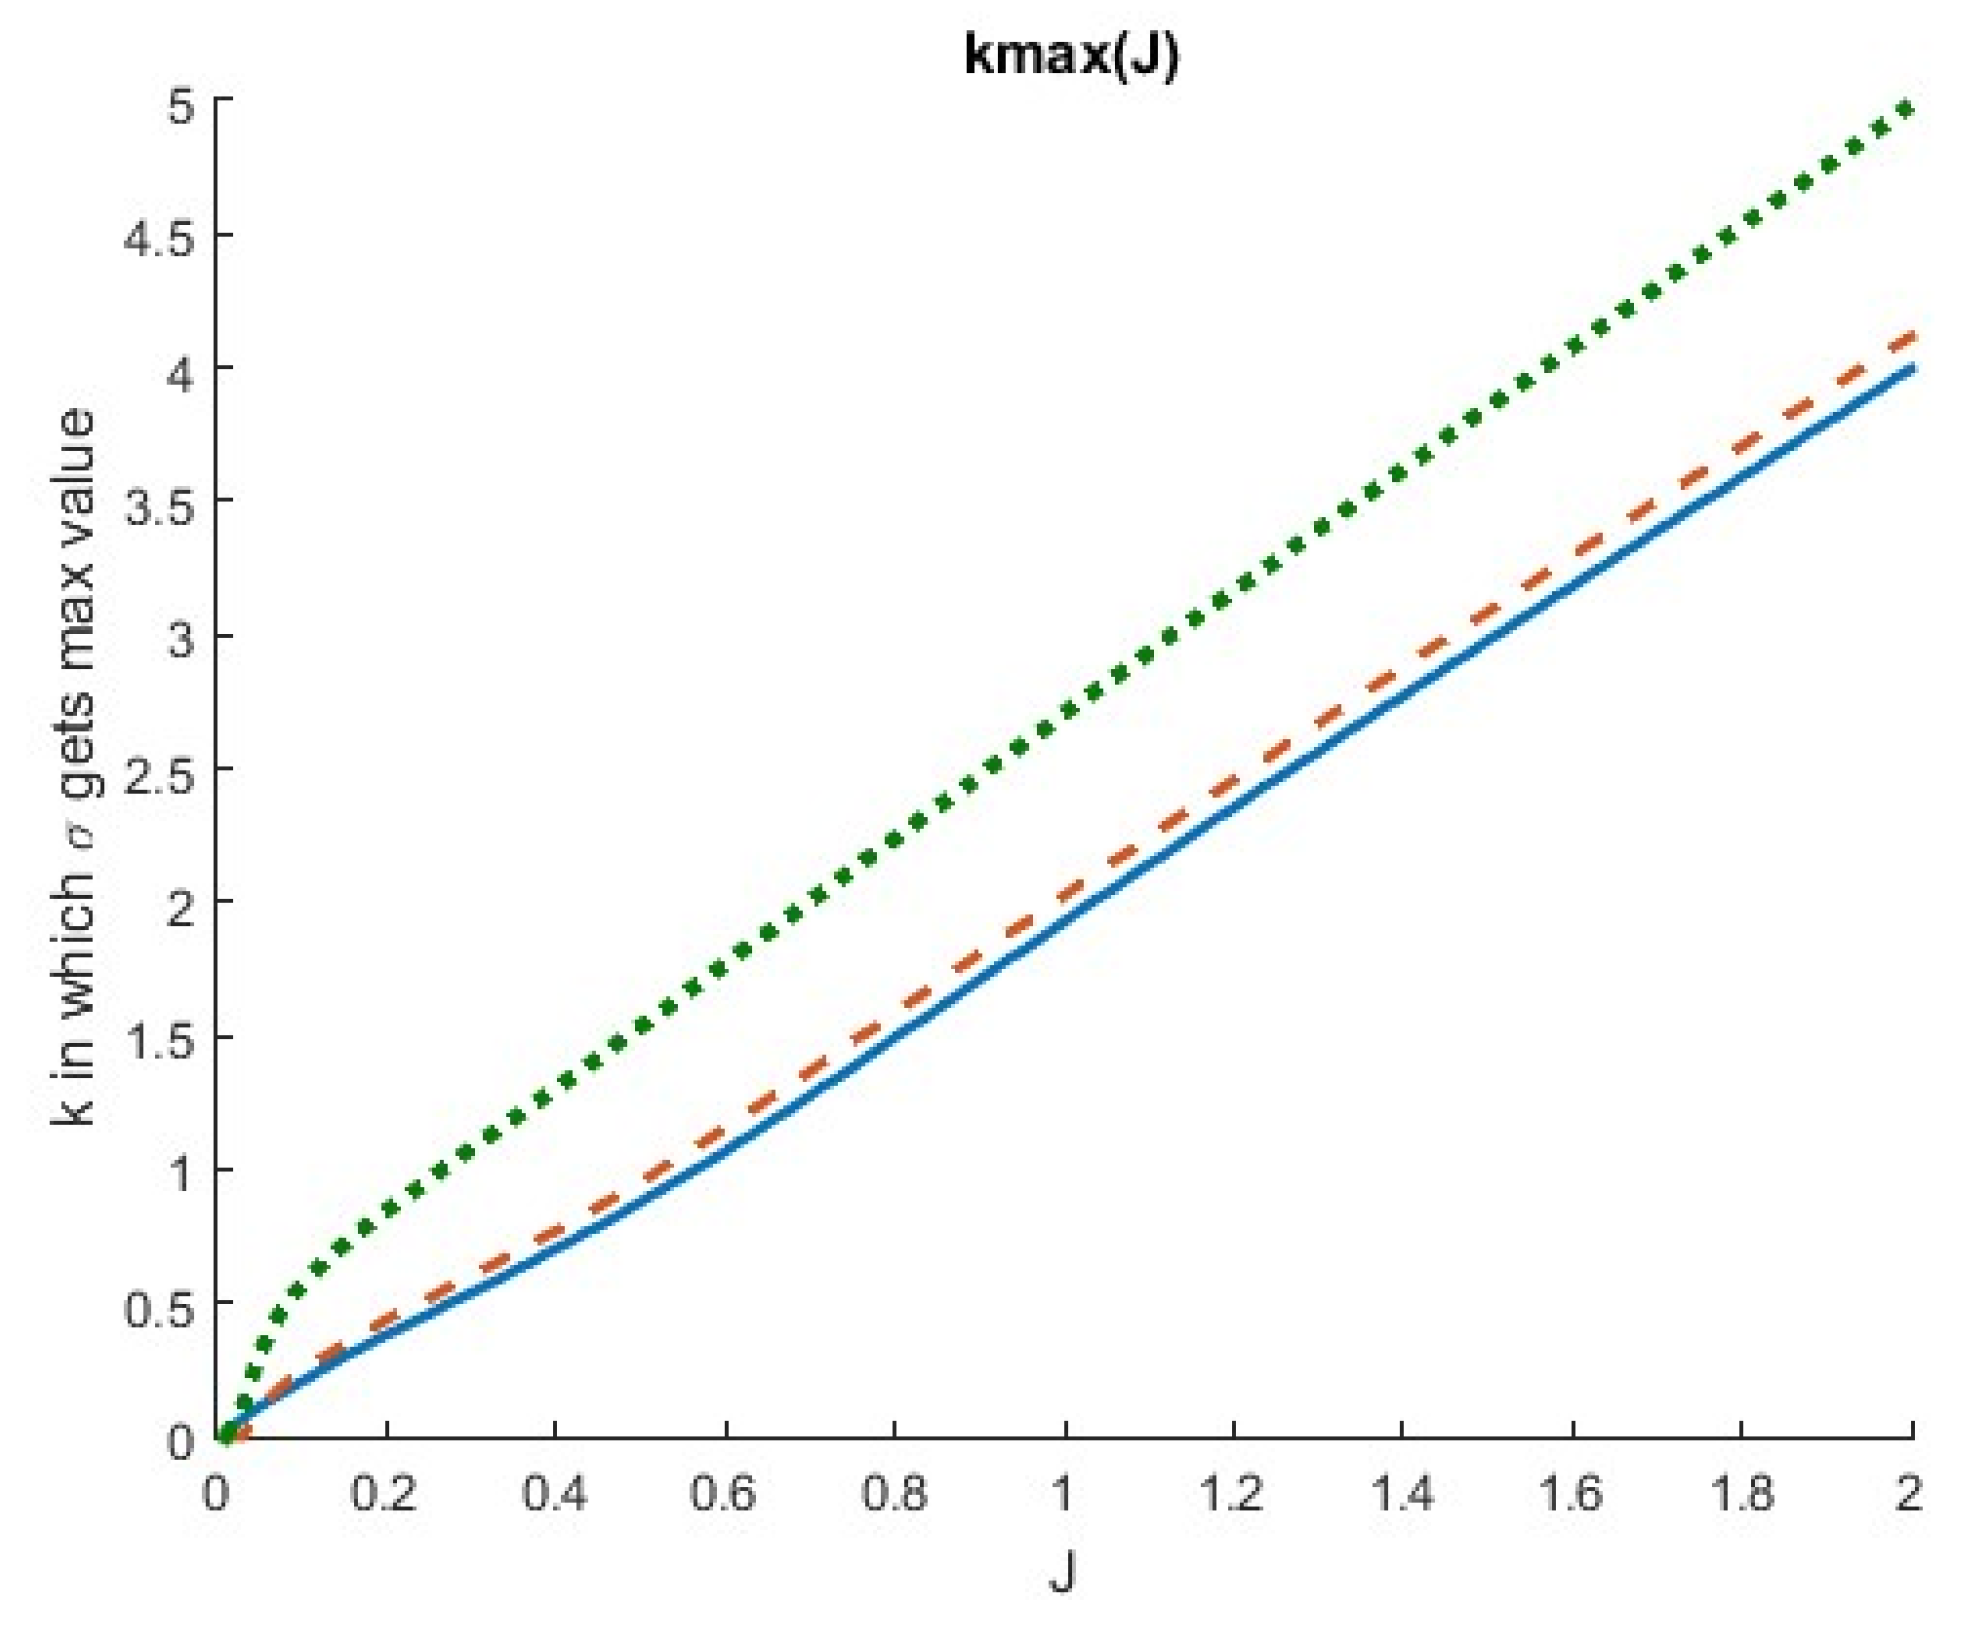
The maximum growth rate σ m a x = m a x k σ over all wavenumbers for every Richardson number is shown in Figure 3 as a function of J . This provides a lower bound for the characteristic time scale over which the instability develops. We observe that the growth rate is maximized for small but finite values of stratification ( J 1 / 2 ). For stronger stratification, the growth rate decreases rapidly and asymptotically approaches zero. Figure 4 shows the wavenumber k m a x at which the maximum growth rate σ m a x is achieved as a function of the Richardson number. As discussed above, this provides the characteristic scale of the maximally growing perturbations that are expected to dominate the flow. We observe a monotonically increasing function that is almost linear for large stratification. As a result, the scales of the perturbations expected to emerge in the flow become smaller for flows with larger stratification.
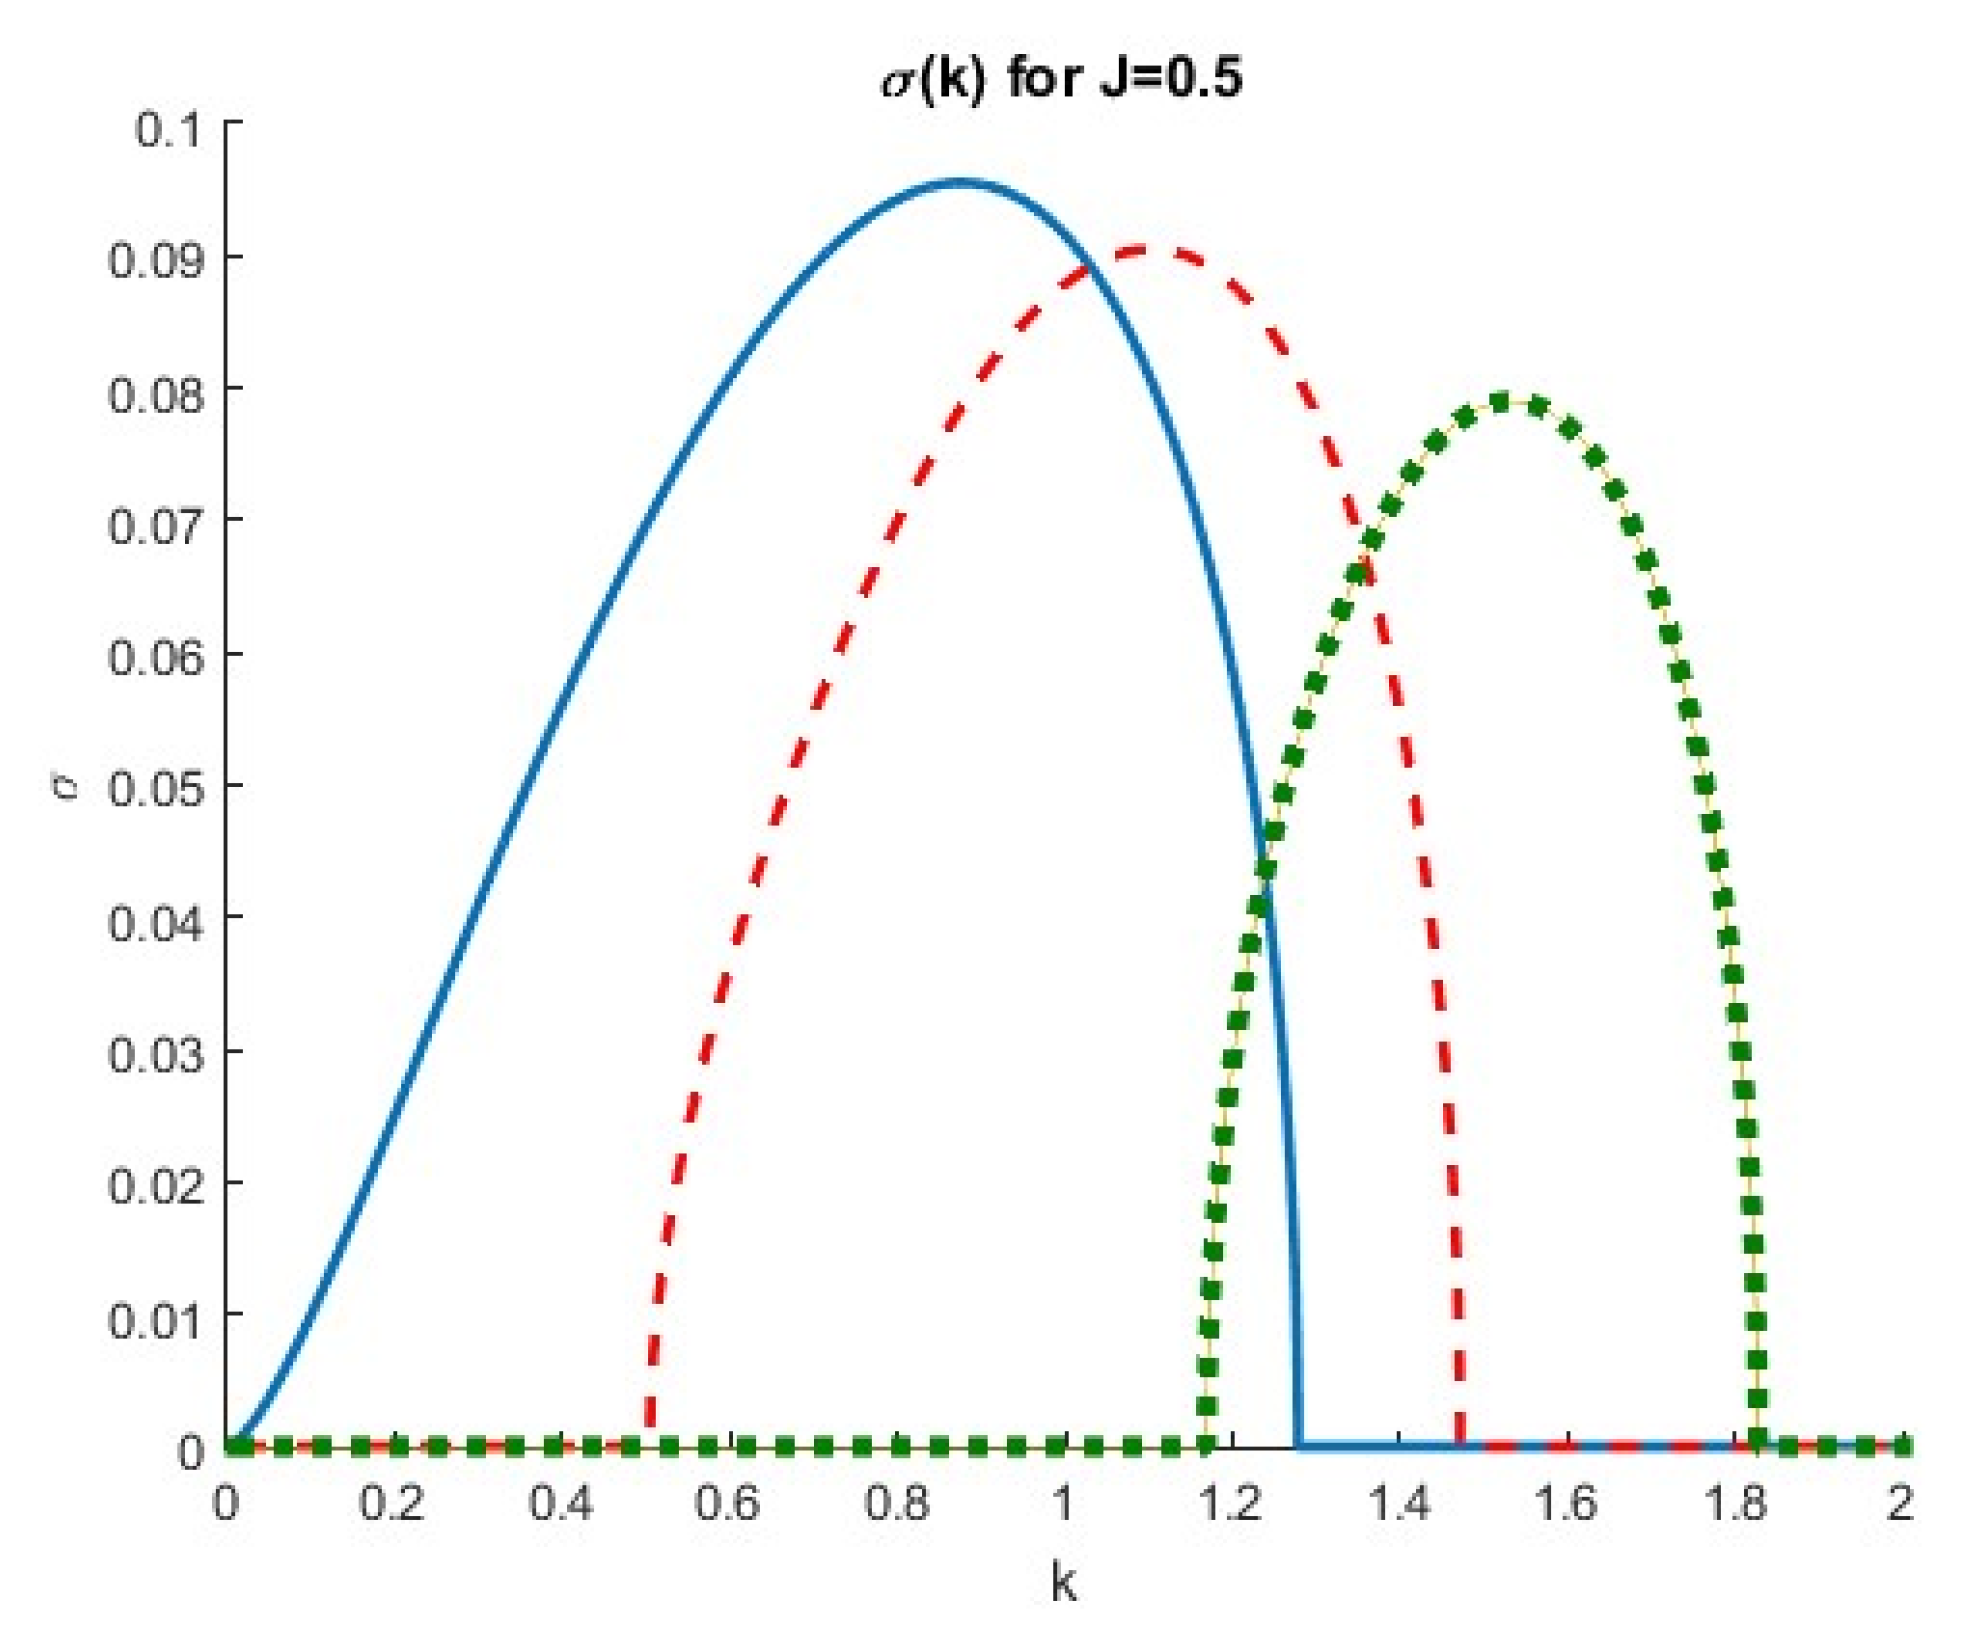
We now investigate the instability away from the Boussinesq limit. Figure 5 illustrates the growth rate as a function of wavenumber for three values of Δ . The value of the Richardson number is the one for which the largest growth rate is attained in the Boussinesq limit ( J = 1 / 2 ). The growth rate is lower for larger values of Δ , a result that holds for all Richardson numbers as illustrated in Figure 3, showing σ m a x for the two non-zero values of Δ as well. As a result, the e-folding time of the instability generally increases with larger density gradients. Moreover, as Δ increases, the maximum growth rate is attained at weaker values for the stratification (cf. Figure 3).
As shown in Figure 5, increasing Δ decreases the range of unstable wavenumbers while it increases the wavenumber k m a x for which the maximum growth is achieved. This result holds for all Richardson numbers as can be seen in Figure 4. Specifically, the wavenumber k m a x monotonically increases almost linearly with J for the non-zero values of Δ as well. The slope is almost the same as in the Boussinesq limit, but k m a x is shifted towards larger values for increasing values of Δ .

4. Conclusions

In this work, we investigated Taylor–Caulfield Instability (TCI), which is one of the three main classes of stratified shear instability and occurs in sheared multi-layered flows. The goal was to investigate the instability away from the Boussinesq limit that was typically employed in previous studies and might not be justified for realistic atmospheric flows. The evolution of small amplitude perturbations superposed on a fluid with three different layers of constant density and with a constant shear flow was obtained and their growth rate was analytically calculated as a function of their scale, the bulk Richardson number and the relative density differences across the three layers. The characteristics of the unstable perturbations were then compared to the corresponding characteristics in the Boussinesq limit, that is, in the limit in which the density variations are taken into account only in the buoyancy term. It was found that for larger density differences across the layers of the fluid, the exponential growth rate of the perturbations is lower and the range of spatial scales of the unstable waves as well as the scale of the perturbations with the largest growth rate are smaller. As a result, the predictions of linear instability in the Boussinesq limit overestimate the wavelength of the emerging perturbations as well as overestimate their growth rate.

Author Contributions

Conceptualization, N.A.B.; methodology, N.A.B.; software, T.T.; validation, T.T.; formal analysis, T.T.; investigation, T.T.; writing—original draft preparation, T.T.; writing—review and editing, T.T. and N.A.B.; visualization, T.T.; supervision, N.A.B. All authors have read and agreed to the published version of the manuscript.

Funding

This research received no external funding.

Institutional Review Board Statement

Not applicable.

Informed Consent Statement

Not applicable.

Data Availability Statement

Not applicable.

Conflicts of Interest

The authors declare no conflict of interest.

References

  1. Caulfield, C.P. Layering, instabilities and mixing in turbulent shear flows. Annu. Rev. Fluid Mech. 2021, 53, 113–145. [Google Scholar] [CrossRef]
  2. Lord Rayleigh, F.R.S. On the stability or instability of certain fluid motions. Proc. Lond. Math. Soc. 1880, 11, 57–70. [Google Scholar] [CrossRef]
  3. Drazin, P.G.; Reid, W.H. Hydrodynamic Stability, 2nd ed.; Cambridge University Press: Cambridge, UK, 1981; p. 605. [Google Scholar]
  4. Holmboe, J. On the behavior of symmetric waves in stratified shear layers. Geofys. Publ. 1962, 24, 67–113. [Google Scholar]
  5. Taylor, G.I. Effect of variation in density on the stability of superposed streams of fluid. Proc. Lond. Math. Soc. 1931, 132, 499–523. [Google Scholar]
  6. Caulfield, C.P. Multiple linear instability of stratified shear flow. J. Fluid Mech. 1994, 258, 255–285. [Google Scholar] [CrossRef]
  7. Lee, V.; Caulfield, C.P. Nonlinear evolution of a layered stratified shear flow. Dyn. Atmos. Oceans 2001, 34, 103–124. [Google Scholar] [CrossRef]
Figure 1. (a) Mean zonal velocity and (b) mean density as a function of height for s = 1 and h = 1 .
Environsciproc 26 00066 g001
Figure 2. The growth rate σ as a function of wavenumber k and bulk Richardson number J in the Boussinesq limit ( Δ = 0 ).
Environsciproc 26 00066 g002
Figure 3. The maximum growth rate σ m a x over all wavenumbers as a function of the bulk Richardson number J for Δ = 0 (solid line), Δ = 0.3 (dashed line) and Δ = 0.8 (dotted line).
Environsciproc 26 00066 g003
Figure 4. The wavenumber k m a x at which the maximum growth rate is achieved as a function of the bulk Richardson number J for Δ = 0 (solid line), Δ = 0.3 (dashed line) and Δ = 0.8 (dotted line).
Environsciproc 26 00066 g004
Figure 5. The growth rate σ as a function of wavenumber k for J = 1 / 2 and for Δ = 0 (solid line), Δ = 0.3 (dashed line) and Δ = 0.8 (dotted line).
Environsciproc 26 00066 g005
Disclaimer/Publisher’s Note: The statements, opinions and data contained in all publications are solely those of the individual author(s) and contributor(s) and not of MDPI and/or the editor(s). MDPI and/or the editor(s) disclaim responsibility for any injury to people or property resulting from any ideas, methods, instructions or products referred to in the content.