Next Article in Journal
PBL Height Retrievals during ASKOS Campaign
Previous Article in Journal
Application of AirQ+ Software in the Attica Region, Greece: The Hospitalizations and Work Days Lost Attributed to Air Pollutants
 
 
Please note that, as of 4 December 2024, Environmental Sciences Proceedings has been renamed to Environmental and Earth Sciences Proceedings and is now published here.
Proceeding Paper

Lidar, Ceilometer and Drone-Borne Aerosol Profiling during the EVIAN 2022 Campaign in Cyprus †

1
Laboratory of Atmospheric Physics, Aristotle University of Thessaloniki, Thessaloniki 54124, Greece
2
Climate and Atmosphere Research Centre (CARE-C), The Cyprus Institute, Nicosia 2121, Cyprus
*
Author to whom correspondence should be addressed.
Presented at the 16th International Conference on Meteorology, Climatology and Atmospheric Physics—COMECAP 2023, Athens, Greece, 25–29 September 2023.
Environ. Sci. Proc. 2023, 26(1), 38; https://doi.org/10.3390/environsciproc2023026038
Published: 24 August 2023

Abstract

:
In this study, we present primary results from the aErosol Vertical profiling with lIdars And droNes (EVIAN) campaign, under the ATMO-ACCESS project, which took place in Nicosia, Cyprus (35°10′21″ N, 33°21′54″ E). Measurements from different instrument techniques, e.g., lidar, ceilometer and “drone-borne” Optical Particle Counter (OPC), have been used in a synergistic way during the campaign to derive the aerosol properties. This study focuses on the comparison of the drone-borne and ceilometer retrievals, mainly in the Planetary Boundary Layer (PBL), and the synergistic use of the above-mentioned instruments in analyzing the geometrical and optical properties of the detected aerosol layers to improve the determination of the lidar overlap function.

1. Introduction

Aerosols represent an important component of the Earth’s system, with a significant impact on climate [1], weather [2], air quality [3], biogeochemical cycles [4] and health [5]. Systematic observations of the aerosol load are regularly performed and dedicated field campaigns have been carried out for monitoring the aerosol properties and the predominant aerosol types using combined observations from in situ and active and passive remote sensing instruments [6]. This study presents the variability of the aerosol optical properties inside the Planetary Boundary Layer (PBL) and the free troposphere.
The aErosol Vertical profiling with lIdars And droNes (EVIAN) campaign, under the ACCESS to ATMOspheric Research Facilities (ATMO-ACCESS) project, is aimed at comparing measurements from different instruments, mainly inside the PBL. The synergy of lidar, ceilometer and “drone-borne” OPC measurements will allow the comparison of the vertical structure of the aerosol layers between the three techniques. The in situ profiles can provide useful layer information in the height region where, due to the geometry of the lidar observations, there is no full overlap between the laser beam and the telescope field of view and thus our capabilities for the overlap correction of the lidar products can be improved. In total, 11 flights were performed with the Printed Optical Particle Spectrometer (POPS) OPC on a multirotor drone. In addition to the air-borne measurements, vertical resolved aerosol backscatter, extinction coefficient and the depolarization ratio at 532 nm were retrieved from the CIMEL lidar at Nicosia. Aerosol backscatter and extinction coefficients were also retrieved from a Vaisala CL51 Ceilometer in Agia Marina Xyliatou. Dust transportation at an altitude of 2–3 km and localized smoke events with sufficient aerosol load were observed and analyzed during 1–2 November over the area. An integration of the data from the synergistic use of the above-mentioned instruments is presented, analyzing the geometrical and optical properties of the detected aerosol layers. The three observation sites (i.e., Nicosia, Agia Marina Xyliatou and Orounda) lie within a distance of 40 km.

2. Data and Methods

2.1. POPS

The Printed Optical Particle Spectrometer (POPS, later renamed the Portable Optical Particle Spectrometer) is a lightweight OPC designed for use on Unmanned Aerial Vehicles (UAVs) or as part of a balloon-borne sounding system [7]. POPS uses a 405 nm diode laser and measures aerosol number concentration in the diameter range from 0.14 to 3 μm. A dryer is attached to the inlet of the instrument when the UAV-POPS system flies inside humid environments (with RH > 50%) [8]. Compared with reference instruments, ground-based and UAV observations of POPS have shown that POPS can provide scientific quality data and reliable vertical profiles of particle size distribution and mass concentration [9].

2.2. CE376 Lidar

The CE376 lidar designed by CIMEL in France, is a bi-wavelength lidar that emits short pulses of green (532 nm) and near infrared (808 nm) light into the atmosphere. It can operate in all weather conditions, and is able to detect molecular signals from up to 10 km in the daytime and 18 km in the nighttime. CE376 has a large overlap region of ~1200 m. The receiver features 3 channels that enable measurements of elastically scattered light for both wavelengths as well as the depolarization of the incoming light at 532.
Aerosol backscatter and extinction coefficient profiles are derived using an alternative inversion method, which through an iterative procedure allows one to determine the aerosol backscattering and extinction coefficients by (i) using as boundary conditions the optical depth τ [cimel] of the aerosols in the considered altitude range (zo, zm) and (ii), as in the Fernald–Klett approach, the total backscattering coefficient bm (due to molecules and aerosols) at a far-end reference height zm [10].

2.3. Ceilometer CL51

The Vaisala ceilometer CL51 is an eye-safe single-lens lidar system that emits short pulses of near-infrared (910 nm) light reporting attenuated backscatter profiles in fully automatic mode with 24/7 operation in all weather conditions [11]. It is equipped with pulsed diode laser LIDAR technology, where short, powerful laser pulses are sent out in a vertical or near-vertical direction.
CL51 is designed to measure high-range cirrus cloud heights without surpassing the low and middle-layer clouds, or vertical visibility in harsh conditions. CL51 measures the backscatter vertical profile over a full range of up to 15 km and it has a low overlap region of ~300 m. The backscattered light by clouds, precipitation and aerosols is analyzed and used to determine the cloud base and the PBL height. A CL51 is installed and has been measuring since June 2021 at the Cyprus Atmospheric Observatory of the Cyprus Institute in Agia Marina Xyliatou (CAO-AMX), co-located with a CE318 sunphotometer (sub-urban environment).

2.4. Sunphotometer

The international network of automatic AERONET (AErosol RObotic NETwork) CIMEL CE318 sun-photometers [12] is one of the most advanced remote sensing aerosol monitoring systems. The AERONET network is operated by NASA (USA) and the French and Spanish ACTRIS (Aerosols Clouds and TRace gas InfraStructure) components in Europe and includes several hundred stations (about ~600) around the world. The tools of this network allow obtaining long-term series for the accurate aerosol parameters that can be used for the analysis of the aerosol particle variations [13], studying the seasonal dynamics and the local aerosol behavior.
Table 1 gives an overview of the available datasets during the EVIAN campaign, and specifically the measurements dates, the retrievals and the altitude range of the lidar, the ceilometer, the POPS and the sunphototmeter.

3. Results

This section presents preliminary results obtained from the campaign. The aerosol geometrical properties carry information about the structure of lidar profiles. Examples are the boundary layer height provided by the ceilometer and the meteorological sensor on board the UAV system. A comparison of these results is discussed and a case study on 2nd of November 2022 is also presented when all instruments performed measurements.

3.1. Planetary Boundary Layer

The PBL is typically characterized by a decrease in humidity with height due to mixing with drier air from above. By analyzing the vertical gradient of humidity from the Relative Humidity (RH) sensor on board the UAV, we can identify the approximate height of the PBL. Moreover, the ceilometer measures the backscatter profile of the atmosphere and, using an automatic algorithm, it can detect the boundary layer depth and the residual structures. The analysis is based on the combined gradient and idealized backscatter methods. Figure 1a illustrates the PBL diagrams derived from measurements obtained using the two instruments.
Figure 1a displays the relative humidity plot, indicating that the PBL was situated at 600 m around 9:00, 1000 m by 10:00, and exceeded 1300 m by 11:00. Notably, the RH observations were limited to 1200 m because this was the maximum altitude reached by the UAV. In Figure 1b, the diagram presents the boundary layer as determined by the ceilometer measurements. It is evident that the heights calculated by the algorithm aligned well with the corresponding humidity measurements. The stars on the diagram indicate the specific hours when the drone flights were conducted.

3.2. Aerosol Profiles Observed over Nicosia

On the morning of the 2nd of November, lidar measured a high backscatter signal of a layer between 1.5 and 2 km and a second layer between 2.5 and 3 km. The second layer was a dust layer because of the volume depolarization ratio (~0.2), as it seems in Figure 2b. Τhe presence of this layer was also confirmed by the ceilometer at the same heights.
Aerosol backscattering and extinction coefficient profiles of the lidar and the ceilometer were derived using an alternative inversion method, as mentioned in Section 2.2. For the calculation of these coefficients, we used the AOD from the Cimel sunphotometer measurements. The AOD at 500 nm reached 0.18 and at 870 nm 0.11. The lidar ratio was calculated equal to 59 sr from lidar measurements at 532 nm and 42 sr from ceilometer measurements at 910 nm. In order to compare the retrievals of both the lidar and the ceilometer, a spectral conversion is needed when different wavelengths are used. The aerosol backscatter coefficient profiles derived from CL51 can be converted to 532 nm according to the following equations:
β λ 1 , r = β λ 2 , r × e ln λ 1 λ 2 × Å , Å = ln τ λ 2 ln τ λ 1 ln λ 1 ln λ 2
where Å (=1.03) is the Ångström exponent and λ 1 and λ 2 are the emitted laser wavelengths ( λ 1 = 532   n m , λ 2 = 910   n m ) [14].
Figure 2a shows a comparison of the lidar aerosol backscatter coefficient profile at 532 nm with the aerosol backscatter coefficient profile from the ceilometer at 532 nm at 09:30 UTC on 2 November 2023. Both instruments captured the same aerosol layers. There was a general good agreement between the two instruments concerning the aerosol layer around 2700 m; however, a shift of about 500 m was seen for the lowest aerosol layer between 1500 and 2000 m. We have to mention here that the two instruments were situated in different locations (38 km distance), so eventually local circulation patterns might affect the aerosols’ layer height.
This agreement could be useful for the overlap correction of lidar measurements below 1000 m if the ceilometer and the lidar are collocated, since the ceilometer had a full overlap around 300 m [12].
During the EVIAN campaign, UAV-borne measurements were also available up to 1300 m (Table 1). Therefore, in this study it was not feasible to directly compare POPS measurements with the non-overlap corrected measurements obtained from lidar. Figure 3 illustrates the comparison between ceilometer and POPS measurements. While POPS measures mass concentration, the ceilometer provides aerosol backscatter coefficient profiles, making direct comparison between the two not possible. However, it appears that there was agreement for the aerosol load observed at 600–800 m and at 1000 m. The deviation observed below 300 m could be ignored as it fell within the overlap range of the ceilometer.

4. Conclusions—Future Plans

In this study, we showed the comparison of two active remote sensors (lidar and ceilometer) and a UAV in determining the structure of the PBL and in retrieving the aerosol vertical profiles over Cyprus. Measurements were performed under different atmospheric conditions, as the lidar measured in an urban area and the ceilometer and UAV in a suburban area. A general good agreement was found in the PBL comparison between the Relative Humidity (RH) sensor on-board the UAV and ceilometer retrievals. A good agreement was also seen between the retrieved aerosol backscatter coefficients of the lidar and the ceilometer. In the future, we plan to improve the determination of the lidar overlap function with the ceilometer and UAVs retrievals and to convert the aerosol backscatter coefficient to mass concentration in order to compare with the UAVs.

Author Contributions

All authors contributed significantly to this manuscript. P.G. carried out the processing of the lidar and ceilometer measurements and prepared the figures of the manuscript, P.A. was responsible for the methodology and the lidar data analysis, K.M. was responsible for the UAVs data methodology and A.P. carried out the PBL processing. B.D. and M.F. were the supervisors, the project administrators and they were responsible for the funding acquisition. P.G. prepared the manuscript with contributions from all co-authors. All authors have read and agreed to the published version of the manuscript.

Funding

This campaign received funding through a transnational access project that is supported by the European Commission under the Horizon 2020—Research and Innovation Framework Programme, H2020-INFRAIA-2020-1, ATMO-ACCESS Grant Agreement number: 101008004.

Institutional Review Board Statement

Not applicable.

Informed Consent Statement

Not applicable.

Data Availability Statement

The lidar and UAV’s data used in this study are available upon request and the ceilometer data are available at https://e-profile.eu/#/cm_profile; accessed on 5 November 2022. The AERONET sunphotometer data for Nicosia are publicly available at https://aeronet.gsfc.nasa.gov; accessed on 5 November 2022.

Acknowledgments

The Cyprus atmospheric observatory (CAO) of the Cyprus institute (CYI) has received funding from the European Union’s Horizon 2020 research and innovation program under grant agreement No. 856612 and from the Cypriot Government (EMME-CARE).

Conflicts of Interest

The authors declare no conflict of interest.

References

  1. Seinfeld, J.H.; Bretherton, C.; Carslaw, K.S.; Coe, H.; DeMott, P.J.; Dunlea, E.J.; Feingold, G.; Ghan, S.; Guenther, A.B.; Kahn, R.; et al. Improving our fundamental understanding of the role of aerosol-cloud interactions in the climate system. Proc. Natl. Acad. Sci. USA 2016, 113, 5781–5790. [Google Scholar] [CrossRef] [PubMed]
  2. Marinescu, P.J.; van den Heever, S.C.; Saleeby, S.M.; Kreidenweis, S.M.; DeMott, P.J. The Microphysical Roles of Lower-Tropospheric versus Midtropospheric Aerosol Particles in Mature-Stage MCS Precipitation. J. Atmos. Sci. 2017, 74, 3657–3678. [Google Scholar] [CrossRef]
  3. Fuzzi, S.; Baltensperger, U.; Carslaw, K.; Decesari, S.; Denier van der Gon, H.; Facchini, M.C.; Fowler, D.; Koren, I.; Langford, B.; Lohmann, U.; et al. Particulate matter, air quality and climate: Lessons learned and future needs. Atmos. Chem. Phys. 2015, 15, 8217–8299. [Google Scholar] [CrossRef]
  4. Mahowald, N.M.; Scanza, R.; Brahney, J.; Goodale, C.L.; Hess, P.G.; Moore, J.K.; Neff, J. Aerosol Deposition Impacts on Land and Ocean Carbon Cycles. Curr. Clim. Chang. Rep. 2017, 3, 16–31. [Google Scholar] [CrossRef]
  5. Trippetta, S.; Sabia, S.; Caggiano, R. Fine aerosol particles (PM1): Natural and anthropogenic contributions and health risk assessment. Air Qual. Atmos. Health 2016, 9, 621–629. [Google Scholar] [CrossRef]
  6. Benavent-Oltra, J.A.; Casquero-Vera, J.A.; Román, R.; Lyamani, H.; Pérez-Ramírez, D.; Granados-Muñoz, M.J.; Herrera, M.; Cazorla, A.; Titos, G.; Ortiz-Amezcua, P.; et al. Overview of the SLOPE I and II campaigns: Aerosol properties retrieved with lidar and sun–sky photometer measurements. Atmos. Chem. Phys. 2021, 21, 9269–9287. [Google Scholar] [CrossRef]
  7. Mei, F.; McMeeking, G.; Pekour, M.; Gao, R.-S.; Kulkarni, G.; China, S.; Telg, H.; Dexheimer, D.; Tomlinson, J.; Schmid, B. Performance Assessment of Portable Optical Particle Spectrometer (POPS). Sensors 2020, 20, 6294. [Google Scholar] [CrossRef] [PubMed]
  8. Kezoudi, M.; Keleshis, C.; Antoniou, P.; Biskos, G.; Bronz, M.; Constantinides, C.; Desservettaz, M.; Gao, R.-S.; Girdwood, J.; Harnetiaux, J.; et al. The Unmanned Systems Research Laboratory (USRL): A New Facility for UAV-Based Atmospheric Observations. Atmosphere 2021, 12, 1042. [Google Scholar] [CrossRef]
  9. Gao, R.S.; Telg, H.; McLaughlin, R.J.; Ciciora, S.J.; Watts, L.A.; Richardson, M.S.; Schwarz, J.P.; Perring, A.E.; Thornberry, T.D.; Rollins, A.W.; et al. A light-weight, high-sensitivity particle spectrometer for PM2.5 aerosol measurements. Aerosol Sci. Technol. 2016, 50, 88–99. [Google Scholar] [CrossRef]
  10. Marenco, F.; Santacesaria, V.; Bais, A.F.; Balis, D.; di Sarra, A.; Papayannis, A.; Zerefos, C. Optical properties of tropospheric aerosols determined by lidar and spectrophotometric measurements (Photochemical Activity and Solar Ultraviolet Radiation campaign). Appl. Opt. 1997, 36, 6875–6886. [Google Scholar] [CrossRef] [PubMed]
  11. Münkel, C.; Eresmaa, N.; Räsänen, J.; Karppinen, A. Retrieval of mixing height and dust concentration with lidar ceilometer. Bound. Layer Meteorol. 2007, 124, 117–128. [Google Scholar] [CrossRef]
  12. CIMEL. Available online: www.cimel.fr (accessed on 23 September 2022).
  13. Dubovik, O.; Sinyuk, A.; Lapyonok, T.; Holben, B.N.; Mishchenko, M.; Yang, P.; Eck, T.F.; Volten, H.; Muñoz, O.; Veihelmann, B.; et al. Application of spheroid models to account for aerosol particle nonsphericity in remote sensing of desert dust. J. Geophys. Res. 2006, 111, D11208. [Google Scholar] [CrossRef]
  14. Liu, L.; Zhang, T.; Wu, Y.; Wang, Q.; Gao, T. Accuracy Analysis of the Aerosol Backscatter Coefficient Profiles Derived from the CYY-2B Ceilometer. Adv. Meteorol. 2018, 2018, 9738197. [Google Scholar] [CrossRef]
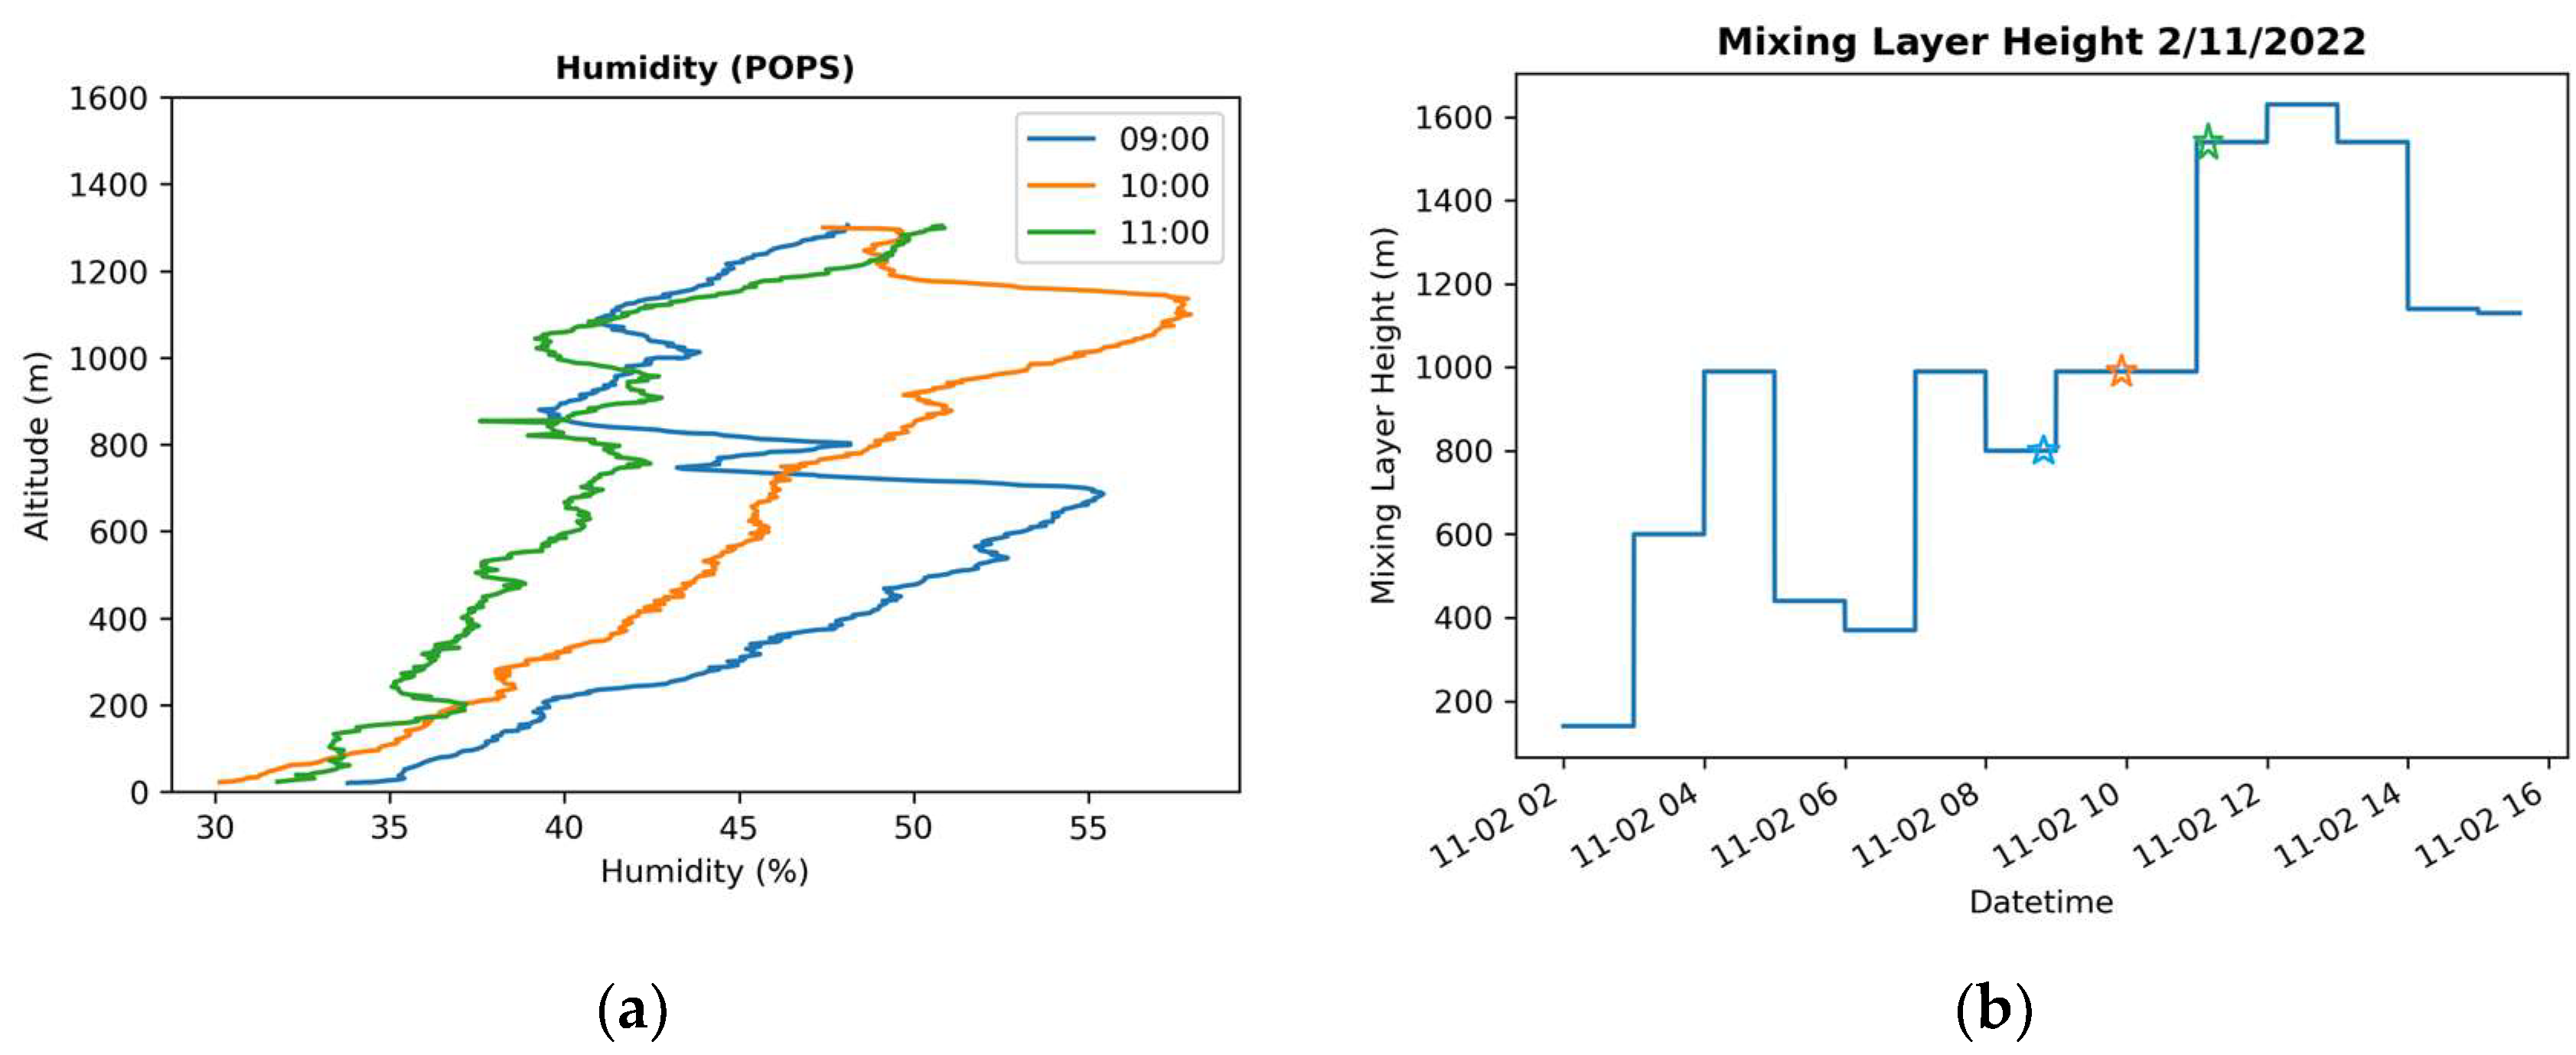
Figure 1. (a) Relative humidity profiles derived with RH sensor on board the UAV; (b) representation of mixing layer height via ceilometer.
Environsciproc 26 00038 g001
Figure 2. (a) Comparison of the lidar aerosol backscatter coefficient profile at 532 nm (blue) and the aerosol backscatter coefficient profile from the ceilometer at 532 nm (orange) at 09:30 UTC on 2 November 2023; (b) the volume linear depolarization ratio at 532 nm.
Environsciproc 26 00038 g002
Figure 3. Comparison between aerosol backscatter coefficient profile from the ceilometer at 910 nm and mass concentration by POPS measurements at 09:30 UTC on 2 November 2023.
Environsciproc 26 00038 g003
Table 1. Availability of the dataset of the instrumentation that participated in the EVIAN campaign.
InstrumentationEVIAN CampaignDataAltitude Range (m)
Lidar31 October, 2–4 NovemberBackscatter and extinction profiles, depolarization1200–10,000
UAV-POPS1–2 NovemberTemperature, relative humidity, size distribution (POPS)0–1300
Ceilometer31 October–4 NovemberBackscatter and extinction profiles300–15,000
Sunphotometer NIC/AMX31 October–4 NovemberAerosol optical depth at 340, 380, 440, 500,675, 870, 1020 and 1064 nmColumn integrated
Disclaimer/Publisher’s Note: The statements, opinions and data contained in all publications are solely those of the individual author(s) and contributor(s) and not of MDPI and/or the editor(s). MDPI and/or the editor(s) disclaim responsibility for any injury to people or property resulting from any ideas, methods, instructions or products referred to in the content.