1. Introduction
The Atlantic Ocean constitutes the second largest ocean in the world, covering an area of 106,460,000 m2, smaller than only the Pacific Ocean. Its hydro-climatological conditions depend on a number of factors, such as the prominent sea currents, prevailing winds, and air masses circulating in the area. Due to the different characteristics of the Atlantic Ocean in the two hemispheres, the ocean is distinguished into two parts, i.e., the North Atlantic and the South Atlantic.
The North Atlantic plays a pivotal role in modulating the Earth’s climate by absorbing, releasing, and transferring large amounts of heat all over the world [
1]. Climate change has a significant impact on the area, causing changes in the sea temperature, ocean acidification, and rise in the sea level. Sea level pressure (SLP), sea surface temperature (SST), and air temperature (Tair) constitute parameters strongly influenced by changes in the climate and can affect directly and/or indirectly the Earth’s weather and climate conditions, and consequently people’s lives.
Atmospheric teleconnection patterns, on the other hand, refer to the correlation between climates of different geographical areas [
2]. Teleconnection patterns are derived from the analysis of variations in either atmospheric pressure at sea level or geodynamic altitudes at various isobaric surfaces. The duration of the teleconnection patterns varies and can last from several weeks to a few years. This makes them an important contributor to climate variability, as they influence temperature and precipitation conditions, storms, and air currents in terms of their location and intensity [
3]. In addition, teleconnection patterns are characterized by different phases, during which different climatological conditions occur in the areas they affect.
There are numerous teleconnection patterns affecting the climate of the North Atlantic, with the North Atlantic Oscillation (NAO) and Arctic Oscillation (AO) constituting two of the most prominent ones. In particular, changes of these teleconnection patterns cause changes in the values of climate parameters with a delay ranging from a few weeks to a few months [
4].
The purpose of this study is to investigate the role of SLP, SST, and Tair in the formation of the aforementioned teleconnection patterns in the North Atlantic area. In particular, daily data of the climate parameters for the North Atlantic for the period 1982–2020 are studied along with their possible correlation (special and temporal) with the indices of the teleconnection patterns in the same period.
2. Materials and Methods
This study uses daily SLP, SST, and Tair timeseries for the North Atlantic, as well as the daily NAO and AO index values. All timeseries are associated with the period 1982–2020 and are derived from NOAA’s open data repository. A different number of grid points is considered for each parameter, which is due to the nature of the respective parameter (e.g., only points located in the ocean are used for SST) and the data availability of each parameter.
For the purposes of the study, the primary climatological data obtained from NOAA are processed, allowing the correlation between each other, as well as with the indices of the teleconnection patterns. To this end, a specific geographical window is selected and the data resolution is modified in such a way as to be similar for all climate parameters. With regard to the SST timeseries, an additional process occurs that concerns the removal of all grid points possessing null values, which represent continental areas and cause unwanted noise in the timeseries.
Table 1 presents the properties of the climatological data, namely, the geographical window, resolution, and number of grid points used for them.
Subsequently, Principal Component Analysis (PCA) is applied to the timeseries, i.e., a statistical method classifying and rearranging an original timeseries of large volume [
5]. PCA contributes to the better interpretation of data, as it creates new databases, thereby reducing their multidimensionality without losing significant information. In the context of the study, PCA is applied to the three climate parameters, and as a result, regions (principal components) of the North Atlantic with common characteristics are identified.
Pearson correlation is then implemented to specify the correlation between the different parameters (Zou et al., 2003). Pearson’s correlation index (r) can be estimated by using the following formula:
Properties of the climatological data after processing,
where
n is the size of the timeseries of parameters
xi and
yi (
i = 1, …,
n) and
is the sample means of parameters
x and
y. In addition, two-tailed
t test below the significance level of 0.1 is used to assess whether
r is significantly different from zero, and thus is statistically significant.
Last but not least, a cross-correlation analysis is conducted with the aim to determine the best time lag when the timeseries of the parameters show the highest correlation. This is a methodology that enables the identification of the relationship between the timeseries of two parameters, and in particular indicates how strong this relationship is [
6]. The correlation that two parameters can have with each other is quantified by a value ranging between −1 and +1. The following formula is applied:
Cross-correlation analysis equations,
where
mx is the mean data timeseries of parameter
x,
my is the mean data timeseries of parameter
y,
r is the value of the methodology, and
d is the time of the highest correlation between the two parameters.
The higher the correlation (positive or negative), the more the parameters follow the same pattern and influence each other [
6]. The time shift of parameters can be present in three forms: positive, which means that time will shift to the left (backwards); zero, which means no shift will occur; and negative, which means that time will shift to the right (forwards).
The parameters whose timeseries are compared in this study using this methodology are provided below:
NAO index with all principal components of the climate parameters;
AO index with all principal components of the climate parameters;
NAO index with AO index;
Principal components of the climate parameters with themselves;
Principal components of the climate parameters with the principal components of the other climate parameters.
3. Results
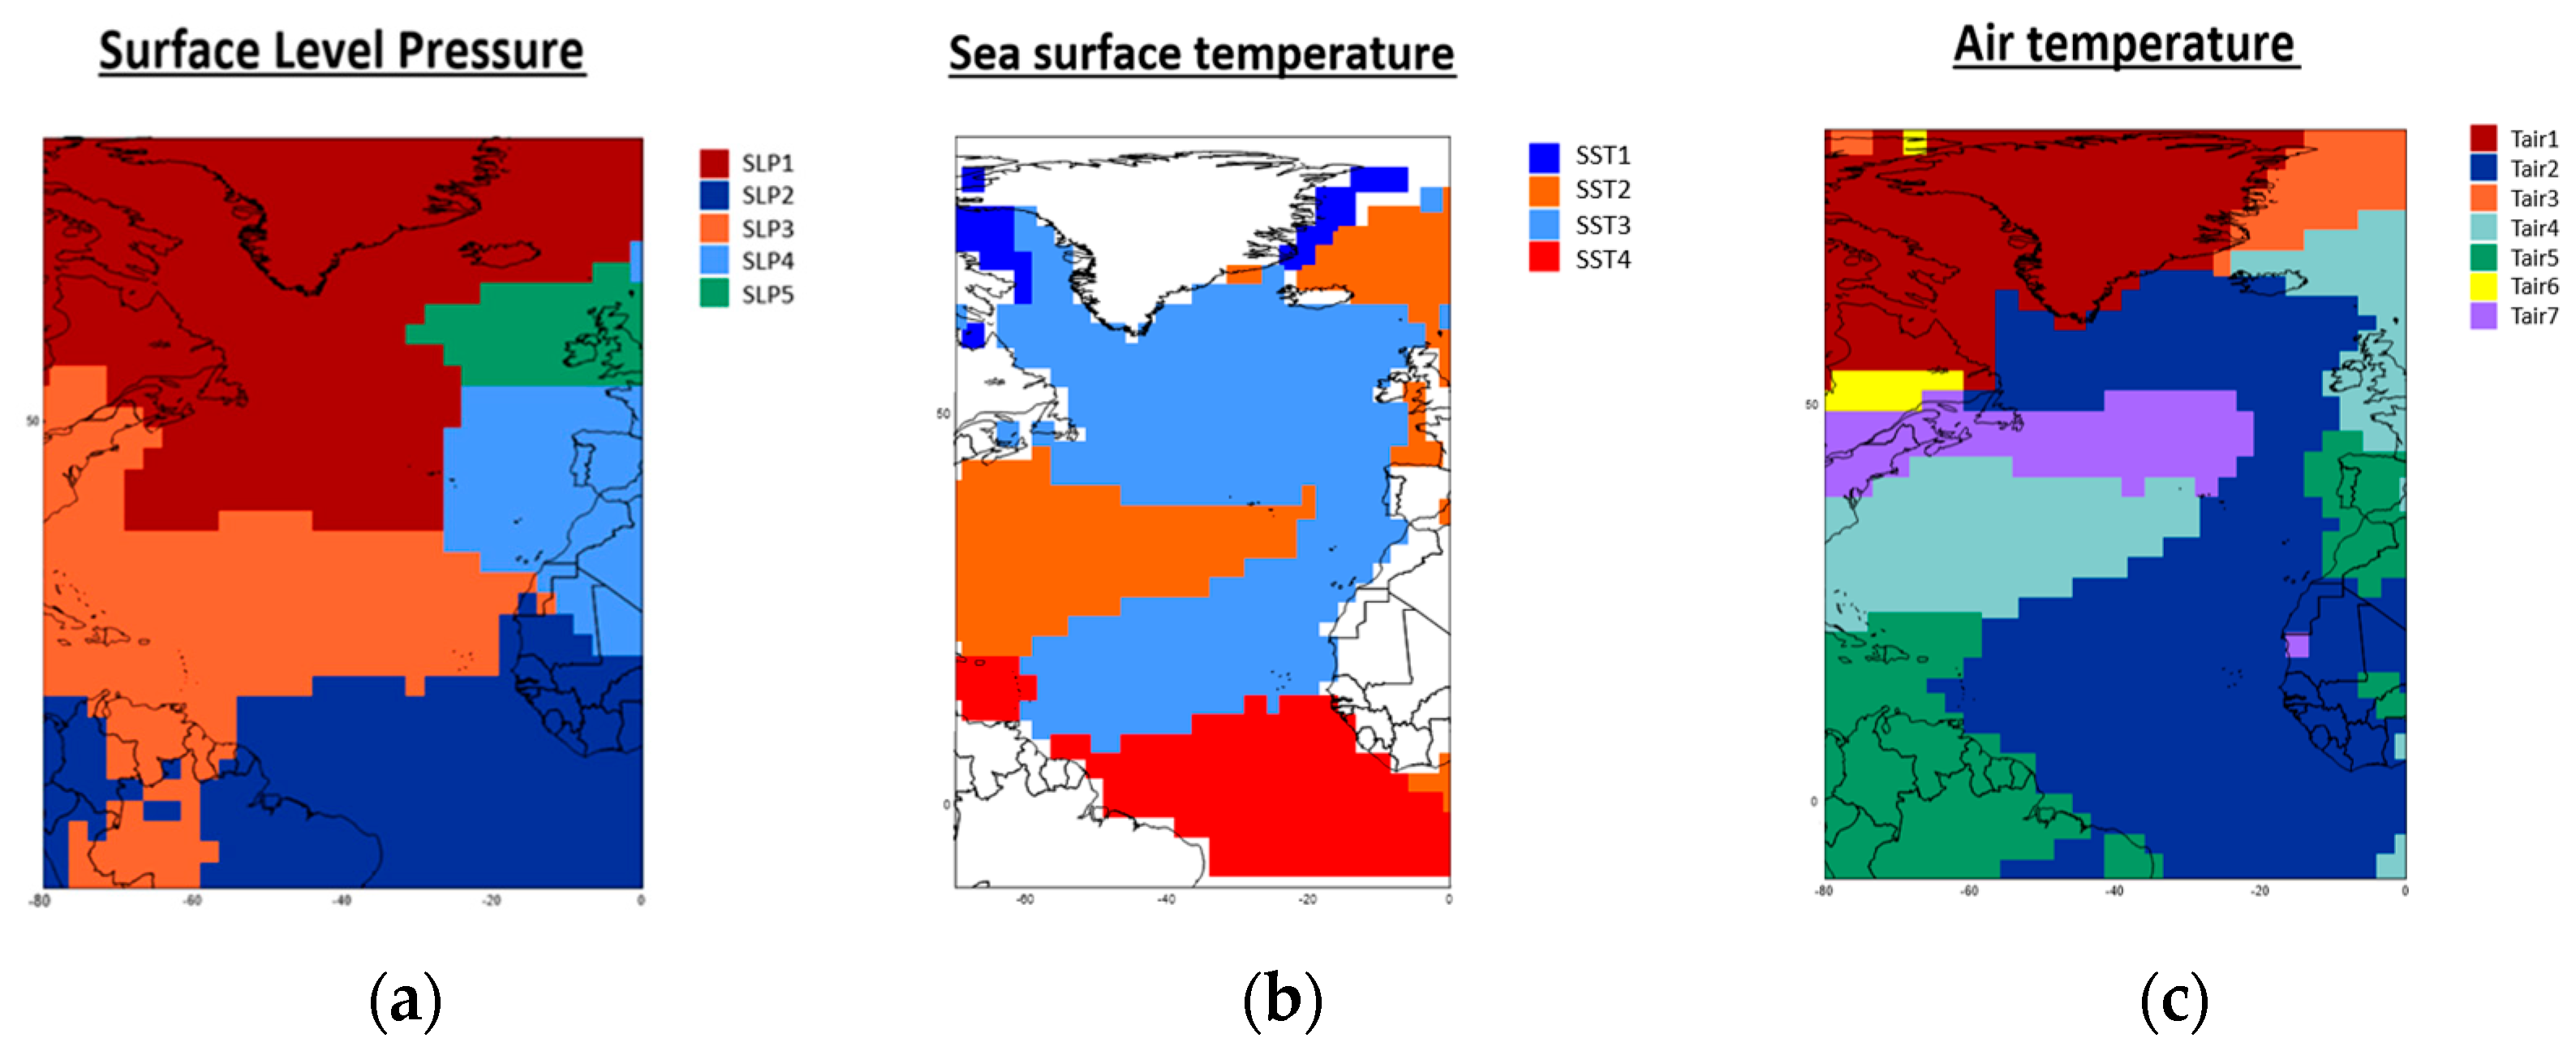
PCA is applied to the SLP, SST, and Tair timeseries, and as a result, the North Atlantic is classified into principal components (regions). Regions belonging to the same principal component showcase similar characteristics in the conditions of the respective climate variable.
Figure 1 presents the results of the PCA, classifying the northern part of the ocean into distinguished regions based on their climate conditions.
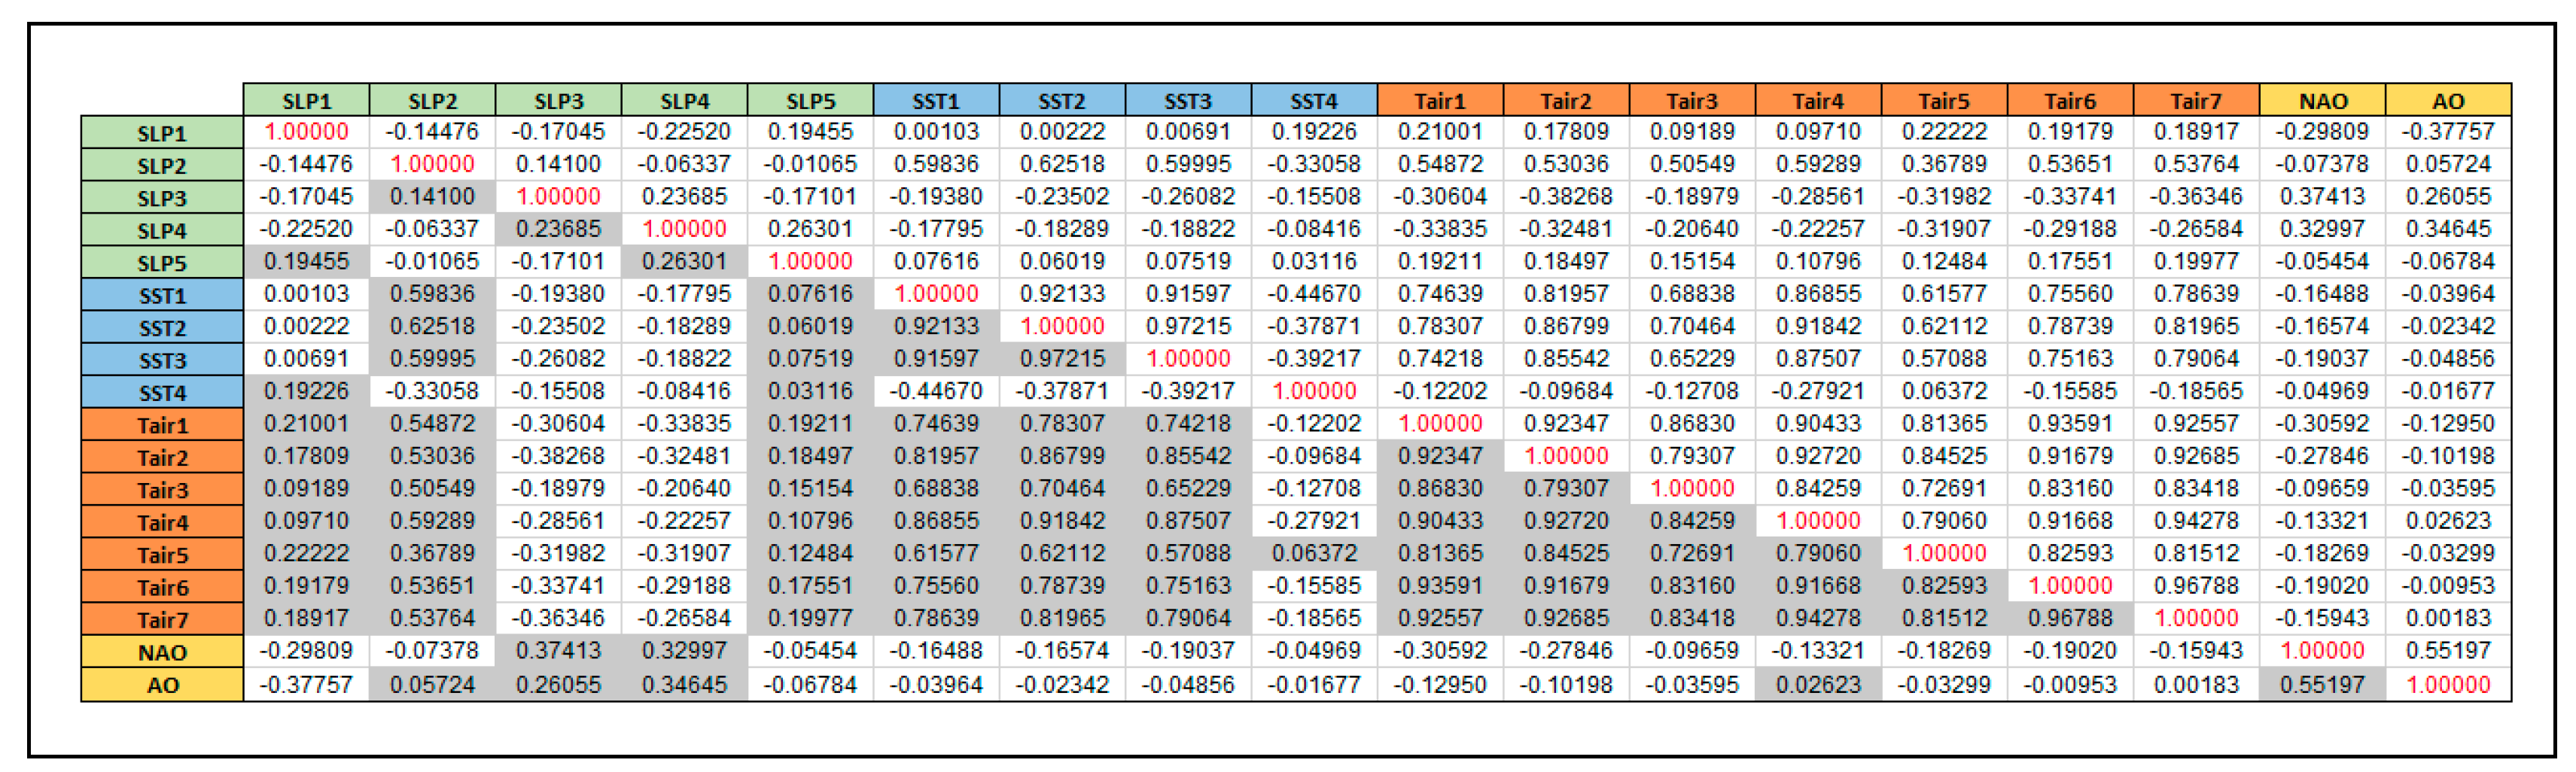
Once the regions of the North Atlantic are identified, the correlation coefficient between them, as well as the values of the NAO and AO indices, is calculated and a two-tailed
t-test below the 0.1 level of significance is applied to the resulting values to assess whether the correlation coefficient differs significantly from zero and, thus, is statistically significant.
Figure 2 displays the correlation coefficient between the studied parameters. Shaded cells represent correlation coefficients considered statistically significant. It can be observed that the highest statistically significant correlation between both the NAO and AO indices and the climate parameters is that of NAO and AO with SLP. In addition, high correlation is noticed between the climate parameters, e.g., Tair is highly correlated with both SLP and SST.
Cross-correlation analysis is then applied between the principal components of all studied parameters to identify their relationship and if there is a time lag between their occurrence. The figures below display the value of the cross-correlation coefficient of NAO and AO with indicative examples of the climate parameters.
The best time shift of NAO and SLP3 occurs at the highest cross-correlation of +0.381 with the 1st positive time shift (
Figure 3a). This means that the NAO index increases one day after the increase in the pressure at the respective area. In addition, the best time shift of NAO and SST2 occurs at the highest cross-correlation of −0.181 occurring at the 22nd negative time shift (
Figure 3b). This indicates that the sea surface temperature increases (decreases) approximately 22 days after the decrease (increase) in the NAO index. With regard to the relationship between NAO and Tair2 (
Figure 3c), the best time shifts occurred at the highest cross-correlation of −0.306 on the same day, i.e., Tair decreases, or increases, when the NAO index increases, or decreases.
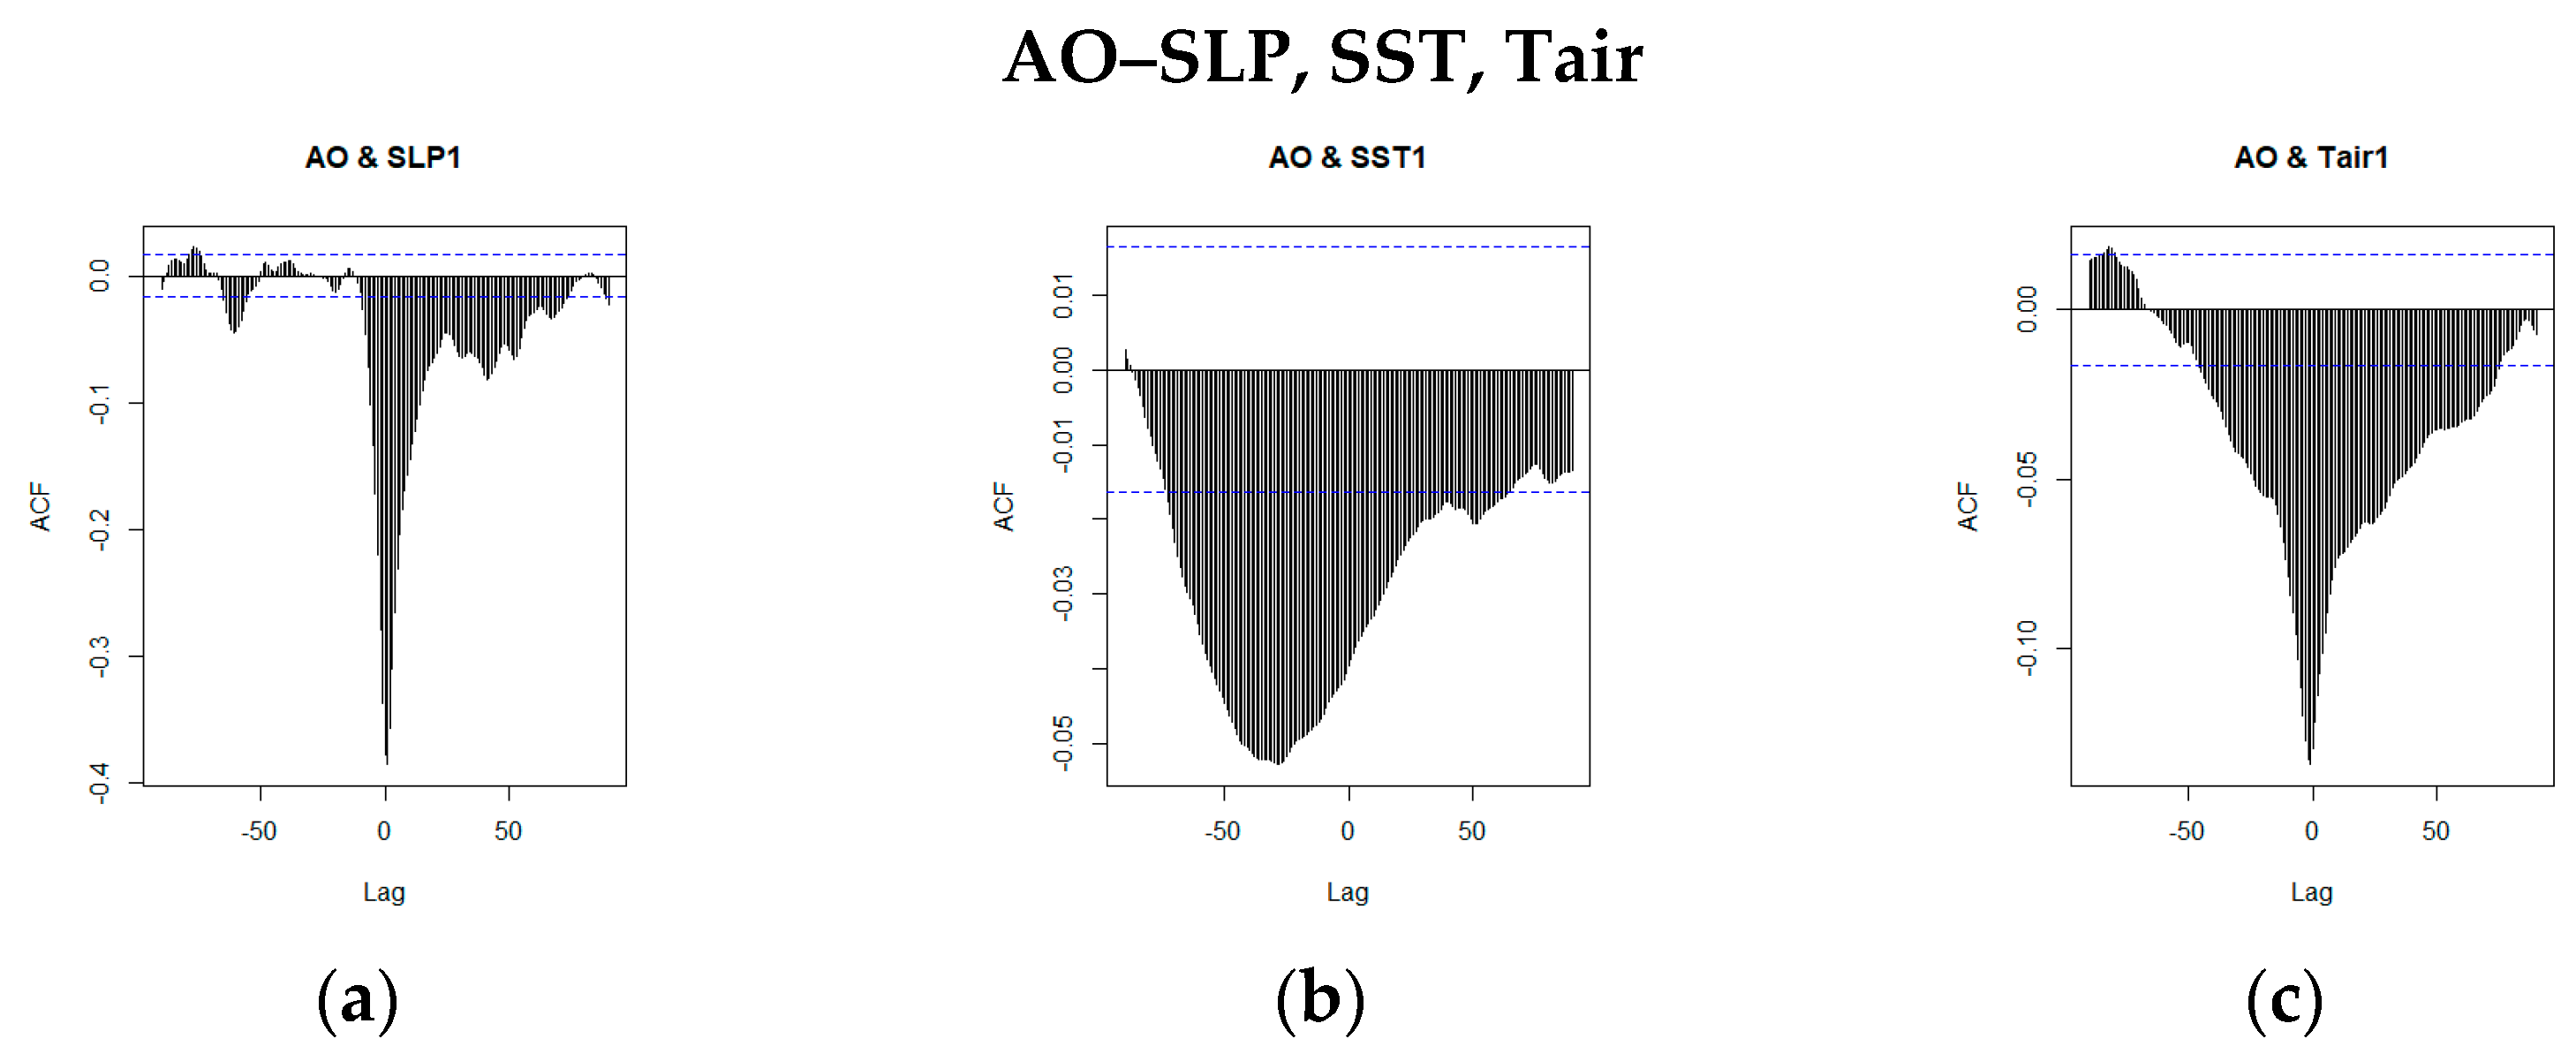
Figure 4 presents the results of the cross-correlation methodology between AO and the climate parameters. The best time shift of AO and SLP1 occurs at the highest cross-correlation of −0.385 with the 1st positive time shift (
Figure 4a). This means that the AO index increases, one day after the decrease in the pressure at the respective area and vice versa. In addition, as indicated in
Figure 4b, the best time shift of AO and Tair1 occurred at the highest cross-correlation of −0.134 with the 1st negative time shift, i.e., Tair decreases, or increases, one day after the NAO index increases, or decreases. The time shift of AO and SST1 occurs at a relatively low cross-correlation of −0.053 occurring at the 27nd negative time shift (
Figure 4b).
4. Conclusions
This study contributes to the investigation of the relationship of SLP, SST, and Tair with NAO and AO, which constitute two teleconnection patterns with significant impact on the climate of the North Atlantic and Europe. The variety of climate conditions in this specific part of the Northern Hemisphere led to the classification of the ocean into smaller regions that display similar conditions with regard to the three studied climate parameters. PCA is applied to the available timeseries, leading to the classification of the North Atlantic into 5, 4, and 5 regions based on the SLP, SST, and Tair, respectively.
Pearson correlation is then carried out in all regions to identify which of the relationships between the parameters are statistically significant. This shows that NAO and AO are highly linked mainly with SLP, a little less with Tair, and are almost independent of SST.
However, even though Pearson can showcase how statistically significant correlations between the studied parameters are, it cannot indicate if, and most specifically when, changes in one of them can lead to changes in the others. In particular, it does not highlight how NAO and AO are affecting the climate parameters in the North Atlantic, and for this reason, cross-correlation analysis is applied.
This methodology indicates that SLP over Northern Atlantic presents positive correlation with NAO and negative correlation with AO, and SLP changes precede changes in the NAO and AO indices. In addition, an above average value of NAO, as well as AO, is likely to lead to a below average value of SST about 20 days later or earlier depending on the study region. Last but not least, Tair changes usually occur 1 day after NAO or AO changes.


