Next Article in Journal
The Clean-Green Decarbonization of Remote Islands: The GReco-Islands Concept
Previous Article in Journal
A Contribution to the Study of the Vardaris Wind Regime of the Last 60 Years
 
 
Please note that, as of 4 December 2024, Environmental Sciences Proceedings has been renamed to Environmental and Earth Sciences Proceedings and is now published here.
Proceeding Paper

Renewable Energy Sources: Transition towards Sustainable Development through the Water–Energy–Food Approach †

by
Maria Margarita Bertsiou
* and
Evangelos Baltas
Department of Water Resources and Environmental Engineering, School of Civil Engineering, National Technical University of Athens, 5 Iroon Polytechniou, 157 80 Athens, Greece
*
Author to whom correspondence should be addressed.
Presented at the 16th International Conference on Meteorology, Climatology and Atmospheric Physics—COMECAP 2023, Athens, Greece, 25–29 September 2023.
Environ. Sci. Proc. 2023, 26(1), 207; https://doi.org/10.3390/environsciproc2023026207
Published: 12 October 2023

Abstract

:
The transition to renewable energy sources for a sustainable, low-carbon future is driven by the need for the mitigation of climate change. The integration of RES-based systems and storage units can deal with the intermittent nature of natural variables. The selection of storage technology is determined by various parameters related to space, topography and water resource availability. In the present study, two different storage methods, wind-powered pumped hydro storage and hydrogen fuel cells, are compared in terms of fulfillment energy and water demand of a small Aegean Sea island for the project’s 25-year lifespan.

1. Introduction

Climate change indicates the imperative need for the transition to renewable energy sources (RES) [1]. The European Union’s climate and energy plan is summarized in the Renewable Energy Directive 2018/2001/EU, according to which, by 2030, 32% of the total final energy consumption must be satisfied by RES and a 32.5% energy efficiency improvement and 40% reduction in greenhouse gas emissions must be achieved. The RES transition is a crucial step towards the reduction in greenhouse gas emissions (GHG) and the mitigation of the effects of climate change [2]. Projects based on the utilization of RES are the solution to the rise in global temperature and the reduction in negative environmental effects [3].
However, the RES transition brings a series of challenges. The most important issue is the intermittent nature of RES, especially wind and solar power [4]. RES rely on weather conditions, and the prediction and management of energy production requires new approaches [5,6]. Hybrid renewable energy systems (HRES) can deal with the stochastic nature of the natural variables through the integration of storage units. HRES combine at least one form of RES and at least one form of energy storage technology for the surplus renewable energy that cannot be utilized immediately, due to a lower energy demand compared to energy generation. Storing energy during periods of low demand and/or high energy generation, and utilizing the stored energy when the demand is high and/or the energy production is low, leads to the satisfaction of unmet demand.
Wind-powered pumped hydro storage (WPHS) is one of the most used energy storage technologies. However, its application is restricted by space requirements, access to suitable terrain [7] and water resource availability [8]. On the other hand, WPHS has a long life, fast response time and is suitable for long-term storage as only minor leakage and evaporation losses take place.
The development of hydrogen storage solutions has recently become more attractive. Green hydrogen is the hydrogen that is produced only by RES, and it is a completely clean and sustainable energy storage technology [9]. Compressed hydrogen storage is one of the most common methods of hydrogen storage, based on the ease of transportation and storage for long periods [10]. Compared to WPHS, installing a hydrogen production unit requires much less space, and no special topographic parameters are required.
The subject of stand-alone HRES becomes more attractive in the context of autonomous networks, such as non-interconnected islands (NNIs). The use of HRES provides a significant supply of the required electrical demand, avoiding simultaneous general or partial blackouts during periods of high demand. At the same time, the problem of providing clean water to these islands can be solved by the integration of a desalination unit to the HRES, in which the abundant seawater can be desalinated using RES to produce freshwater water for domestic and agricultural purposes.
In this research study, two different HRES constituting two different storage technologies, WPHS and HFC, are compared in order to make the comparison between the most widely used storage technology and an immature one that requires much less installation space. The study area is a Greek island in the South-East Aegean Sea with a lot of tourist traffic in the summer months and subsequent increased water and energy needs. The project’s lifespan is 25 years and results are extracted as hourly synthetic time series for 25 years of wind speed. The fulfillment of all water and energy demand of the island is the main purpose of the research study with the simultaneous aims of the RES transition and GHG reduction.

2. Material and Methods

The study area is Fournoi Korseon island in the South-East Aegean Sea. The permanent population is about 1400 people; however, the tourist traffic in the summer months triples this number. Meteorological data have been obtained by the National Observatory of Athens Automatic Network-NOANN [11]. Domestic water demand is based on the population, water for agricultural purposes is based on the crops of the island, the temperature, precipitation, evapotranspiration and the weighted crop coefficients [12], while data concerning electricity consumption is obtained by the Public Power Corporation.
According to [13], among the different parameters studied, the wind potential is the one that affects the results of the HRES more significantly as far as the loss of load probability, the cost of water and the cost of energy are concerned. Therefore, in this study, the production of synthetic time series of wind speed is conducted, following the methodology described in [14]. As a result, the maintenance of the hourly variation and the monthly seasonality of the wind potential is achieved, attaining the reliability of the results.
Produced wind energy is estimated according to the power curve of the selected wind turbine (WT) for this study, which is the Enercon E-900 kW (3.6 MW installed), and based on the height of the installation and the wind potential. In the HRES with the WPHS, the storage technology uses the surplus energy of the produced wind energy after the fulfillment of the demand (domestic water, agricultural water and electricity, following this priority) to pump seawater to an upper reservoir and release it for unmet demand through the day. In the HRES with the HFC, the same surplus energy is used for the desalination of the required water and afterwards, the electrolysis to produce compressed hydrogen. The hydrogen is driven to a fuel cell to produce energy for the unmet demand.
The dimensioning of both HRES’s components, the equations describing the operation of both storage technologies, WPHS and HFC, as well as the economic parameters of all the components, are based on [13]. For the WPHS, 2.6 MW of pumping station is installed, with a hydro turbine of 1.2 MW and an upper reservoir of 75,000 m3. The HFC consists of an electrolyzer of 2.8 MW, a fuel cell of 1.9 MW and a hydrogen tank of 1900 kg. Both storage technologies are based on two days of autonomy, while the restrictions of the upper reservoir and the hydrogen tank are related to a minimum state of charge of both, which is 10% of the total storage capacity. In both HRES, a desalination unit of nominal capacity of 1300 m3/day is assumed to be installed. For the first HRES, energy is consumed in the pumping station and produced by the hydro turbine, while in the second HRES, energy is consumed in the electrolyzer and the desalination unit and produced by the fuel cell.
The operation of both HRES is presented in Figure 1. The production of the wind speed time series for the first year of operation is produced. For the hourly time step, the produced wind energy and the demand data are estimated. The demand met directly by the wind energy is calculated. If there is an energy surplus REsur, it is added to the storage unit (upper reservoir or hydrogen tank) until it reaches its maximum capacity (SOCmax), and the new state of charge (SOCstorage) is calculated. When the storage unit is full and there is an energy surplus, this energy is sent to the dump. If there is an energy deficit, the storage technology (hydro turbine or fuel cell) is used for the production of this energy until it reaches its minimum capacity (SOCmin), and the new met demands, as well as the new SOC, are calculated. If the SOCstorage reaches its minimum capacity, the unmet demand is calculated. This procedure is followed for the 8760 timesteps of a whole year and continues for the next year of synthetic wind speed time series until the completion of 25 years, which is the lifetime of the HRES.
The final cost of the produced desalinated water and the final cost of the produced energy from the HRES over the 25-year period are estimated. These values are based on the initial cost, the operation, maintenance, replacement, and salvage costs, the produced energy from the hybrid system, and the energy consumed for desalination (equal to 5.85 kWh/m3 according to [5]) for each HRES. The number of times the storage units reach their lower limit during each year in the 25-year period is also estimated, which shows the critical periods in which the use of conventional fuels is necessary. It also estimates what percentage of the demands can be covered solely by wind turbines and what percentage can be covered by the storage units for each HRES and each demand, and whether these percentages fluctuate widely over the 25-year period. Finally, the water–energy–food interactions are estimated for 25 years of operation of the HRES.

3. Results and Discussion

3.1. Coverage Rate of Energy Sources

The contribution of WTs and each storage technology over 25 years is presented in Figure 2a. WTs contribute the largest percentage of needs coverage, while between the two storage technologies, the largest contribution in all years is provided by WPHS, although both storage units have been dimensioned for two days of autonomy. However, in HFC, more energy is required for the desalination of the water that is sent to the electrolyzer. In Figure 2b, the coverage rate of WTs, WPHS and HFC is presented for each demand separately: d for domestic water, ir for irrigation water and el for the electric load. In Figure 2c, the number of times that each storage unit, the upper reservoir or the hydrogen tank, is empty throughout one year of simulations and 25-year wind data are presented.

3.2. Cost of Water and Cost of Energy

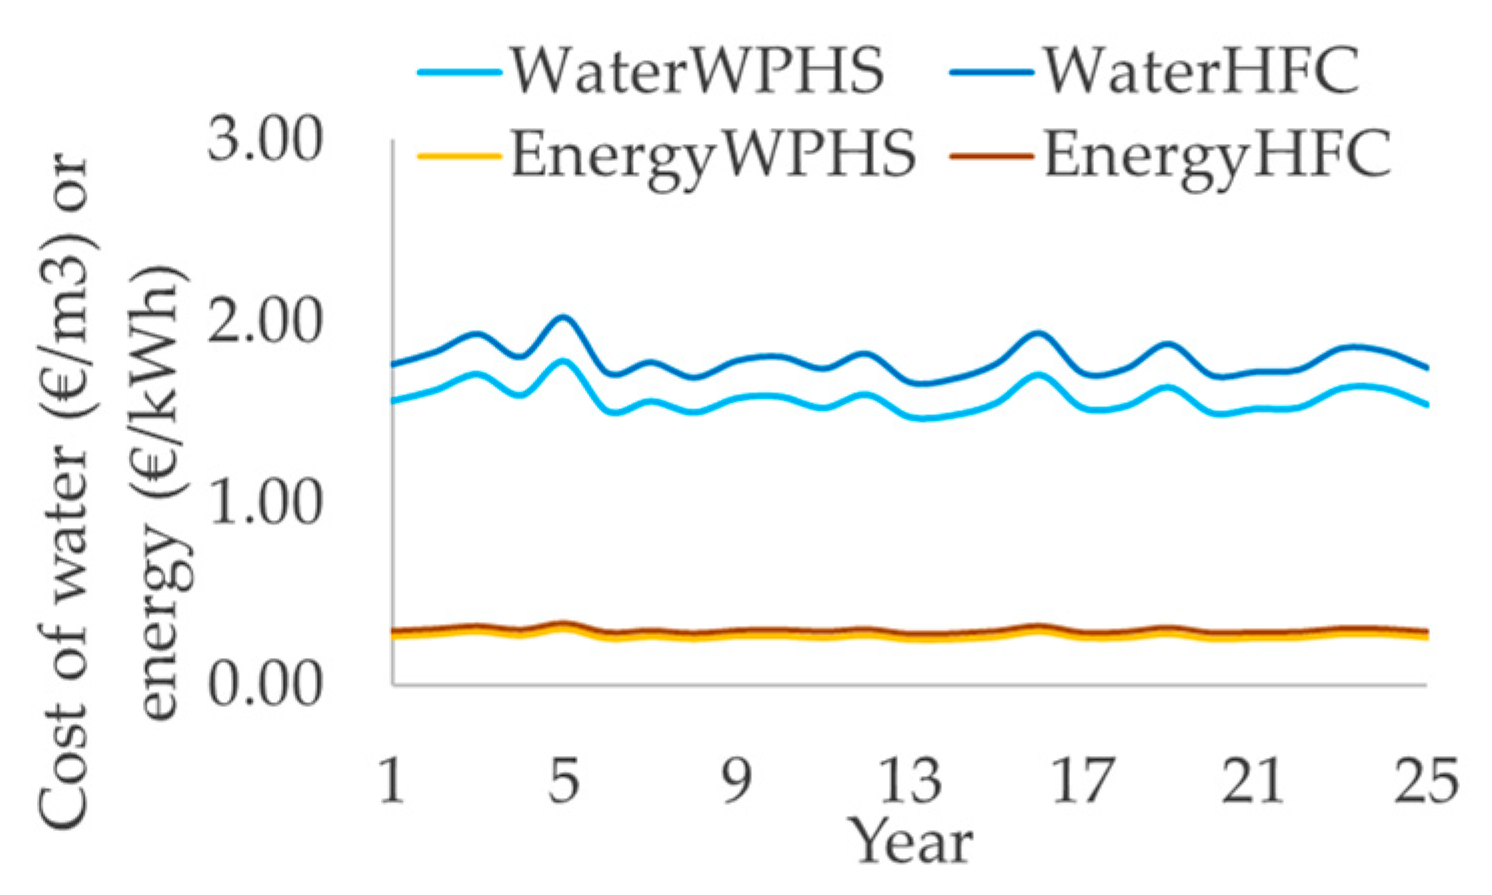
The cost of water and the cost of energy for both HRES is presented in Figure 3. The prices for both water and energy are higher for HFC compared to WPHS; however, especially for the cost of water, the results for both HRES are encouraging considering that the price of freshwater on the islands today is over 8 €/m3, and the extensive use of underground water for agricultural purposes leads to serious environmental problems.

3.3. Average Values and WEF Nexus

The average values for all of the results from the 25-year simulation are presented in Table 1. The WPHS system excels both in meeting the energy and water demands of the island, and in the final prices of water and energy. Also, in Table 1, the water–energy–food interactions are presented. Water for food (WFF) represents the water needed for agricultural purposes, energy for food (EFF) estimates the energy required for the desalination of irrigation water, and water for energy (WFE) is the water used by the pumps in the WPHS and the water that is desalinated for the electrolyzer in the HFC, which is noticeably less. Energy for water (EFW) is the water needed for the desalination of freshwater. Energy for energy (EFE) is the energy used by the pumps in the WPHS and the energy used by the electrolyzer in the HFC, which is also noticeably less.

Author Contributions

Conceptualization, M.M.B.; methodology, M.M.B.; validation, M.M.B. and E.B.; formal analysis, M.M.B.; data curation, M.M.B.; writing—original draft preparation, M.M.B.; supervision, E.B. All authors have read and agreed to the published version of the manuscript.

Funding

This research received no external funding.

Institutional Review Board Statement

Not applicable.

Informed Consent Statement

Not applicable.

Data Availability Statement

Data that support the findings of this study are not publicly available due to restrictions applied to them, but are available from the authors upon reasonable request and with the permission of the services that provided them.

Conflicts of Interest

The authors declare no conflict of interest.

References

  1. Brini, R. Renewable and non-renewable electricity consumption, economic growth and climate change: Evidence from a panel of selected African countries. Energy 2021, 223, 120064. [Google Scholar] [CrossRef]
  2. Chien, F.; Ajaz, T.; Andlib, Z.; Chau, K.Y.; Ahmad, P.; Sharif, A. The role of technology innovation, renewable energy and globalization in reducing environmental degradation in Pakistan: A step towards sustainable environment. Renew. Energy 2021, 177, 308–317. [Google Scholar] [CrossRef]
  3. Nazir, M.S.; Mahdi, A.J.; Bilal, M.; Sohail, H.M.; Ali, N.; Iqbal, H.M.N. Environmental impact and pollution-related challenges of renewable wind energy paradigm—A review. Sci. Total Environ. 2019, 683, 436–444. [Google Scholar] [CrossRef] [PubMed]
  4. Zsiborács, H.; Baranyai, N.H.; Vincze, A.; Zentkó, L.; Birkner, Z.; Máté, K.; Pintér, G. Intermittent renewable energy sources: The role of energy storage in the european power system of 2040. Electronics 2019, 8, 729. [Google Scholar] [CrossRef]
  5. Bertsiou, M.M.; Baltas, E. Energy, Economic and Environmental Analysis of a Hybrid Power Plant for Electrification, and Drinking and Irrigation Water Supply. Environ. Process. 2022, 9, 22. [Google Scholar] [CrossRef]
  6. Sánchez, A.; Zhang, Q.; Martín, M.; Vega, P. Towards a new renewable power system using energy storage: An economic and social analysis. Energy Convers. Manag. 2022, 252, 115056. [Google Scholar] [CrossRef]
  7. Ökten, K.; Kurşun, B. Thermo-economic assessment of a thermally integrated pumped thermal energy storage (TI-PTES) system combined with an absorption refrigeration cycle driven by low-grade heat source. J. Energy Storage 2022, 51, 104486. [Google Scholar] [CrossRef]
  8. Hunt, J.D.; Zakeri, B.; Lopes, R.; Barbosa, P.S.F.; Nascimento, A.; de Castro, N.J.; Brandão, R.; Schneider, P.S.; Wada, Y. Existing and new arrangements of pumped-hydro storage plants. Renew. Sust. Energ. Rev. 2020, 129, 109914. [Google Scholar] [CrossRef]
  9. Ishaq, H.; Dincer, I.; Crawford, C. A review on hydrogen production and utilization: Challenges and opportunities. Int. J. Hydrog. Energy 2022, 47, 26238–26264. [Google Scholar] [CrossRef]
  10. Escamilla, A.; Sánchez, D.; García-Rodríguez, L. Assessment of power-to-power renewable energy storage based on the smart integration of hydrogen and micro gas turbine technologies. Int. J. Hydrog. Energy 2022, 47, 17505–17525. [Google Scholar] [CrossRef]
  11. Lagouvardos, K.; Kotroni, V.; Bezes, A.; Koletsis, I.; Kopania, T.; Lykoudis, S.; Mazarakis, N.; Papagiannaki, K.; Vougioukas, S. The automatic weather stations NOANN network of the National Observatory of Athens: Operation and database. Geosci. Data J. 2017, 4, 4–16. [Google Scholar] [CrossRef]
  12. Papadopoulou, E.; Varanou, E.; Baltas, E.; Dassaklis, A.; Mimikou, M. Estimating potential evapotranspiration and its spatial distribution in Greece using empirical methods. In Proceedings of the 8th International Conference on Environmental Science and Technology, Lemnos Island, Greece, 8–10 September 2003; National Technical University of Athens: Athens, Greece, 2003; pp. 650–658. [Google Scholar]
  13. Bertsiou, M.M.; Baltas, E. Power to Hydrogen and Power to Water Using Wind Energy. Wind 2022, 2, 305–324. [Google Scholar] [CrossRef]
  14. Negra, N.B.; Holmstrøm, O.; Bak-Jensen, B.; Sørensen, P. Model of a synthetic wind speed time series generator. Wind Energy 2008, 11, 193–209. [Google Scholar] [CrossRef]
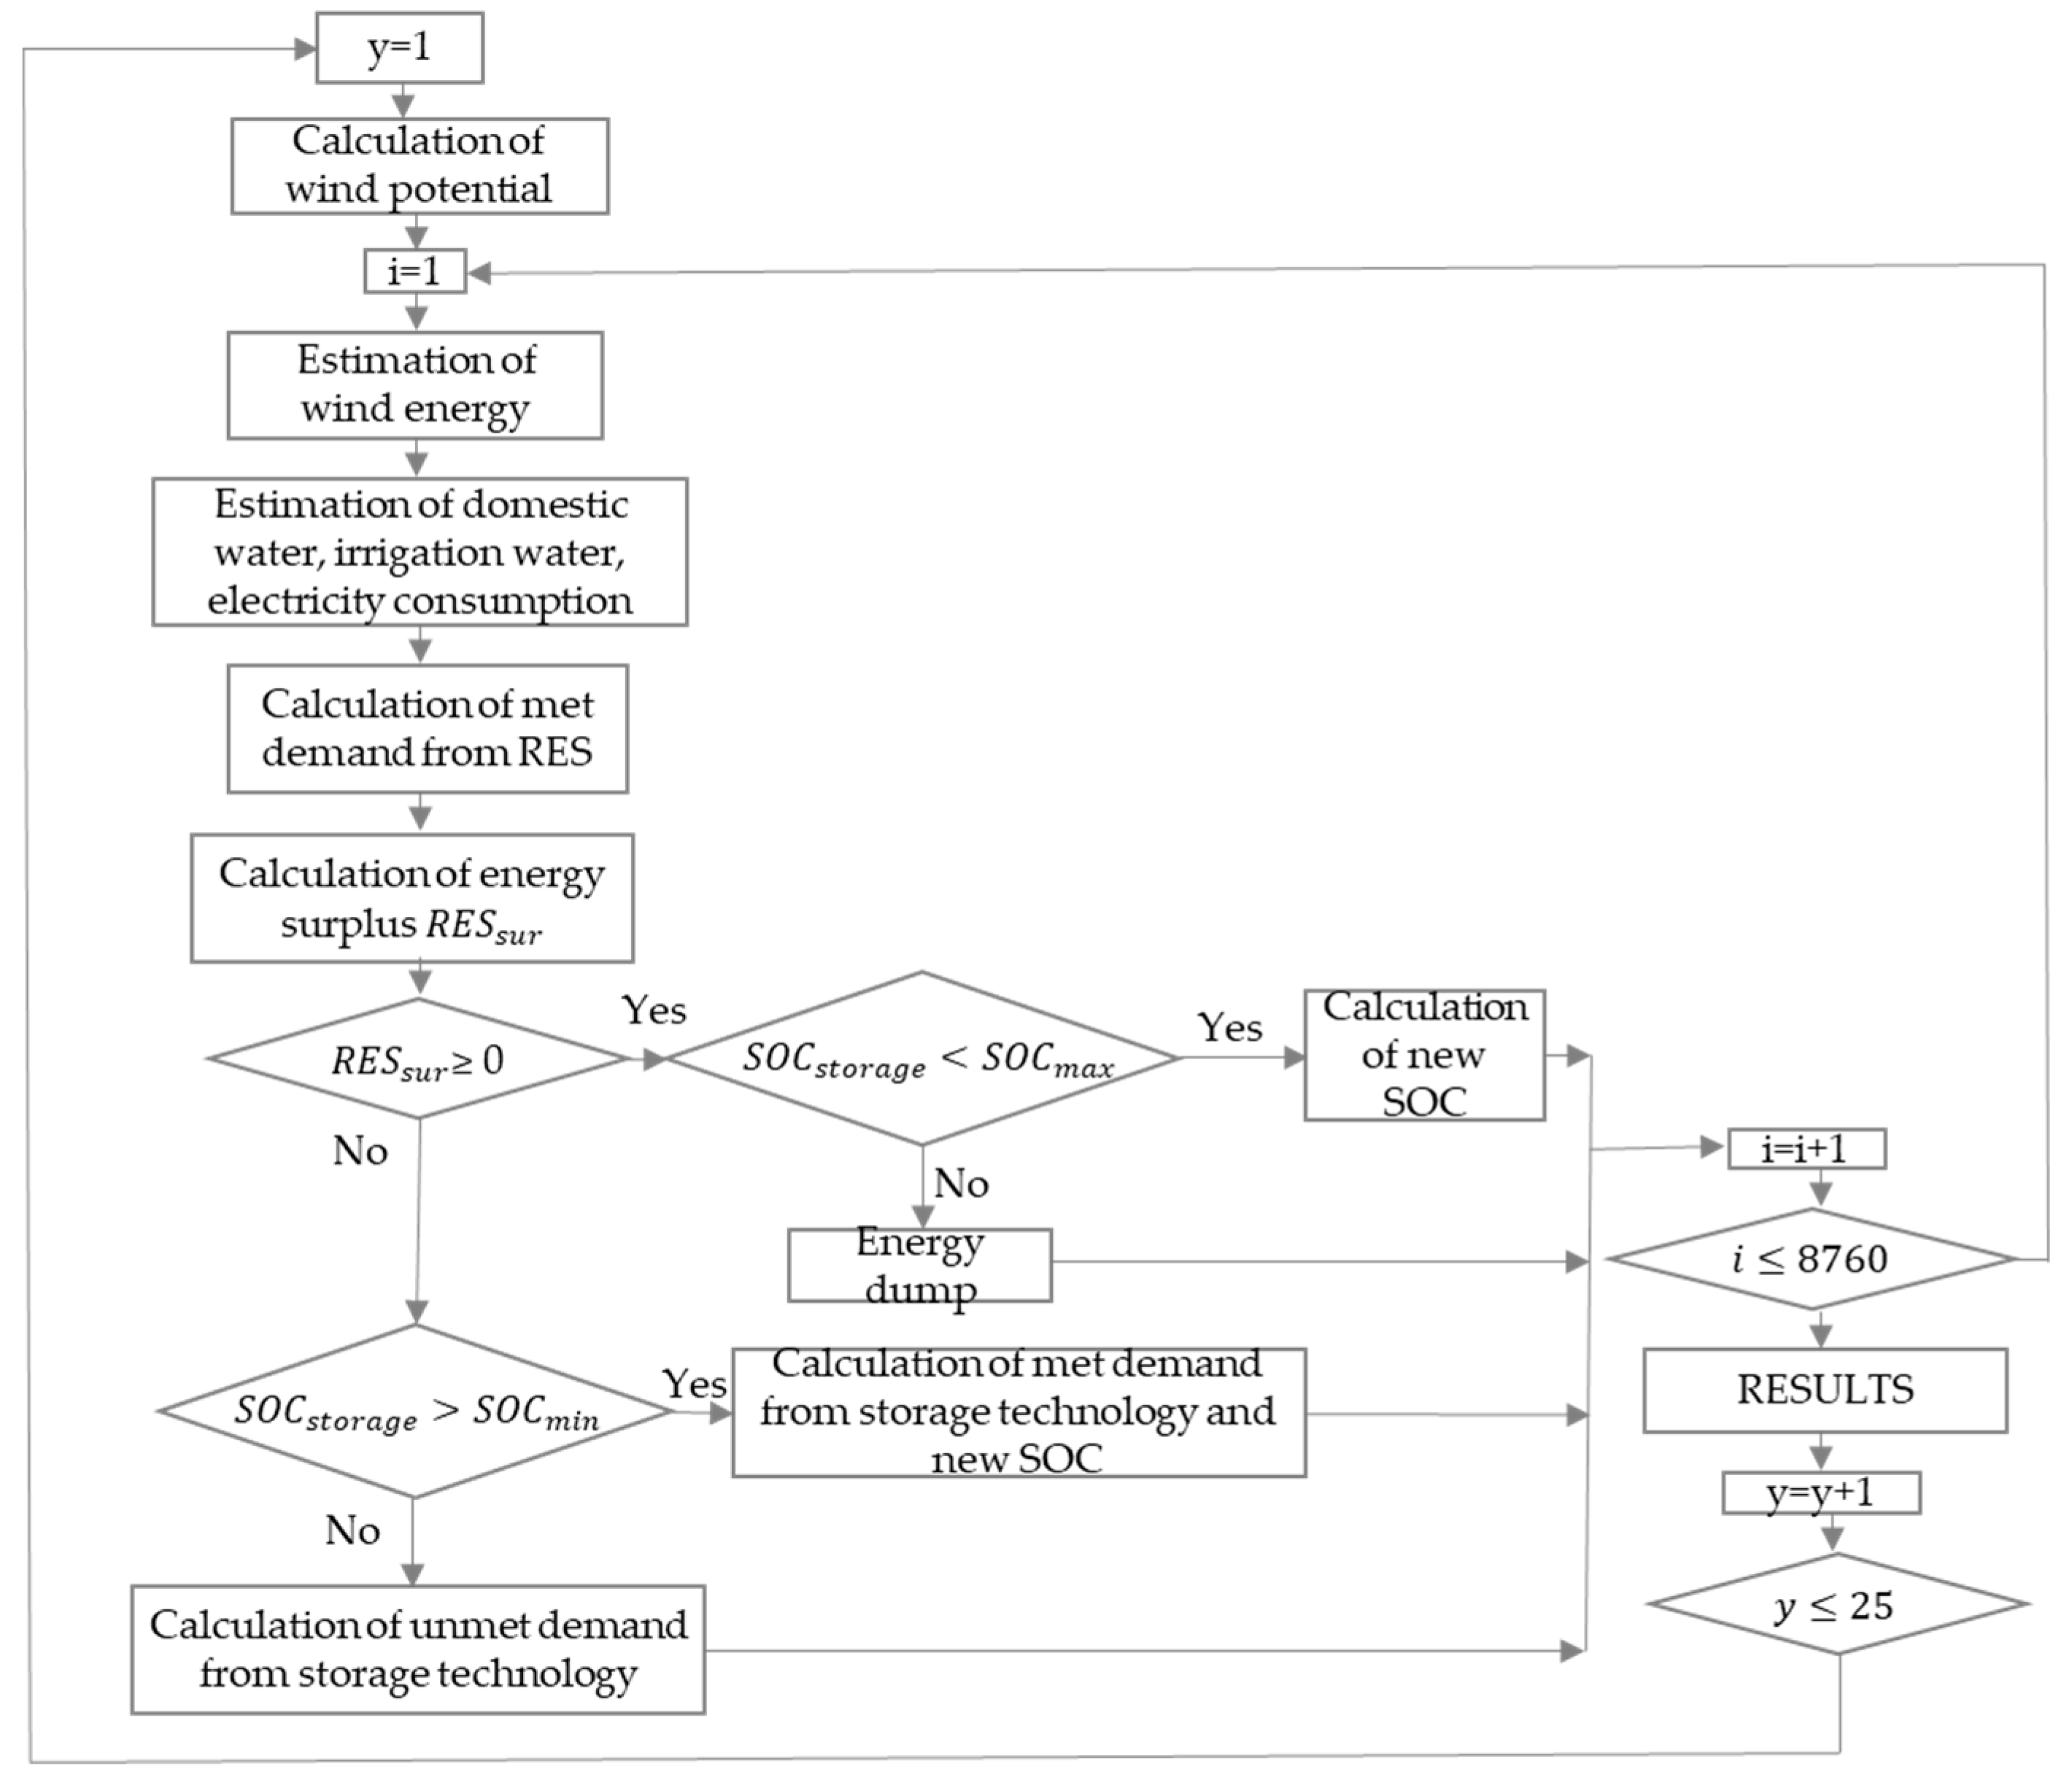
Figure 1. Flow chart of the operation of the HRES.
Environsciproc 26 00207 g001
Figure 2. Coverage percentage per energy source for 25 years: (a) total coverage of demand per energy source; (b) coverage per demand per energy sourced; and (c) times of empty storage unit (upper reservoir or hydrogen tank).
Environsciproc 26 00207 g002
Figure 3. Cost of water and cost of energy for WPHS and HFC for 25 years.
Environsciproc 26 00207 g003
Table 1. Average values for 25 years.
WPHSHFC
WT (%)56.1956.19
WPHS (%)18.92-
HFC (%)-17.12
dWT (%)74.9874.98
irWT (%)57.7157.71
elWT (%)54.0954.09
dSTORAGE (%)11.3110.35
irSTORAGE (%)24.4622.64
elSTORAGE (%)19.1017.15
Cost of water (€/m3)1.5801.787
Cost of energy (€/kWh)0.2700.305
WFF (m3)92,32290,293
EFF (kWh/year)540,085528,214
WFE (m3/year)2,597,806926.00
EFW (kWh/year)443,084457,096
EFE (kWh/year)5,151,984148,768
Disclaimer/Publisher’s Note: The statements, opinions and data contained in all publications are solely those of the individual author(s) and contributor(s) and not of MDPI and/or the editor(s). MDPI and/or the editor(s) disclaim responsibility for any injury to people or property resulting from any ideas, methods, instructions or products referred to in the content.