1. Introduction
In mid-September 2020, Medicane Ianos affected Greece, causing casualties and millions in damage [
1]. Pre-cyclogenetically, a temporary southward excursion of the North Atlantic polar jet towards southern France on the 6th of September (charts omitted) resulted in the cut-off of a cold air mass on the 7th, which, after residing for a couple of days in the Western Mediterranean, expanded and drifted east. This resulted in the Central Mediterranean being covered by a loose cyclonic circulation from the 10th of September. The polar jet, although weak (~20 m/s), surrounded the base of the trough. Within this loose trough, air became gradually unstable, as it was heated by the Mediterranean. A shallow Saharan low was detached from the main Saharan thermal low on the 12th of September and gradually moved off the coast of Libya on the 14th, where it was supplied by abundant moisture in an unstable environment of light winds at nearly all tropospheric levels. Moist convection was soon organized in mesoscale systems that rotated cyclonically around an eye-like area. As Ianos drifted east, Western Greece was affected by severe storms and high waves on the 17th and 18th of September, due to the extremely tight pressure gradient, distributed symmetrically around the “eye” of the storm, reaching a maximum intensity of four (4) isobars in a distance of 200 km in the early morning hours of the 18th of September. Further east, over an area of lower sea surface temperatures, the central pressure (pressure gradient) of Ianos increased (decreased) significantly. This resulted in a surface wind speed decrease, as well as a temporary improvement in weather conditions. However, the dynamical interaction with the NE-erlies and the cool air masses associated with a cold frontal tail that affected NE-ern Greece, led to a re-intensification of the associated rainfall in the area of Thessaly on the 19–20th, where daily amounts reached 100 mm at places.
The aim of this paper is to study the synoptic scale processes that led to the formation of the incipient cyclone and maintained it, until its entry into the Mediterranean, which finally transformed it into Medicane Ianos. To do that, 850 hPa temperature plus its advection and 300 hPa winds are mapped throughout the study period, which extends from 12 when the cyclone formed to 14 September 2020 when the cyclone entered the sea. Further, 950 hPa relative vorticity is used as a measure of cyclonic intensity and, of course, mean sea level pressure (MSLP). Threehourly European Centre for Medium-range Weather Forecasts (ECMWF) data is used for the charts, which are available through the European Meteorological Satellite (EUMETSAT).
In order to enlighten the cyclogenetic role of the downward advection of stratospheric, high potential vorticity (PV) air, vertical sections are drawn along the cyclonicflank of the jet, the right (eastern) end of which, reaches the incipient low. Six hourly wind, theta, omega, and vorticity data are analysed in the sections. These data have either come directly from the ECMWF or been calculated from them. Vertical sections are not drawn along straight but along curved lines that are parallel to the jet axis. The assumption is made for the wind direction that it does not change too much downwards, so that the total wind field can give a realistic impression of thealong section wind component, not only at the jet level, but also lower down. This assumption may hold to the degree that the upper-level baroclinicity is weak enough at this time of the year and at such a low latitude.
2. Isobaric Charts and Vertical Sections
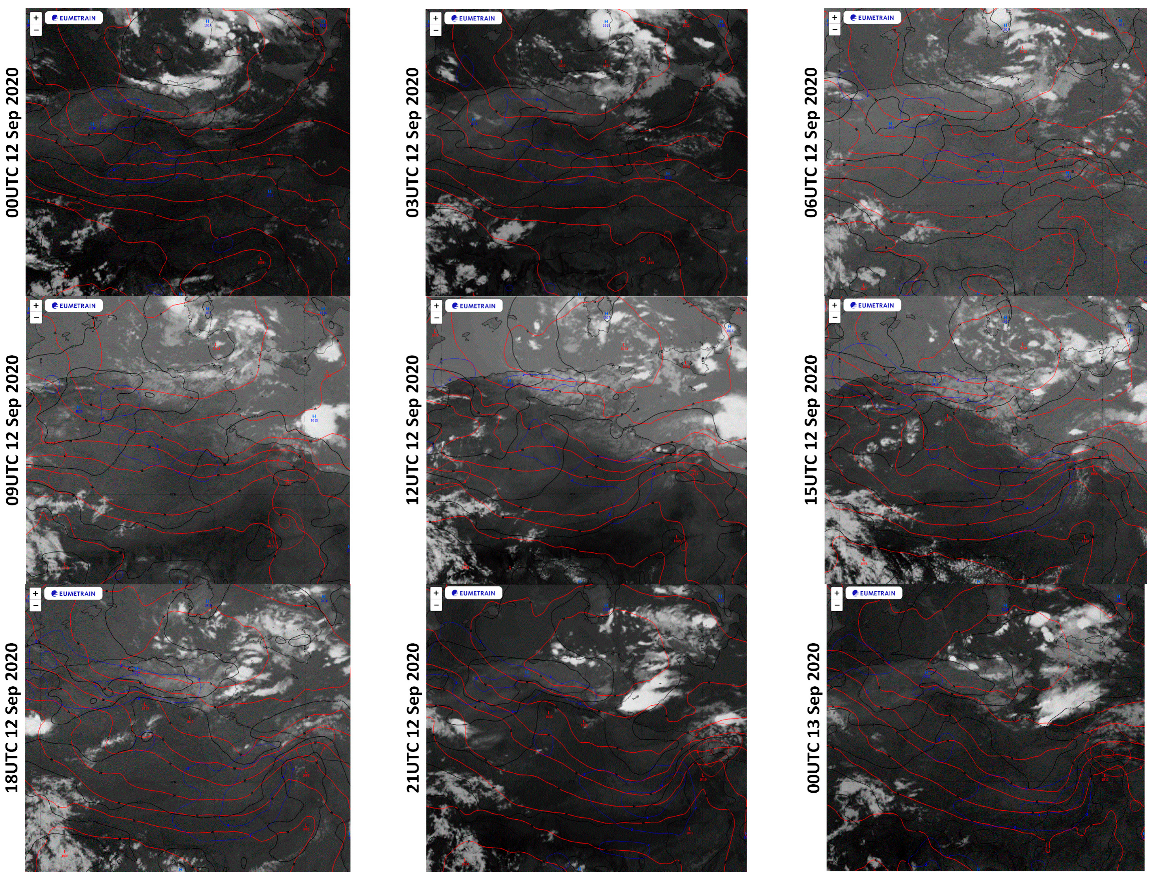
On 12 September 2020 00UTC (hereafter 00/12 September), the synoptic situation is dominated by a relatively cold, for the end of the summer, the air mass in the West Central Mediterranean, with T
850 hPa < 14 °C (
Figure 1). A quite barotropic low with a central pressure of 1012 hPa is in the centre of the cold air mass. The Saharan thermal low prevails south of 28° N with permanent areas of MSLP < 1008 hPa and T
850 hPa > 28 °C. A quite tight temperature gradient is observed between the above two systems. Such baroclinic zones are semi-permanent in North Africa and, being located under the
sub
tropical
jet (STJ), favour the formation of Saharan depressions at the stage they are still shallow thermal lows [
2]. This turns out to be the case in the event under study, too, in which the presence of the cold air mass in the Mediterranean acts to increase the baroclinicity and shift it northwards.
Initially (00/12 September), no significant warm air advection (WAA) is observed, while cold air advection (CAA) prevails mainly in the western part of the chart. On 03/12 September (
Figure 1), a WAA area appears, doubling in strength on 06/12 September, with a simultaneous NE-ward extension of an inverted MSLP trough nearly up to the coast of NW Libya. As the thermal wave, associated with the CAA/WAA dipole, amplifies with time, a closed low forms on the tip of the warm tongue (09/12 September), with the pressure gradient around it increasing significantly at 12/12 September (
Figure 1).
The MSLP (horizontal temperature gradient) attains a minimum (maximum) value of 1008 hPa (10 °C/150 km) during 15–18/12 September. Associated vorticity reaches a maximum (see
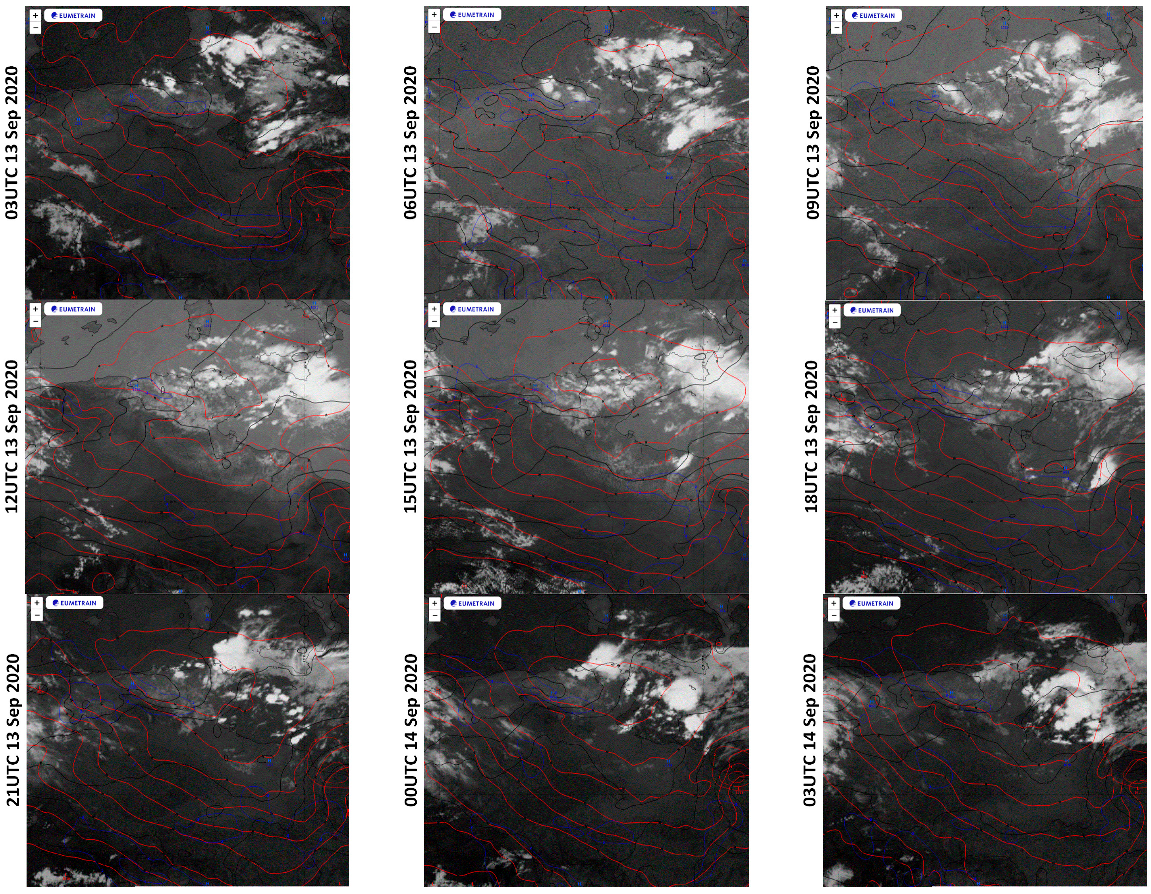
Figure 2) on 21/12 September, with wave breaking and a kind of occlusion process beginning after this time (
Figure 1). A slight filling of the low takes place, as the thermal gradient weakens. Vorticity also weakens, with a considerable phase lag of nearly 12 h (see
Figure 2), beginning to increase again from 18–21/13 September (
Figure 2). So, does the thermal gradient and the associated WAA (
Figure 1), but, as will be seen below, this is more the result rather than the cause of this second phase of the cyclogenesis under study. A second wave-breaking event seems to take place from the early hours of 14 September. Finally, the cyclone enters the sea on 12/14 September, with a pressure gradient of ~4 hPa/150 km surrounding it. In a barotropic, already convecting marine environment, WISHE-type processes soon turn the depression into a Medicane [
1].
The upper flow is shown in
Figure 2, beginning from 12 September 18UTC, as upper-level processes are not of major importance until then. The dominant feature of the low-level vorticity is an area of cyclonic circulation at 14° E, 32° N, obviously associated with the low under study (cf.
Figure 1). Vorticity values double by 21/12 September. During the 12th of September, the low is well to the south of an at least 50 kts strong (at 300 hPa) westerly jet, a position that is not favourable for downward vorticity advection from upper levels. Given the gradual weakening of the low-level thermal gradient, in the evening of the 12th and of the associated WAA in the morning of the 13th (cf.
Figure 1), it turns out that conditions become less favourable for cyclogenesis unless a new supporting mechanism emerges.
From the early hours of the 13th of September, the westerly jet streak to the north of the low weakens and travels ENE-wards. As the trough in the Central Mediterranean amplifies towards the SSW, a new NW-erly jet streak forms above Algeria, reaching 50 kts by 12UTC on 13 September. The jet exit is at ~10° E, 31° N, at the same latitude as the low, which has now progressed to ~16° E. This relative position is favourable for cyclonic vorticity advection (CVA) from the jet to the cyclone. Indeed, as the jet approaches the low, several jet streaks form in it, associated with CVA maxima, which consecutively contribute to the increase and expansion of the cyclonic vorticity in the low under study. At 12UTC on 14 September, the last upper-level CVA maximum overtakes the cyclone, but by this time the cyclone has entered the sea and moist processes come to play.
The vertical structure of the vorticity pattern and its effect on the cyclone under study is shown in the cross sections of
Figure 3, which are drawn along the cyclonic flank of the NW-erly jet. The low is located at the right (ESE-ern) end of the cross sections (see traces in resp. charts of
Figure 2). The first cross section (
Figure 3a) is on 06/13 September, a time when the low was still maintained by low-level processes, mainly. As can be seen at the right end of the section, the ascent and the cyclonic vorticity are limited up to the 850 hPa level at this initial stage, while descent, as well as weak anticyclonic motions, are observed aloft. The negative vertical gradient of the vorticity, as well as the local dipping down of the isentropes, indicate the warm core of this shallow cyclone. The high tropopause (~130 hPa) above the low indicates its tropical character. Right to the west of the low, tropopause height decreases abruptly to ~220 hPa. Isentropes also tilt upwards towards the west, where wind speed increases, too. From the above, it is gathered that the low is located downstream of the exit of the jet (see also the chart from
Figure 2 for 06/13 September), just to the southeast of the cold upper-level trough that covers the Central Mediterranean. Descent prevails throughout most of the section, locally exceeding 0.2 Pa/s, which potentially means that CVA may occur down the isentropes from the cyclonic flank of the jet towards the low under study.
Upper-level vorticity hardly reaches 4 × 10
−5 s
−1 on 06/13 September. As the jet strengthens (cf.
Figure 2) on 12/13 September, upper-level vorticity values double in the west (
Figure 3b). Some of this vorticity seems to be advected downwards along the flow. Six hours later, on 18/13 September, the advected vorticity has apparently reached the surface low (bottom left corner of
Figure 3c), where, due to the low static stability, cyclonic circulation abruptly increases to >6 × 10
−5 s
−1. The upper-level vorticity maximum (12 × 10
−5 s
−1) progresses relatively slowly SE-wards (~12° E), being associated with an upper-level positive PV anomaly of a local minimum of the dynamic tropopause height of ~380 hPa (
Figure 3c). At 00/14 September, a tilted vorticity “tower” forms, which almost connects the surface low (bottom left corner of
Figure 3d), with the vorticity “reservoir” of the positive PV anomaly in the centre of the cross section (10° E). This vorticity tower is co-located with a “tongue” of descent, locally stronger than 0.2 Pa/s, extending from the tropopause down to the 800 hPa level, just upstream of the cyclone under study. This supports the scenario of downward advection of vorticity. The upper-level cyclonic vorticity anomaly is positioned above the surface low on 06/14 September (17° E,
Figure 3e), the vorticity tower being upright at this time. A new cyclonic vorticity anomaly appears in the west (8° E,
Figure 3e), which progresses to 12° E until 12/14 September (
Figure 3f), being again connected with the low-level vorticity maximum with a tilted vorticity tower.


