1. Introduction
Wildfires, a recurring natural event in nearly all ecosystems [
1], are experiencing a troubling trend toward increased size and intensity [
2,
3]. This surge in severe wildfires is inflicting profound ecological and socio-economic consequences [
4]. Such wildfires often overwhelm suppression efforts, causing extensive damage and tragically claiming civilian and firefighter lives. A significant recent example is the catastrophic wildfires that occurred in the first week of August 2021 in Greece. They occurred in several regions of Central Greece and the Peloponnese on 3rd and 4th August 2021 and kept burning for several days. Collectively, these wildfires destroyed nearly 94,000 hectares of land, accounting for over 70% of the 2021 total area burnt and nearly tripling the annual average from 2008 to 2021 [
5].
Aerosols, comprising solid and gaseous particles suspended in the atmosphere, exert a profound influence on both local and global atmospheric conditions, climate dynamics, and ecosystems [
6]. These particles, known as particulate matter (PM), are typically classified according to their aerodynamic diameter, with PM10 and PM2.5 being the most extensively monitored. PM2.5 specifically refers to particles with a diameter of less than 2.5 µm and constitutes a primary source of atmospheric pollution [
7]. Notably, particulate matter (PM) air pollution stands as a significant global contributor to mortality, with documented adverse health effects stemming from both short-term and long-term exposure [
8]. Aerosols originating from wildfires can have devastating consequences for many aspects of human life, including lung cancer and respiratory infections [
9,
10].
In this study, we use the Weather Research and Forecasting (WRF) model coupled with chemistry (WRF−Chem) v4.4.2 to simulate the effects of the catastrophic 2021 August 4th–August 8th Greek wildfire events on weather and air pollution. This is the first study determining the importance of using biomass burning emissions in weather simulations using an ensemble of perturbed initial weather conditions over the Greek domain to study its influence on local weather.
2. Data and Methodology
2.1. Climate Data Used for Comparison
For this study, two different observation datasets were utilized for model validation purposes. For temperature validation, hourly gridded ERA5 reanalysis surface temperature data was used at a spatial resolution of 0.25°. Reanalysis combines model-derived data with global observations, creating a comprehensive and consistent dataset worldwide by applying the principles of physics.
For the assessment of aerosols, we utilized the MCD19A2 Version 6 dataset sourced from the Moderate Resolution Imaging Spectroradiometer (MODIS) Terra and Aqua satellites, employing the multi-angle implementation of atmospheric correction (MAIAC) land aerosol optical depth (AOD) gridded Level 2 product. This dataset provides daily readings at a 1 km resolution. AOD serves as an indicator of the extent to which atmospheric particles, or aerosols, hinder the transmission of light through the atmosphere. Aerosols scatter and absorb incoming sunlight, thereby reducing visibility. An AOD value below 0.1 corresponds to “clean” conditions, characterized by clear blue skies, radiant sunshine, and optimal visibility for ground observers. As AOD values increase to 0.5, 1.0, and exceed 3.0, the aerosol concentration becomes so significant that it obscures the Sun. AOD is a dimensionless property, representing the ratio of incoming solar radiation to the radiation reaching the Earth’s surface. It is predicated on the alteration of how the atmosphere reflects and absorbs visible and infrared light via these particles [
11,
12].
2.2. Selection of Fire-Smoke-Plume-Affected Areas
Several WRF–Chem simulations were performed with and without fire emissions in order to study the effects of wildfire on the weather and atmospheric pollution. However, out of the entire Greek domain, only the areas affected by the wildfire smoke plume had to be selected to provide concrete conclusions about the effects of wildfires. The wildfire-smoke-affected areas were selected based on the average aerosol optical depth (AOD) values greater than the 90th percentile from all perturbation runs. This design permitted clear isolation of the wildfire impact areas as well as a more accurate comparison with the rest of the non-wildfire-smoke-plume-affected areas and thus is used for the figures below.
3. Results
3.1. Validation of Air Pollution
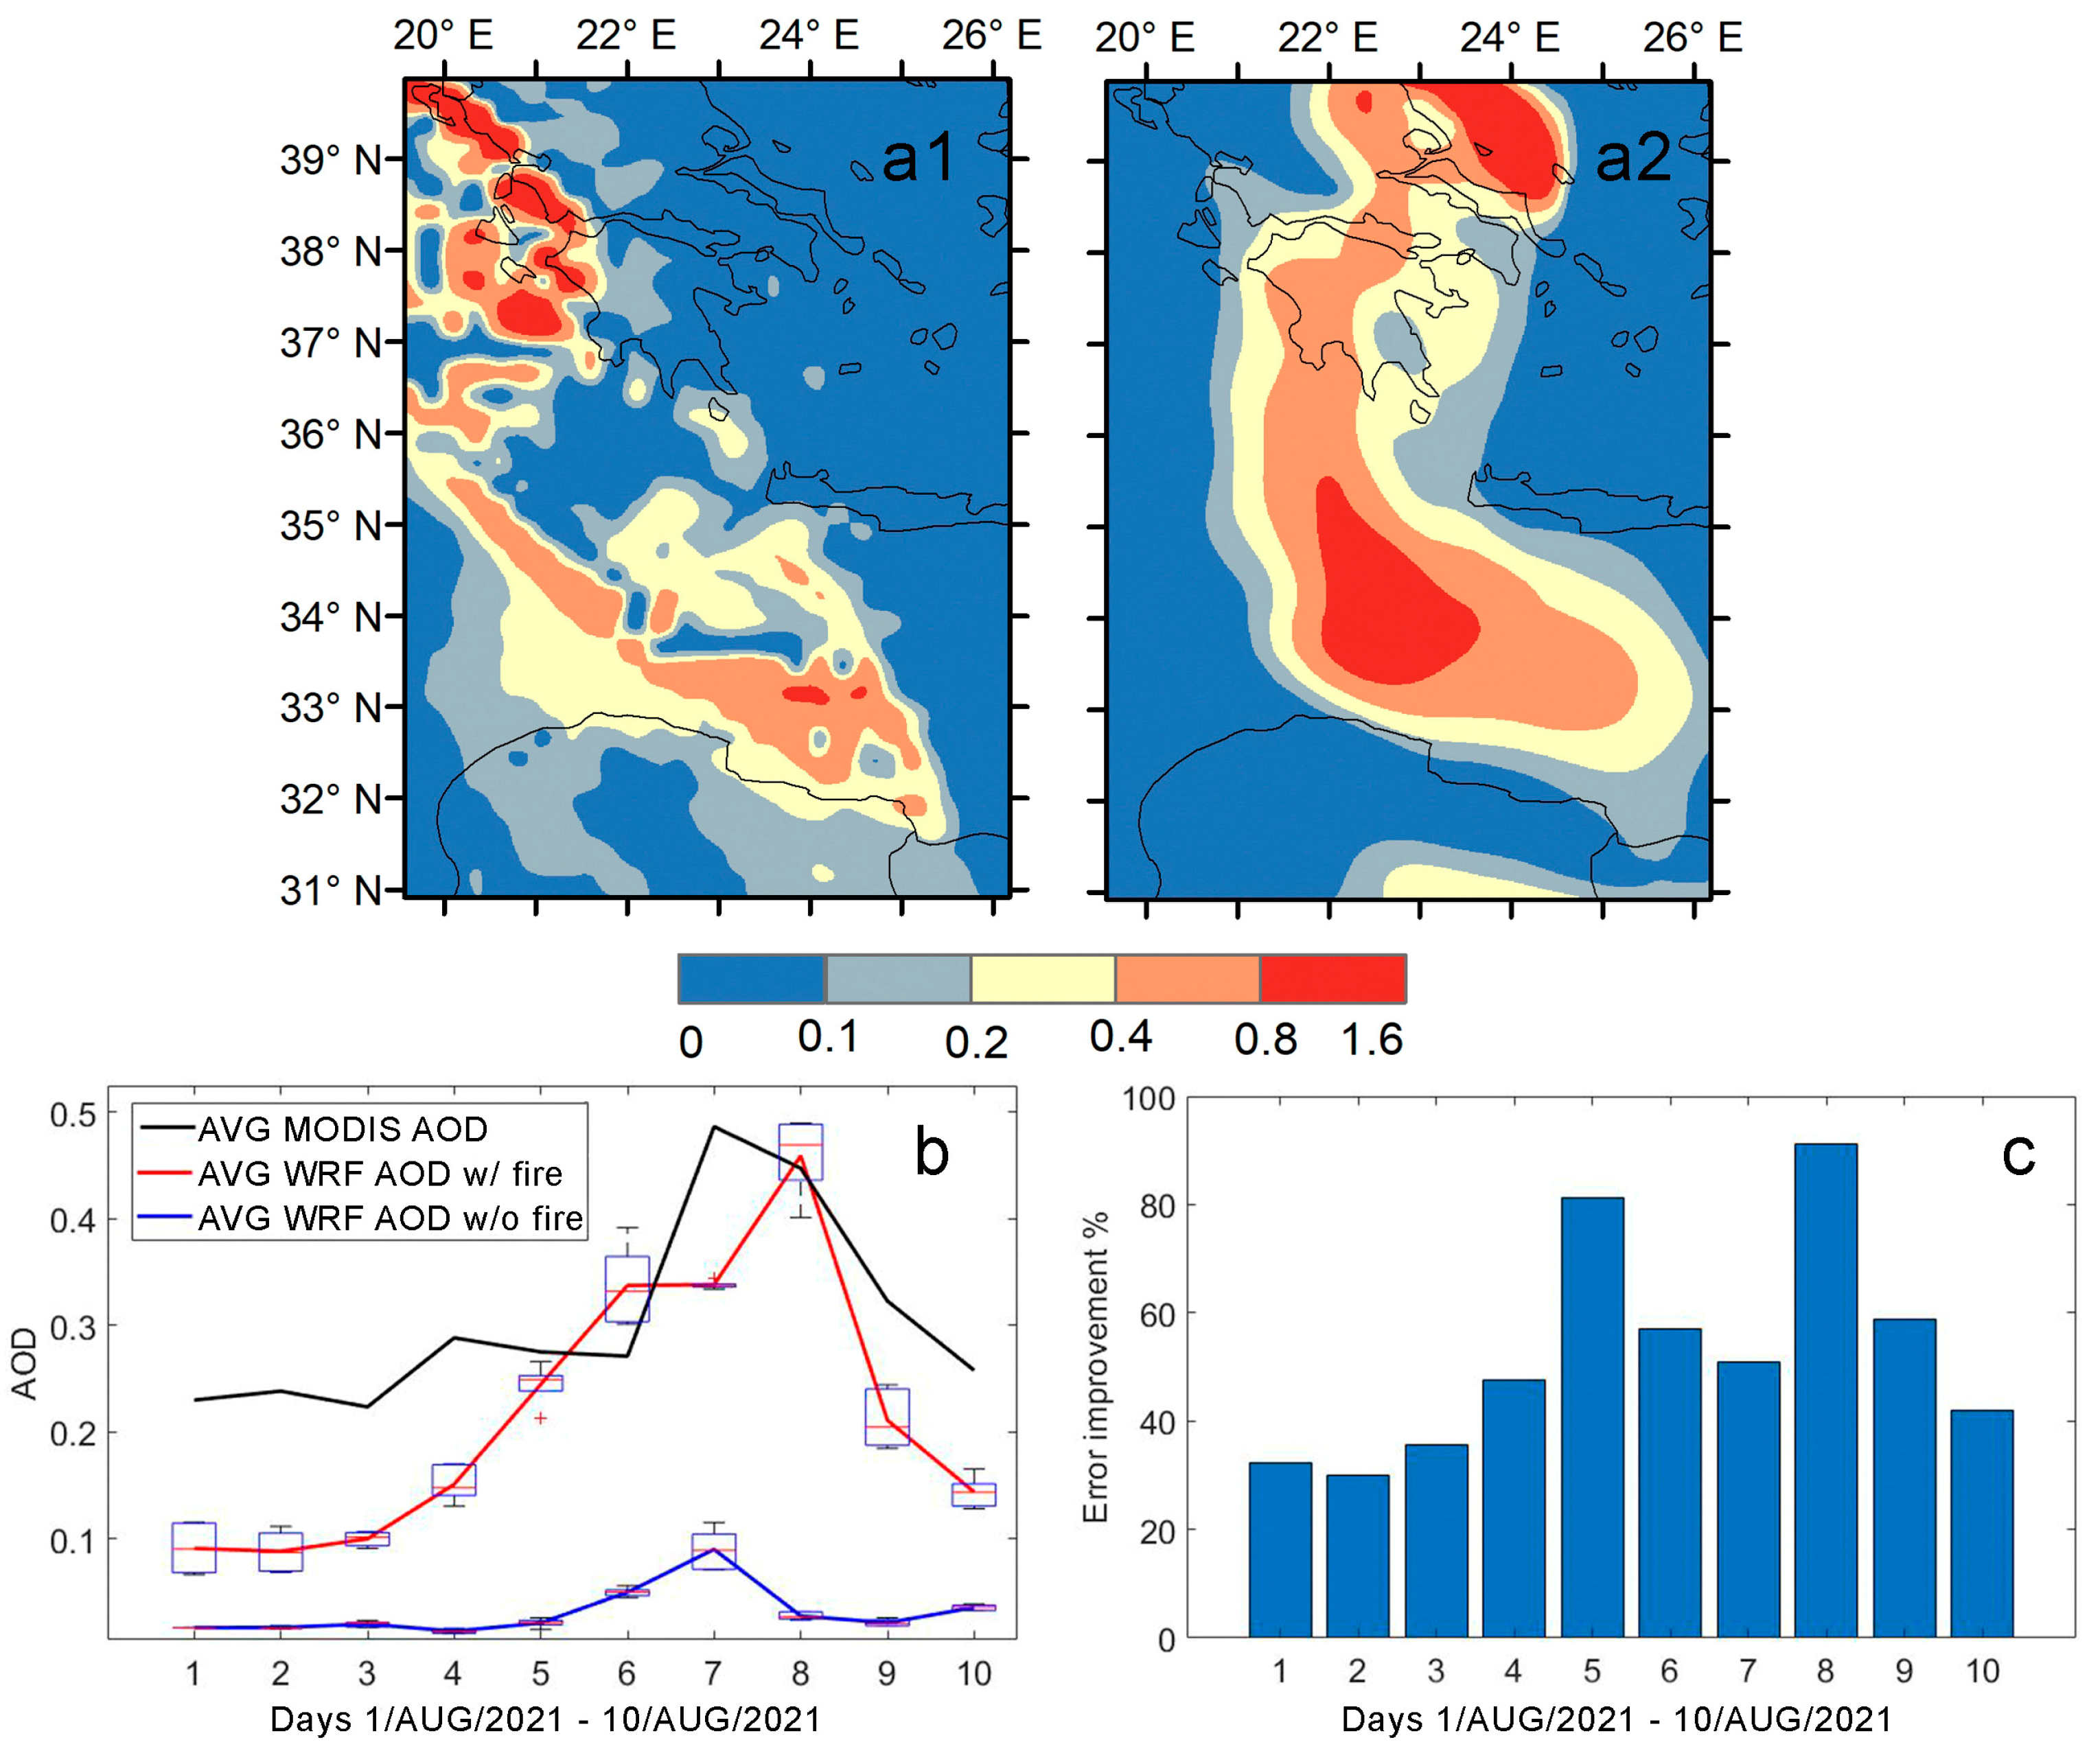
To validate the WRF–Chem simulations, they were compared with MODIS AOD data. However, these data were scarce and inconsistent, which led to inaccuracies in the correlation in
Figure 1a. Although there were rare cases when MODIS had somewhat consistent data like for the day 8 August 2021 as seen in
Figure 1(a1), these match the simulated ones in
Figure 1(a2) nicely. In an attempt to compare the simulated data with the MODIS observations, a fire smoke plume mask was created based on the simulated AOD values greater than the 90th percentile (explained in
Section 2.2). The MODIS as well as the AOD values from all perturbation runs with and without using fire emissions were averaged for the areas affected by smoke and are plotted in
Figure 1b. It is clear that when fire emission data are implemented in the model, it is possible to simulate the actual conditions with far greater confidence, as indicated by the error improvement bar graph in
Figure 1c, such as some days like the 5th and 8th showing an improvement 80% and 90%, respectively. In addition, the error improvement is on average even higher between the 4th and 9th days, which corresponds with the actual fire days.
3.2. Validation of Temperature
To determine the validity of the WRF–Chem simulated data, they were also compared with reanalysis ERA5 data, as seen in
Figure 2. It is apparent that when using fire emissions in WRF–Chem simulations, the correlation with ERA5 is stronger in the smoke-plume-affected areas (using the same fire mask as explained in
Section 2.2) as it is clearly visible in
Figure 2c. The ERA5 as well as the temperature values from all perturbation runs with and without fire emissions were averaged for the areas affected by smoke and plotted in
Figure 2d. It is clear that when fire emission data are implemented in the model, it is possible to simulate the actual conditions with a higher error improvement, as seen in
Figure 2e, such as some days like the 5th and 6th showing an improvement of 5%, respectively. In addition, the error improvement is on average even higher between the 4th and 8th days, which corresponds with the actual fire days. Especially during the fire days when WRF is used without fire emissions, the simulation tends to underestimate fire-smoke-plume-affected areas’ temperature by 2 °C on average.
4. Conclusions
The present study evaluated the effects of the catastrophic Greek wildfire events between 4 and 8 August on weather and air pollution using an ensemble of perturbed initial weather conditions. We performed those simulations 5 days prior to these catastrophic wildfires using the WRF–Chem model to give enough time for the model to stabilize the atmospheric processes. The mode’s simulated aerosol optical depth (AOD) with and without using biomass burning emissions was validated against MODIS observations. It was found that when using biomass burning emissions, the results have a 50% error improvement on average when compared to the observations with the highest improvement being observed for the catastrophic wildfires between 4 and 8 August. Similarly, the model’s simulated temperature was validated against ERA5 temperature data for the same period. It was found that even though the spatial correlation between the simulated and ERA5 temperatures marginally improved, it was clear that this improvement happened for the fire-smoke-plume-affected areas. In addition, when the ERA5 and simulated temperature with and without biomass burning emissions were spatially averaged and compared temporally, it was found that even though the error had a maximum improvement of 5% when using biomass burning emissions, it was clear that the improvement increased specifically for the wildfire days.
This study is also subject to certain limitations. The sources of uncertainties in MODIS include instrument and cloud masking errors. Similarly, in the ERA5 temperature dataset, even though it is corrected by actual temperatures from weather stations, those can be scarce, and thus interpolation uncertainties arise.
Author Contributions
Conceptualization, A.V.; methodology, A.V. and A.R.; software, A.R.; validation, A.V. and A.R.; formal analysis, A.R.; investigation, A.R.; resources, A.R.; data curation, A.R.; writing—original draft preparation, A.R.; writing—review and editing, A.V.; visualization, A.R.; supervision, A.V.; project administration, A.V.; funding acquisition, A.V. All authors have read and agreed to the published version of the manuscript.
Funding
This research was funded by the Leverhulme Centre for Wildfires, Environment, and Society through the Leverhulme Trust (grant number RC-2018-023), and also supported by the AXA Research Fund and the Hellenic Foundation for Research and Innovation.
Institutional Review Board Statement
Not applicable.
Informed Consent Statement
Not applicable.
Data Availability Statement
Conflicts of Interest
The authors declare no conflict of interest.
References
- Bistinas, I.; Harrison, S.P.; Prentice, I.C.; Pereira, J.M.C. Causal relationships versus emergent patterns in the global controls of fire frequency. Biogeosciences 2014, 11, 5087–5101. [Google Scholar] [CrossRef]
- Rovithakis, A.; Grillakis, M.G.; Seiradakis, K.D.; Giannakopoulos, C.; Karali, A.; Field, R.; Lazaridis, M.; Voulgarakis, A. Future climate change impact on wildfire danger over the Mediterranean: The case of Greece. Environ. Res. Lett. 2022, 17, 045022. [Google Scholar] [CrossRef]
- Wang, X.; Thompson, D.K.; Marshall, G.A.; Tymstra, C.; Carr, R.; Flannigan, M.D. Increasing frequency of extreme fire weather in Canada with climate change. Clim. Chang. 2015, 130, 573–586. [Google Scholar] [CrossRef]
- Tedim, F.; Leone, V.; Amraoui, M.; Bouillon, C.; Coughlan, M.R.; Delogu, G.M.; Fernandes, P.M.; Ferreira, C.; McCaffrey, S.; McGee, T.K.; et al. Defining Extreme Wildfire Events: Difficulties, Challenges, and Impacts. Fire 2018, 1, 9. [Google Scholar] [CrossRef]
- Giannaros, T.M.; Papavasileiou, G.; Lagouvardos, K.; Kotroni, V.; Dafis, S.; Karagiannidis, A.; Dragozi, E. Meteorological Analysis of the 2021 Extreme Wildfires in Greece: Lessons Learned and Implications for Early Warning of the Potential for Pyroconvection. Atmosphere 2022, 13, 475. [Google Scholar] [CrossRef]
- Wu, X.; Wang, Y.; He, S.; Wu, Z. PM2.5/PM10 ratio prediction based on a long short-term memory neural network in Wuhan, China. Geosci. Model Dev. 2020, 13, 1499–1511. [Google Scholar] [CrossRef]
- Xie, P.; Liu, X.; Liu, Z.; Li, T.; Zhong, L.; Xiang, Y. Human Health Impact of Exposure to Airborne Particulate Matter in Pearl River Delta, China. Water Air Soil Pollut. 2011, 215, 349–363. [Google Scholar] [CrossRef]
- Stafoggia, M.; Bellander, T.; Bucci, S.; Davoli, M.; de Hoogh, K.; Donato, F.D.; Gariazzo, C.; Lyapustin, A.; Michelozzi, P.; Renzi, M.; et al. Estimation of daily PM10 and PM2.5 concentrations in Italy, 2013–2015, using a spatiotemporal land-use random-forest model. Environ. Int. 2019, 124, 170–179. [Google Scholar] [CrossRef]
- Cohen, A.J.; Anderson, H.R.; Ostro, B.; Pandey, K.D.; Krzyzanowski, M.; Künzli, N.; Gutschmidt, K.; Pope, A.; Romieu, I.; Samet, J.M.; et al. The Global Burden of Disease Due to Outdoor Air Pollution. J. Toxicol. Environ. Health Part A 2005, 68, 1301–1307. [Google Scholar] [CrossRef] [PubMed]
- Jethva, H.; Torres, O. A comparative evaluation of Aura-OMI and SKYNET near-UV single-scattering albedo products. Atmos. Meas. Tech. 2019, 12, 6489–6503. [Google Scholar] [CrossRef]
- Grgurić, S.; Križan, J.; Gašparac, G.; Antonić, O.; Špirić, Z.; Mamouri, R.E.; Christodoulou, A.; Nisantzi, A.; Agapiou, A.; Themistocleous, K.; et al. Relationship between MODIS based Aerosol Optical Depth and PM10 over Croatia. Open Geosci. 2014, 6, 2–16. [Google Scholar] [CrossRef]
- Zeydan, Ö.; Wang, Y. Using MODIS derived aerosol optical depth to estimate ground-level PM2.5 concentrations over Turkey. Atmos. Pollut. Res. 2019, 10, 1565–1576. [Google Scholar] [CrossRef]
| Disclaimer/Publisher’s Note: The statements, opinions and data contained in all publications are solely those of the individual author(s) and contributor(s) and not of MDPI and/or the editor(s). MDPI and/or the editor(s) disclaim responsibility for any injury to people or property resulting from any ideas, methods, instructions or products referred to in the content. |
© 2023 by the authors. Licensee MDPI, Basel, Switzerland. This article is an open access article distributed under the terms and conditions of the Creative Commons Attribution (CC BY) license (https://creativecommons.org/licenses/by/4.0/).


