Proceeding Paper

Analysis of the January 2017 Cold Spell in Greece and Its Implications on Human Health †

by
Effie Kostopoulou
Department of Geography, School of Social Sciences, University of the Aegean, 81100 Mytilene, Greece
Presented at the 16th International Conference on Meteorology, Climatology and Atmospheric Physics—COMECAP 2023, Athens, Greece, 25–29 September 2023.
Environ. Sci. Proc. 2023, 26(1), 195; https://doi.org/10.3390/environsciproc2023026195
Published: 15 September 2023

Abstract

:
Human-caused climate change is linked to changes in some types of climate extremes such as high- and low-temperature extremes. Extreme temperature poses risks to several sectors of society and, more importantly, on human health. In Europe, the population affected by high temperatures is expected to increase as opposed to the number of people exposed to cold weather. Nevertheless, cold-related mortality is an important public health problem across Europe, and in southern (warmer) areas, the impact of low temperatures is higher. In this study, we analyzed mortality data from three Greek regions and investigated potential effects of the January 2017 cold spell on mortality attributed to cardiovascular disease.

1. Introduction

Global warming is anticipated to enhance weather extremes that threaten human well-being and health. Phenomena such as heatwaves, cold spells, floods, storms, and wildfires can cause significant societal impacts including a rise in weather-related losses of human lives. Changes in regional climate extremes depend heavily on changes in the natural modes of variability such as the North Atlantic Oscillation, NAO [1], and its regional teleconnections [2,3]. Additionally, atmospheric blocking is an important factor to European temperature variability [4], as it can trigger cold and warm spells, with negative effects for the environment and society. For instance, an anticyclonic system that remained stagnant above Western Europe for a long time during the summer of 2003 raised regional temperatures significantly above the average [5]. According to the World Health Organization, over a recent 20-year period (1998–2017), more than 166,000 deaths were attributed to heatwaves, with 70,000 people dying during the 2003 heatwave in Western Europe. A blocking pattern of high pressure was the main reason for the exceptionally warm conditions over Eastern Europe during the summer of 2010, which brought warm air from the subtropics in western Russia [6]. Excessive heat coupled with industrial pollution and smoke from forest fires increased the mortality rates in Russia in July 2010, with over 14,000 deaths recorded in Moscow. However, climate change can also cause extreme cold weather events. The severe winter of 2009–2010 was associated with frigid temperatures and unusual snow accumulations over several parts of the northern hemisphere. During this event, the North Atlantic Polar Front jet stream shifted equatorward and allowed cold, moist air from the north to reach parts of northwestern Europe and the eastern United States [7,8]. A persistent negative phase of the NAO during this event was associated with blocking patterns that distorted the usual atmospheric circulation and steered Arctic air flow into middle latitudes, causing heavy snowfalls and large societal impacts [9,10]. The freezing conditions of January 2010 in northern Europe led to a number of deaths in the UK and northern European countries. Exposure to extreme cold conditions seems to increase the risk of death particularly from cardiovascular-related causes [11,12,13,14]. Exceptionally cold conditions affected southeastern Europe in January 2017 [15,16]. During this event, snow covered a large part of the Balkan Peninsula. In Greece, snow fell even on the islands, causing school closures, power failures, and disruptions in transportation. This study analyzes daily temperatures to assess the severity of the event over the Greek territory and aims to evaluate potential climate-related health impacts from the extreme cold.

2. Materials and Methods

A subset of the ECMWF/ERA5 meteorological dataset was utilized to visualize the prevailing atmospheric situations in upper atmosphere. Charts of geopotential height at 500 hPa combined with temperature at 850 hPa were produced to identify the prevailing circulation at the steering level, and the temperature field above the boundary layer, which is a good indicator between cold/warm air masses. Daily data of maximum (TX), minimum (TN), and average (TM) temperature in January over the period 2000–2017, for all available Greek stations, were obtained from the Ogimet website [17]. Finally, a dataset of mortality (number of deaths) on daily basis in January for the period of 2013–2018 was provided by the Hellenic Statistical Authority, for three Greek cities (namely, Athens, Thessaloniki, and Alexandroupoli). The criteria considered for this selection were the population and the geographical location of the city. Athens is the capital of the country and the city with the highest population in Greece. The population of the regional unit of Attica is 3,814,064 [2021–Census]. The city of Thessaloniki is the second largest in size and population in Greece. It is the capital of the Thessaloniki regional unit (population: 1,092,919). Alexandroupoli is the capital of the Evros regional unit (population: 133,802) in the Region of Eastern Macedonia and Thrace. In this study, Athens was selected due to data availability, while Thessaloniki and Alexandroupoli are located in the northern part of Greece and are therefore among the areas that mainly experienced the effects of the harsh cold episode. The mortality data used regarded cardiovascular (CVD) diseases and were classified into several age groups (0–4, 5–9, 10–14, 15–19, 20–24, 25–29, 30–34, 35–39, 40–44, 45–49, 50–54, 55–59, 60–64, 65–69, 70–74, 75–79, and 80+ years). This analysis revealed a small number of deaths due to CVD in the younger age groups and thus we further classified the data into the following age classes: 0–39, 40–49, 50–59, 60–69, 70–79, and 80+ years. The temperature anomalies for January 2017 relative to the January average for the period of 2000–2016 were calculated and associations between anomalous temperature and changes in daily mortality were analyzed in the three sub-regions of the country.

3. Results

We analyzed upper atmospheric reanalysis data to identify the prevailing circulation pattern associated with the cold event. Subsequently, we compared the daily January 2017 TX, TN, and their long-term averages to identify the severity of the event in each station. Finally, we examined the short-term association of temperatures with CVD mortality.

3.1. Analysis of Meteorological Data

3.1.1. Upper Atmospheric Conditions

Figure 1 illustrates a series of maps, during the period of 7–12 of January 2017, to analyze the synoptic situations associated with the cold spell. In general, the daily 500 hPa heights (black contour lines) presented trough/ridge couplets over eastern/western parts of Europe. On January 7th, a trough with below-normal heights was formed over eastern and southern Europe, which was associated with a pool of cold air extending from the northeast to the southwest covering a large part of eastern and southeastern Europe. In the following days, the trough formed a cut-off low over southeastern Europe. The upper-level trough over eastern and southeastern Europe was related to below-normal surface temperatures and above-normal snowfalls over the region. Moreover, the areas impacted by the upper-level trough were those with negative temperatures (blue colors) at the 850 hPa level. It is noteworthy to mention that the phenomenon reached its maxima during 8–10 of January when the cut-off low was well organized over the Balkan Peninsula. During this period, very cold air masses subsided toward the Balkan area [15]. Frigid and bitterly cold conditions dominated at the 850 hPa level (even below −20 °C), which enhanced snowfall activity over the region. Subsequently, the cold air mass that moved over the warmer Aegean Sea formed a lake-effect snow that affected the Greek islands.

3.1.2. Surface Air Temperature Analysis

Extremely cold and snowy conditions were reported in southeastern Europe and particularly the Balkans, which caused road accidents, school closures, cancellation of flights, and other disruptions in transportation, e.g., shipping suspension on the Danube river and the Bosporus sea strait [18]. Figure 2 presents the daily maximum and minimum temperature during January 2017 at stations located in Romania (Ro), Croatia (HR), Montenegro (ME), Serbia (RS), North Macedonia (MK), Bulgaria (BG), Greece (GR), and Turkey (TR). The distinct cold episode stands out on the contour graph, as all stations presented, during the period 6–13 January, their lowest TX and TN records. Icy days (TX < 0 °C) were observed in the countries listed above, with TX dropping below −10 °C in Romania, Serbia, and Bulgaria. A TX as low as −12 °C was recorded in Sofia (BG) and Kogalniceanu (RO) on January 7th and 9th, respectively. The occurrence of frost days (TN < 0 °C) was common across the region. In most cases, TN was below −5 °C, during the cold spell, while in many Balkan countries (except Greece), TN remained below −15 °C over five consecutive days. A TN as low as −20 °C was recorded in Romania (Craiova and Tuzla), Croatia (Osijek), Serbia (Nis), and Bulgaria (Sofia).
Regarding our study area, the 2017 January average temperatures in the three Greek cities are presented in Table 1, and their respective long-term means over 2000–2016 are given in parentheses. For example, the average monthly maximum temperature in Thessaloniki in January 2017 was 5.5 °C, which was 4.5-degrees colder than the long-term normal. All regions experienced colder-than-usual conditions, with mean monthly temperature departures from normal of approximately 2 °C in Athens, and up to 4 °C in Thessaloniki and Alexandroupoli.
The daily variations in TX and TN (red and blue lines, respectively) observed at the three stations during January 2017 are shown in the left panel of Figure 3. All series showed a sudden drop in temperature around January 6th, which remained low for several days. It is noteworthy that TN in Athens fell by approx. 9-degrees, whereas a decrease of roughly 7 degrees in TX occurred, within a 24 h period, in the northern stations of Thessaloniki and Alexandroupoli. Very low temperatures were recorded during the cold snap of 7–12 January in Thessaloniki and Alexandroupoli. TN remained below −5 °C for almost a week and recorded a low of −10 °C, and TX dropped below −3 °C in the colder days (8–10 January). Temperatures started to rise from January 13th onward. Cold conditions prevailed over a large part of Greece. The coldest temperatures recorded in the country were −22.7 °C in Florina, −17.5 °C in Kastoria, −14.8 °C in Larissa, and −12.4 °C in Kozani.
The accompanying bar chart in the right panel of Figure 3 presents the anomalies of TX and TN. The anomalies indicate the departures of daily temperatures of January 2017 relative to their 2000–2016 averages. Negative (positive) anomalies are shown in blue (red) color to highlight that the daily temperature records are cooler (warmer) than the reference values. Overall, January 2017 was colder than average in Greece. Most of the days presented negative anomalies. In Athens, a few days with small positive anomalies were seen. During the cold event (8–10 January), TN and TX deviated approximately 7 to 10 °C below normal. Negative-temperature anomalies lasted longer in the north (7–12 January), ranging between 6–14 and 4–12.5 degrees below normal in Thessaloniki and Alexandroupoli, respectively. Section 3.2 attempts to identify the potential consequences of the extreme temperatures on human health in the three Greek areas.

3.2. Analysis of Mortality Data

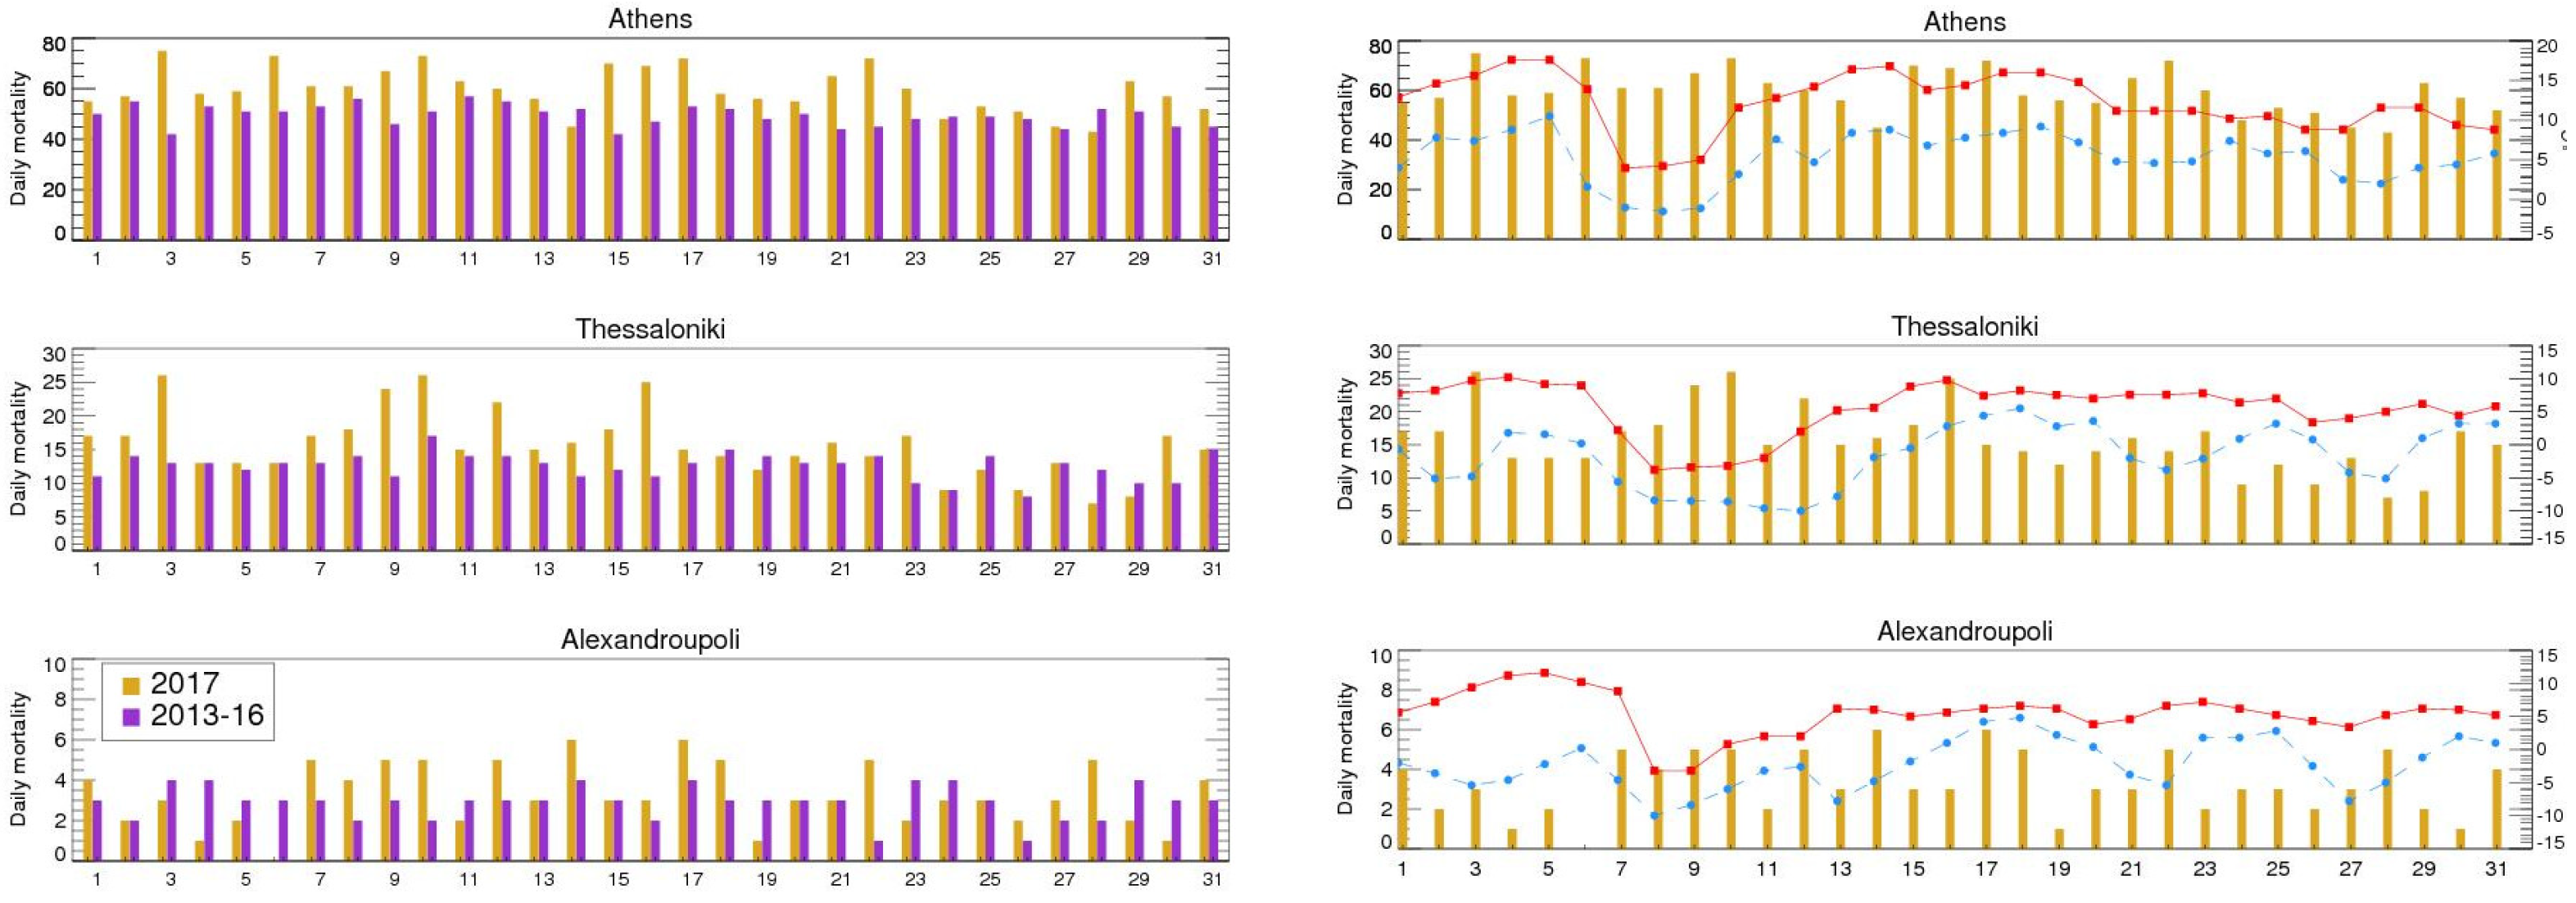
Mortality data associated with cardiovascular diseases were obtained for each day in January for the years of 2013–2018. The period of 2013–2016 was used as a reference to examine whether the cold event of January 2017 affected the daily mortality in three selected cities of Greece. The regions examined in this study were found to have increased mortality during January 2017. The left panel of Figure 4 presents the daily January 2017 CVD mortality (yellow bars) in comparison to the related 4-year average (2013–2016, purple bars). In the right panel of Figure 4, the association of CVD mortality with daily maximum and minimum temperature is presented. The decrease in temperatures, which is marked on January 6th, seemed to define an increase in the number of deaths. In the case of Thessaloniki, it became evident that over the duration of the cold spell, CVD deaths tended to increase. Similar results were seen in Alexandroupoli although the limited number of data points did not allow a safe conclusion to be drawn. Regarding Athens, the number of deaths was large during the cold spell but did not differentiate much from the results of the rest of the month. This may be due to a lower impact of the extreme event in this area.
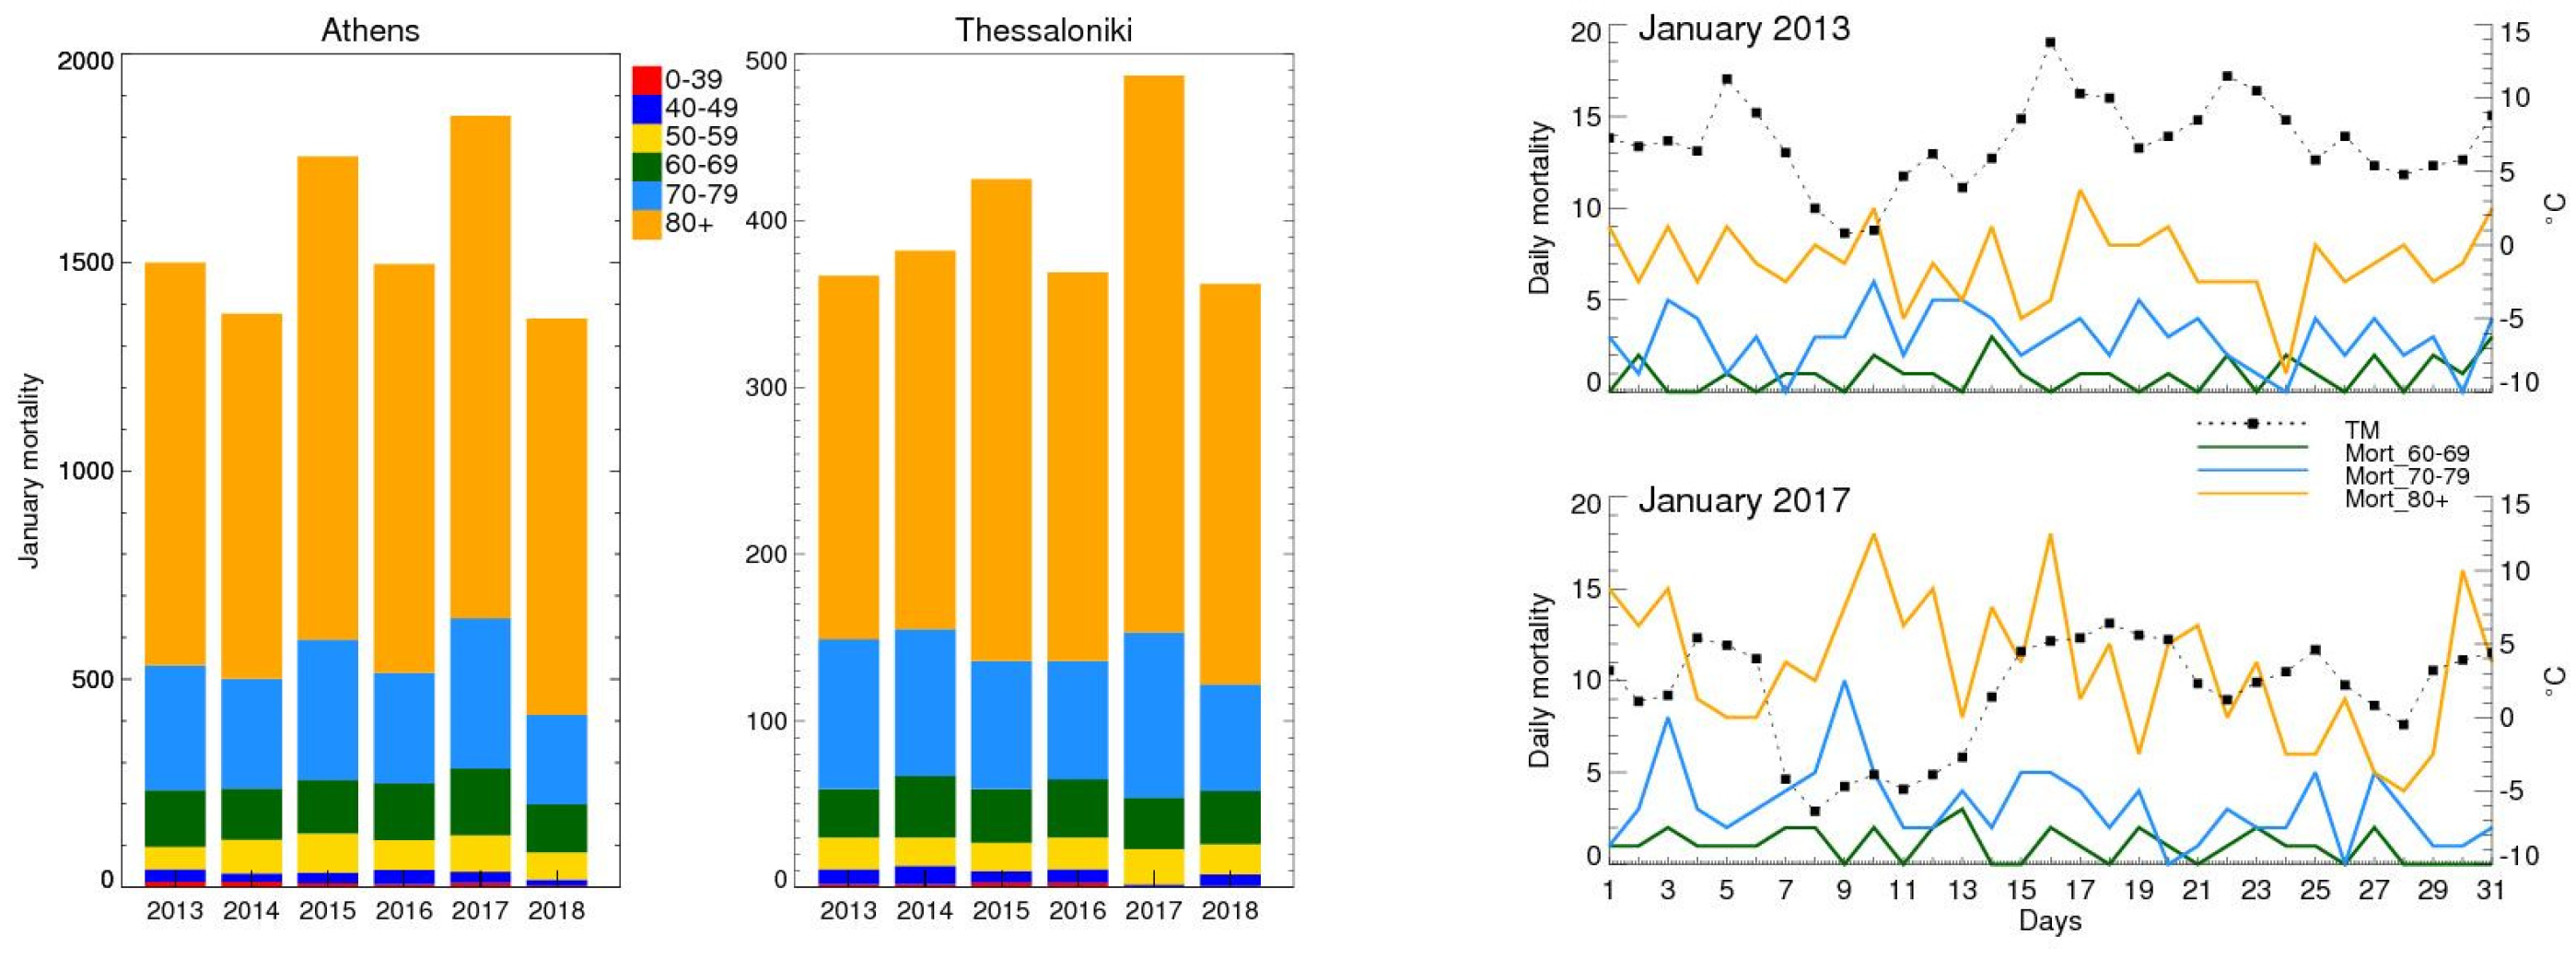
Lastly, an attempt was made to investigate the relationship between temperature and age-specific CVD mortality. CVD was found to be a rare cause of death at ages under 39 years; thus, we classified the data into six groups: 0–39, 40–49, 50–59, 60–69, 70–79, and 80+ years. The left panel of Figure 5 shows the total all-age CVD mortality for every January during 2013–2018 in Athens and Thessaloniki. The results are portrayed in a stacked-bar chart of the distribution of each age group mortality within the month. It was found that January 2017 CVD mortality was larger compared to the other years in both areas and especially in Thessaloniki. We also saw that fatalities were mainly related to older ages and specifically the top three age groups, of over 60 years of age. The older age group (80+) had the higher proportion of deaths in all years. Hence, we tried to identify impacts of the low temperature of January 2017 in age-specific mortality from the older groups.
In the right panel of Figure 5, we present the daily mortality of the three older classes (60–69, 70–79, 80+) along with the mean daily temperature (TM) in Thessaloniki. Apart from January 2017, we chose to present another year for comparison, namely, January 2013. This year was chosen because the January temperatures range close to their long-term averages. Based on the long period of data (1959–2010) of the Hellenic National Meteorological Service, the average TN, TM, and TX for January in Thessaloniki were equal to 1.5, 6.0, and 10.0 °C, respectively. Accordingly, these variables were equal to 1.0, 7.0, and 13.0 °C in January 2013 and −6.5, 1.5, and 6.5 °C in January 2017, respectively. We found that the mortality of the elderly was mostly affected by the low temperatures in January 2017. The overall relationship exhibited is that the mortality of groups 70–79 and 80+ increases as the temperature reduces.

4. Conclusions

An extremely cold weather event occurred during January 2017 in southeastern Europe. Temperatures well below their long-term averages persisted for days. This study analyzed climate data to investigate the severity of the event and attempted to identify how low temperatures might affect mortality in three Greek regions. During the cold episode, the number of deaths due to CVD tended to increase. A severe effect of the cold mass outbreak was especially felt in Thessaloniki, which saw a clear increase in mortality. The number of CVD deaths during January 2017 was highest compared to any other January in the period of 2013–2018. The older population was particularly impacted, as the number of deaths of people aged 80+ increased by 27% compared to the average (2013–2018). Among the age groups analyzed, the elderly (>80 years of age) were found to be the most vulnerable group affected by the climatic stress of extreme ambient temperatures.

Funding

This research received no external funding.

Institutional Review Board Statement

Not applicable.

Informed Consent Statement

Not applicable.

Data Availability Statement

CVD data are unavailable due to privacy restrictions.

Conflicts of Interest

The authors declare no conflict of interest.

References

  1. Ring, M.J.; Plumb, R.A. Forced annular mode patterns in a simple atmospheric general circulation model. J. Atmos. Sci. 2007, 64, 3611–3626. [Google Scholar] [CrossRef]
  2. Coppola, E.; Kucharski, F.; Giorgi, F.; Molteni, F. Bimodality of the North Atlantic Oscillation in simulations with greenhouse gas forcing. Geophys. Res. Lett. 2005, 32, 23709. [Google Scholar] [CrossRef]
  3. Scaife, A.A.; Folland, C.K.; Alexander, L.V.; Moberg, A.; Knight, J.R. European climate extremes and the North Atlantic Oscillation. J. Clim. 2008, 21, 72–83. [Google Scholar] [CrossRef]
  4. Brunner, L.; Hegerl, G.C.; Steiner, A.K. Connecting atmospheric blocking to European temperature extremes in spring. J. Clim. 2017, 30, 585–594. [Google Scholar] [CrossRef]
  5. García-Herrera, R.; Díaz, J.; Trigo, R.M.; Luterbacher, J.; Fischer, E.M. A Review of the European Summer Heat Wave of 2003. Crit. Rev. Environ. Sci. Technol. 2010, 40, 267–306. [Google Scholar] [CrossRef]
  6. Katsafados, P.; Papadopoulos, A.; Varlas, G.; Papadopoulou, E.; Mavromatidis, E. Seasonal predictability of the 2010 Russian heat wave. Nat. Hazards Earth Syst. Sci. 2014, 14, 1531–1542. [Google Scholar] [CrossRef]
  7. Cattiaux, J.; Vautard, R.; Cassou, C.; Yiou, P.; Masson-Delmotte, V.; Codron, F. Winter 2010 in Europe: A cold extreme in a warmingclimate. Geophys. Res. Lett. 2010, 37, 20704. [Google Scholar]
  8. Cohen, J.; Foster, J.; Barlow, M.; Saito, K.; Jones, J. Winter 2009–2010: A case study of an extreme Arctic Oscillation event. Geophys. Res. Lett. 2010, 37, 17707. [Google Scholar] [CrossRef]
  9. Hartley, S.; Keables, M.J. Synoptic Associations of Winter Climate and Snowfall Variability in New England, USA, 1950–1992. Int. J. Climatol. 1998, 18, 281–298. [Google Scholar] [CrossRef]
  10. Hall, R.; Erdélyi, R.; Hanna, E.; Jones, J.; Scaife, A. Drivers of North Atlantic Polar Front jet stream variability. Int. J. Climatol. 2014, 35, 1697–1720. [Google Scholar] [CrossRef]
  11. Kysely, J.; Pokorna, L.; Kyncl, J.; Kriz, B. Excess cardiovascular mortality associated with cold spells in the Czech Republic. BMC Public Health 2009, 9, 19. [Google Scholar] [CrossRef]
  12. Rocklöv, J.; Forsberg, B.; Ebi, K.; Bellander, T. Susceptibility to mortality related to temperature and heat and cold wave duration in the population of Stockholm County, Sweden. Glob. Health Action 2014, 7, 22737. [Google Scholar] [CrossRef]
  13. Xie, H.; Yao, Z.; Zhang, Y.; Xu, Y.; Xu, X.; Liu, T.; Lin, H.; Lao, X.; Rutherford, S.; Chu, C.; et al. Short-term effects of the 2008 cold spell on mortality in three subtropical cities in Guangdong Province, China. Environ. Health Perspect. 2013, 121, 210–216. [Google Scholar] [CrossRef]
  14. Moghadamnia, M.T.; Ardalan, A.; Mesdaghinia, A.; Keshtkar, A.; Naddafi, K.; Yekaninejad, M.S. Ambient temperature and cardiovascular mortality: A systematic review and meta-analysis. PeerJ 2017, 5, 3574. [Google Scholar] [CrossRef] [PubMed]
  15. Anagnostopoulou, C.; Tolika, K.; Lazoglou, G.; Maheras, P. The Exceptionally Cold January of 2017 over the Balkan Peninsula: A Climatological and Synoptic Analysis. Atmosphere 2017, 8, 252. [Google Scholar] [CrossRef]
  16. Tringa, Ε.; Tolika, K.; Anagnostopoulou, C.; Kostopoulou, Ε. A Climatological and Synoptic Analysis of Winter Cold Spells over the Balkan Peninsula. Atmosphere 2022, 13, 1851. [Google Scholar] [CrossRef]
  17. Ogimet. Available online: http://www.ogimet.com (accessed on 1 April 2023).
  18. WMO. Available online: https://public.wmo.int/en/media/news/siberian-cold-hits-southeastern-europe (accessed on 1 April 2023).
Figure 1. Daily sequence of 500 hPa geopotential heights (black contour line, unit: decameters) and 850 hPa temperature (shaded, unit: °C) for the period 7–12 January 2017.
Environsciproc 26 00195 g001
Figure 2. Maximum (TX, left panel) and minimum (TN, right panel) temperature for each day of January 2017, as recorded at several stations in southeastern Europe.
Environsciproc 26 00195 g002
Figure 3. Daily variation in TX (red) and TN (blue) for January 2017 at the three stations (left panel) and their anomalies as compared to the corresponding daily long-term averages (right panel).
Environsciproc 26 00195 g003
Figure 4. Daily CVD mortality at the three stations (left panel) for January 2017 (yellow) and mean daily mortality in January over 2013–2016 (purple). Daily mortality for January 2017 (yellow) and maximum (red line) and minimum (blue line) temperature variations (right panel).
Environsciproc 26 00195 g004
Figure 5. Distribution of January mortality, by age classes, from 2013 to 2018 in Athens and Thessaloniki (left panel). Variation in daily mortality by age classes, in January 2013 and January 2017 in Thessaloniki (right panel) in association with mean daily temperature (TM).
Environsciproc 26 00195 g005
Table 1. Average January 2017 temperatures for each station. Values in parentheses are the respective long-term means over the 2000–2016 period.
AthensThessalonikiAlexandroupoli
TX12.1 (14.1)5.5 (10.0)5.4 (9.7)
TN5.2 (7.0)−1.5 (2.5)−2.3 (2.0)
TM8.0 (10.1)1.6 (5.9)2.0 (5.4)
Note: TX = Maximum temperature, TN = Minimum temperature, TM = Mean temperature.
Disclaimer/Publisher’s Note: The statements, opinions and data contained in all publications are solely those of the individual author(s) and contributor(s) and not of MDPI and/or the editor(s). MDPI and/or the editor(s) disclaim responsibility for any injury to people or property resulting from any ideas, methods, instructions or products referred to in the content.