Abstract
Forecasting volcanic ash transport is crucial for aviation, but its accuracy is subject to both the prevailing wind fields and the knowledge of the source term of the eruption, i.e., variation of emission rate and column height with time. In this study, we use data from the high spectral resolution lidar (HSRL) in space, Aeolus, to examine their impact on the estimation of the emission rates of volcanic particles through inversion techniques. For the inverse modelling, we couple the output of the FLEXPART Lagrangian particle dispersion model with lidar observations towards estimating the emission rates of volcanic particles released from an Etna eruption. The case study used here is the Etna eruption on the 12 March 2021, well captured by the ground-based lidar station of the PANGEA observatory located at the remote island of Antikythera in Greece, downwind of the Etna volcano. It is concluded that the inversion algorithm with Aeolus wind fields assimilation optimizes both the vertical emission distribution and the Etna emission rates.
1. Introduction
Modeling the transport of volcanic ash particles released during volcanic eruptions is crucially dependent on the knowledge of the source term of the eruption [1,2,3], that is, the source strength as a function of altitude and time. Stohl’s [1] methodology was applied to the explosive volcanic eruptions of Eyjafjallajokull and Grímsvötn, Iceland, for the period from 14th of April to 24th of May 2010 and May 2011, accordingly, and was constrained by the satellite observations of SO2 and ash total columns [4].
In this work, we constrain volcanic ash emissions using ground-based aerosol lidar measurements, based on the theoretical work of [1]. This methodology estimates source–receptor relationships (SRR) from the FLEXPART (flexible particle dispersion) model [5,6,7] constrained by ground-based lidar measurements of ash concentration.
Moreover, we examine the impact of data assimilation of wind Aeolus profiles in the European Centre for Medium Range Weather Forecasts (ECMWF) meteorological model in comparison to the estimation of the emission rates of volcanic particles [8]. In particular, how the mass rates, the vertical emission distribution, and the resulting forecasts are affected when initiated by the control and assimilated wind fields, respectively.
Specifically, for the inversion scheme, we estimate the particle emission rates using the SRR calculated (as the input) from the FLEXPART model constrained by the ground-based lidar measurements of ash aerosol concentration downwind (for the source). We demonstrate this procedure in the case of the Etna eruption on the 12 March 2021. The dispersing plume was observed by the PollyXT lidar station of the PANhellenic Geophysical Observatory of Antikythera (PANGEA) of National Observatory of Athens (NOA), located in the Eastern Mediterranean, enabling comparisons between the observations and forecasts (with and without Aeolus assimilation, referring as “w” and “w/o” Aeolus, hereafter) on the 12th of March (18:30–21:30 UTC). These lidar observations of the volcanic plume were used to estimate ash particle mass concentration profiles and constrain the emission source strength, depending on altitude and time. Our results are efficient for real-time application and could supply ash forecasting models with an accurate estimation of the mass rate and the vertical emission distribution of fine ash particles emitted during explosive volcanic eruptions. Improved forecasts would then allow for more effective emergency preparedness for aviation to ensure safety during volcanic eruptions [8].
2. Etna Volcanic Eruption on 12 March–14 March 2021
The Mt. Etna volcano in Sicily (37.74° N, 15.00° E, 3300 m a.s.l.), is one of the most active volcanoes on Earth. This active stratovolcano has been erupting periodically since February 2021, releasing tephra and sulfate particles into the atmosphere from its summit craters.
On the 12 March 2021, strombolian activity at the east and south–east flank of the South East Crater (SEC) has been reported from the Istituto Nazionale di Geofisica e Vulcanologia, Osservatorio Etneo (INGV-OE). Lava flow and explosive activity were observed from the volcano’s video surveillance system since about 06:30 UTC. Intense ash emission was increased until it reached a peak phase at 09:00 UTC (Figure 1a) and decreased in intensity after about 10:00 UTC (Figure 1b). The lava fountain ceased after 12:30 UTC on the 12 March 2021. During the peak phase of the eruption, the ash column reached approximately 10 km altitude (Figure 1a) and drifted eastwards due to the westerly winds that were dominant over the Eastern Mediterranean (Figure 1b) [3,8,9]. According to the Volcano Observatory Notice for Aviation (VONA) messages, the volcano observatory issued a RED warning alert, from 06:18 to 08:44 UTC, on the 12 March 2021, when the strongest ash emission was observed, while an ORANGE alert was issued at 12:30 UTC when the lava fountain ceased and the volcanic ash plume was dispersed in the atmosphere.
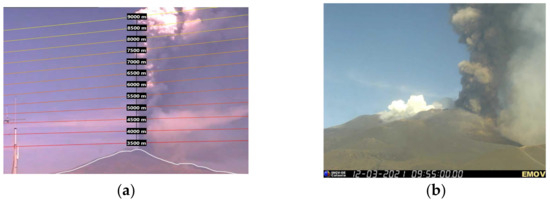
Figure 1.
Etna activity on the 12 March 2021 as seen from INGV-OE video surveillance systems. (a) Explosive activity during the paroxysmal phase, ranging between 4 and 10 km a.s.l., as estimated by the visible camera of INGV-EO. (b) The EMOV camera shows the decrease in the explosive activity after about 10:00 UTC.
3. Methods
The inverse method followed herein to determine volcanic ash emissions merge a priori information on the ash emissions, ground-based lidar observations, and simulations with a dispersion model to derive improved a posteriori ash emission. In this section, we describe the various data sets and methods used for inverse modeling.
3.1. FLEXPART-WRF Model Setup
The advanced research WRF model version 4 [10] is used to perform meteorological simulations over the study region of the Eastern Mediterranean. The WRF-ARW spatial set-up was at 12 × 12 km resolution domain with 351 × 252 grid points, and 31 vertical levels (up to 50 hPa). Simulations were initiated on the 12 March 2021, 00:00 UTC, and completed on the 14th of March 2021, 18:00 UTC. The initial and boundary conditions for the offline coupled FLEXPART-WRF runs are taken from the European Centre for Medium Range Weather Forecasts (ECMWF) Integrated Forecast System (IFS) at 0.125° × 0.125° spatial resolution, and 137 vertical model levels. Two different sets of the IFS data [11] were used. The first one is the “w” Aeolus experiment, in which Aeolus Rayleigh clear and Mie cloudy horizontal line of sight HLOS L2B wind profiles have been assimilated [12], and the second one is the “w/o” Aeolus assimilated wind fields (control run). WRF-ARW outputs, were produced by the two different IFS data sets (“w” and “w/o” Aeolus), with hourly outputs. Sea surface temperature (SST) analysis data were provided by the Copernicus Marine Environment Monitoring Service (CMEMS) at a resolution of 1/12°. To assess the potential improvements caused to the assimilation of Aeolus wind profiles, the WRF-ARW outputs were compared.
The source–receptor sensitivities were simulated using the Lagrangian particle dispersion model FLEXPART [5,6,7] in a forward mode for four size bins (3, 5, 9, and 21 µm diameter), as they cover the size distribution relevant for long-range transport (≤25 µm diameter). The FLEXPART ash simulations were initiated with the wind forecasts produced by the regional model (WRF). It was assumed that the emissions occurred between the ground and 16 km above ground level (a.g.l.), above the Etna volcano. The total height range was divided into 79 layers, each one being 200 m thick. For every layer, a simulation was performed with unit mass of tracer, carried by 150,000 particles and released uniformly within the layer along a vertical line source every two hours (from 04:00 to 06:00 UTC and from 12:00 to 14:00 UTC). Moreover, the model layers were divided into 9 layers of 2 km vertical resolution between 4 km and above 22 km a.g.l., a single layer between the surface and 4 km a.g.l., and another layer from 22 to 50 km a.g.l.
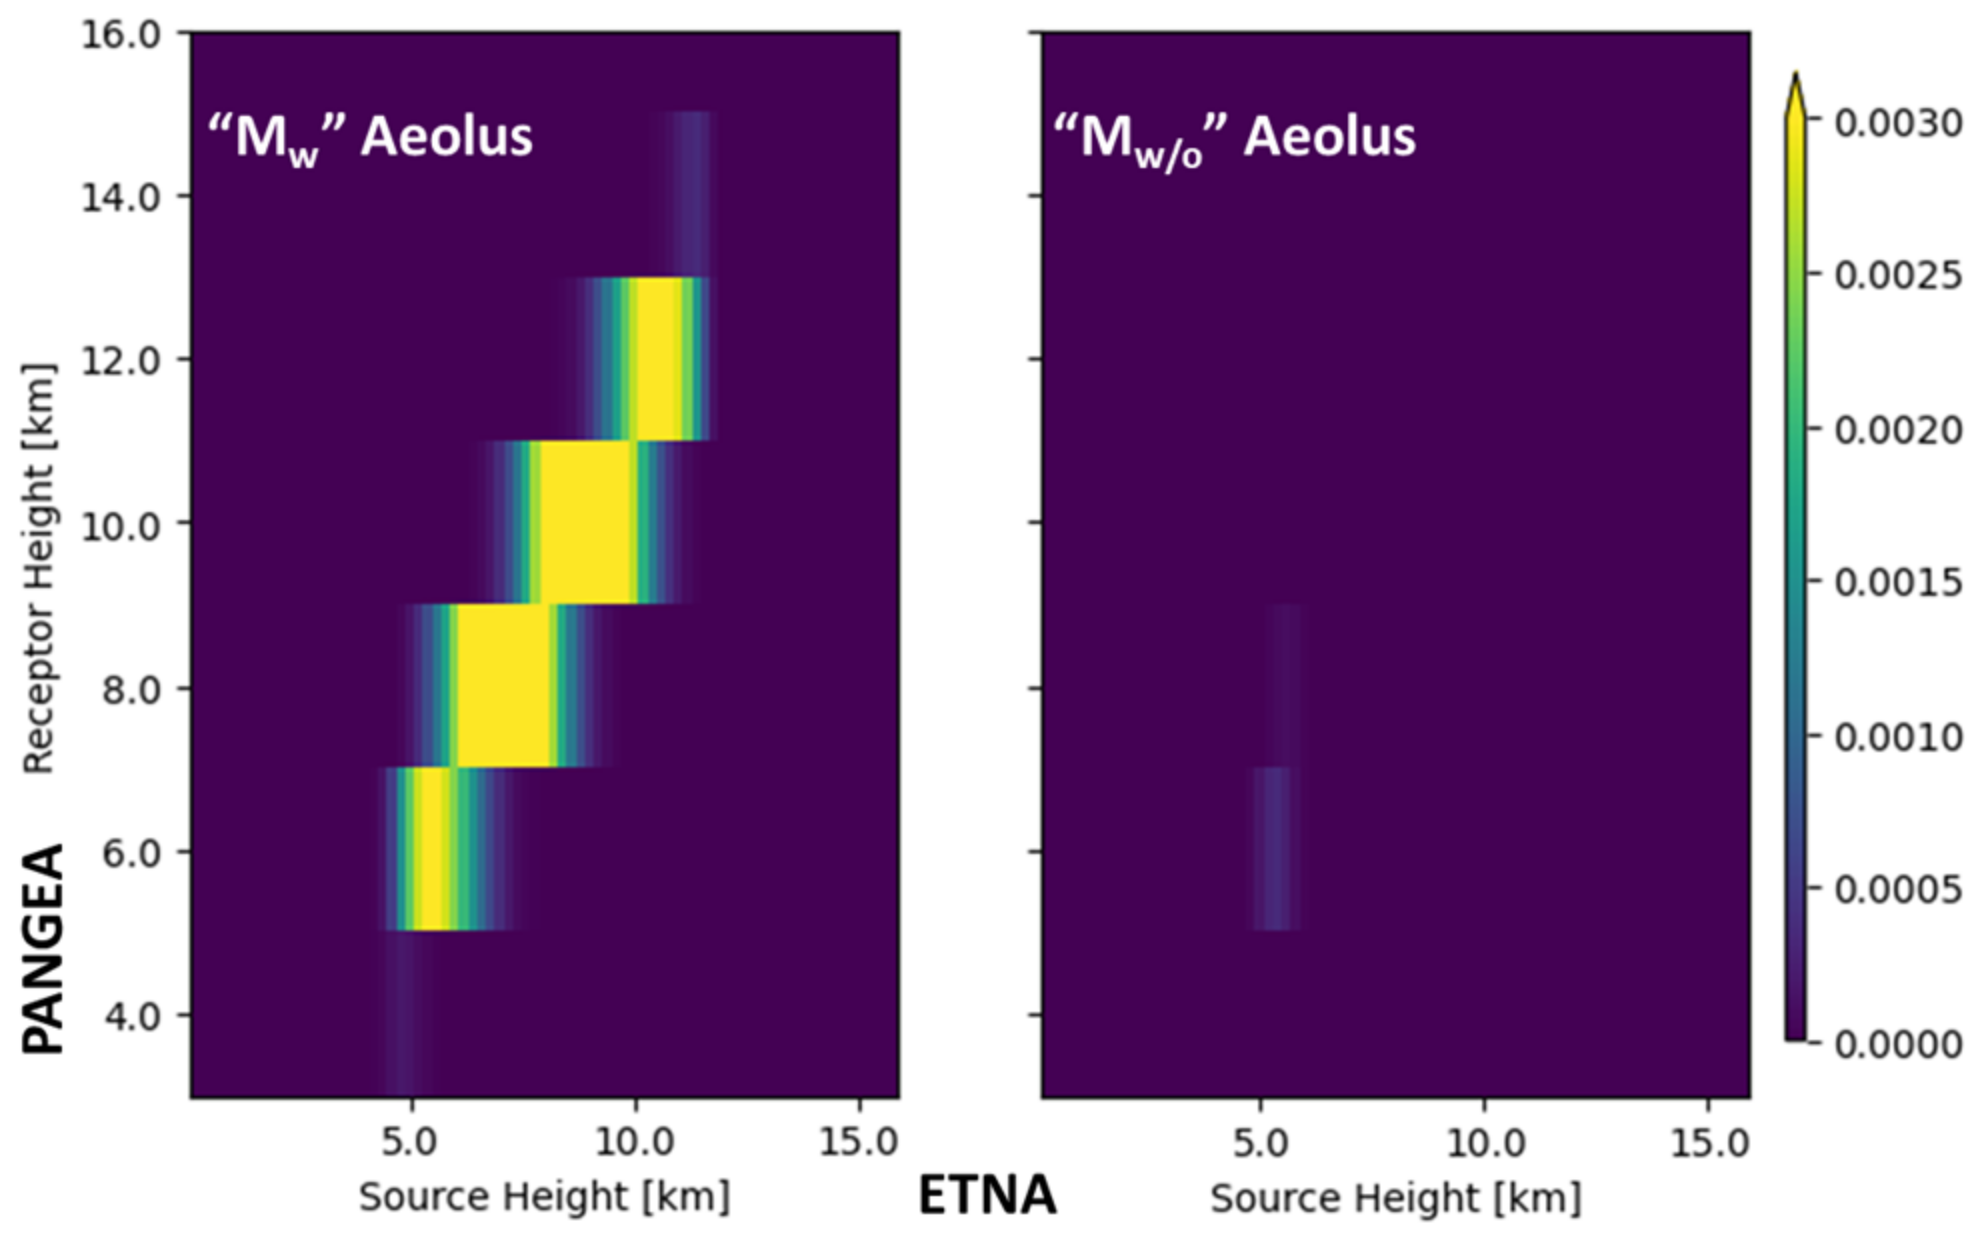
The source–receptor sensitivities “w” Aeolus assimilated wind fields, as derived from the FLEXPART model, show that the volcanic emissions observed above the PANGEA observatory on the 12 March 2021 (from 18:30 to 21:30 UTC) at heights of 7–12.5 km mostly originate from release heights between 6 and 12 km above the Etna volcano (Figure 2, left). However, the SRR “w/o” Aeolus assimilated wind fields show that the emitted volcanic particles, which arrived above PANGEA station at the heights of 5–6 km, are few and originate from release heights at about 5 km above Etna (Figure 2, right).
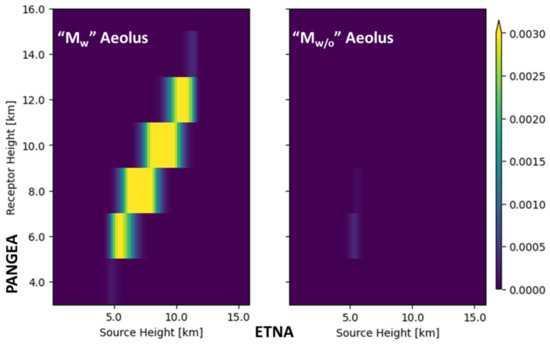
Figure 2.
Source-receptor sensitivities “w” Aeolus assimilated winds (left panel) and “w/o” Aeolus simulation (right panel). The horizontal axis “x” depicts the particles’ release height (km) above Etna and the vertical axis “y” is the altitude above PANGEA that the emissions observed on the 12 March 2021 (from 18:30 to 21:30 UTC).
3.2. PollyXT Lidar Ground-Based Observations
Aerosol profiles derived from the PollyXT lidar system [13,14], operating at the PANGEA observatory, were used to evaluate the different plume dispersion simulations. Figure 3b shows the time–height evolution of the PollyXT lidar observations in terms of the attenuated backscatter coefficient at 532 nm above the PANGEA station, depicting a dense aerosol layer in the altitudes between 7 and 12 km, from 18:30 to 21:30 UTC, on the 12 March 2021. Whereas the FLEXPART vertical cross-sections of volcanic ash concentrations (Figure 3a) show a similar pattern for the observed aerosol layer over the PANGEA station, only when Aeolus assimilated wind fields are used. Ash plume is modelled between a 7 and 11 km height. On the contrary, the simulations performed without Aeolus assimilation fail to depict the observed structures above PANGEA station for the same period (not shown in Figure 3a).
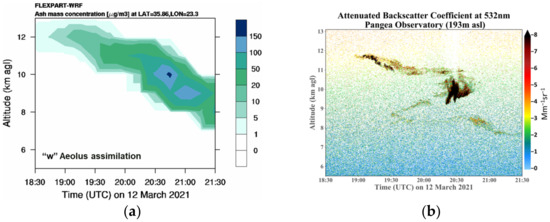
Figure 3.
Vertical time–height cross-sections of volcanic ash distribution. (a) FLEXPART ash concentrations “w” assimilation of Aeolus wind profiles (“w/o” simulation is not shown). (b) The time–height evolution of an attenuated backscatter coefficient at 532nm from the PollyXT lidar observations above PANGEA observatory station on the 12 March 2021 (from 18:30 UTC to 21:30 UTC). Station elevation: 193 m a.s.l.
These lidar observations (from 18:30 to 21:30 UTC) of the volcanic plume were used in the inversion scheme to estimate ash particle mass concentration profiles and constrain the emission source strength, depending on altitude and time.
Figure 4 depicts the lidar profile of the retrieved aerosol properties. The “POlarization-LIdar PHOtometer Networking” method POLIPHON [15,16] is used here to disentangle the contribution of large, depolarizing ash particles to the lidar derived total particle backscatter coefficient. Then, the volcanic ash mass concentration profiles are estimated (Figure 4) following the technique presented in [3].
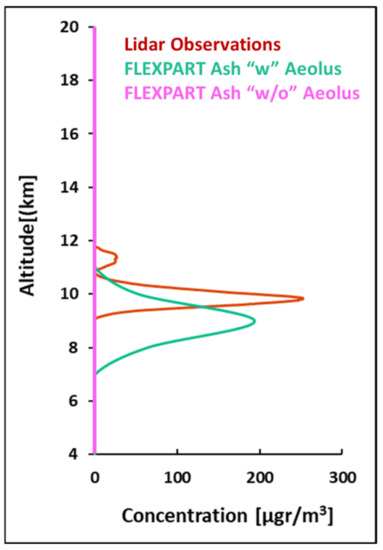
Figure 4.
Volcanic ash observation and concentration profiles above PANGEA observatory on the 12 March 2021, from 18:30 to 21:30 UTC; volcanic ash mass concentrations using the POLIPHON lidar method (red line); from FLEXPART model simulations “w” Aeolus assimilated winds are (green line) and “w/o” Aeolus simulation (magenta line, equals to zero).
The lidar derived volcanic ash concentrations over PANGEA reached up to 250 μg/m3 at the plume’s center of mass (red line in Figure 4). The FLEXPART simulated ash mass concentration values are about 220 μg/m3 (green line in Figure 4) and are in good spatio–temporal agreement with the lidar-derived product, despite a slight vertical shift of 1 km observed between the modeled and observed profiles, which can be critical for aviation safety.
3.3. Inversion Method
The estimation of the ash emission profile is based on the analytic inversion method of Stohl’s work [1]. The particle emission rates were calculated using the SRR (as an input) from the FLEXPART model constrained by the ground-based lidar measurements of ash aerosol concentration downwind (for the source). The n = 79 unknowns (source elements) are presented by the state vector x, while the m observed values are put into the measurements vector yo, where the superscript o stands for PollyXT lidar observations. Modeled values y corresponding to the observations can be calculated as:
where M is the (m × n) matrix of source–receptor relationships calculated with FLEXPART. The regularized least squares method was applied in the inversion algorithm and regularization, and constrains the squared length of the solution vector x.
Y = Mx,
Moreover, an additional constraint that controls the smoothness of the derived solution was imposed in order for negative emission values to be removed and finally to yield useful solutions for the inversions of atmospheric trace substances.
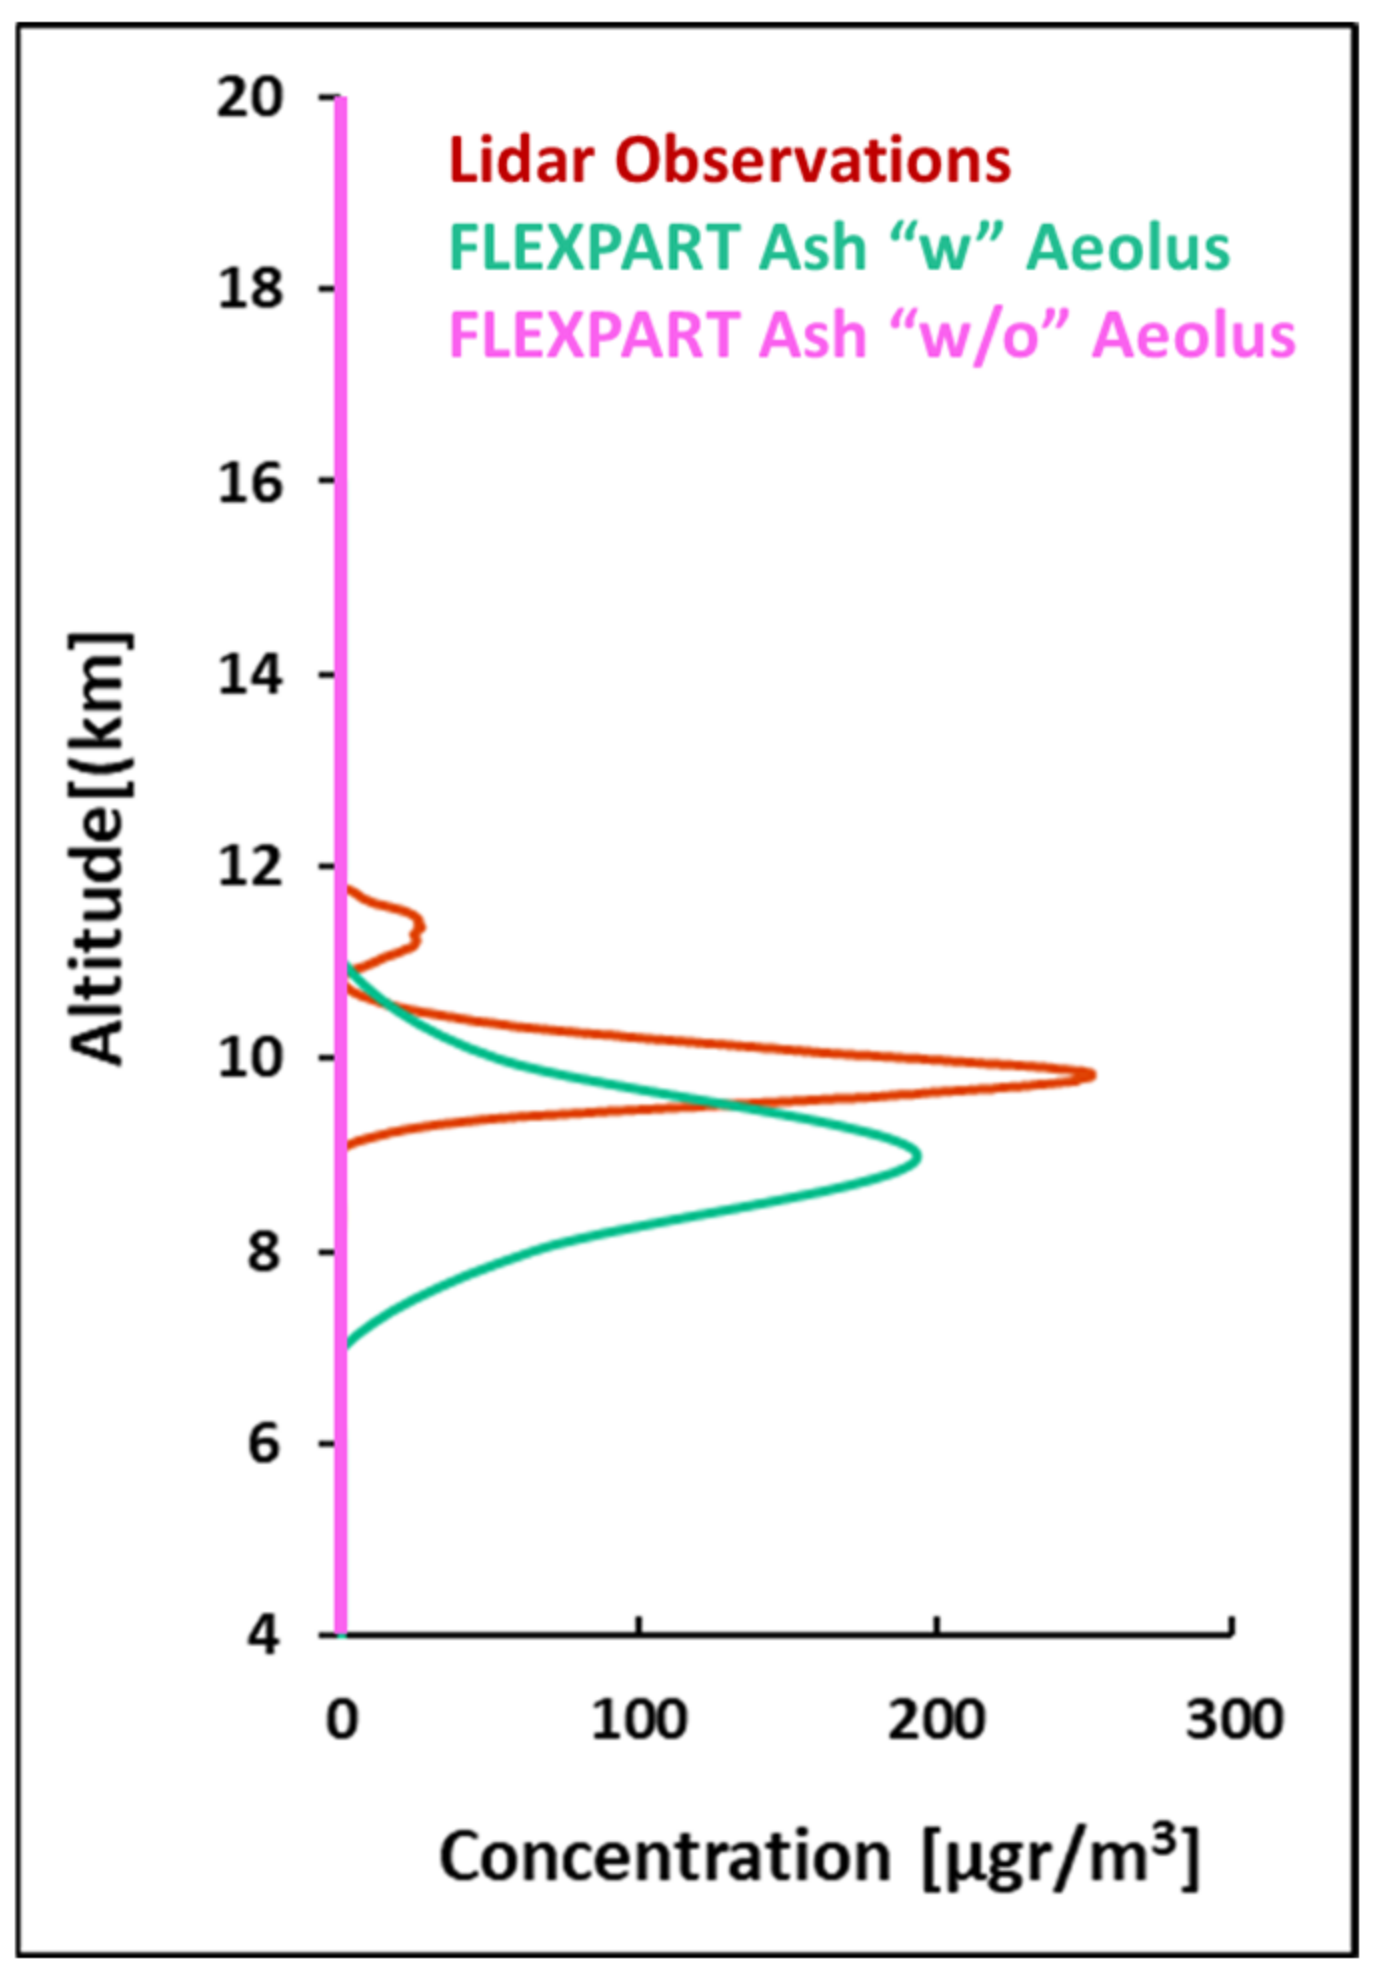
The particle emission rates “w” Aeolus assimilated winds estimated from the inversion scheme were used as an input to a new FLEXPART forward run to simulate the transport of the plume. Figure 5 depicts the vertical profile of volcanic ash concentration above PANGEA station on the 12 March 2021, from 18:30 to 21:30 UTC, obtained from this new emission profile (only when Aeolus profiles are considered). After the inversion run, the observed and the simulated mass concentration peaks are well matched, and the vertical shift of 1 km shown in Figure 4 vanishes due to the Aeolus wind fields.
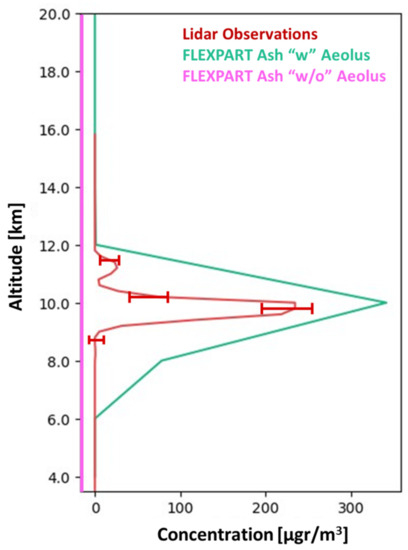
Figure 5.
Vertical profile of volcanic ash concentration above PANGEA station on the 12 March 2021, from 18:30 to 21:30 UTC, after Inversion. Volcanic ash mass concentrations using the POLIPHON lidar method (red line); FLEXPART model simulations “w” Aeolus assimilated winds (green line) and FLEXPART model simulations “w/o” Aeolus assimilated winds (magenta line, equals to zero).
4. Results
Assimilation of Aeolus wind profiles provides an obvious improvement in the estimation of the volcanic emission rates through inversion techniques, as evidenced in the present case study. Moreover, the Aeolus wind profiles optimize the vertical agreement between the lidar observations and model simulation. However, the ash concentrations observed in the PollyXT lidar are not so well reproduced with the model. These improvements are of utmost importance for the aviation sector, since they can allow for a more effective emergency response in aviation, to ensure safe and optimized flight operations during volcanic eruptions, as well as minimizing at the same time the respective risk of accident and costs from flight cancelations. Further improvements of our inversion method could include the minimization of the difference in the ash mass concentration between the observations and the simulations; the consideration of the time dimension in the algorithm; and the use of additional observations from other lidar stations (i.e., from Limassol observatory) for evaluating the results.
Author Contributions
Conceptualization, A.K., V.A., S.S. (Stavros Solomos) and T.G.; Data curation, A.K., T.G., A.G. (Anna Gialitaki), E.M., A.G. (Antonis Gkikas), E.P., S.S. (Simona Scollo), M.R. and A.B.; Investigation, A.K.; Methodology, A.K., V.A., T.G., S.S. (Stavros Solomos), I.B., E.P., A.G. (Anna Gialitaki), E.M. and P.Z.; Software, A.K., T.G., E.M. and A.G. (Anna Gialitaki); Supervision, V.A., S.S. (Stavros Solomos), I.B. and P.Z.; Visualization, A.K., T.G. and E.M.; Writing—original draft, A.K., V.A., T.G., S.S. (Stavros Solomos) and P.Z.; Writing—review & editing, V.A., S.S. (Stavros Solomos), E.M., T.G., A.G. (Antonis Gkikas), I.B., A.G. (Anna Gialitaki), E.P., L.M., S.S. (Simona Scollo), N.P., M.R., A.B. and P.Z. All authors have read and agreed to the published version of the manuscript.
Funding
This research was funded by EU H2020 E-shape project (Grant Agreement No. 820852), by ERC D-TECT (grant agreement No. 725698); and by the European Space Agency under the L2A+ project, contract No. 4000139424/22/I-NS.
Institutional Review Board Statement
Not applicable for this study.
Informed Consent Statement
Not applicable for this study.
Data Availability Statement
The codes used to process the model simulations and retrieve the aerosol lidar optical properties are available from the authors upon request.
Acknowledgments
This research was supported by the following projects: ERC D-TECT (grant agreement No. 725698); EU H2020 e-shape project (grant agreement No. 820852); the NEWTON ESA study supported by ESA under contract No. 4000133130/20/I-BG//Aeolus+ Innovation (Aeolus+I); the EU H2020 e-shape project (grant agreement No. 820852); the PANACEA project (MIS 502151) under the Action NSRF 2014-2020, co-financed by Greece and the European Union; the ACTRIS Research Infrastructure and the data and services obtained from the PANhellenic GEophysical Observatory of Antikythera (PANGEA) of NOA; and the donation SNF-PANGEA received from the Stavros Niarchos Foundation (SNF). E. Proestakis was supported by the AXA Research Fund for postdoctoral researchers under the project entitled “Earth Observation for Air-Quality—Dust Fine-Mode—EO4AQ-DustFM”.
Conflicts of Interest
The authors declare no conflict of interest.
References
- Stohl, A.; Prata, A.J.; Eckhardt, S.; Clarisse, L.; Durant, A.; Henne, S.; Kristiansen, N.I.; Minikin, A.; Schumann, U.; Seibert, P.; et al. Determination of Time- and Height-Resolved Volcanic Ash Emissions and Their Use for Quantitative Ash Dispersion Modeling: The 2010 Eyjafjallajökull Eruption. Atmos. Chem. Phys. 2011, 11, 4333–4351. [Google Scholar] [CrossRef]
- Kristiansen, N.I.; Stohl, A.; Prata, A.J.; Bukowiecki, N.; Dacre, H.; Eckhardt, S.; Henne, S.; Hort, M.C.; Johnson, B.T.; Marenco, F.; et al. Performance Assessment of a Volcanic Ash Transport Model Mini-Ensemble Used for Inverse Modeling of the 2010 Eyjafjallajkull Eruption. J. Geophys. Res. Atmos. 2012, 117, 1–25. [Google Scholar] [CrossRef]
- Kampouri, A.; Amiridis, V.; Solomos, S.; Gialitaki, A.; Marinou, E.; Spyrou, C.; Georgoulias, A.K.; Akritidis, D.; Papagiannopoulos, N.; Mona, L.; et al. Investigation of Volcanic Emissions in the Mediterranean: “The Etna–Antikythera Connection”. Atmosphere 2021, 12, 40. [Google Scholar] [CrossRef]
- Moxnes, E.D.; Kristiansen, N.I.; Stohl, A.; Clarisse, L.; Durant, A.; Weber, K.; Vogel, A. Separation of Ash and Sulfur Dioxide during the 2011 Grímsvötn Eruption. J. Geophys. Res. Atmos. 2014, 119, 7477–7501. [Google Scholar] [CrossRef]
- Stohl, A.; Forster, C.; Frank, A.; Seibert, P.; Wotawa, G. Technical Note: The Lagrangian Particle Dispersion Model FLEXPART Version 6.2. Atmos. Chem. Phys. 2005, 5, 2461–2474. [Google Scholar] [CrossRef]
- Brioude, J.; Arnold, D.; Stohl, A.; Cassiani, M.; Morton, D.; Seibert, P.; Angevine, W.; Evan, S.; Dingwell, A.; Fast, J.D.; et al. The Lagrangian Particle Dispersion Model FLEXPART-WRF Version 3.1. Geosci. Model Dev. 2013, 6, 1889–1904. [Google Scholar] [CrossRef]
- Pisso, I.; Sollum, E.; Grythe, H.; Kristiansen, N.I.; Cassiani, M.; Eckhardt, S.; Arnold, D.; Morton, D.; Thompson, R.L.; Groot Zwaaftink, C.D.; et al. The Lagrangian Particle Dispersion Model FLEXPART Version 10.4. Geosci. Model Dev. 2019, 12, 4955–4997. [Google Scholar] [CrossRef]
- Amiridis, V.; Kampouri, A.; Gkikas, A.; Misios, S.; Gialitaki, A.; Marinou, E.; Rennie, M.; Benedetti, A.; Solomos, S.; Zanis, P.; et al. Aeolus Winds Impact on Volcanic Ash Early Warning Systems for Aviation. Sci. Rep. 2023, 13, 7531. [Google Scholar] [CrossRef] [PubMed]
- Scollo, S.; Prestifilippo, M.; Bonadonna, C.; Cioni, R.; Corradini, S.; Degruyter, W.; Rossi, E.; Silvestri, M.; Biale, E.; Carparelli, G.; et al. Near-Real-Time Tephra Fallout Assessment at Mt. Etna, Italy. Remote Sens. 2019, 11, 2987. [Google Scholar] [CrossRef]
- Skamarock, W.C.; Klemp, J.B.; Dudhia, J.; Gill, D.O.; Zhiquan, L.; Berner, J.; Wang, W.; Powers, J.G.; Duda, M.G.; Barker, D.M.; et al. A Description of the Advanced Research WRF Model Version 4; NCAR Technical Note; NCAR: Boulder, CO, USA, 2019. [Google Scholar]
- ECMWF. ECMWF Starts Assimilating Aeolus Wind Data. Available online: https://apps.ecmwf.int/mars-catalogue/?class=rd&expver=hkv (accessed on 2 December 2022).
- Stoffelen, A.; Marseille, G.J.; Bouttier, F.; Vasiljevic, D.; de Haan, S.; Cardinali, C. ADM-Aeolus Doppler Wind Lidar Observing System Simulation Experiment. Q. J. R. Meteorol. Soc. 2006, 132, 1927–1947. [Google Scholar] [CrossRef]
- Engelmann, R.; Kanitz, T.; Baars, H.; Heese, B.; Althausen, D.; Skupin, A.; Wandinger, U.; Komppula, M.; Stachlewska, I.S.; Amiridis, V.; et al. The Automated Multiwavelength Raman Polarization and Water-Vapor Lidar PollyXT: The Next Generation. Atmos. Meas. Tech. 2016, 9, 1767–1784. [Google Scholar] [CrossRef]
- Baars, H.; Seifert, P.; Engelmann, R.; Wandinger, U. Target Categorization of Aerosol and Clouds by Continuous Multiwavelength-Polarization Lidar Measurements. Atmos. Meas. Tech. 2017, 10, 3175–3201. [Google Scholar] [CrossRef]
- Ansmann, A.; Seifert, P.; Tesche, M.; Wandinger, U. Profiling of Fine and Coarse Particle Mass: Case Studies of Saharan Dust and Eyjafjallajökull/Grimsvötn Volcanic Plumes. Atmos. Chem. Phys. 2012, 12, 9399–9415. [Google Scholar] [CrossRef]
- Mamouri, R.E.; Ansmann, A. Potential of Polarization/Raman Lidar to Separate Fine Dust, Coarse Dust, Maritime, and Anthropogenic Aerosol Profiles. Atmos. Meas. Tech. 2017, 10, 3403–3427. [Google Scholar] [CrossRef]


Disclaimer/Publisher’s Note: The statements, opinions and data contained in all publications are solely those of the individual author(s) and contributor(s) and not of MDPI and/or the editor(s). MDPI and/or the editor(s) disclaim responsibility for any injury to people or property resulting from any ideas, methods, instructions or products referred to in the content. |
© 2023 by the authors. Licensee MDPI, Basel, Switzerland. This article is an open access article distributed under the terms and conditions of the Creative Commons Attribution (CC BY) license (https://creativecommons.org/licenses/by/4.0/).