1. Introduction
Moist convection often organizes in lines in Greece, despite the highly complicated nature of the terrain. Even during the warm season of the year, when convective elements are expected to be more localized/isolated, due to daytime heating, the organization of convective cells into lines is a common feature. This makes weather modification a challenging task for the staff of the Hellenic Agricultural Insurance Organization, both for air crews and meteorologists, who work on the National Hail Suppression Program. In view of the above, the ability to forecast the organization of moist convection into lines may improve the effectiveness of its treatment, as far as weather modification is concerned. The European Center for Medium-range Weather Forecasts (ECMWF), RADAR, as well as hailpad data were collected for a set of nine (9) cases from the period 2007–2017, with the criterion of an accompanying southwesterly upper air current, which has been shown to be a factor of potential occurrence of severe convection [
1]. The first of these cases occurred in the early morning hours of 18 May 2007.
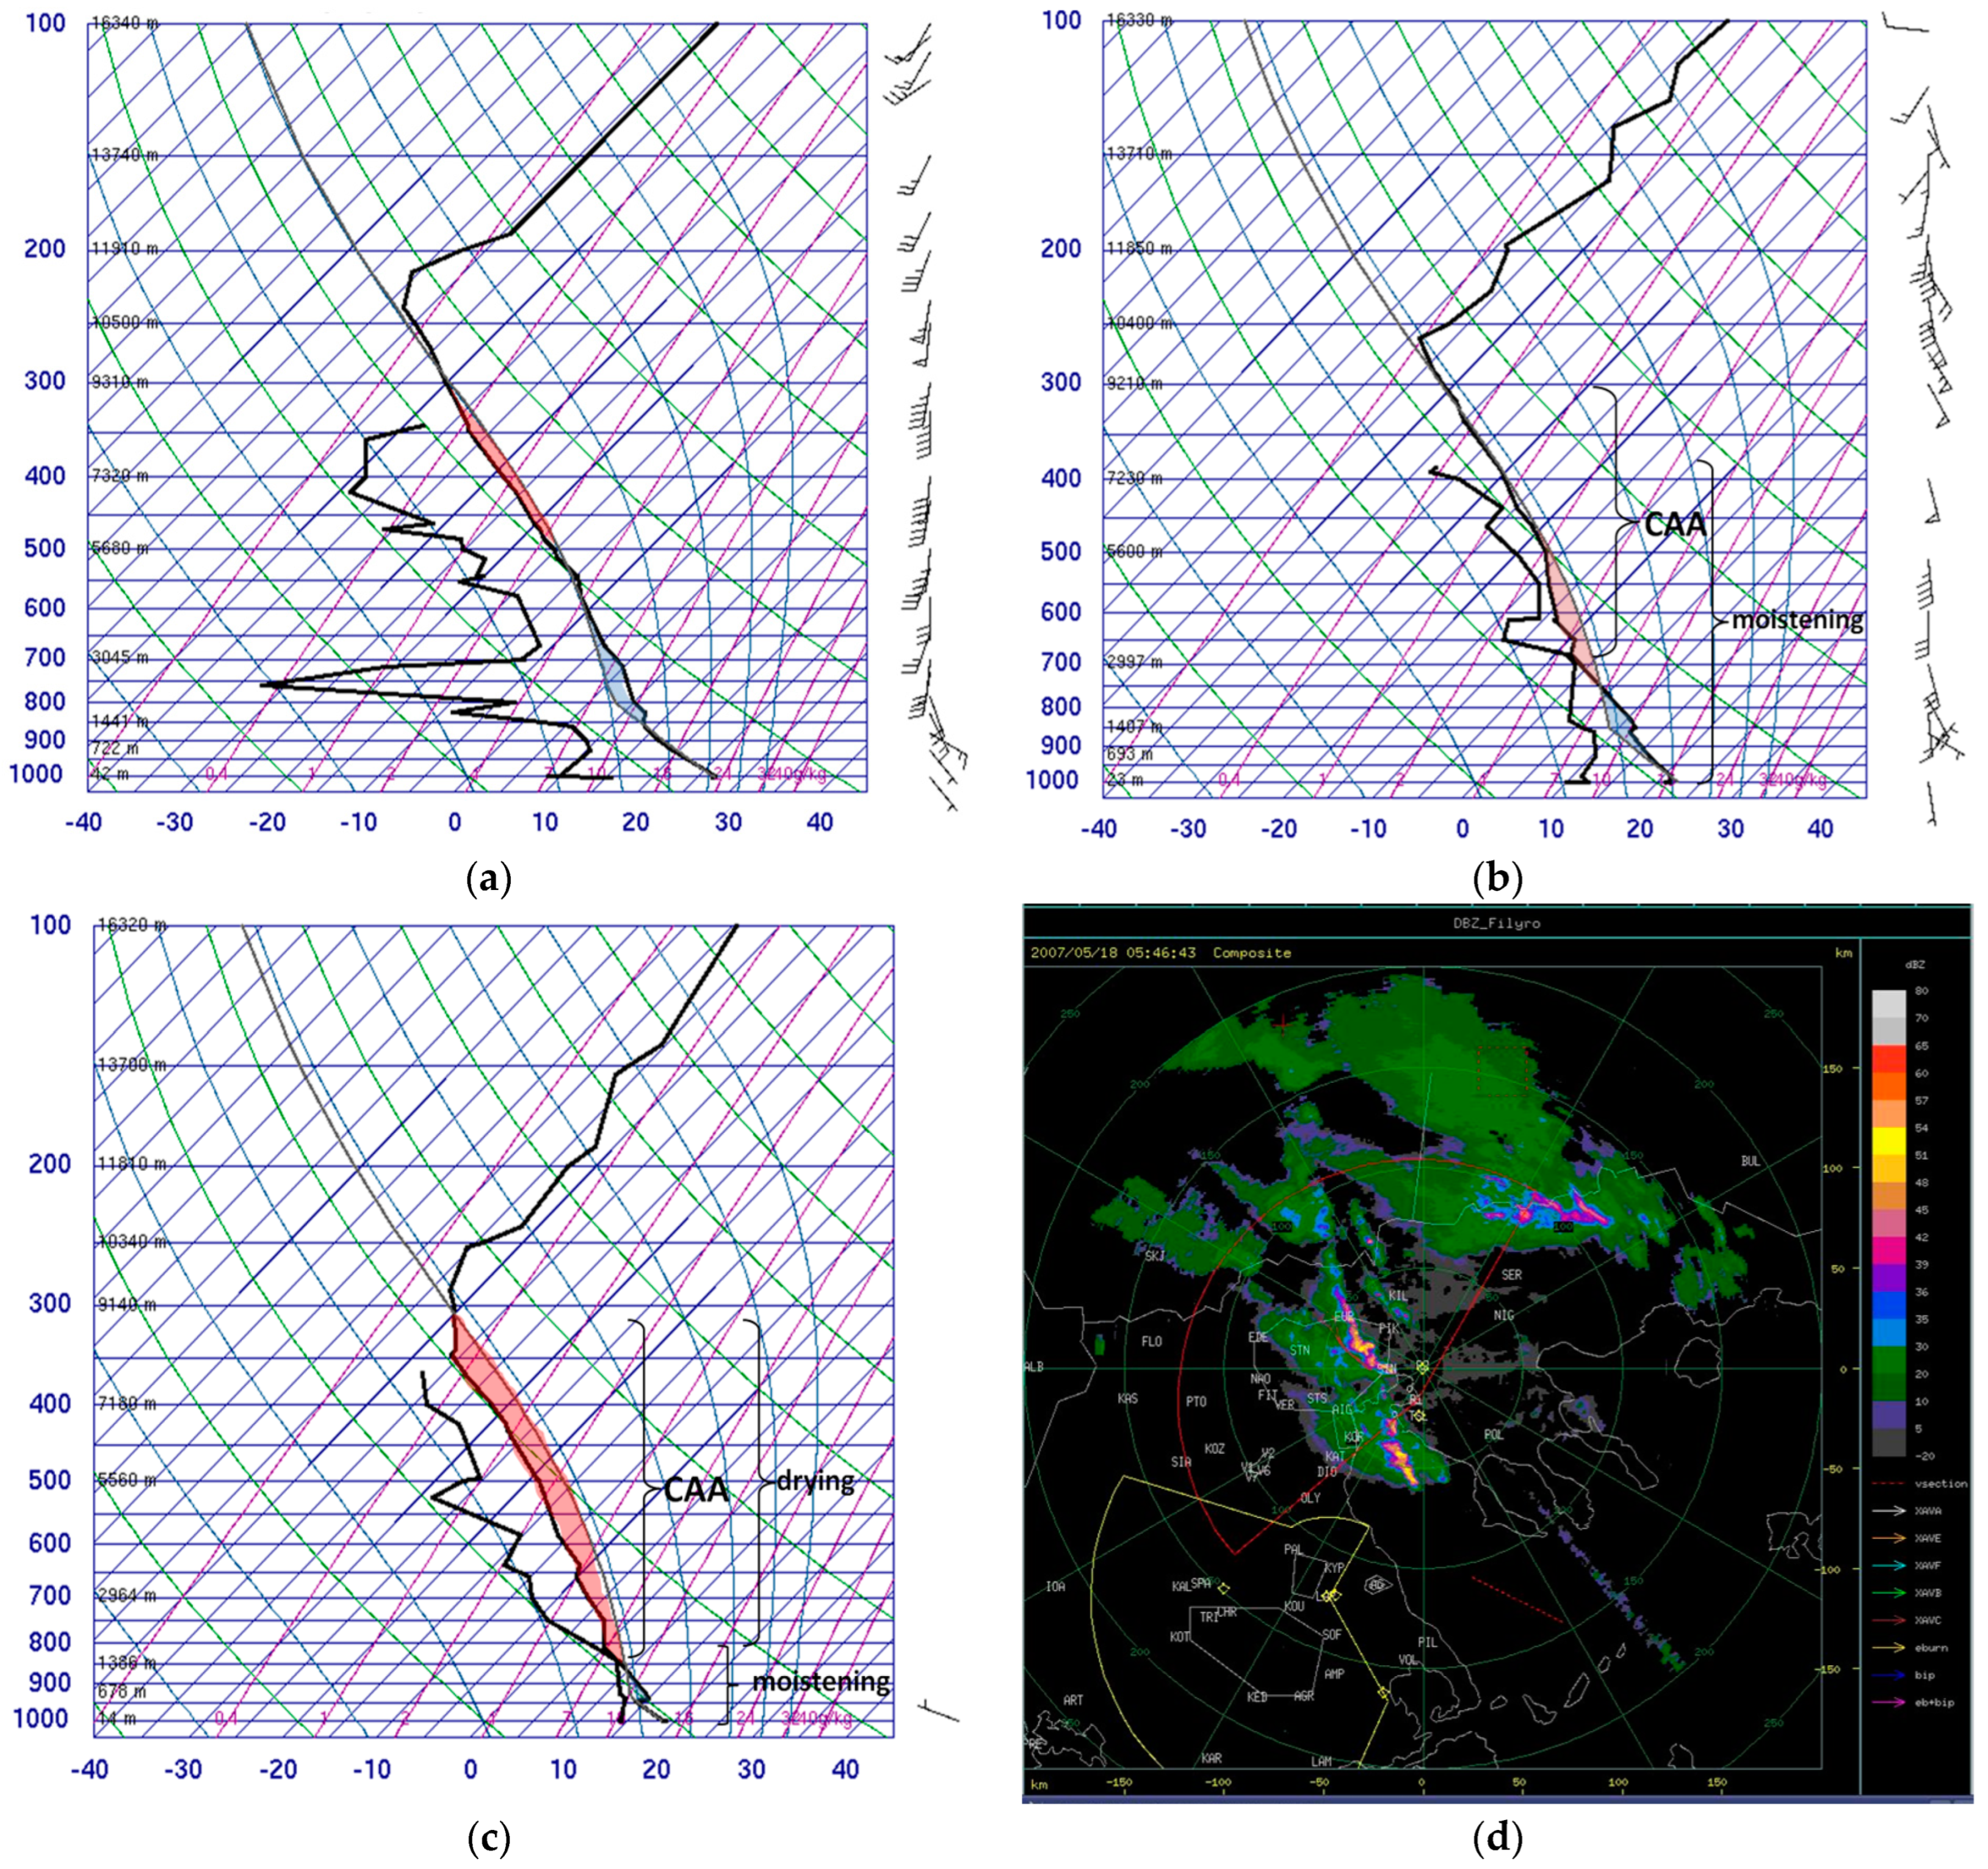
Echoes appeared on the radar monitor at 04:15 UTC, a time of the day when convection is not expected to occur. Cells were initially scattered, but very soon organized in a line, which stretched along the western coast of the Thermaikos Gulf. Also, unexpectedly, the line convection strengthened as it moved northeastward, above the sea (
Figure 1d), whose surface temperature is only 17 °C this time of the year. The line soon approached land, reaching a rather high intensity, with maximum reflectivities exceeding 60 dBz and producing hail. The gradual vertical destabilization of the air column may be seen in the Τ-Φgrams of
Figure 1a–c.
2. Synoptic–Meso-α Scale-Associated Features
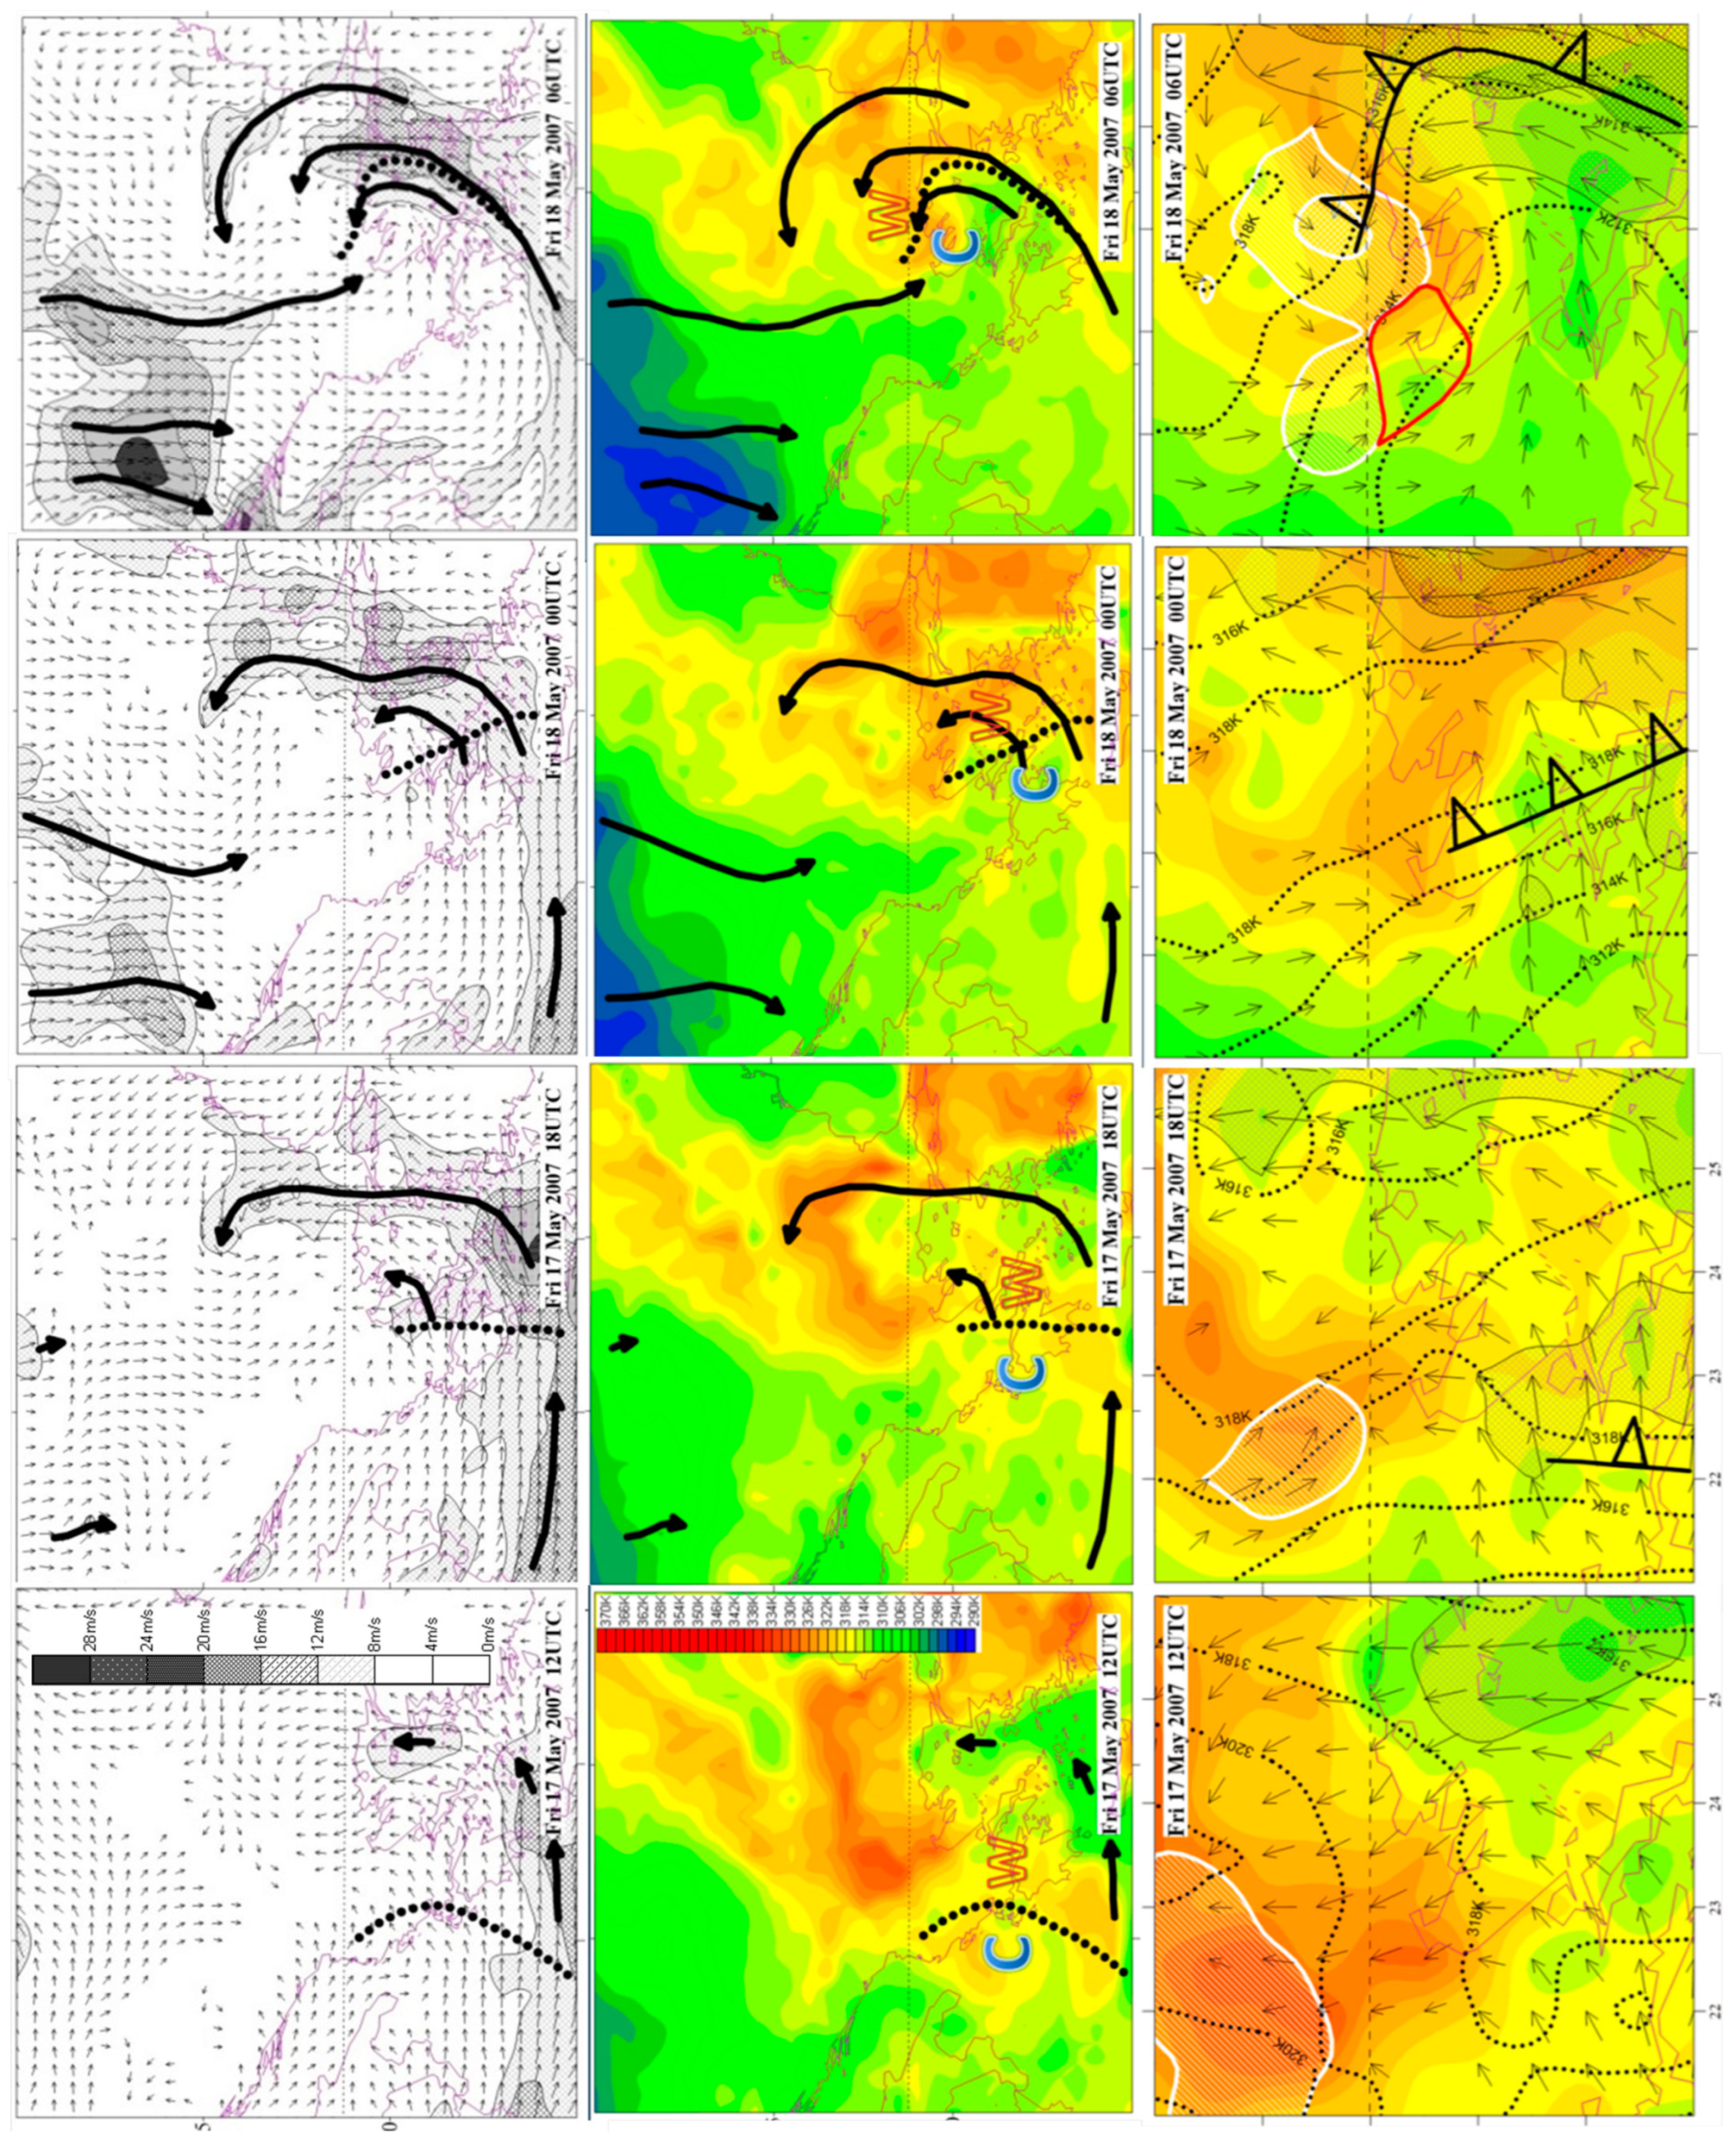
Neither the time nor the area of formation favored the initiation of moist convection in this case, whichindicates the potentially important role of the dynamics. All charts and plots are for the period 12 UTC on 17 May–06 UTC on 18 May 2007. Synoptic charts are plotted in
Figure 2. At 12 UTC on 17 May (hereafter 17/12), two main frontal lows can be seen in the left column, one in southern Scandinavia, with its cold front extending down to Central Europe and another one in the Balkans, with a ratherlooser frontal structure. The accompanying upper air troughs, a southern and a northern one, merge along the northwesterly part of their flow. This creates a strong north northwesterly jet. Warm air (see 300–500 hPa relative flow directions) and anticyclonic vorticity (not shown) advection occur in the jet, whereas cold air and cyclonic vorticity advection occur ahead of its left exit, above Greece. This flow pattern is associated with the gradual build-up of the ridgeabove Western Europe and the deepening/amplification and later tendency of the trough in the Mediterranean to cut-off. The response of the mean sea level pressure (MSLP) is the gradual southeastward expansion of the cold anticyclone behind the main cold front in Europe and the slow deepening of the stationary low in Greece. At the time, the convective event under study occurred, 18/06 (last chart), the maximum pressure gradient is observed above the Balkans, with five (5) standard isobars between Central Europe and Greece and the anticyclone (low) attaining its maximum (minimum) pressure, 1022 (1002) hPa in Austria (Northern Greece). As will be seen below, this strong pressure gradient was associated with a northwesterly current, which even reached Greece pre-frontally. The deepening of the low favored the convergence of the northwesterly current with an easterly current, in the area the convection emerged.
In the right column, the main features of interest are the following. A polar air mass (min θe ~290 K) advances southeastward behind the main cold front in Europe. Further south, due to the land/mass distribution, southwesterly wind directions act to advect relatively cool air masses, so the warm sector (max θe ~330 K) of the low in Greece is actually cut-off to the north of the center of the low. From 18/00, the cool northwesterly pre-frontal flow of the main cold front has entered Greece and, at 18/06, it converges with the warm easterly flow, associated with the warm sector of the low. Equally important, at 500 hPa, a baroclinic zone surrounds the trough of cold/dry air (min θe ~210 K) in Southern Italy, at 17/12. As the trough expands westward, this upper level front (ULFnt, thick dotted black line) sweeps across Greece. Just before 18/06, the time the convection occurred, the passage of the ULFnt coincides with the convergence of the northwesterlies with the easterlies at low levels. The above correspond to a vertical column destabilization and a low-level triggering of convection, respectively.
Aiming to focus in the area of interest, low-level flow and low and upper-level θ
e are plotted in
Figure 3. Only the low-level flow is shown in the left column, where the gradual pick up of the winds is evident around the low in the Greek area. Two are the most important wind currents. First, the initially southerly one, that gradually spirals around the low, finally (18/06) turning easterly in Central Makedonia. Second, the northerly current that advances southward, entering the chart (Greek area) at 17/18 (18/06). The two above wind currents converged at the time and place the convective line formed.
In the middle column, the thermal advection associated with each of the above air currents may be inferred, as the 850 hPa θe distribution is in the background. It is obvious that in the area the convection broke out (18/06), cold (warm) air advection from the NNW (east) were brought into close proximity. In both left and middle columns, it can be seen that the vertical superposition of dry and cold air masses (see passage of ULFnt) aided vertical destabilization.
In the third column of
Figure 3, a further focus in the Central Makedonian area shows that the ULFnt is better defined in the eastern part. This is in accordance with the fact that the ECMWF actually diagnosed little or no ascent (white cross-hatching) in the region affected by the line under study (red area in last chart of the sequence). A comparison of the sounding data (
Figure 1a–c) with ECMWF vertical profiles may shed light in the poorly reproduced physical processes that led to this model deviation.
3. Conclusions
The examination of ECMWF data shows that early in the morning of 18 May 2007, in Central Makedonia, the low-level confluence between a warm easterly current and a cold northwesterly one coincided with the passage of an ULFnt aloft. The low-level convergence provided the necessary trigger, lifting the convectively unstable layer that formed as cold/dry air masses which, superimposed onto the warm and humid ones, wasadvected by the low-level easterly flow. The result was the break out of convection, which organized into a line that very likely consisted of the points of the “temporal” intersection of the convergence line and the ULFnt. Although further research is required toward this direction, a general conclusion from this study is that the careful appreciation of the synoptic–meso-α features is required in order to detect the potential for moist convection, especially during the warm season, when an only-minor trigger may result in significant activity. A more specific conclusion is that the eastern–northeasterly winds are particularly favorable for moist convection, as they advect air that is heated over the adjacent land mass. Cut-off lows at relatively low latitudes favor a general backing of the wind with time, at least up to the easterly direction. Less backing would mean that the southerly component of the wind would transfer cool air masses from the Aegean Sea, which would dump the convection, whereas no backing at all would mean a significant westerly component, which is katabatic in the area of Central Makedonia.


