Proceeding Paper

A Background Error Statistics Analysis over the Mediterranean: The Impact on 3DVAR Data Assimilation †

1
Section of Environmental Physics and Meteorology, Department of Physics, National and Kapodistrian University of Athens, 15772 Athens, Greece
2
Hellenic National Meteorological Service, Hellinikon, 16777 Athens, Greece
3
Department of Mathematics and Natural Sciences, Hellenic Air Force Academy, 13672 Acharnes, Greece
*
Author to whom correspondence should be addressed.
Presented at the 16th International Conference on Meteorology, Climatology and Atmospheric Physics—COMECAP 2023, Athens, Greece, 25–29 September 2023.
Environ. Sci. Proc. 2023, 26(1), 158; https://doi.org/10.3390/environsciproc2023026158
Published: 4 September 2023

Abstract

:
Data assimilation is a technique used to combine observational data with numerical weather analysis fields to produce input conditions for Numerical Weather Prediction (NWP) models aimed at more accurate forecasts. In this study, two different regional Background Error (BE) covariance statistics are evaluated for the implementation of a Weather Research and Forecast (WRF) model using Variational Data Assimilation (VAR) schemes. Two different WRF model forecasts, initialized at different times, are compared to calculate different regional BE statistics based on the National Meteorological Center (NMC) technique. These statistics are then used in the three-dimensional variational (3DVAR) data assimilation process to produce analysis fields for a 15 day period during September 2019. The study compares the forecasts produced using the two different ΒΕ statistics and presents the results of the analysis fields during the medicane “Ianos” formed in September 2020 in the eastern Mediterranean Sea. The study demonstrates the importance of BE statistics’ usage in data assimilation. The results suggest that different initialization times can lead to significant differences in weather evolution. The study also highlights the need for caution in the choice of BE statistics and the importance of best practices in data assimilation.

1. Introduction

The process of Data Assimilation (DA) is essential for Numerical Weather Prediction (NWP) models, as it allows for the incorporation of observations into the model by improving its input fields and hence its ability to predict future weather conditions.
Advancements in NWP models have led to various DA techniques. Three- and four-dimensional variational methods (3DVar/4DVar), ensemble Kalman filters (EnKF), and latent heat nudging (LHN) are some examples of variational and ensemble approaches [1,2]. The high computational cost of 4D-Var and EnKF methods makes them less feasible for operational forecasting systems, despite their promising capabilities. In contrast, 3DVar demonstrates a better performance with a lower computational cost for the analyses of atmospheric conditions compared to 4DVar, EnKF, and LHN [3,4].
The objective of the DA of observations is to closely approximate the actual initial conditions for NWP. The starting state of a forecast model is generally large compared to the amount of observations [5]. In the context of limited-area forecasts, is essential to fine-tune the observational values based on domain-specific information, commonly referred to as background error covariance statistics. This is achieved by introducing the use of BE covariance statistics, which play a crucial role in VAR schemes. The accuracy of the DA solution depends on several factors, including the representation of the observation error covariance matrix and the background error statistics, which describe the inherent uncertainty in the numerical model forecasts. The matrix is typically represented by a covariance matrix, which describes the relationships between different variables in the background state and their uncertainty. It is typically estimated using a set of model forecasts initialized at different times, known as a “background ensemble”.
Incorporating surface observations into an NWP model is likely to enhance its performance. Prior research has showcased such improvements with the use of temperature, water vapor, mixing ratio, and winds [6], as well as potential and dew point temperature near-surface observations [7] into NWP models, for calculating planetary boundary layers (PBL), as they are commonly used to model mesoscale weather [8]. A common method employed for this purpose uses the variability in forecast outcomes as a proxy for estimating background error statistics, also known as “the NMC method” [9].
The process of background error estimation is very important, as it adds to the calculation of the adequate weight for the observations to be used in the DA [10]. Multiple meteorological variables are correlated regarding background errors, enabling the analysis to make multivariate adjustments that reflect the atmosphere’s dynamic and physical equilibrium [11,12]. Limited-area NWPs are less effective at capturing large-scale phenomena compared to global area forecasts [13].
Medicanes are intense and damaging cyclones that occur in the Mediterranean Sea. However, due to the limited number of observations available in this region, it is challenging to accurately forecast and track their formation. The small domain size of the Mediterranean Sea and its scarcity of observations make it difficult to use traditional NWP models. In these cases, DA techniques can play a crucial role in improving the accuracy of the forecast by combining the limited observations with the model’s first guess and incorporating the uncertainties in each source of information, leading to improved forecasting skills for these rare and intense weather events in the Mediterranean Sea. A medicane that occurred in September 2020 is the case study selected for the purposes of the present work, in order to assess the performance of different BE calculations in a 3DVAR data assimilation and the resulting forecast.

2. Materials and Methods

2.1. BE Estimates

The background error covariance in 3DVar experiments is static and prescribed by the National Meteorological Center (NMC) method [9]. It assumes homogeneous and isotropic correlations for a set of independent control variables derived from the forecast differences. The control variables in this study were stream function, unbalanced temperature, unbalanced potential velocity, unbalanced surface pressure, and pseudo relative humidity, referred as “CV5”. [3].
For the evaluation of BE, a 15 day period from 5 September 2019 to 20 September 2019 was selected. This timeframe represents statistics from the same month (September), but from the preceding year. Analysis (0 h), 12, and 24 h WRF-ARW forecasts, initialized both at 00 and at 12 UTC, were used. Thus 30 pairs of perturbations were available to generate the WRF-ARW BE statistics. A selection of two sets of forecasts was made. The first refers to 12 and 24 h (BE1) and the second to analysis (0 h) and 12 h (BE2).

2.2. Data Assimilation

The 3DVAR technique uses a mathematical optimization method called Variational Analysis (VA) to minimize the difference between the model’s initial conditions prior to the DA and the observations. VAR schemes play an important role in the initialization of NWP forecasts by providing high-resolution information on the horizontal and vertical components of the atmosphere, especially in areas where there is no adequate observations coverage, such as the Mediterranean Sea.
In this research, we employed the WRF-3DVar by Barker et al. [3] alongside the WRF model to assimilate the surface observations. Background errors influence the process of DA substantially. The 3DVAR minimization equation is as follows:
J ( x ) = x x b T B 1 ( x x b ) + y H x T R 1 ( y H ( x ) )
where xb is the background state vector, B is the background error covariance matrix, y is the observation vector, H is the observation operator, and R is the observation error covariance matrix. The analysis state vector x is an estimate of the true atmospheric state that is most consistent with both the background state and the observations, as a solution to the minimization problem of Equation (1). The technique aims to balance the difference between the model’s background state and the observation error, while also taking into account the background error statistics [14].
The assimilated data included GTS METAR observation data during the month of September 2020, obtained from HNMS archives. These archives include pressure and temperature along with dew point, as well as wind information. A total of 312 multi-national observation stations were gathered, as shown in Figure 1. The availability of the data at each time period determined the specific time slots in which the corresponding observations were accessible. Observations that fell within a window of +30 min to −29 min relative to each hour were considered as valid for assimilation. This approach created hourly sets of observations. Observations over sea (e.g., buoy data) and satellite radiances, as well as other indirect observations, which would probably have more effect on the track of a medicane, were not used in this study. The observation preprocessing module (OBSPROC) of WRFVar was implemented for data sorting, quality control, and observational error assignment [3].

2.3. WRF Configuration and Runs

The WRF model provides options for different physical parameterizations, including microphysics, cumulus physics, surface physics, planetary boundary layer physics, and radiation physics. The model performance is highly dependent on the parameterization schemes selected. Parameterization schemes for convective simulations were selected. The main physics packages used in this study included the WRF Single-Moment 3-classmicrophysical parameterization, the Rapid Radiative Transfer Model (RRTM) shortwave and longwave radiation scheme, Mellor–Yamada–Janjic (MYJ) planetary boundary layer scheme, Tiedtke scheme for Cumulus Parameterization, and Monin–Obukhov-based surface layer (Eta similarity).
For BE1 and BE2, WRF runs were performed after successful DA, with an initialization time of 06UTC on 17 September 2020.

3. Results

3.1. BE Results

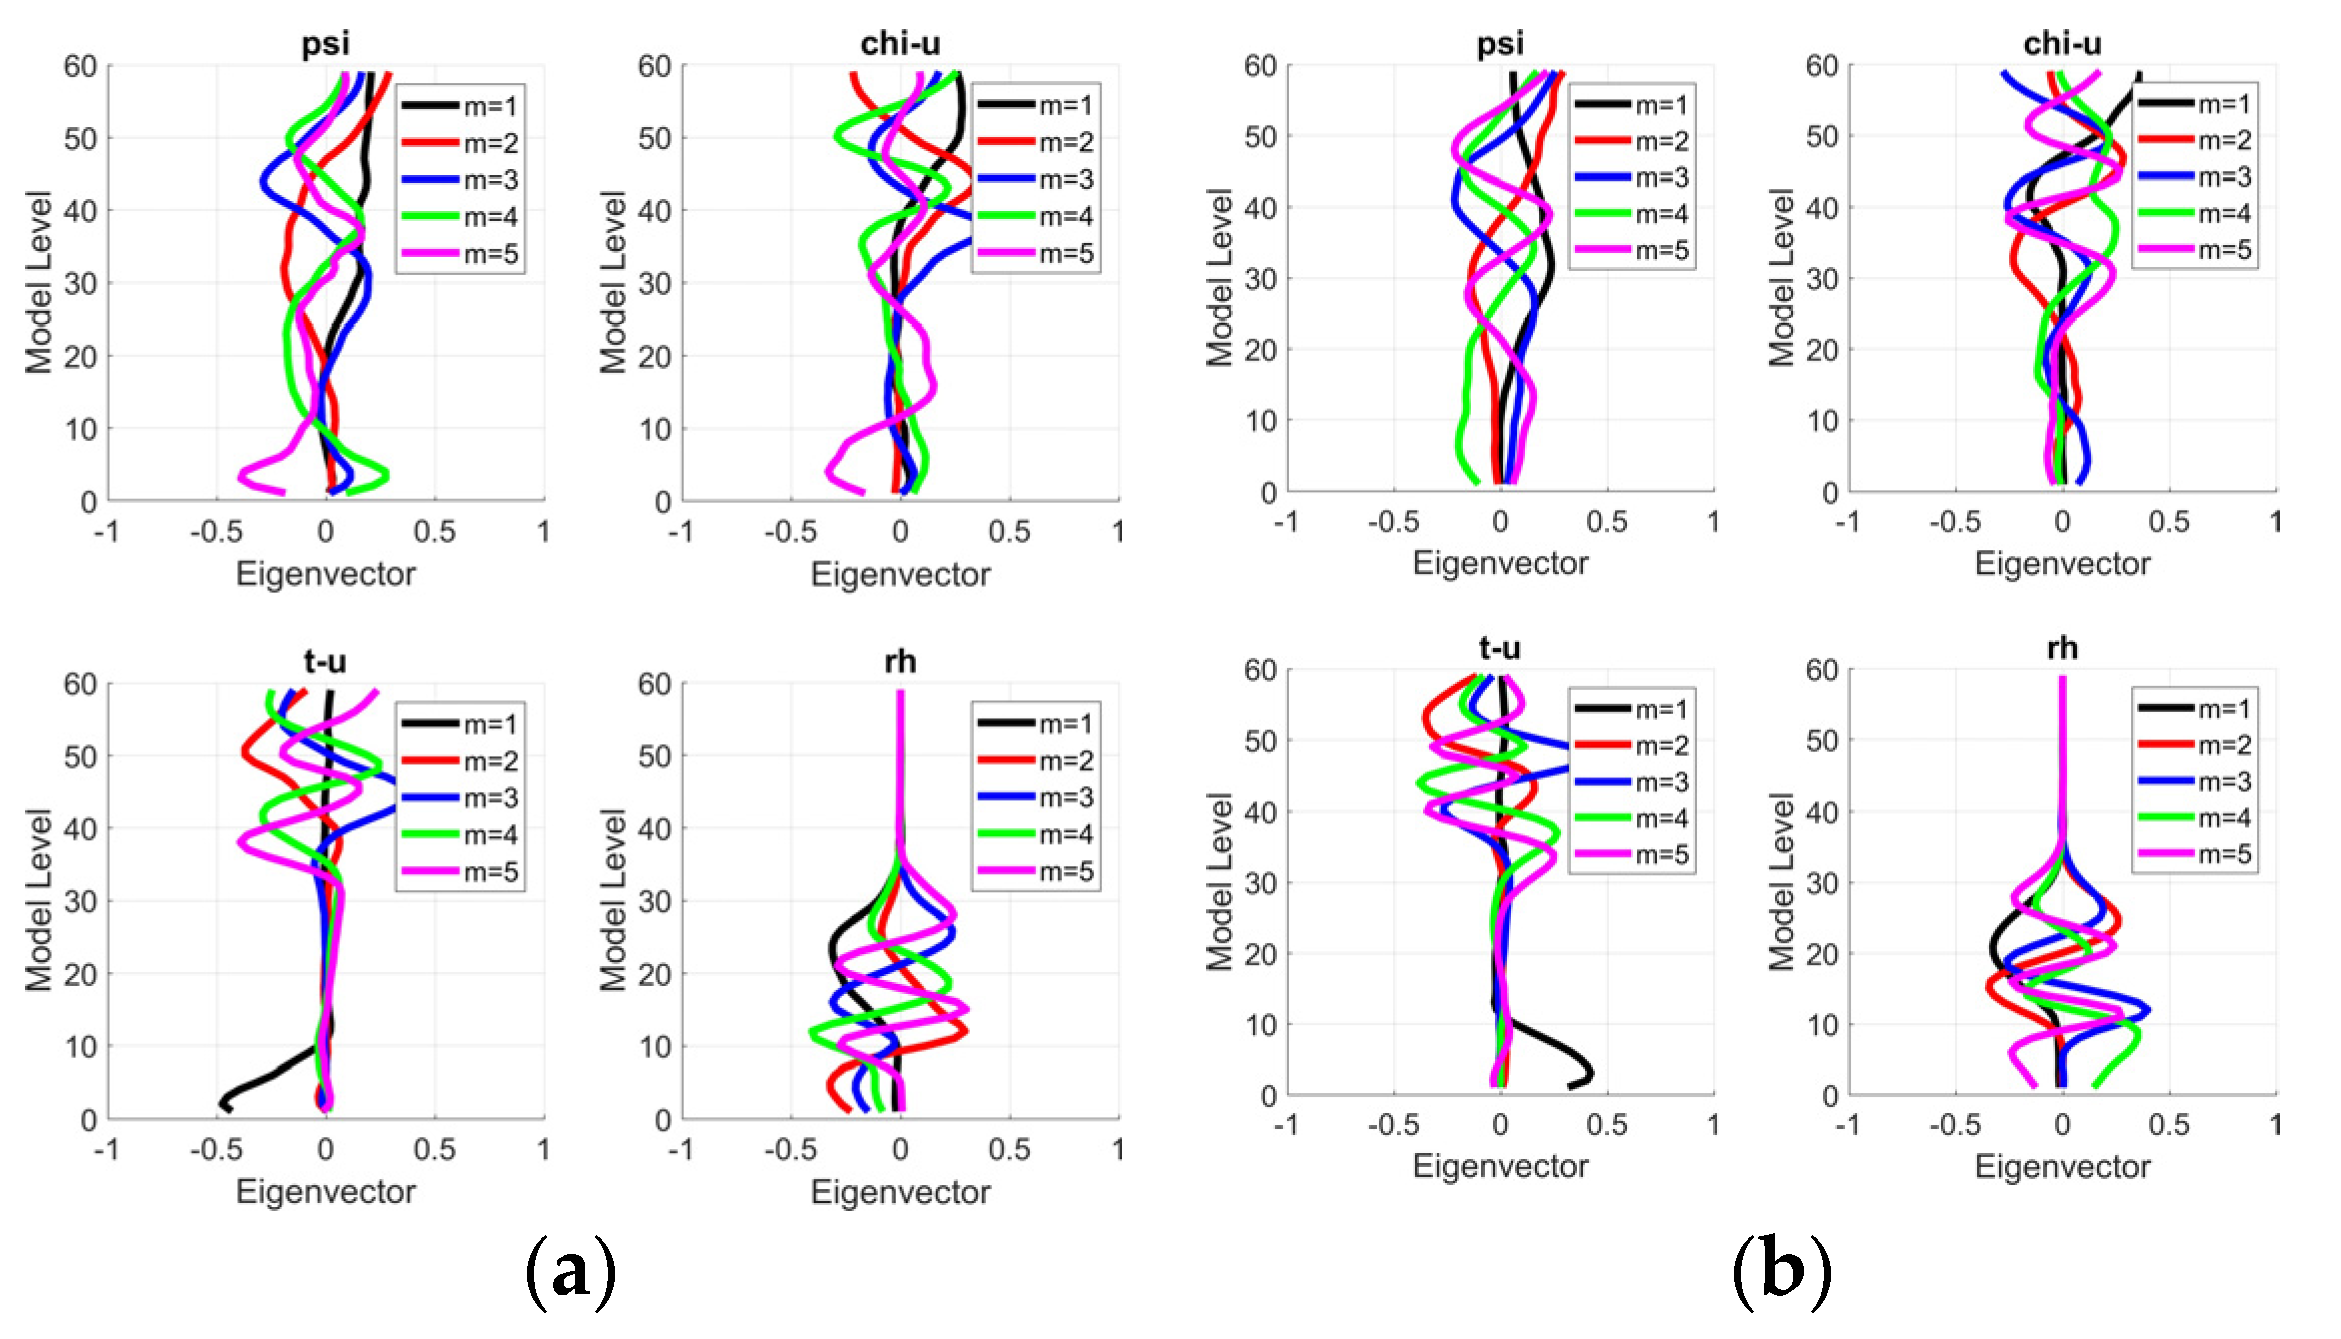
The BE eigenvectors of psi (stream function), chi−u (unbalanced part of velocity potential), t−u (unbalanced part temperature), and rh (relative humidity variables) were calculated for two sets of BEs, as shown in Figure 2. The vertical structure was different between BE1 and BE2, especially for the eigenvectors of relative humidity for vertical levels up to 35 corresponding to 400 hPa. There were also differences between the unbalanced part of the velocity potential for all vertical levels. The stream function and unbalanced temperature part shared similar patterns across vertical levels.

3.2. Temperature Difference of BE1 and BE2 Runs

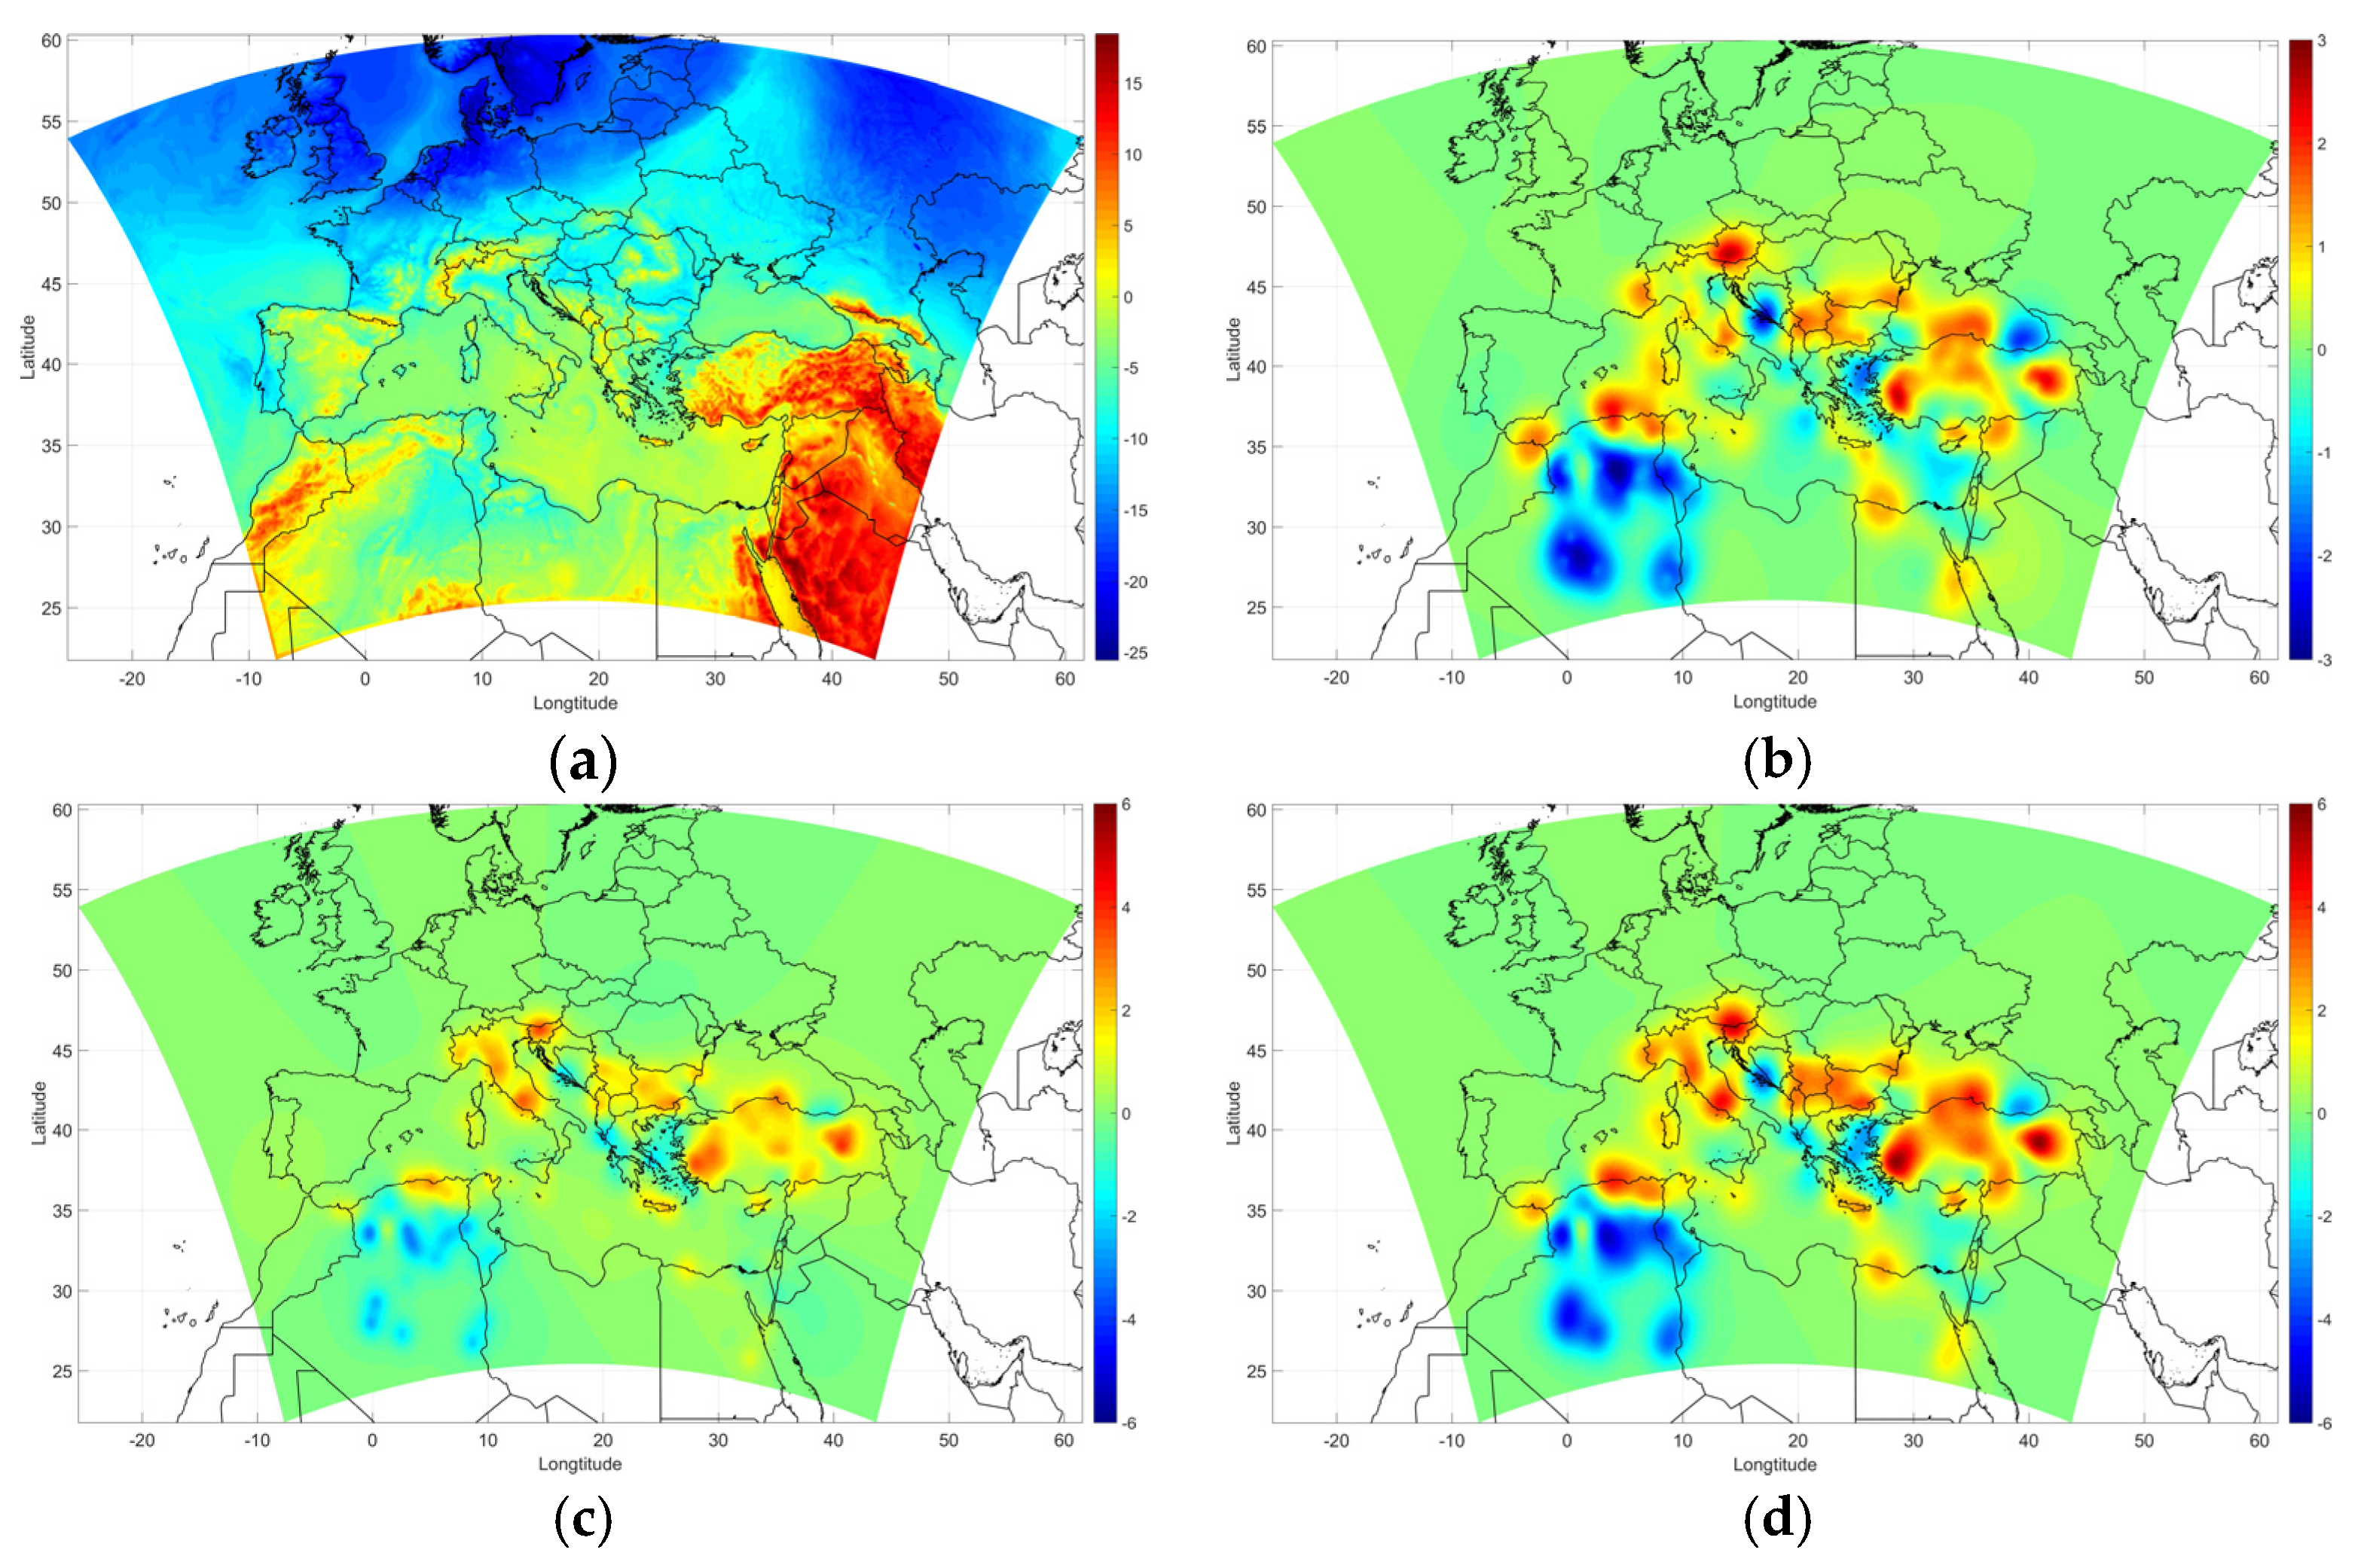
Humidity, wind, and temperature are some of the most important parameters in medicane forecasting. As an example visualization method, the temperature at the lowest level was selected. Figure 3 shows the original values of the temperature field before the DA and the differences between the analyses produced with BE1 and BE2, as well as the differences between the analyses produced with BE1 and BE2 minus the original temperature. It was noticeable that the assimilated temperatures were different from those in the original field of analysis, based on the differences in Figure 3c and Figure 3d. Moreover, the assimilated temperature field had greater values in BE2 than those in BE1 in many locations, but Figure 3b indicates locations where there was an uneven increase in the intensity of the temperature field. BE2 is not a scaled variant of BE1, but rather represents a distinct set of BE statistics. Furthermore, BE2 showed more difference in its initial analysis than BE1. Thus, using BE1 increased the weight of the background state compared to the observations, which may be not desirable in DA. The non-uniform changes in the temperature intensity across the field revealed distinct atmospheric dynamics captured in BE2, emphasizing the importance of context-specific BE statistics in data assimilation and forecasting.

3.3. Track and Intensity of BE1 and BE2 Runs

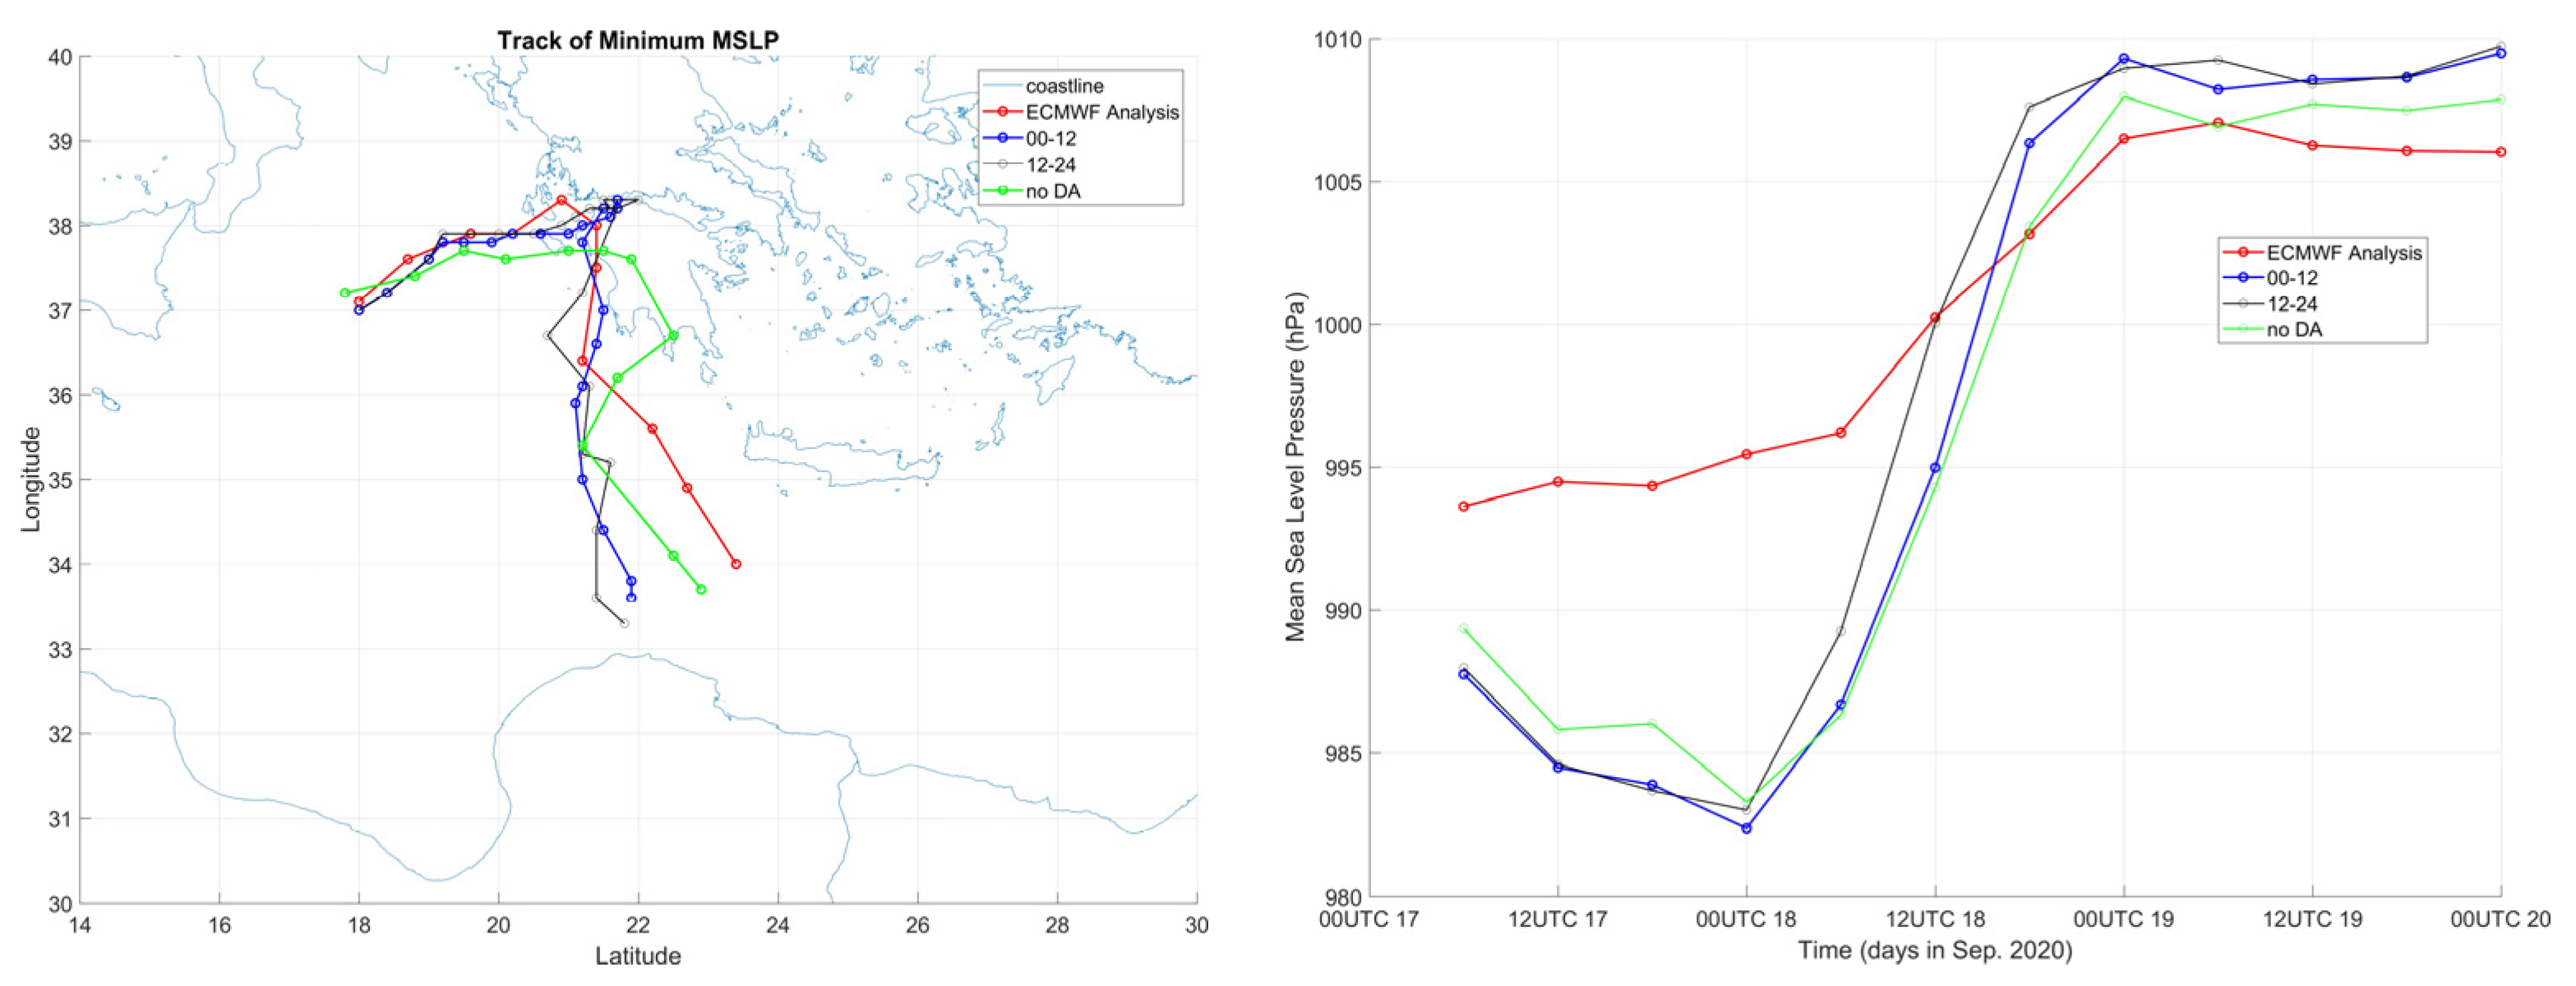
The cyclone’s track and along-track intensity (in terms of minimum sea level pressure) from the BE1 and BE2 simulations and ECMWF IFS analysis are shown in Figure 4, for an initialization time of 17 (06 UTC) September 2020. The simulated trajectory of BE1 and BE2 closely aligned with the analysis, compared to the trajectory without DA. In terms of Mean Sea Level Pressure (MSLP), compared to the IFS analysis, both the BE1 and BE2 simulations exhibited an average overestimation of approximately 9 hPa during the cyclone’s intensification stage (before 12UTC on 18 September 2020), as well as an average underestimation of 3 hPa (after 12UTC on 18 September 2020).

4. Discussion

In this study, we examined the impact of different background error statistics on forecasting a Mediterranean cyclone, and the analysis fields produced by data assimilation were compared. The WRF runs indicated the impact of the different background error statistics on the weather evolution, highlighting the importance of the careful consideration of background error statistics in VAR DA for operational nowcasting NWP.
The choice of background error statistics and implementation of data assimilation techniques can result in different initial conditions. These diverse initial conditions can serve as a subset of an ensemble prediction system, providing valuable insights into a range of possible weather outcomes. Furthermore, our findings highlighted the impact of carefully selecting and determining the initial conditions for improved weather forecasting. The accurate representation of the initial state of the atmosphere through the appropriate choice of background error statistics and the skillful assimilation of observational data can significantly enhance the accuracy and reliability of weather forecasts. The comparison of eigenvectors revealed distinct differences between the two datasets, indicating variations in the spatial patterns of the assimilated data. Three-dimensional VAR methodology was employed for resource efficiency regarding DA.
Further investigation into other cases of convective weather systems is planned.

Author Contributions

Conceptualization, I.S.; methodology, I.S.; software, I.S.; validation, I.S.; formal analysis, I.S.; investigation, I.S.; resources, I.S.; data curation, I.S.; writing—original draft preparation, I.S.; writing—review and editing, H.F. and P.L.; visualization, I.S.; supervision, H.F. and P.L. All authors have read and agreed to the published version of the manuscript.

Funding

This research received no external funding.

Institutional Review Board Statement

Not applicable.

Informed Consent Statement

Not applicable.

Data Availability Statement

Data available upon request to the corresponding author.

Acknowledgments

This work was supported by computational time granted from the National Infrastructures for Research and Technology S.A. (GRNET S.A.) in the National HPC facility—ARIS—under project ID pr011014 (DACSOT).

Conflicts of Interest

The authors declare no conflict of interest.

References

  1. Liu, J.; Bray, M.; Han, D. Exploring the effect of data assimilation by WRF-3DVar for numerical rainfall prediction with different types of storm events. Hydrol. Process. 2013, 27, 3627–3640. [Google Scholar] [CrossRef]
  2. Xiong, C.-H.; Zhang, L.-F.; Guan, J.-P.; Peng, J.; Zhang, B. Analysis and numerical study of a hybrid BGM-3DVAR data assimilation scheme using satellite radiance data for heavy rain forecasts. J. Hydrodyn. 2013, 25, 430–439. [Google Scholar] [CrossRef]
  3. Barker, D.M.; Huang, W.; Guo, Y.-R.; Bourgeois, A.J.; Xiao, Q.N. A Three-Dimensional Variational Data Assimilation System for MM5: Implementation and Initial Results. Mon. Weather Rev. 2004, 132, 897–914. [Google Scholar] [CrossRef]
  4. Xiao, Q.; Sun, J. Multiple-Radar Data Assimilation and Short-Range Quantitative Precipitation Forecasting of a Squall Line Observed during IHOP_2002. Mon. Weather Rev. 2007, 135, 3381–3404. [Google Scholar] [CrossRef]
  5. Lindskog, M.; Gustafsson, N.; Mogensen, K.S. Representation of background error standard deviations in a limited area model data assimilation system. Tellus A Dyn. Meteorol. Oceanogr. 2006, 58, 430–444. [Google Scholar] [CrossRef]
  6. Hacker, J.P.; Rostkier-Edelstein, D. PBL state estimation with surface observations, a column model, and an ensemble filter. Mon. Weather Rev. 2007, 135, 2958–2972. [Google Scholar] [CrossRef]
  7. Stensrud, D.J.; Yussouf, N.; Dowell, D.C.; Coniglio, M.C. Assimilating surface data into a mesoscale model ensemble: Cold pool analyses from spring 2007. Atmos. Res. 2009, 93, 207–220. [Google Scholar] [CrossRef]
  8. Ruggiero, F.H.; Modica, G.D.; Lipton, A.E. Assimilation of Satellite Imager Data and Surface Observations to Improve Analysis of Circulations Forced by Cloud Shading Contrasts. Mon. Weather Rev. 2000, 128, 434. [Google Scholar] [CrossRef]
  9. Parrish, D.F.; Derber, J.C. The National Meteorological Center’s Statistical Spectral Interpolation Analysis System. Mon. Weather Rev. 1992, 109, 1747–1763. [Google Scholar] [CrossRef]
  10. Kutaladze, N.; Mikuchadze, G. Background Error in WRF Model. WSEAS Trans. Environ. Dev. 2020, 16, 619–624. [Google Scholar] [CrossRef]
  11. Gustafsson, N.; Janjić, T.; Schraff, C.; Leuenberger, D.; Weissmann, M.; Reich, H.; Brousseau, P.; Montmerle, T.; Wattrelot, E.; Bučánek, A.; et al. Survey of data assimilation methods for convective-scale numerical weather prediction at operational centres. Q. J. R. Meteorol. Soc. 2018, 144, 1218–1256. [Google Scholar] [CrossRef]
  12. Lee, J.C.K.; Huang, X.-Y. Background error statistics in the Tropics: Structures and impact in a convective-scale numerical weather prediction system. Q. J. R. Meteorol. Soc. 2020, 146, 2154–2173. [Google Scholar] [CrossRef]
  13. Wang, H.; Huang, X.-Y.; Xu, D.; Liu, J. A scale-dependent blending scheme for WRFDA: Impact on regional weather forecasting. Geosci. Model Dev. 2014, 7, 1819–1828. [Google Scholar] [CrossRef]
  14. Lorenc, A.C. Analysis methods for numerical weather prediction. Q. J. R. Meteorol. Soc. 1966, 112, 1177–1194. [Google Scholar] [CrossRef]
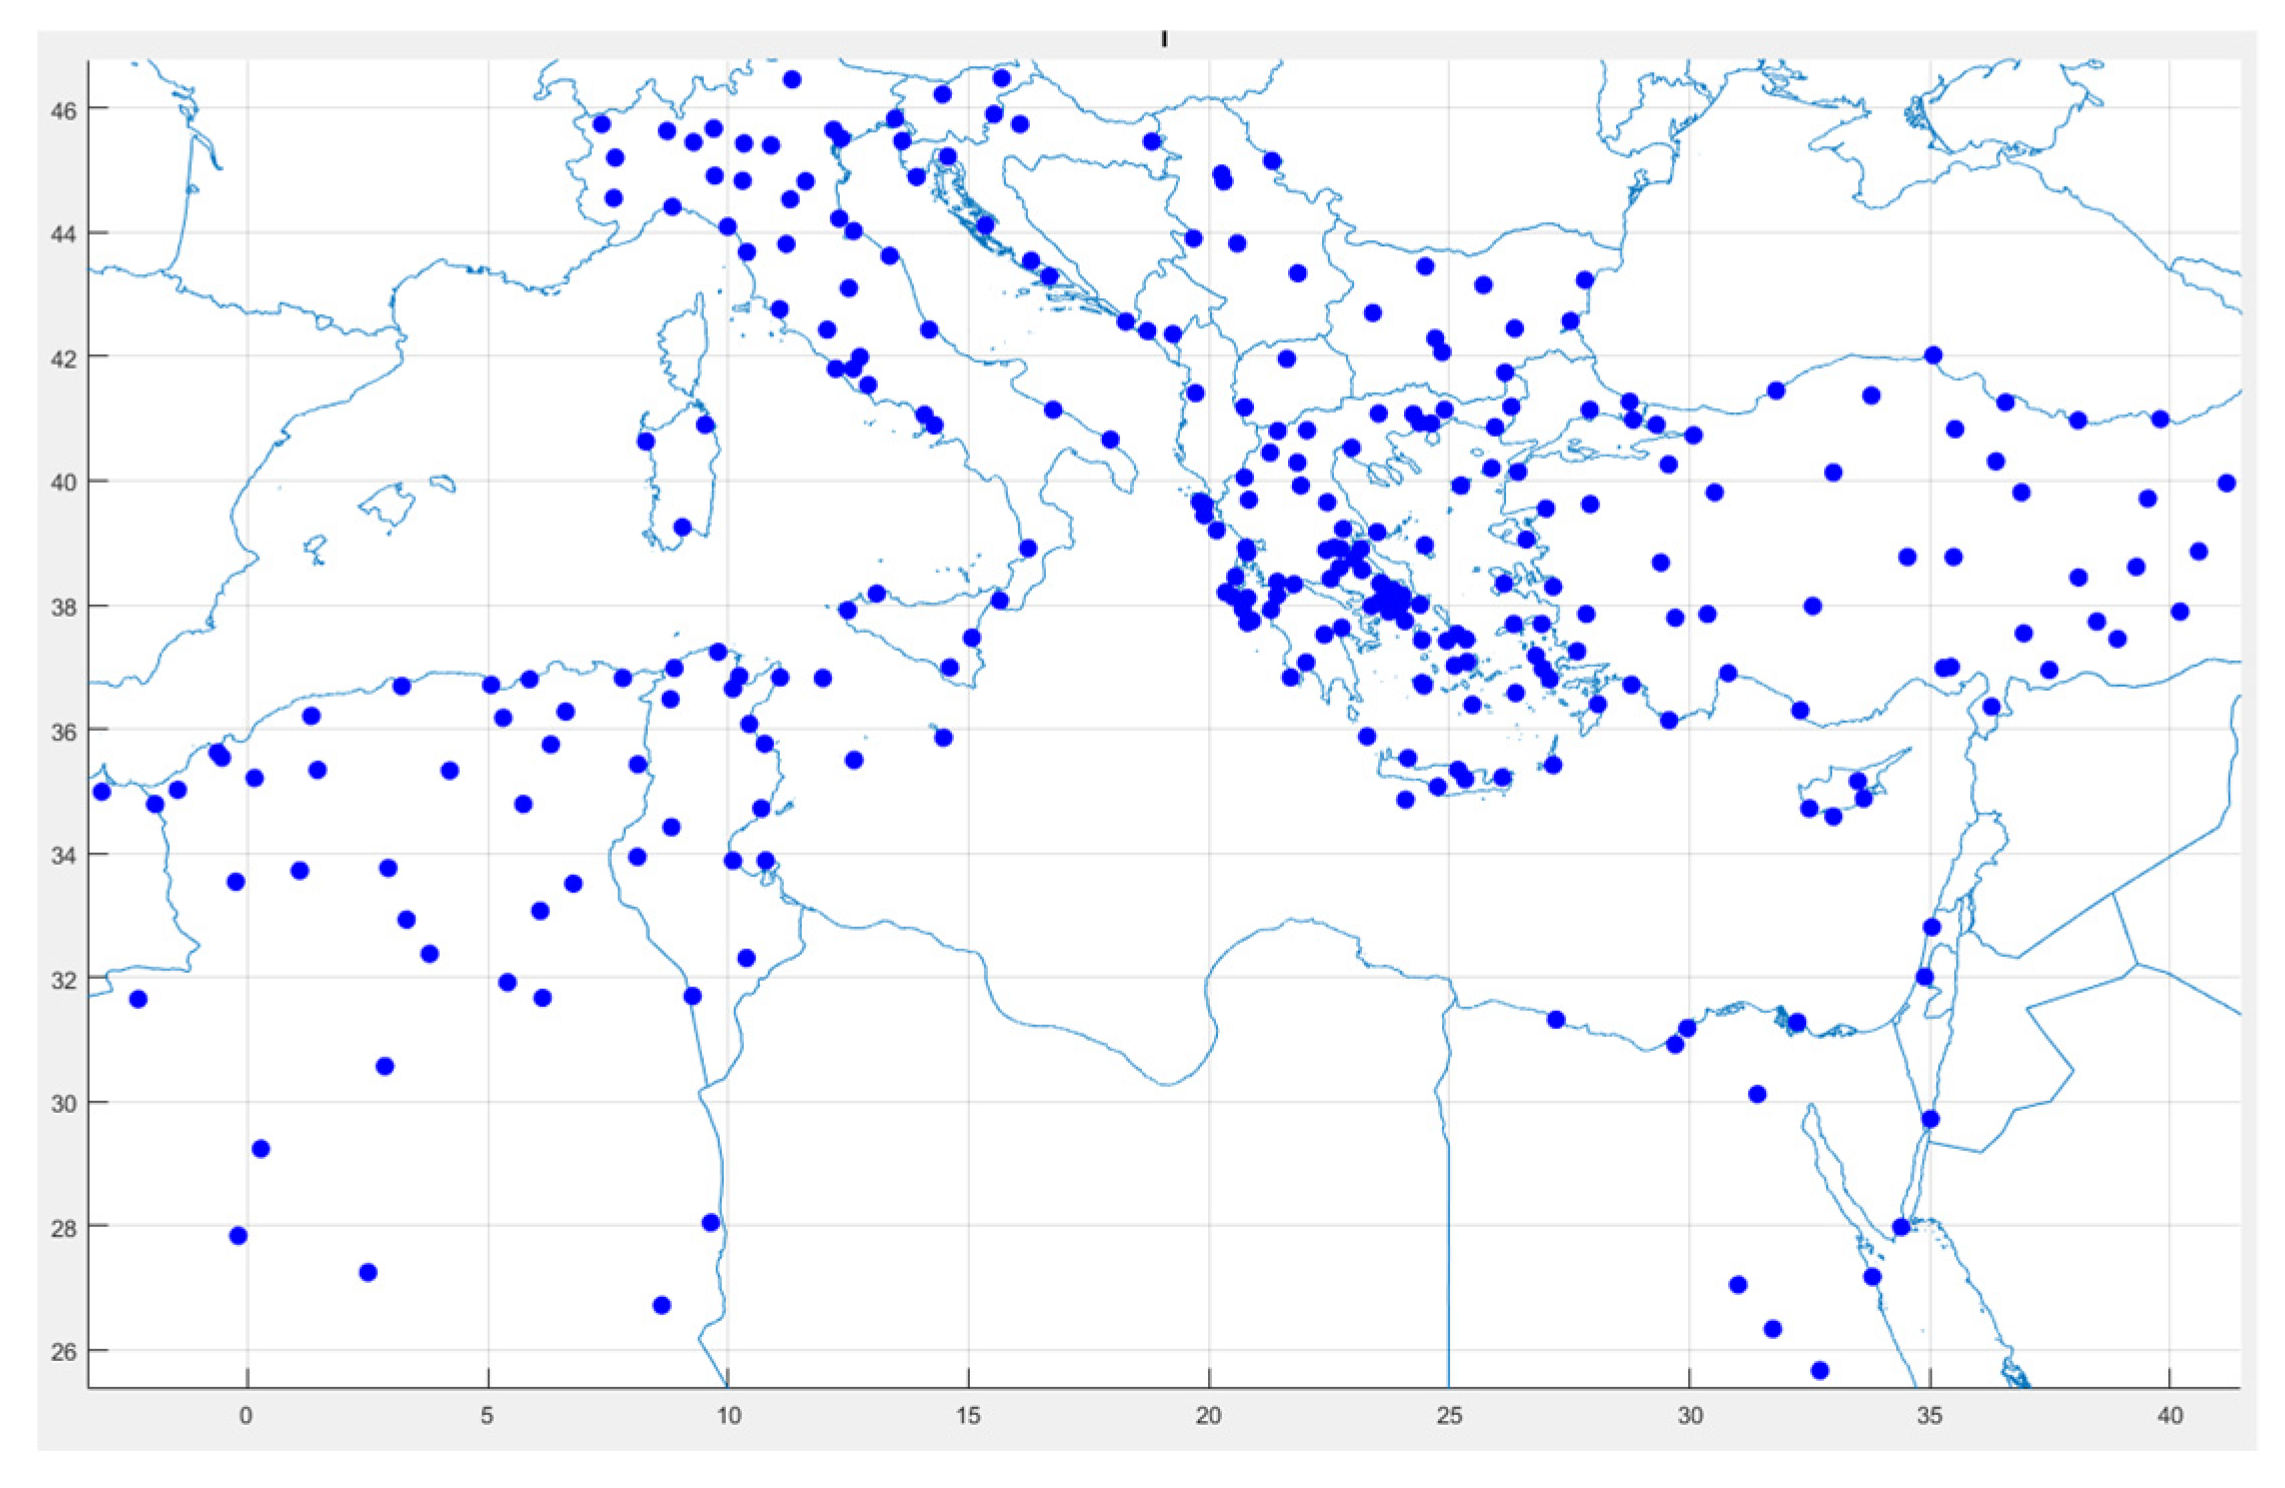
Figure 1. Observations used in the Mediterranean Area for Data Assimilation (blue points).
Environsciproc 26 00158 g001
Figure 2. Five eigenvectors of psi (stream function), chi−u (unbalanced part of velocity potential), t−u (unbalanced part temperature), and rh (relative humidity variables) for (a) BE1 and (b) BE2.
Environsciproc 26 00158 g002
Figure 3. Temperature values at lowest level of model at analysis time (06:00 UTC 17 September 2020): (a) Initial output values, (b) BE1-BE2, (c) Initial output values minus 12–24 (BE1), and (d) Initial output values minus 00–12 (BE2).
Environsciproc 26 00158 g003
Figure 4. Left: Track, Right: intensity (in terms of mean sea level pressure; MSLP in hPa) of medicane Ianos derived from ECMWF IFS analysis (red lines) and the BE1 simulation (black lines) and BE2 (blue lines) simulations.
Environsciproc 26 00158 g004
Disclaimer/Publisher’s Note: The statements, opinions and data contained in all publications are solely those of the individual author(s) and contributor(s) and not of MDPI and/or the editor(s). MDPI and/or the editor(s) disclaim responsibility for any injury to people or property resulting from any ideas, methods, instructions or products referred to in the content.