1. Introduction
Climate change is an undeniable challenge facing our world. The potential impacts of climate change can particularly affect vital sections of human life such as agricultural activities and thus threaten food security and economic growth. The southeastern Mediterranean is considered to be a potential climate change hot spot and may face severe impacts [
1]. Greece, a country of this region, which relies heavily on agricultural production, including viticulture, is expected to be affected by temperature and precipitation changes in the future. The cultivation of grapes is particularly sensitive to environmental changes. In this study, we focus on Stimagka, which is an area over southern Greece with extensive viticulture. We use it as a case study with which to showcase the potential impacts of climate change.
In order to assess the impact of climatic conditions on agriculture, we use agroclimatic indicators. Agroclimatic indicators are mathematical constructions that make use of various climatic and agricultural data. There are a wide variety of indicators describing different aspects of the connection between weather/climate and agricultural status and production. Agroclimatic indicators may vary considerably in complexity and also in the climatic variables used.
The most state of the art tools available with which to assess possible future changes in climate are climate models. Climate models are large collections of mathematical equations and numerically solved parameterizations that are intended to simulate climate. There are global climate models (GCMs) that cover the entire globe, albeit with usually coarse spatial resolution, and regional climate models (RCMs) that cover smaller areas with higher resolution. Simulations of the future climate are made under different scenarios of the possible evolution of anthropogenic greenhouse gas emissions, such as via representative concentration pathways (RCPs). Over Europe, the EURO-CORDEX initiative provides a framework with which to produce and improve regional climate simulations over the continent. A large number of future climate projections has been conducted under the EURO-CORDEX framework [
2], and it is made available through the ESGF portal [
3]. All EURO-CORDEX simulations undergo extensive quality checking and comply with a framework of simulations of the past climate and evaluations of historical observations before simulating the future. Moreover, model errors and shortcomings during each simulation are collected and published in order to provide the end user with a robust picture of model reliability.
In this study, we use climate projections from the EURO-CORDEX framework to calculate a variety of agroclimatic indicators over Stimagka.
2. Materials and Methods
The area of interest is located in southern Greece over the northern part of Peloponnisos and close to the village of Stimagka (37°56′ N 22°45′ E). It covers an area of around 30 km2 with a diversified geomorphology and a complex local climate affected by the nearby mountains, sea, and rivers. There are several farms in the area cultivating a variety of crops, with emphasis given to grape cultivation.
The indicators we used cover various aspects of the climate and its impact on agriculture and can be categorized into four broad categories: temperature-related, precipitation-related, drought-related, and animal-comfort-related. The temperature-related indicators specific to viticulture are as follows: biologically effective degree days (BEDD), Huglin index (HI), and cool night index (CI) [
4,
5].
The HI is based on heat summation. It is adjusted to give more weight to maximum temperature, and it also contains a correction according to the latitude of the area examined. The HI is calculated for the six-month period April–September. It is , where Tmean is the mean daily temperature and Tmax the maximum daily temperature, whereas K is a parameter that depends on the latitude.
The BEDD is also a formula of heat summation that is implemented between a lower temperature threshold of 10 °C and an upper threshold of 19 °C. Adjustments are related to latitude, as with the Huglin index, but those related to diurnal temperature range are considered. The BEDD is calculated for the seven month period April–October. It is , where Tmax is the maximum and Tmin is the minimum daily temperature, DTRadj a diurnal temperature range adjustment, and K is a parameter that depends on the latitude. It is important to note that the summation part in the above equation cannot take values larger than nine or smaller than zero.
The CI estimates the thermal conditions of nights during the maturation period of the vine. It is the minimum daily average air temperature (°C) of September. This index is associated with the potential color and aroma of grapes [
6].
The precipitation-related indicator is the heavy precipitation days; this is the annual number of days with daily precipitation ≥10 mm, and it provides information on crop damage and runoff losses.
The drought-related indicator is the standardized precipitation and evapotranspiration index (SPEI) [
7]. It uses the difference of precipitation minus potential evapotranspiration fitted to a theoretical distribution to assess the drought conditions over various time scales. It is a standardized indicator that can be calculated for various accumulation periods in order to capture the different types of droughts (meteorological, agricultural, hydrological). We use the 12-month SPEI to assess the long-term drought status over the region.
The animal comfort-related indicator is the temperature humidity index (THI). Its calculation is based on daily temperature and relative humidity. A threshold value of THI > 72 is regularly used to indicate heat stress to the animals [
8]. Alongside the projected change of THI values, we also calculate the future change in annual number of days with severe heat stress for animals (THI > 72).
The indicators are calculated for the period 1986–2055 based on an ensemble of state-of-the-art regional climate model simulations with a spatial resolution of 12 km. Two scenarios of greenhouse gas evolution are used for the period 2006–2055: the middle road rcp4.5 and the worst-case-scenario rcp8.5. We used an ensemble of 12 climate simulations conducted in the EURO-CORDEX framework from six different RCMs driven by five different GCMs (
Table 1) covering the period 1986–2055. The use of an ensemble enables an assessment of the uncertainty of climate simulations.
3. Results
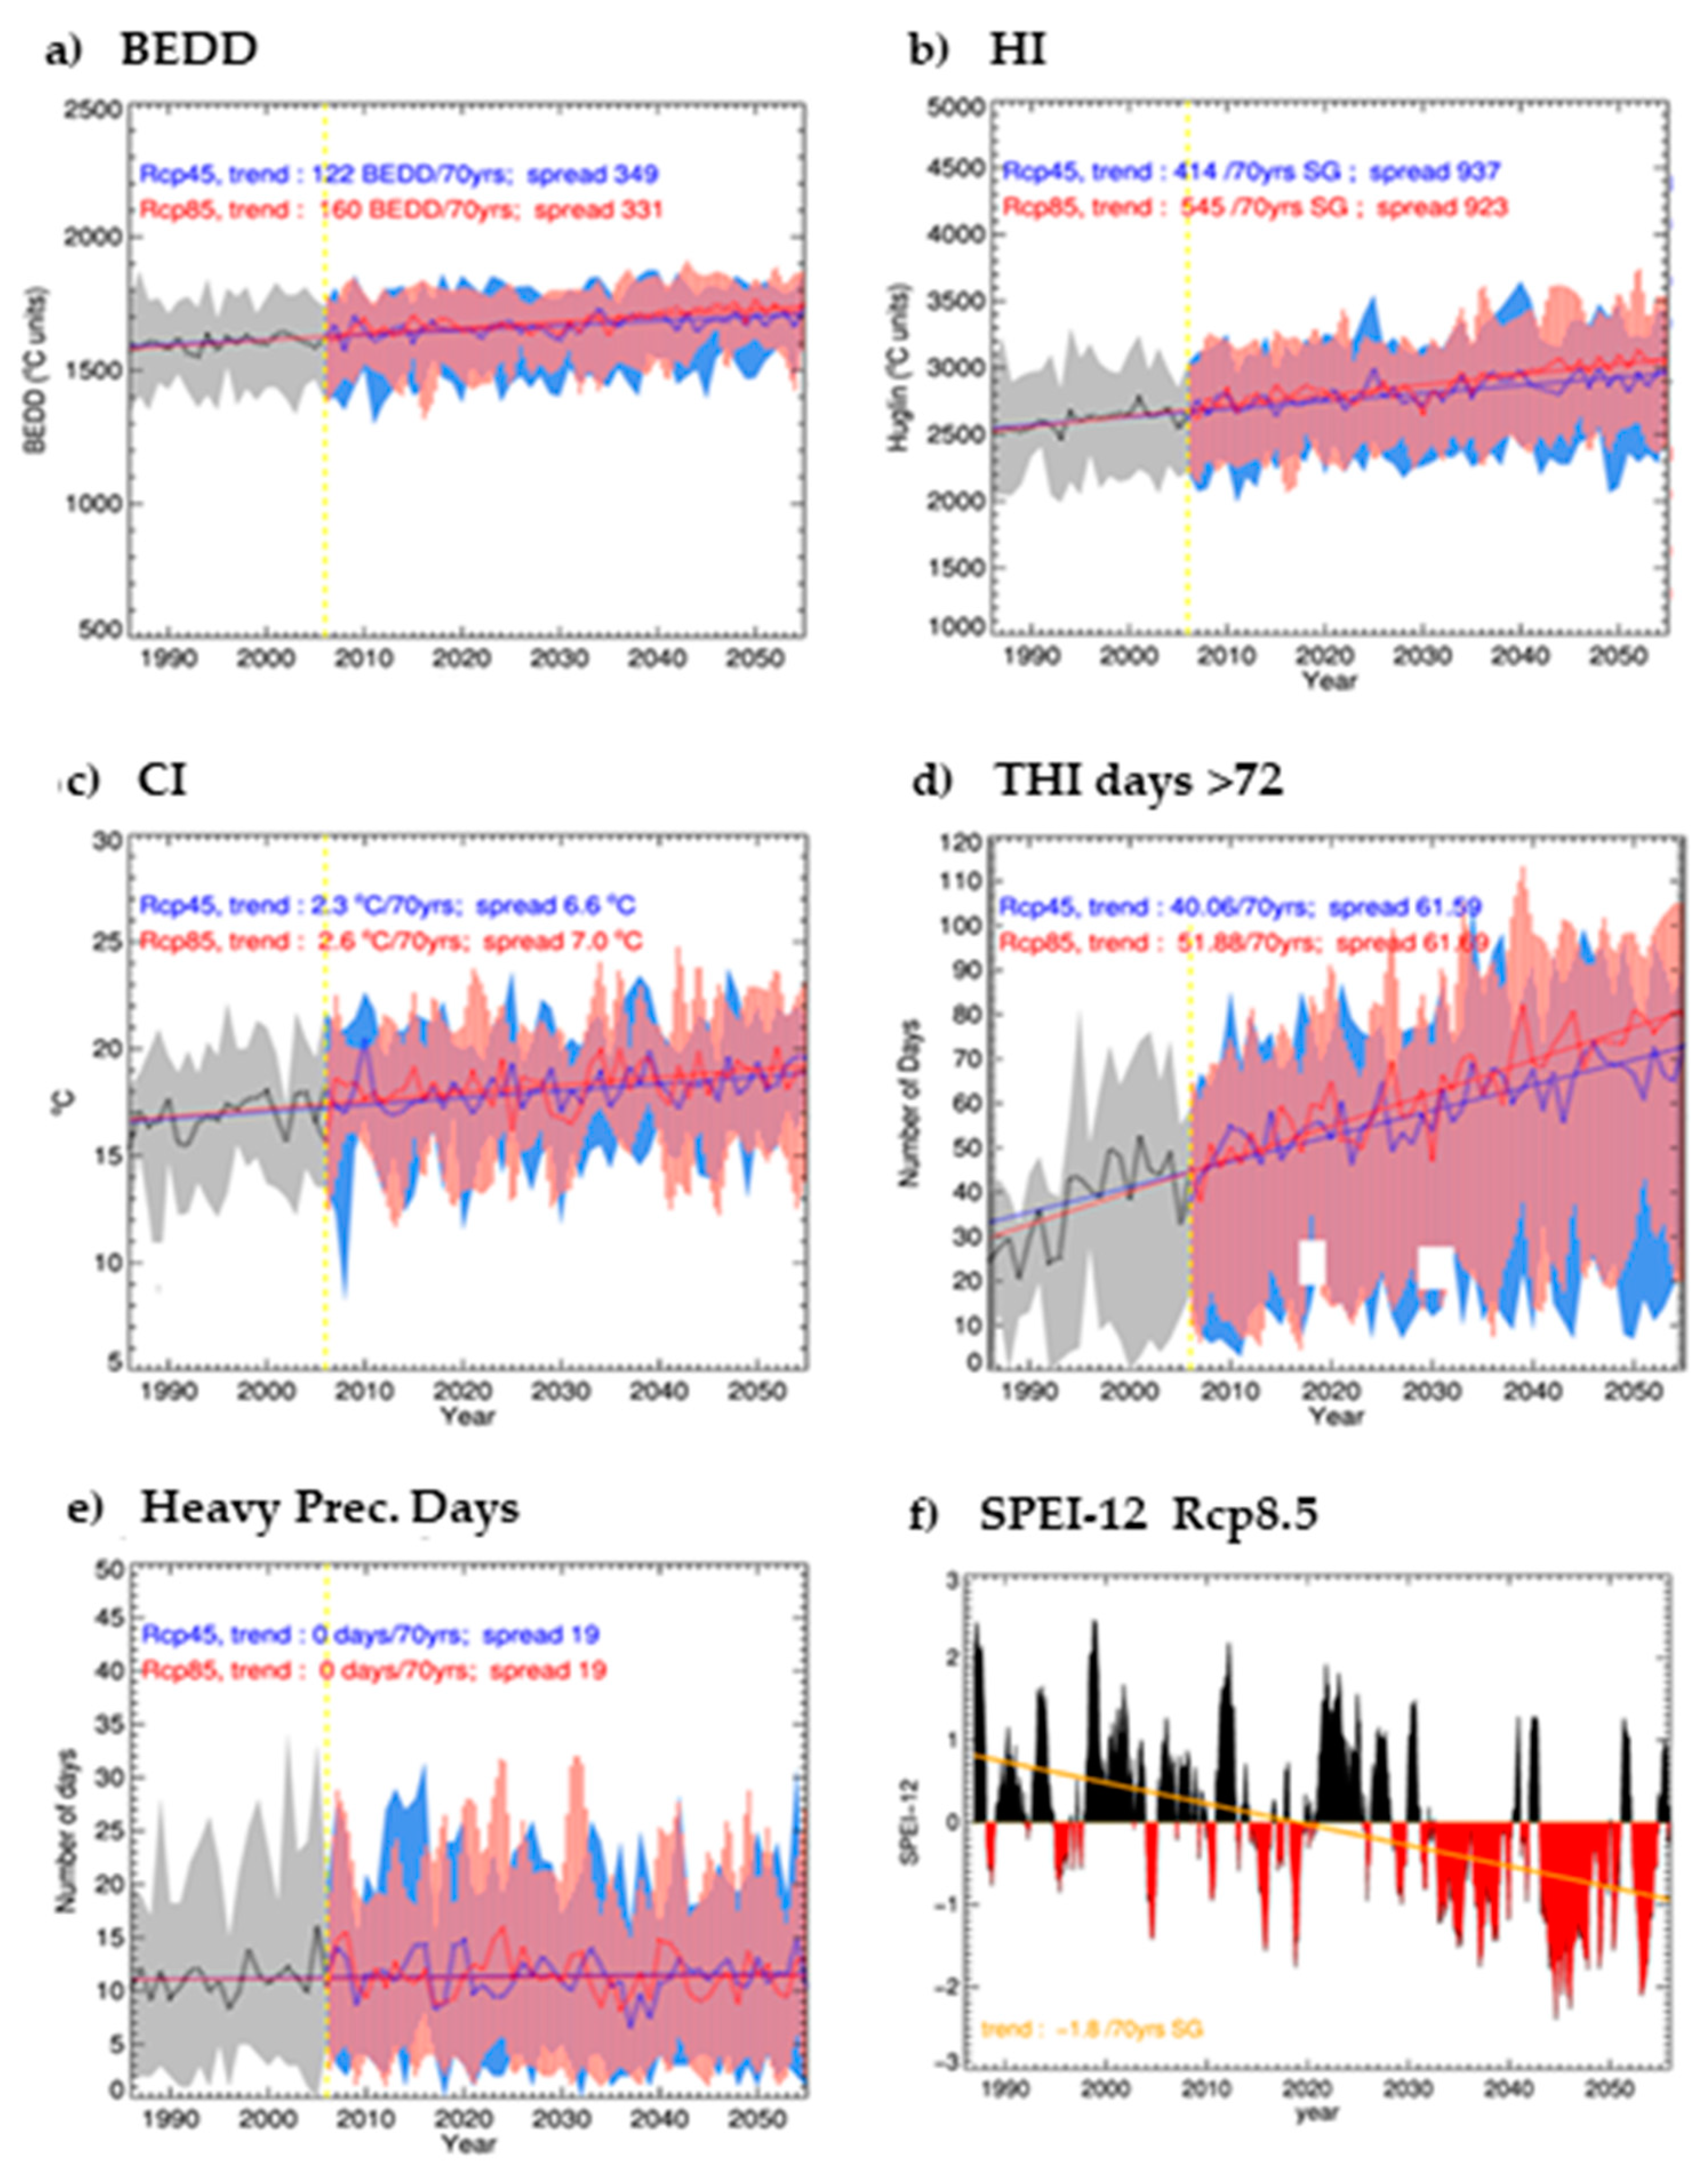
The impact of climate change is clear on Stimagka, with a strong temperature increase seen in both Rcp scenarios that is statistically significant. The estimated trend is quite strong: around 2 °C/70 yrs for Rcp4.5 and close to 2.5 °C/70 yrs for Rcp8.5 and for the ensemble mean. Trends can vary considerably between individual ensemble members, with some members presenting considerably stronger warming trends, surpassing 4 °C/70 yrs. This intense warming strongly affects the heat summation indicators BEDD and HI. It is characteristic that all individual simulations, not only the ensemble mean, present strong increasing trends that are of statistical significance for both BEDD and HI.
For BEDD (
Figure 1a), the trend of the ensemble mean is 122 BEDDs/70 yrs for Rcp4.5 and 160 BEDDs/70 yrs. This trend is strong and can lead the BEDD values to increase considerably in the future; for example, a BEDD of slightly less than 1600 in the beginning of the period is expected to increase around 1700 to 1750 until 2055, clearly elevating the BEDD values to at least one warmer class [
3,
5]. The range of the trend between individual simulations does vary somewhat. However, even if we consider the simulations with the most modest projected increase in temperature, an increase in BEDD close to 1700 is expected in the end of the examined period.
The evolution of the Huglin index presents a similar situation (
Figure 1b). A strong increasing trend is seen for the ensemble mean and all individual simulations. The ensemble mean trend is 414 °C units/70 yrs for Rcp4.5 and 545 °C units/70 yrs for Rcp8.5. This leads to a considerable increase even for the next couple decades. For example, for the period 1986–2005, the average Huglin index is 2606, while for the future period 2016–2035, it increases to 2793 (+7%) for Rcp4.5 and to 2812 (+8%) for Rcp8.5; thus, the HI state seems to elevate to a warmer status (HI > 2700) for the short-term future [
3,
5]. Further in the future, in the 2050s, values of HI greater than 3000 might become the norm, indicating a situation too hot for viticulture.
A clear increase is also seen in September night temperatures, as presented by the cool night index (
Figure 1c). The CI ensemble mean shows an increasing trend of 2.3 °C/70 yrs for Rcp4.5 and 2.6 °C/70 yrs for Rcp8.5. For the period 1986–2005, the average CI is 16.7 °C, indicating temperate night temperatures [
4]. However, for the future period 2016–2035, it already reaches the 18.0 °C threshold (+7%) for both Rcp scenarios, which designates warm nights. By the end of the 2050s, the CI is even expected to reach 19.0 °C, indicating that the warm night situation is clearly established. All the individual models present increasing trends in the CI, and for 10 out of 12 simulations, the trends are also statistically significant. The intensity of the trends for the individual simulations can vary considerably, ranging from 1 °C/70 yrs to almost 4 °C/70 yrs. However, even if the most constrained increase is considered, the CI will reach warm night status by the end of the 2050s.
Heavy precipitation (
Figure 1e) does not show any clear tendency in the future. The ensemble mean does not show any trends in either Rcp scenario, whereas the same is also true for half (7 out of 12) of the individual models. There are some ensemble members that show either increasing (three members) or decreasing (two members) trends that are of statistical significance, none of these, however, are sufficient to drastically change the number of heavy precipitation days in the future. Overall, this number is relatively small in the period 1986–2005, with the ensemble mean showing 11 days per year and no noticeable change in the future. The range, however, varies considerably between individual members, ranging for 3 days to up to 22 days per year for the historical period 1986–2005.
Drought, which is affected by both temperature and precipitation changes, is definitely expected to worsen in the future (
Figure 1f). Despite a considerable year-to-year variability, the overall SPEI status for the past period indicates normal to wet conditions, with the indicator having mainly positive values (black-colored areas). However, the indicator is moving towards drier conditions. The ensemble mean presents a trend of around −1.5/70 yrs for Rcp4.5 and −1.8/70 yrs for Rcp8.5. This trend is considerable, and by the 2030s, the SPEI-12 will have shifted towards negative values (red areas), presenting drier than normal conditions. It is characteristic that by the 2050s, the ensemble mean will have values close to −1, a threshold typically used to designate drought conditions. Thus, the infrequent drought events of the past are to become the norm in the not so far future. Moreover, all individual ensemble members present drying trends of varying magnitudes. Qualitatively, the results are very similar if we consider the SPEI for other accumulation periods such as the three-month SPEI (SPEI-3). Future increase in drought conditions in the Mediterranean regions are also expected by other RCM studies [
9].
Conditions regarding animal comfort are expected to become more challenging in the future (
Figure 1d). Regarding the annual average THI, all ensemble members present increasing and statistically significant trends that are mild in magnitude; thus, the average annual comfort level increases but does not change considerably in the future. However, there will be a huge increase in the number of days per year with considerable heat stress to animals. These will be the days where the THI surpasses the threshold of 72. For both Rcp scenarios, the number of heat stress days per year is around 30–35 in the early 1990s, based on the ensemble mean. These numbers are literally expected to double by the 2050s, becoming around 70 for Rcp4.5 and close to 80 for Rcp8.5. Finally, even though individual ensemble members vary significantly in the number of simulated heat stress days per year for the past and present period, they all tend to strongly increase these numbers by the end of the future period.
A recent study over Greece [
10] using station data and the RegCM4 climate model also presents a clear and significant shift towards warmer and drier conditions over the entire country in the future. For example, in that study, for most of the locations examined, the CI index increases its classification from “temperate” to “warm” night status in the future period 2021–2050 compared to a baseline period 1981–2010. Similarly, the BEDD and HI indices all increase in the future 2021–2050 period compared to the baseline, with the HI shifting from a “warm” or “warm–temperate” classification to a “very warm” or even “too hot” classification for the period 2021–2050. These results are similar to our study and showcase the difficulties that agricultural production and especially viticulture may face in the future.


