Abstract
This work explores the impact of thermal stress on natural-cause mortality in the nine Office of National Statistics regions of England using the thermal index Apparent Temperature as the exposure indicator. A standard time-series Poisson regression analysis for over-dispersed data was used, along with distributed lag non-linear models, setting a lag period of 21 days to account for the delayed effects of temperature. Regional differences in the exposure–response relationships were revealed. On the whole, the results demonstrated that the population in England is more vulnerable to cold effects and highlighted the dominant health impact of moderately low temperatures.
1. Introduction
A large part of the international literature [1,2,3,4,5,6,7] has associated exposure to both high and low temperatures with mortality and/or morbidity from several causes. However, except for air temperature, other meteorological variables including relative humidity and wind speed are known to affect thermal comfort. For this reason, some studies use thermal indices to thoroughly explore the impact of thermal stress on public health, e.g., [5]. This work uses Apparent Temperature (AT) as the exposure variable and aims to investigate the relationship between thermal stress and mortality from natural causes in England, where cold-related health outcomes are common [1,2,3]. On the grounds that local demographic and socioeconomic characteristics, along with other factors including housing and urban landscape, are likely to affect temperature-related mortality [2,6,8], in this study we examined the exposure–response relationship in the nine official Office of National Statistics (ONS) regions of England.
2. Materials and Methods
2.1. Study Area and Data Resources
England is the largest country of the United Kingdom, with a total population of approximately 56 million people. The country is divided into nine regions, namely Greater London, Yorkshire and The Humber, West Midlands, East Midlands, North East, North West, South East, South West, and East of England. According to the census of 2021, Greater London, followed by the North West, is the most densely populated region, while the region with the highest rate of elderly population (≥65 years old) is the South West (www.ons.gov.uk). The climate in England is temperate oceanic, characterized by cool summers and mild, wet winters. Westerly winds dominate and thus the regional climate across the country varies depending on topography and distance from the Atlantic Ocean. In general, the north and west regions tend to present the lowest average temperatures and the highest levels of rainfall, while the south coastal regions have the highest average annual sunshine duration.
For this study, daily counts of natural mortality per region were obtained from the Office of National Statistics for the period 1981 to 2015. For the same time period, mean daily values of temperature, relative humidity and wind speed per region were estimated from hourly data obtained from six meteorological stations of the network of the United Kingdom’s Meteorological Service, to ensure that the meteorological data adequately represent each region.
2.2. Apparent Temperature
AT is a broadly used thermal index introduced by Steadman in 1979 to assess indoor thermal comfort. In the following years, AT was modified in order to be applicable in outdoor environments [9]. The mean daily AT per region was estimated by the following equation:
where Τ, ws and RH stand for the mean daily values of air temperature (°C), wind speed at the height of 10 m (m/s) and relative humidity (%), respectively.
AT = T + 0.33 × RH × 0.01 × 6.112 × 10^((7.5 × T)/(237.7 + T)) − 0.7 × ws − 4
2.3. Statistical Analysis
The relationship between thermal stress and natural-cause mortality per region was described with a standard time-series Poisson regression model for over-dispersed data combined with a distributed lag non-linear model (DLNM) with a lag period of 21 days (to account for the delayed and non-linear effects of temperature on mortality) [10]. Consistent with previous studies [1,4,7], the exposure–response association was modeled using a natural cubic spline with 3 internal knots placed at the 10th, the 75th, and the 90th percentile of the region-specific AT distributions, and the lagged response was modeled using a natural cubic spline with 3 internal knots placed at equally spaced values in the log scale. Τhe long-term trends and seasonality were controlled by a natural cubic spline for time with 8 degrees of freedom per year and categorical variables for weekdays and holidays.
Firstly, the so-called Minimum Mortality Apparent Temperature (MMAT) was defined per region. Then, using the region-specific MMAT as reference value, the relative risks of mortality were calculated for both extreme and moderate thermal exposure, defined at the 1st (extreme cold), 10th (moderate cold), 90th (moderate heat) and 99th (extreme heat) percentile of the region-specific AT distribution. Finally, the fractions of mortality attributed to moderate cold (temperatures between MMAT and the 1st percentile), extreme cold (temperatures lower than the 1st percentile), extreme heat (temperatures higher than the 99th percentile) and moderate heat (temperatures between MMAT and the 99th percentile) were estimated using the backward estimation approach [1,4,7].
3. Results and Discussion
In the period 1981–2015, the average daily air temperature ranged between 8.68 °C (SD: 4.54 °C) and 11.2 °C (SD: 5.55 °C) and the average daily AT ranged between 4.71 °C (SD: 5.97 °C) and 8.14 °C (SD: 6.77 °C), with the lowest and highest values recorded in the North East and Greater London, respectively. On the whole, a total of 17,140,715 deaths from natural causes were recorded in England. The average mortality count ranged from 77.86 (SD: 14.3) in the North East to 212.13 (SD: 31.9) in the South East, while Greater London had the lowest annual counts of deaths per 100,000 population after 1989.
In accordance with previous studies [1,2,4,5,6,7], in all regions, the exposure–response relationship between AT and mortality was non-linear and formed a “U”- or reversed “J”-shaped curve (not shown). Exploring the risk of mortality for different lags demonstrated, like elsewhere [4,5,6,7], that high temperatures had an immediate impact on mortality, while the cold-related effects were delayed and more persistent. The relative risk of mortality due to extreme heat (99th percentile) peaked on the day of exposure (lag 0) and almost disappeared afterwards, while the risk due to extreme cold (1st percentile) peaked on the 2nd or 3rd day after exposure (lag 2 or lag 3) and remained for the entire period of 21 days (Figure 1). In some cases, in line with other epidemiological studies [4,5,6,7], a displacement of mortality under extreme heat was observed between the 1st and the 6th day after exposure, indicating the premature mortality of the vulnerable population.
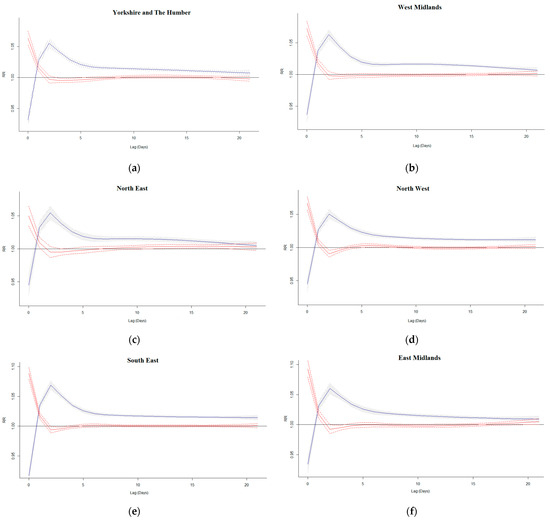
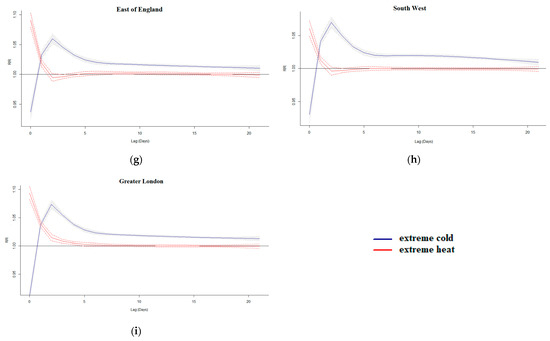
Figure 1.
Lag-response curves for exposure to extreme cold and heat in Yorkshire and The Humber (a), West Midlands (b), North East (c), North West (d), South East (e), East Midlands (f), East of England (g), South West (h), and Greater London (i).
As shown in Table 1, MMATs were defined between the 90th and the 93th percentile of the local AT distribution, with the maximum and minimum values observed in Greater London (17.2 °C) and the North East (14.5 °C). Overall, MMATs demonstrated an increasing pattern from the north to the south and from the west to the east, which is consistent with the observations of a recent study [2] on the impact of ambient air temperature on all-cause mortality across small regions of England and Wales. In the aforementioned study, the researchers defined slightly higher, although comparable, values for minimum mortality temperature, corresponding to the 95th percentile on average. According to the international literature [2,6], the minimum mortality temperature varies with the type of death studied, the population group and the region under study, and generally exhibits a declining trend with latitude, indicating the adaptation of populations to local climates.

Table 1.
Minimum Mortality Apparent Temperature (MMAT) and cumulative relative risks of mortality from natural causes in the nine regions of England between 1981 and 2015.
Table 1 also presents the cumulative relative risks (RRs) of mortality under extreme and moderate thermal conditions. The term “cumulative” indicates that AT was considered steady throughout the entire lag period of 21 days examined. According to the table, the highest risks were estimated for exposure to extreme cold followed by moderate cold, confirming previous findings [1,2,3] of increased susceptibility of the population of England to cold weather. In all cases, although non-negligible, the RRs under extreme heat were significantly lower than those associated with extreme or moderately low temperatures. On the other hand, moderately high temperatures defined close to the region-specific MMAT were not found to pose a threat to the population of England.
On average, almost 10% of mortality from natural causes was attributed to non-optimum temperatures (Figure 2). As Figure 2 illustrates, in all cases, moderately low temperatures were responsible for the majority of temperature-related deaths, consistent with previous studies [1,4,5,7]. This is not surprising, as extreme temperatures rarely occur, hence their negligible health impact. Moreover, it could be argued that people tend to be more cautious during extreme thermal conditions, perceiving them as more dangerous.
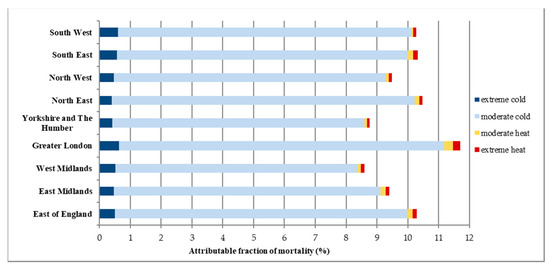
Figure 2.
The fraction of mortality from natural causes attributed to extreme and moderate thermal conditions in the nine regions of England between 1981 and 2015.
Comparing the results of the nine regions under study revealed that the population of the South and the East was more prone to the impact of thermal stress, with the highest vulnerability observed for the population of Greater London (Table 1, Figure 1 and Figure 2). The lower sensitivity to low temperatures in relatively cold regions, which is in line with findings from the international literature [1,6,8], suggests that the population has been partially acclimated through physiological and behavioral mechanisms. However, this pattern was not observed in the southern regions, which were found to be more afflicted by high temperatures. Although the investigation of the factors affecting the impact of thermal stress on mortality is beyond the scope of this work, it should be noted that variations in results among the regions under study could be attributed to demographic and socioeconomic factors, as well as landscape and urban characteristics [2,6,8].
4. Conclusions
This work confirmed the increased vulnerability of the population in England to cold weather conditions and highlighted the impact of moderately low temperatures. On the whole, the South and the East were found to be more vulnerable to thermal stress, with the highest impact on mortality observed in Greater London. These findings could be used by local authorities to improve alerting and prevention strategies against both cold- and heat-related health effects. Further research should consider different age groups and confounding factors such as air pollution.
Author Contributions
Conceptualization, A.K.P.; methodology, K.P.; formal analysis, K.P.; writing—original draft preparation, K.P.; writing—review and editing, A.K.P.; visualization, K.P.; supervision, A.K.P. All authors have read and agreed to the published version of the manuscript.
Funding
This research received no external funding.
Institutional Review Board Statement
Not applicable.
Informed Consent Statement
Not applicable.
Data Availability Statement
The authors do not have permission to share the data.
Acknowledgments
The authors would like to acknowledge the UK Office for National Statistics for providing the mortality data and the UK Meteorological Office (UKMO) for providing the meteorological data through the UK Centre for Environmental Data Analysis.
Conflicts of Interest
The authors declare no conflict of interest.
References
- Gasparrini, A.; Guo, Y.; Hashizume, M.; Kinney, P.L.; Petkova, E.P.; Lavigne, E.; Zanobetti, A.; Schwartz, J.D.; Tobias, A.; Leone, M.; et al. Temporal Variation in Heat–Mortality Associations: A Multicountry Study. Environ. Health Perspect. 2015, 123, 1200–1207. [Google Scholar] [CrossRef] [PubMed]
- Gasparrini, A.; Masselot, P.; Scortichini, M.; Schneider, R.; Mistry, M.N.; Sera, F.; Macintyre, H.L.; Phalkey, R.; Vicedo-Cabrera, A.M. Small-Area Assessment of Temperature-Related Mortality Risks in England and Wales: A Case Time Series Analysis. Lancet Planet. Health 2022, 6, e557–e564. [Google Scholar] [CrossRef]
- Hajat, S. Health Effects of Milder Winters: A Review of Evidence from the United Kingdom. Environ. Health 2017, 16, 109. [Google Scholar] [CrossRef]
- Psistaki, K.; Dokas, I.M.; Paschalidou, A.K. The Impact of Ambient Temperature on Cardiorespiratory Mortality in Northern Greece. Int. J. Environ. Res. Public Health 2022, 20, 555. [Google Scholar] [CrossRef]
- Psistaki, K.; Dokas, I.; Paschalidou, A. Analysis of the heat- and cold-related cardiovascular mortality in an urban Mediterranean environment through various thermal indices. Environ. Res. 2023, 216, 114831. [Google Scholar] [CrossRef]
- Silveira, I.H.; Oliveira, B.F.A.; Cortes, T.R.; Junger, W.L. The Effect of Ambient Temperature on Cardiovascular Mortality in 27 Brazilian Cities. Sci. Total. Environ. 2019, 691, 996–1004. [Google Scholar] [CrossRef] [PubMed]
- Fu, S.H.; Gasparrini, A.; Rodriguez, P.S.; Jha, P. Mortality Attributable to Hot and Cold Ambient Temperatures in India: A Nationally Representative Case-Crossover Study. PLoS Med. 2018, 15, e1002619. [Google Scholar] [CrossRef]
- Son, J.-Y.; Liu, J.C.; Bell, M.L. Temperature-Related Mortality: A Systematic Review and Investigation of Effect Modifiers. Environ. Res. Lett. 2019, 14, 073004. [Google Scholar] [CrossRef]
- Steadman, R.G. A Universal Scale of Apparent Temperature. J. Appl. Meteorol. Climatol. 1984, 23, 1674–1687. [Google Scholar] [CrossRef]
- Gasparrini, A.; Armstrong, B.; Kenward, M.G. Distributed Lag Non-Linear Models. Statist. Med. 2010, 29, 2224–2234. [Google Scholar] [CrossRef]
Disclaimer/Publisher’s Note: The statements, opinions and data contained in all publications are solely those of the individual author(s) and contributor(s) and not of MDPI and/or the editor(s). MDPI and/or the editor(s) disclaim responsibility for any injury to people or property resulting from any ideas, methods, instructions or products referred to in the content. |
© 2023 by the authors. Licensee MDPI, Basel, Switzerland. This article is an open access article distributed under the terms and conditions of the Creative Commons Attribution (CC BY) license (https://creativecommons.org/licenses/by/4.0/).