Next Article in Journal
Source Apportionment of the Atmospheric Aerosol in Western Macedonia, GREECE, Part 1: Concentrations of Metallic Components, Major Ions, and PAHs in PM10 Samples
Previous Article in Journal
Impact of Aerosol Optical Properties, Precipitable Water, and Solar Geometry on Sky Radiances Using Radiative Transfer Modeling
 
 
Please note that, as of 4 December 2024, Environmental Sciences Proceedings has been renamed to Environmental and Earth Sciences Proceedings and is now published here.
Proceeding Paper

The Influence of Meteorological Parameters on PM2.5 Concentrations on the Aegean Islands †

by
Kyriaki-Maria Fameli
1,*,
Anna-Maria Kotrikla
1,
Panayiotis Kalkavouras
2 and
Amalia Polydoropoulou
1
1
Department of Shipping, Trade and Transport, University of the Aegean, 82132 Chios, Greece
2
Institute for Environmental Research and Sustainable Development, National Observatory of Athens, 15236 Athens, Greece
*
Author to whom correspondence should be addressed.
Presented at the 16th International Conference on Meteorology, Climatology and Atmospheric Physics—COMECAP 2023, Athens, Greece, 25–29 September 2023.
Environ. Sci. Proc. 2023, 26(1), 125; https://doi.org/10.3390/environsciproc2023026125
Published: 29 August 2023

Abstract

:
A network of low-cost sensors operates at six islands in the Aegean Sea (Lemnos, Lesvos, Chios, Samos, Syros and Rhodes) providing real-time PM2.5 concentrations to the public. In the present study, the effect of the prevailing meteorological conditions on the local air quality was examined. For this reason, data about wind direction, dry and wet temperature, wind speed and sunlight were provided by the Hellenic National Meteorological Service for the period from January to September 2022. The analysis of the hourly PM2.5 concentrations revealed different air quality patterns on each island, as well as seasonal changes for the same islands (e.g., higher concentrations in Samos during the cold period). Temperature was found to contribute significantly to the PM2.5 measurements since it affects the anthropogenic activities related to emissions. For instance, higher temperatures in winter result in limited residential heating needs.

1. Introduction

Air quality remains among the most crucial issues since it affects human health and the environment [1]. Despite the measures taken, exceedances of the EU standards about pollutants’ concentrations are still recorded in many European cities. Air quality is affected by the dispersion of pollutants emitted by local anthropogenic activities (traffic, residential heating, port activities, industry) and natural sources. The prevailing meteorological conditions play an important role in the formation and distribution of the different pollutants [2]. Many cities with similar population densities and emission sources can have totally different environmental problems due to the existence of different meteorological conditions [3,4]. For instance, extreme ozone pollution episodes are usually recorded in the Mediterranean during summer due to sunlight and low wind speeds [5], as well as tropopause folds and stratosphere-to-troposphere transport [6]. However, many areas suffer from particulate pollution in wintertime because of the burning of biomass in combination with a low boundary layer (PBL) that prevents the dispersion of particulates [7,8]. Moreover, under favorable meteorological conditions, air masses can be transported from areas characterized by increased pollutants concentrations to nearby small towns [9]. Thus, the study of the correlation of the prevailing meteorological parameters with the measuring concentrations is of great importance.
Temperature and wind profiles, extreme wind speed, sunlight and humidity are among the meteorological parameters that contribute to formation of the measured pollutants’ concentrations [10]. In the present study, a statistical approach was followed to understand the impact of meteorology on the local air quality. The area of interest comprises six islands in the Central (Syros) and East Aegean Sea (Chios, Lemnos, Lesvos, Rhodes and Samos) on which a network of seven PurpleAir sensors has been established.

2. Materials and Methods

In this research, PM2.5 hourly concentrations were measured by low-cost Purpleair sensors located at six islands in the Aegean Sea (Figure 1). On Chios Island, two sensors were established at an urban and a suburban area of Chios City to further study the differences in the air quality at two areas characterized by different population densities and local sources. The Chios_urban sensor is located closer to the port area. Measurements were corrected based on the below equation:
PM2.5, corr = 11.051 + 0.423 ∗ PMpurpleair − 0.117 ∗ RH,
where PMpurpleair is the average PM2.5 concentration measured by the two channels, A and B, of the sensor and RH is the relative humidity.
For the correlation of the meteorological parameters with the particulate measurements, wind speed and direction, dry and wet temperature data were provided upon request by the Hellenic National Meteorological Service (www.emy.gr). Both time series (concentrations and meteorological data) cover the January–14 September 2022 period.

3. Results and Discussion

Summary statistics for several meteorological parameters, as well as PM2.5 concentrations, are presented in Table 1. The mean dry temperature ranges from 17.1 °C (Samos) to 20.1 °C (Rhodes), while the maximum wind speeds are recorded in Syros. Northern winds prevail in Chios, Lemnos, Samos and Syros, while multiple wind directions are recorded in Lesvos and Rhodes. It is obvious that the lowest concentrations are measured on Syros Island (mean value: 8.5 μg/m3). This is because it is an area of small population density, so the emissions from anthropogenic activities are low. In summer, even though the population increases due to tourism, the prevailing northern strong winds (called Etesians) disperse the pollutants. However, the Etesian winds can also negatively affect the local air quality by transporting polluted air masses from nearby large cities located in Eurasia (Istanbul, Black Sea) [11,12]. Lesvos (the city of Mytilene in particular, where the PurpleAir sensor is established) appears to be the most polluted area among the six islands (mean annual PM2.5 concentration: 14.3 μg/m3). In general, for all islands, mean annual PM2.5 concentrations are below the limit value set by the EU Air Quality Directives (25 μg/m3) but are higher than the 5 μg/m3 mean annual value proposed by the WHO Air Quality Guidelines. They are also lower than the ones measured in other urban areas in Greece (Athens [13], Thessaloniki [14], Patras [15]).

3.1. PM2.5 Concentrations and Temperature

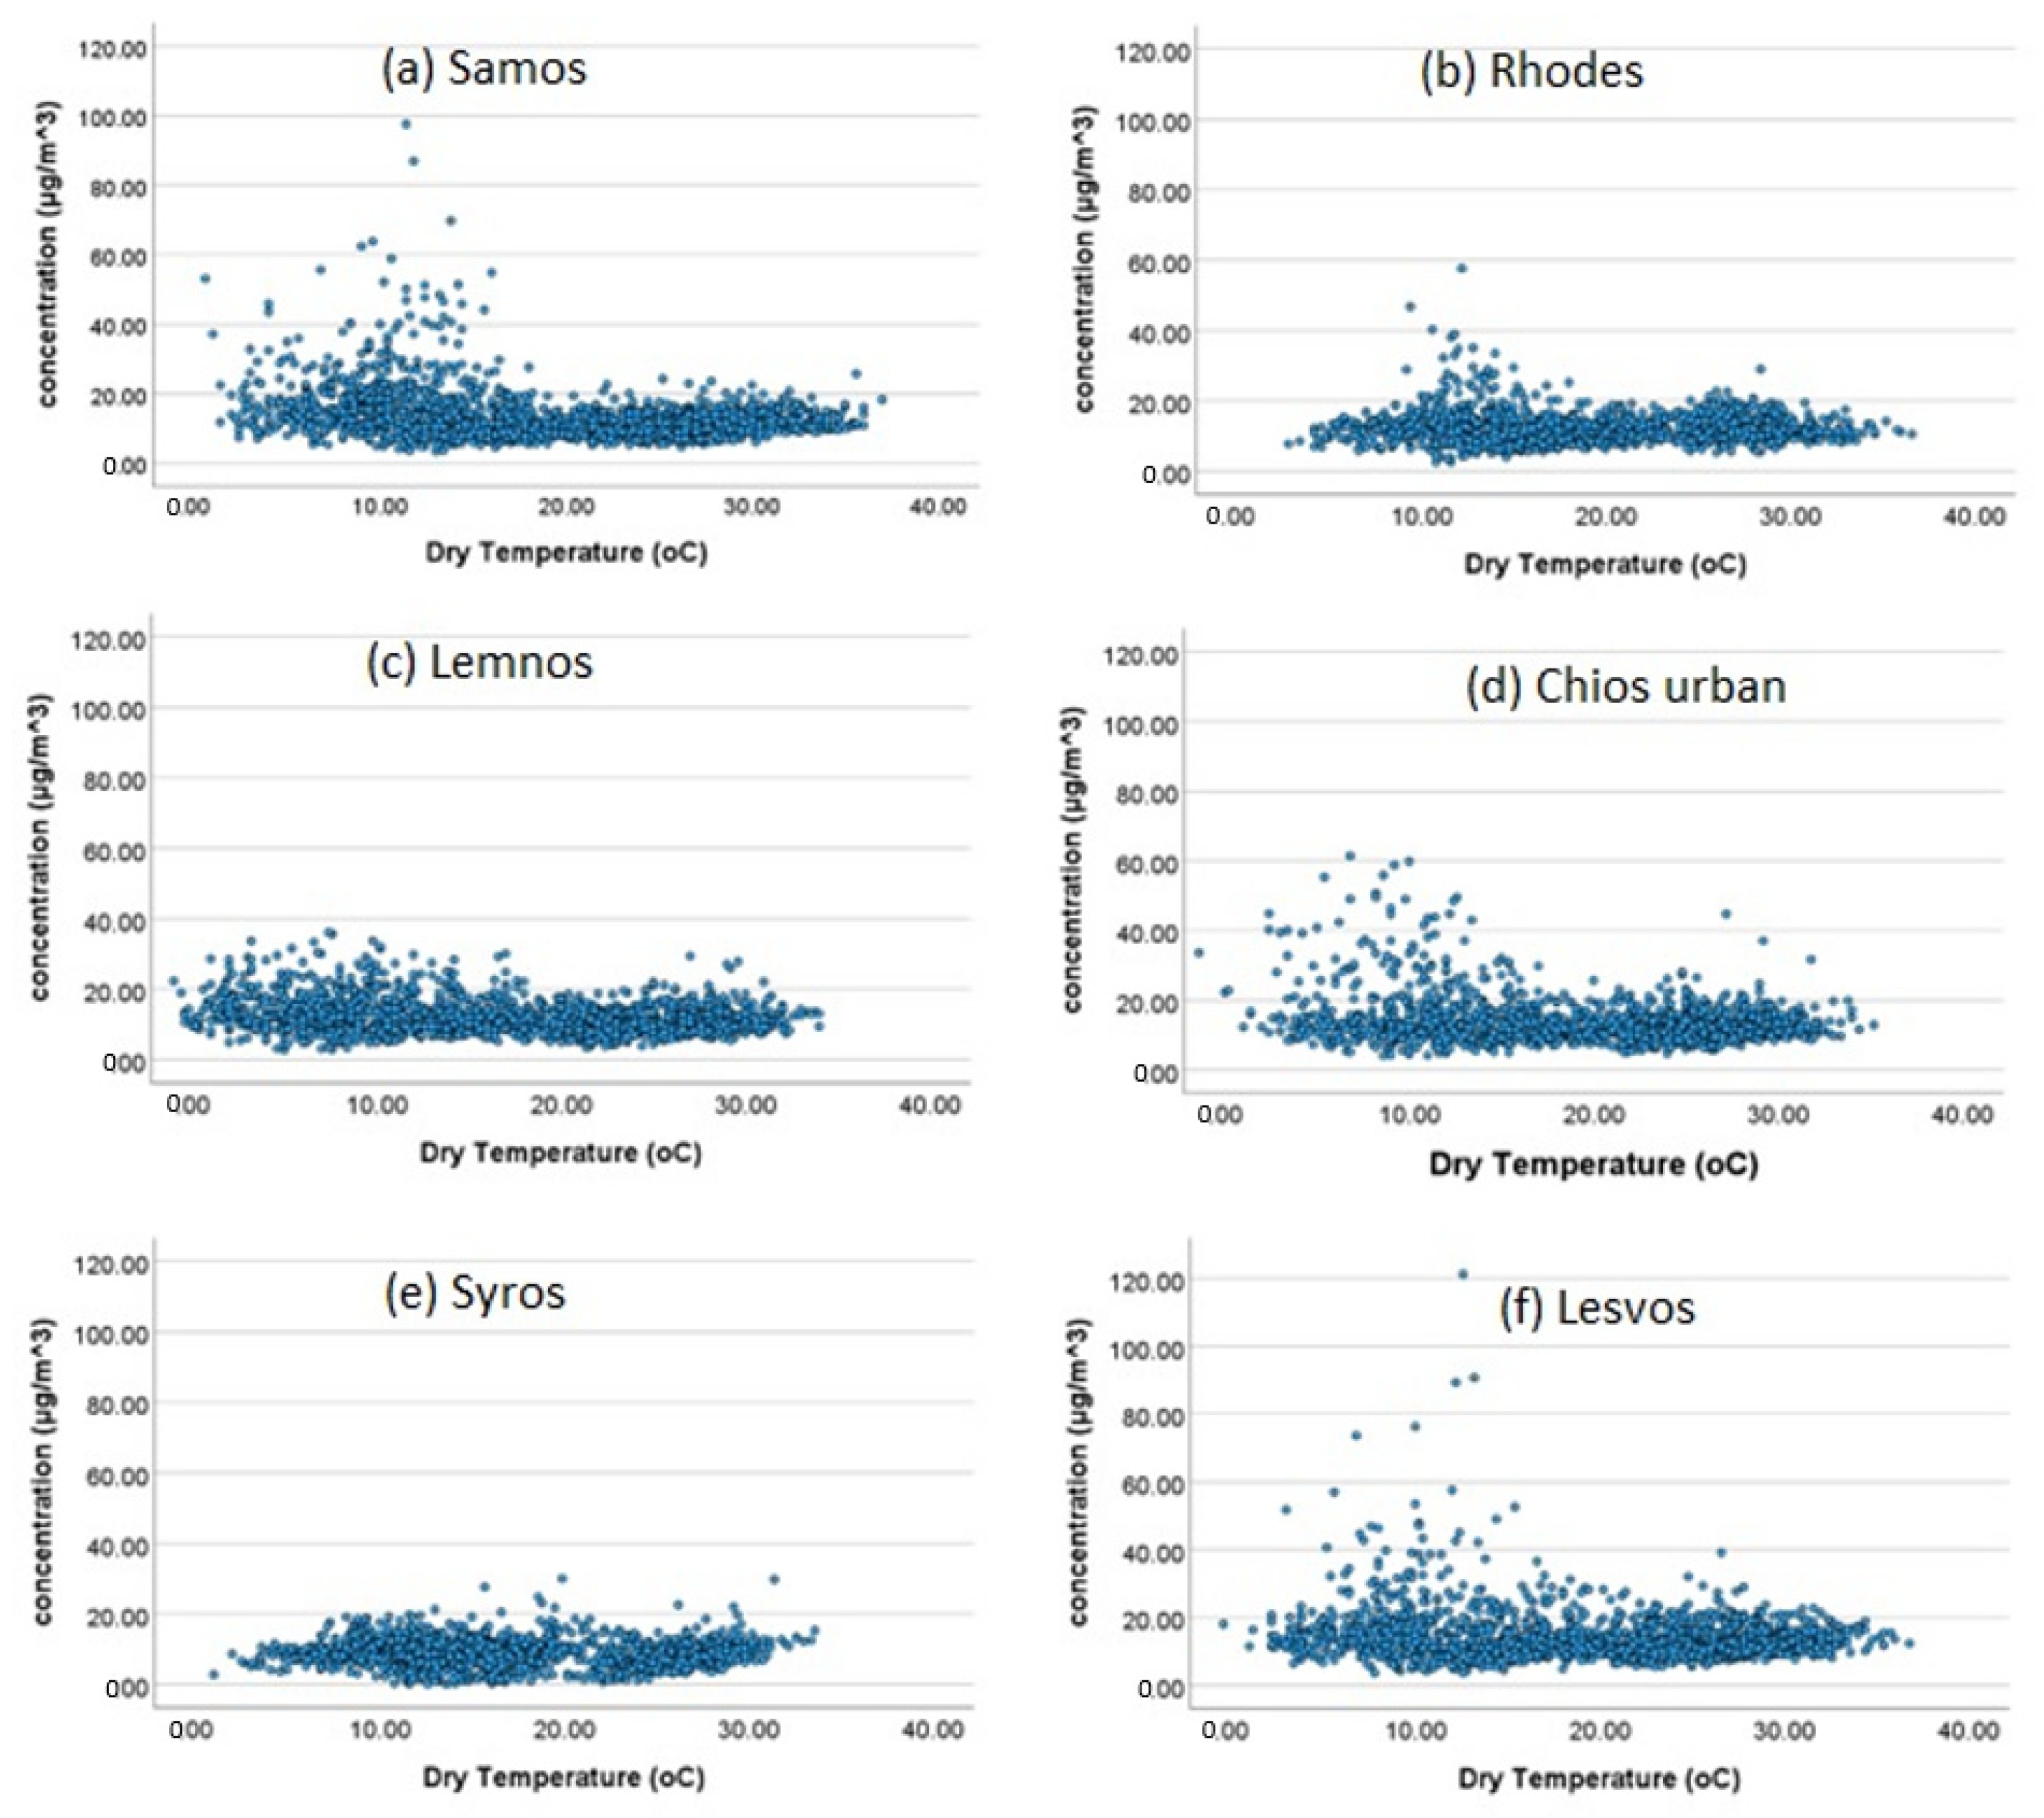
The relationship between the PM2.5 concentrations and dry temperature are presented in Figure 2 (the Chios_urban sensor was used for Chios Island). Most concentrations are below 20 μg/m3, indicating that this amount of PM2.5 is due to background concentrations and local sources that remain rather stable throughout the year (e.g., local traffic). In Samos, Lesvos and Chios, and to a lesser extent in Rhodes, peaks appear when the temperature is less than 12 °C (wintertime). A further study of the PM2.5 concentrations revealed that the values reach their maximum in the evening during wintertime. Probably, they are related to the fuel used for residential heating. Higher particles concentrations during the cold period compared to the warm period were also found by [16] in Lesvos. It is considered that wood burning contributes significantly to particulate pollution [17], and the maximum concentrations recorded during nighttime have been attributed to wood burning for residential heating by other researchers as well [18]. The estimation of the possible sources in the area of interest and the locals’ perception about air quality was attempted through the conduction of a survey. Responses revealed that in Samos, Lesvos and Chios, people usually use fireplaces and stoves and, consequently, biomass (e.g., wood, pellets) for residential heating. In general, the preference for residential heating means depends on the temperatures, the economic conditions and the availability of fuel. On the northern Aegean islands (with low GDP per capita and lower temperatures), stoves, fireplaces and central heating with oil are used. On the southern Aegean islands (high GDP per capita and higher temperatures), air-conditioning or heat pumps (both for winter and summer) are used. In addition, whereas Lesvos, Chios and Samos are islands with quite high forest cover and/or olive groves, Lemnos is mainly covered by bushes and low vegetation, so people prefer central heating (fuel used: oil), which is mainly associated with NOx emissions [17]. So, despite the low temperatures in winter, no exceedances of PM2.5 concentrations are recorded in Lemnos. It should also be mentioned that the island’s capital, Myrina, where the sensor is located, is a small town (approx. 6000 inhabitants). Rhodes (Figure 2b) is characterized by mild winters; thus, the heating period is short, and people prefer to use air-conditioning (or heat pumps) as the main heating source and central heating and stoves secondly. As a result, low PM2.5 concentrations are recorded even though the city of Rhodes is the most populated among all (approx. 50,000 inhabitants). No extreme values were measured on Syros during the cold period. Since brushes occupy a large part of the island, people use central heating and air-conditioning. In addition, the high winds on Syros (Table 1) disperse the pollution.

3.2. PM2.5 Concentrations and Wind Direction

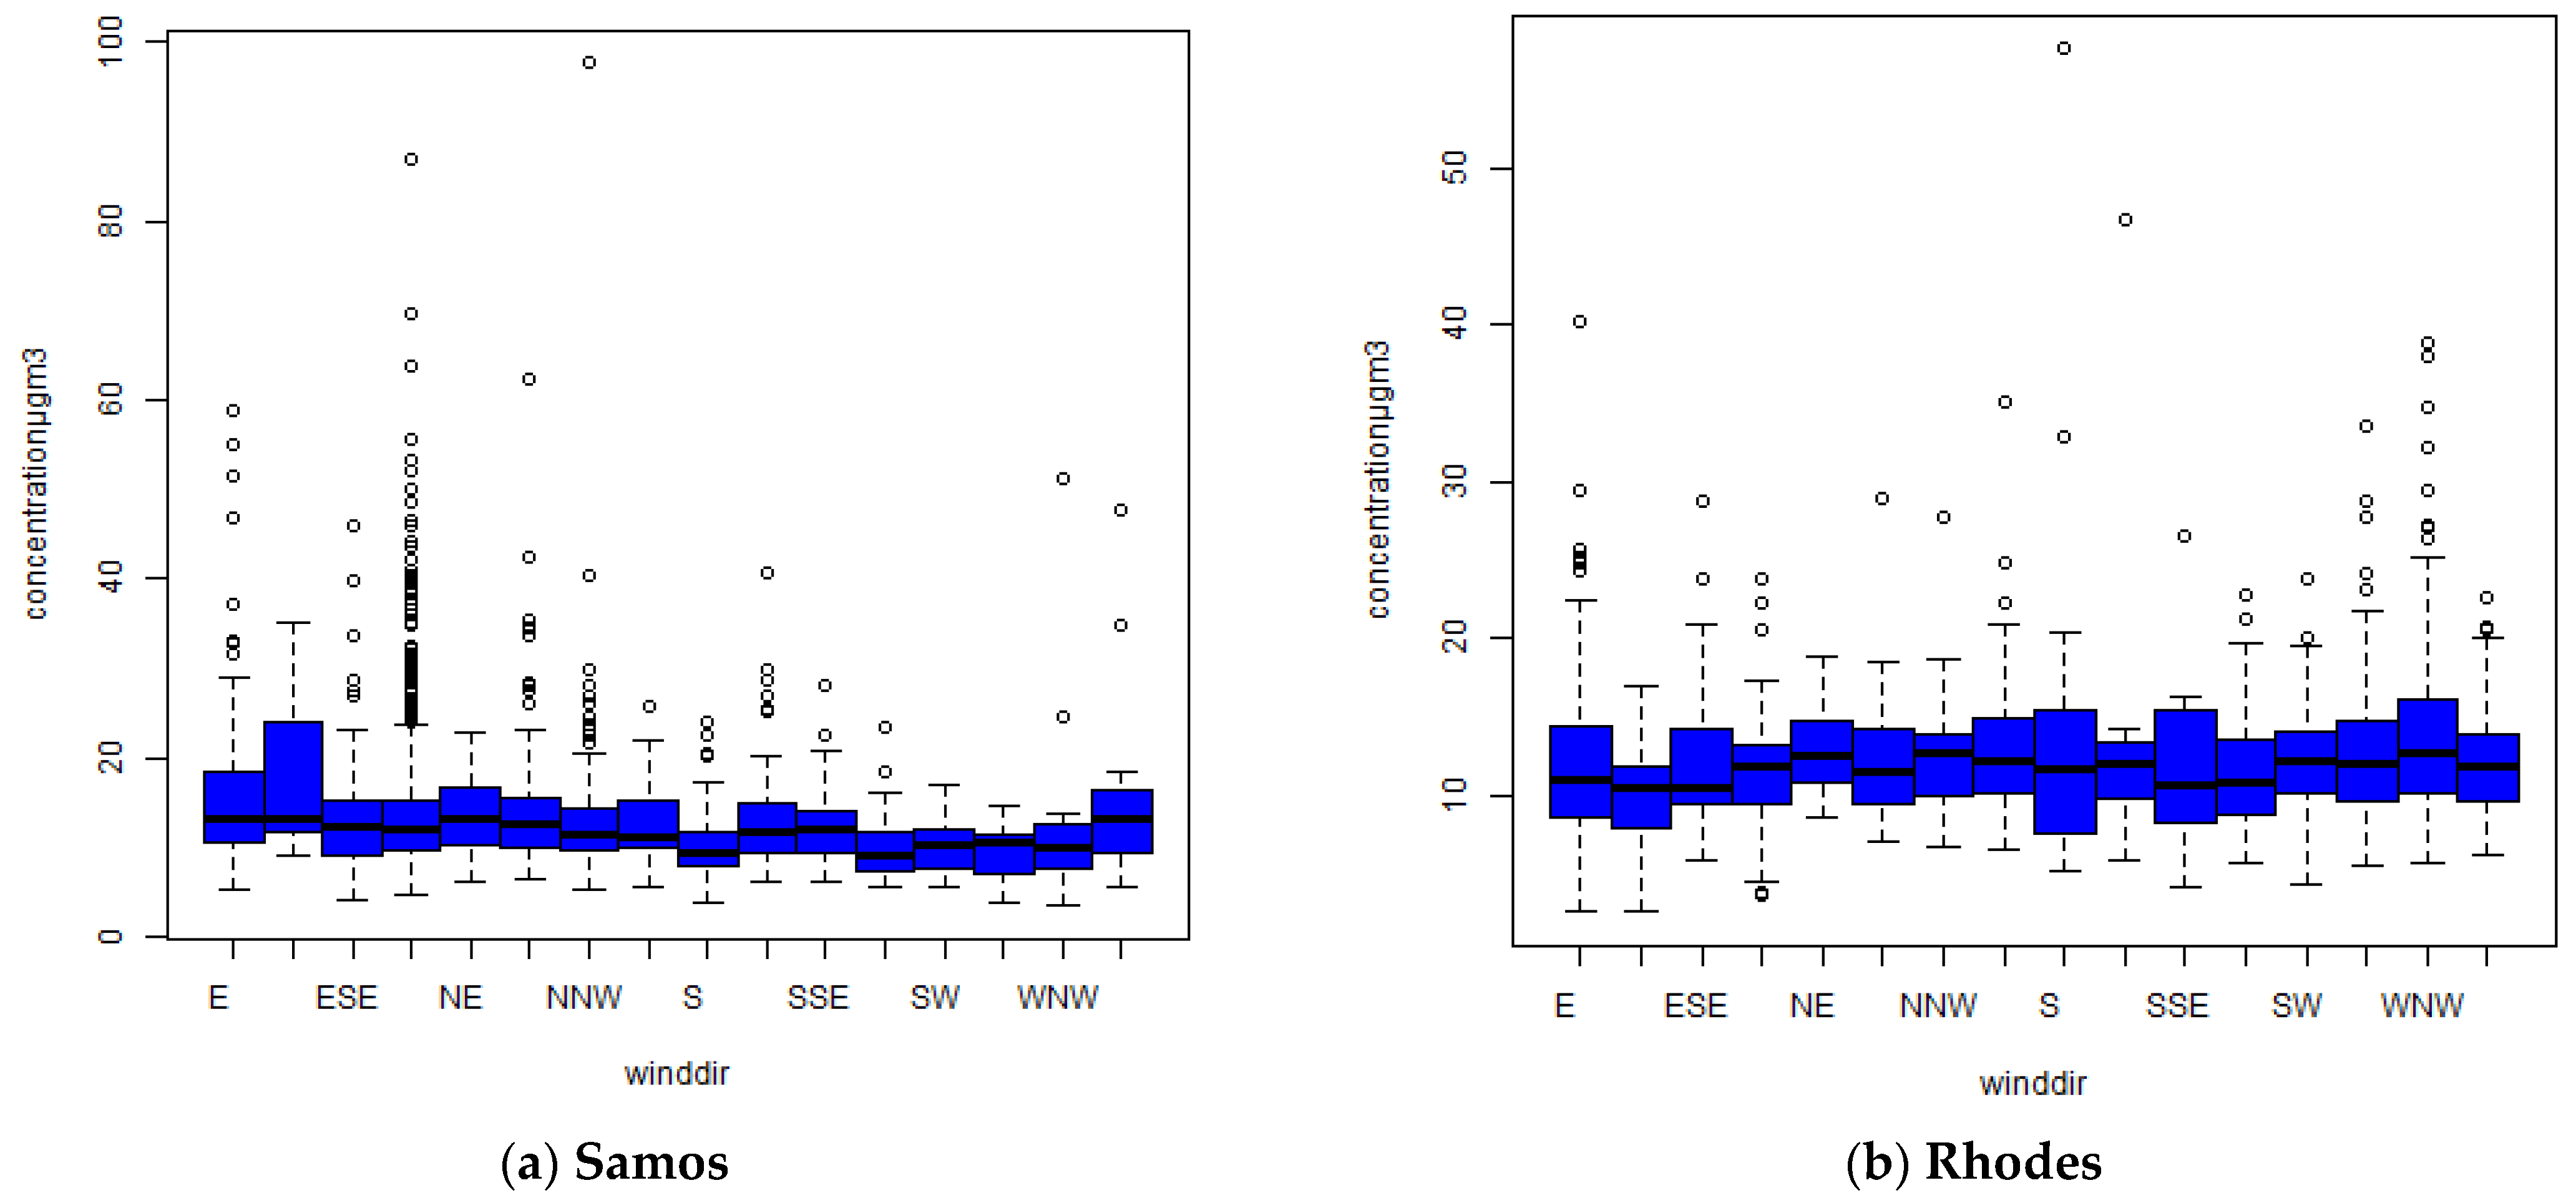
Box plots of PM2.5 concentrations in relation to wind direction are presented in Figure 3 for two selected islands, Samos and Rhodes, since they are characterized by different climatological conditions (warmer winters in Rhodes, sunny and hot summers), landscapes (the city of Karlovasi in Samos, where the sensor is located, is surrounded by a woody area, while there is low vegetation in the city of Rhodes) and population (Rhodes has approx. 50,000 inhabitants, Karlovasi has 7000 inhabitants). Increased concentrations on Samos are connected to low wind speeds (0–1 knots) from the northern direction (the fourth box plot in Figure 3a) and secondly from the NNW direction. On the other hand, on Rhodes, the outliers shown in Figure 3b (30 μg/m3 < values < 40 μg/m3) were recorded in February under the prevalence of strong southern and northwestern winds (>10knots). However, values above 40 μg/m3 are related to low eastern and southern winds (<4 knots). So, it is more likely, for both islands (Samos and Rhodes), that local sources contribute to the formation of the highest concentrations since the prevalence of low wind speeds prevents the dispersion of pollutants.

4. Conclusions

A network of low-cost sensors has been developed on six islands in the Aegean Sea (Lemnos, Lesvos, Samos, Chios, Syros and Rhodes) to examine the local air quality. In the present study, hourly PM2.5 concentrations, as well as meteorological parameters, were collected for the period from 1 January to 14 September 2022. The correlation between PM2.5 values and temperature indicated that the higher measurements are related to low temperature profiles and the use of biomass burning as fuel for residential heating. In areas where different appliances are preferred for heating (e.g., air-conditioning), there are no extreme PM2.5 concentrations. Consequently, anthropogenic activities can highly affect the kind of pollutants emitted and thus the local air quality. Moreover, the prevalence of low wind speeds leads to increased concentrations due to the prevention of particle dispersion, while the existence of strong northern winds (Etesians) helps the transportation of the pollutants far from the source. A further investigation of the particles’ chemical characteristics should provide evidence of the sources that determine the concentrations measured.

Author Contributions

Conceptualization, A.-M.K. and K.-M.F.; methodology, A.-M.K. and K.-M.F.; software, K.-M.F.; validation, A.-M.K., K.-M.F. and P.K.; formal analysis, A.-M.K. and K.-M.F.; investigation, A.-M.K. and K.-M.F.; resources, A.-M.K., K.-M.F. and A.P.; data curation, A.-M.K. and K.-M.F.; writing—original draft preparation, A.-M.K. and K.-M.F.; visualization, K.-M.F.; supervision, A.-M.K.; project administration, A.P.; funding acquisition, A.P. All authors have read and agreed to the published version of the manuscript.

Funding

This research is financed by the Research Infrastructure EN.I.R.I.S.S.T.+ (MIS 5047041), implemented under the Action “Reinforcement of the Research and Innovation Infrastructure”, funded by the Operational Programme “Competitiveness, Entrepreneurship and Innovation” (NSRF 2014–2020) and co-financed by Greece and the European Union (European Regional Development Fund).

Institutional Review Board Statement

Not applicable.

Informed Consent Statement

Not applicable.

Data Availability Statement

Data are available upon request.

Conflicts of Interest

The authors declare no conflict of interest.

References

  1. European Environmental Agency. Air Quality in Europe 2022. 2022. Available online: https://www.eea.europa.eu//publications/air-quality-in-europe-2022 (accessed on 20 May 2023).
  2. Yang, J.; Ji, Z.; Kang, S.; Zhang, Q.; Chen, X.; Lee, S.Y. Spatiotemporal variations of air pollutants in western China and their relationship to meteorological factors and emission sources. Environ. Pollut. 2019, 254, 112952. [Google Scholar] [CrossRef]
  3. Laña, I.; del Ser, J.; Padró, A.; Vélez, M.; Casanova-Mateo, C. The role of local urban traffic and meteorological conditions in air pollution: A data-based case study in Madrid, Spain. Atmos. Environ. 2016, 145, 424–438. [Google Scholar] [CrossRef]
  4. Vardoulakis, S.; Kassomenos, P. Sources and factors affecting PM10 levels in two European cities: Implications for local air quality management. Atmos. Environ. 2008, 42, 3949–3963. [Google Scholar] [CrossRef]
  5. Agathokleous, S.; Saitanis, C.J.; Savvides, C.; Sicard, P.; Agathokleous, E.; de Marco, A. Spatiotemporal variations of ozone exposure and its risks to vegetation and human health in Cyprus: An analysis across a gradient of altitudes. J. For. Res. 2022, 34, 579–594. [Google Scholar] [CrossRef] [PubMed]
  6. Dafka, S.; Akritidis, D.; Zanis, P.; Pozzer, A.; Xoplaki, E.; Luterbacher, J.; Zerefos, C. On the link between the Etesian winds, tropopause folds and tropospheric ozone over the Eastern Mediterranean during summer. Atmos. Res. 2021, 248, 105161. [Google Scholar] [CrossRef]
  7. Karagulian, F.; Belis, C.A.; Dora, C.F.C.; Pruss-Ustun, A.M.; Bonjour, S.; Adair-Rohani, H.; Amann, M. Contributions to cities’ ambient particulate matter (PM): A systematic review of local source contributions at global level. Atmos. Environ. 2015, 120, 475–483. [Google Scholar] [CrossRef]
  8. Florou, K.; Papanastasiou, D.K.; Pikridas, M.; Kaltsonoudis, C.; Louvaris, E.; Gkatzelis, G.I.; Patoulias, D.; Mihalopoulos, N.; Pandis, S.N. The contribution of wood burning and other pollution sources to wintertime organic aerosol levels in two Greek cities. Atmos. Chem. Phys. 2017, 17, 3145–3163. [Google Scholar] [CrossRef]
  9. Lai, H.C.; Dai, Y.T.; Mkasimongwa, S.W.; Hsiao, M.C.; Lai, L.W. The Impact of Atmospheric Synoptic Weather Condition and Long-Range Transportation of Air Mass on Extreme PM10 Concentration Events. Atmosphere 2023, 14, 406. [Google Scholar] [CrossRef]
  10. Zhang, Y. Dynamic effect analysis of meteorological conditions on air pollution: A case study from Beijing. Sci. Total Environ. 2019, 684, 178–185. [Google Scholar] [CrossRef] [PubMed]
  11. Tombrou, M.; Bossioli, E.; Kalogiros, J.; Allan, J.D.; Bacak, A.; Biskos, G.; Coe, H.; Dandou, A.; Kouvarakis, G.; Mihalopoulos, N.; et al. Physical and chemical processes of air masses in the Aegean Sea during Etesians: Aegean-GAME airborne campaign. Sci. Total Environ. 2015, 506–507, 201–216. [Google Scholar] [CrossRef] [PubMed]
  12. Triantafyllou, E.; Giamarelou, M.; Bossioli, E.; Zarmpas, P.; Theodosi, C.; Matsoukas, C.; Tombrou, M.; Mihalopoulos, N.; Biskos, G. Particulate pollution transport episodes from Eurasia to a remote region of northeast Mediterranean. Atmos. Environ. 2016, 128, 45–52. [Google Scholar] [CrossRef]
  13. Paraskevopoulou, D.; Liakakou, E.; Gerasopoulos, E.; Mihalopoulos, N. Sources of atmospheric aerosol from long-term measurements (5 years) of chemical composition in Athens, Greece. Sci. Total Environ. 2015, 527–528, 165–178. [Google Scholar] [CrossRef] [PubMed]
  14. Tolis, E.I.; Saraga, D.E.; Lytra, M.K.; Papathanasiou, A.C.; Bougaidis, P.N.; Prekas-Patronakis, O.E.; Ioannidis, I.I.; Bartzis, J.G. Concentration and chemical composition of PM2.5 for a one-year period at Thessaloniki, Greece: A comparison between city and port area. Atmos. Environ. 2015, 113, 197–207. [Google Scholar] [CrossRef]
  15. Kosmopoulos, G.; Salamalikis, V.; Matrali, A.; Pandis, S.N.; Kazantzidis, A. Insights about the Sources of PM2.5 in an Urban Area from Measurements of a Low-Cost Sensor Network. Atmosphere 2022, 13, 440. [Google Scholar] [CrossRef]
  16. Triantafyllou, E.; Diapouli, E.; Korras-Carraca Manousakas, M.; Psanis, C.; Floutsi, A.A.; Spyrou, C.; Eleftheriadis, K.; Biskos, G. Contribution of locally produced and transported air pollution to particulate matter in a small insular coastal city. Atmos. Pollut. Res. 2020, 11, 667–678. [Google Scholar] [CrossRef]
  17. Fameli, K.M.; Papagiannaki, K.; Kotroni, V. Optimizing the knowledge on residential heating characteristics in Greece via crowd-sourcing approach. Atmosphere 2021, 12, 1178. [Google Scholar] [CrossRef]
  18. Stavroulas, I.; Grivas, G.; Michalopoulos, P.; Liakakou, E.; Bougiatioti, A.; Kalkavouras, P.; Fameli, K.M.; Hatzianastassiou, N.; Mihalopoulos, N.; Gerasopoulos, E. Field evaluation of low-cost PM sensors (Purple Air PA-II) Under variable urban air quality conditions, in Greece. Atmosphere 2020, 11, 926. [Google Scholar] [CrossRef]
Figure 1. The network of air quality monitors in the Aegean Sea.
Environsciproc 26 00125 g001
Figure 2. Scatter plots of hourly PM2.5 concentrations (in μg/m3) and dry temperature (in °C) for monitoring stations: (a) Samos, (b) Rhodes, (c) Lemnos, (d) Chios_urban, (e) Syros and (f) Lesvos.
Environsciproc 26 00125 g002
Figure 3. Box plots of hourly PM2.5 concentrations (in μg/m3) as distributed at different wind directions for (a) Samos and (b) Rhodes stations for the 1 January 2022–14 September 2022 period (wind direction: E stands for east, S for south, N for north, and W for west).
Environsciproc 26 00125 g003
Table 1. Mean values of the dry and wet temperature, wind speed, the prevailing wind direction and PM2.5 concentration on six islands in the Aegean Sea for the 1 January–15 September 2022 period.
SensorDry
Temperature (°C)
Wet
Temperature (°C)
Wind Speed
(knots)
Max Wind Speed
(knots)
Wind
Direction
Concentration
(μg/m3)
Chios 19.711.87.816.3N (52.8%)13.5
Lemnos17.110.36.614.7N (41.4%)11.8
Lesvos19.515.07.214.4E (19.4%)14.3
Rhodes20.116.28.715.0SW (24.2%)12.2
Samos17.114.67.014.4N (49.5%)13.4
Syros19.011.411.521.0N (36.9%)8.5
Disclaimer/Publisher’s Note: The statements, opinions and data contained in all publications are solely those of the individual author(s) and contributor(s) and not of MDPI and/or the editor(s). MDPI and/or the editor(s) disclaim responsibility for any injury to people or property resulting from any ideas, methods, instructions or products referred to in the content.