Next Article in Journal
Early Warning Impact of Temperature and Rainfall Anomalies onto West Nile Virus Human Cases
Previous Article in Journal
Top European Droughts since 1991
 
 
Please note that, as of 4 December 2024, Environmental Sciences Proceedings has been renamed to Environmental and Earth Sciences Proceedings and is now published here.
Proceeding Paper

An Early Warning System to Predict Rainfall Event in Attica, Greece: The Case Study of 30 September 2018 †

1
Department of Geography, Harokopio University of Athens, El. Venizelou Str. 70, 17671 Athens, Greece
2
Research Centre for Atmospheric Physics and Climatology, Academy of Athens, 10679 Athens, Greece
3
Institute for Environmental Research and Sustainable Development, National Observatory of Athens, 15236 Athens, Greece
4
Department of Physics, National and Kapodistrian University of Athens, 15771 Athens, Greece
5
Institute of Marine Biological Resources and Inland Waters, Hellenic Centre for Marine Research, 46.7 km Athens-Sounio, 19013 Anavissos, Greece
*
Author to whom correspondence should be addressed.
Presented at the 16th International Conference on Meteorology, Climatology and Atmospheric Physics—COMECAP 2023, Athens, Greece, 25–29 September 2023.
Environ. Sci. Proc. 2023, 26(1), 108; https://doi.org/10.3390/environsciproc2023026108
Published: 28 August 2023

Abstract

:
A forward advection scheme is incorporated in an advanced data assimilation model to provide very short-term predictions. The Local Analysis and Prediction System (LAPS) is implemented in the nowcasting mode in a case study of extreme precipitation event over Attica, Greece. The LAPS assimilated remote sensing data from satellite retrievals and XPOL radar precipitation measurements to produce objective analyses alongside their nowcasts in a forecast window up to 3 h. The results indicate that the assimilation of remote sensing data can increase the short-term precipitation predictability, with varying performance depending on the type and the combination of the assimilated remote sensing data.

1. Introduction

An effective way of increasing the protection from extreme weather events is the use of advanced early warning systems. Reliable forecasts of various atmospheric parameters (e.g., temperature, wind speed, and precipitation) at high spatial and temporal resolution are important to reduce the risks and mitigate the impacts of the extreme events. After all, Spyrou et al. [1] introduced an integrated multi-model system able to nowcast hydrometeorological hazards. Nowcasting is a potent methodology that refers to a forecast with a very short time horizon (usually up to 3 h) [2].
Nowcasting methods usually focus on the estimation of precipitation [3]. Precipitation can be measured either directly with the use of ground-based instruments or indirectly with the use of remote sensing techniques like radar systems and Earth-observing satellites. The measured data are incorporated together with numerical weather predictions (NWPs) in data assimilation systems which eliminate errors and produce analyses and enhanced short-term forecasts.
Therefore, the main objective of this study is to assess the sensitivity of an advanced data assimilation system on ingesting satellite precipitation retrievals and then to evaluate its nowcasting capabilities regarding precipitation. This is an effort to give an in-depth description of an accurate forecast of the location and intensity of precipitation in a short-term horizon. In this context, the system was tested in a case of an intense Mediterranean tropical-like cyclone (medicane) that occurred during the period 27–30 September 2018 [4] and affected Athens (Attica, Greece), mainly on 30 September. Section 2 presents the study area and briefly describes the medicane. Section 3 describes the data used, and Section 4 describes the methods used in this study. The results are demonstrated and discussed in Section 5. Finally, in Section 6, the main conclusions are presented.

2. Description of the Synoptic Conditions

Greece is vulnerable to medicanes because of its location in the eastern Mediterranean Sea. The medicane used as a case study here is a notable incident occurred during the period 27–30 September 2018. It was formed in the Gulf of Sidra (Libya) on 27 September 2018 and, over the following days, was further deepened to 989 hPa and moved towards the Eastern Mediterranean [5]. On 30 September 2018 at 00:00 UTC, the low-pressure system was located over the Aegean Sea Figure 1a,b with minimum pressure at 1004 hPa. It was accompanied by an occluded front over Greece that indicated enhanced atmospheric instability and severe precipitation in the area.

3. Description of the Assimilated Precipitation Data

Remote sensing data from satellite retrievals and X-band dual-polarization (XPOL) were assimilated in this study.

3.1. X-Band Dual-Polarization (XPOL) Radar Data

An X-band dual-polarization (XPOL) round radar is installed on Penteli mountain and operated by the National Observatory of Athens. The XPOL radar provides specific information about the size, orientation, and composition of the precipitation particles. The radar runs in plan position indicator (PPI) mode during precipitation events, taking observations in a 180° sector scan at 0.5°, 1°, and 2.5° elevation sweeps with a range resolution of 120 m. The Self-Consistent Optimal Parameterization-Microphysics Estimation (SCOPE-ME) X-band dual-polarization technique is utilized to obtain the values of precipitation [6].

3.2. Satelite Precipitation Retrievals

TRMM: The distribution and variability of precipitation are also studied using the Tropical Rainfall Measuring Mission (TRMM). Four of TRMM’s five instruments—a Precipitation Radar (PR), a five-channel Visible and Infrared Scanner (VIRS), a nine-channel passive Microwave Imager (TMI), and a Lightning Imaging Sensor (LSI)—are used to measure precipitation [7]. The levels of the TRMM products range from 1 to 3. TRMM 3B42 products are employed for the purposes of this study.
GPM: The successor of TRMM is the Global Precipitation Measurement (GPM) program. GPM has better resolution than TRMM, and its main goal is the improvement of weather forecasts, climate modeling, and hydrological modeling [8]. The estimations of the precipitation retrievals are outputs from Integrated Multi-satellitE Retrievals for GPM (IMERG) algorithm. GPM IMERG EARLY products, which have a spatial resolution of 0.1° × 0.1° and a temporal resolution up to 30 min, are employed for the purposes of this study.
HSAF: The parameters related to precipitation, soil moisture, and snow are studied in the “EUMETSAT Satellite Application Facility on Support to Operational Hydrology and Water Management” (H-SAF) program. H03B products, which have a high temporal (15 min) and spatial resolution (3 km), are employed for the purposes of this study [9]. Its Blending MW/IR algorithm is based on the “Rapid Update” technique.

4. Methodology

The Local Analysis and Prediction System (LAPS), developed by National Oceanic and Atmospheric Administration (NOAA), is a mesoscale meteorological data assimilation system that assimilates all available data (from meteorological networks, satellites, radar soundings, and aircrafts) and produces a three-dimensional, spatially dispersed, time-evolving representation of atmospheric processes [10]. Global Forecast System (GFS) near-to-analysis forecasts on 0.50° × 0.50° horizontal resolution are used in LAPS to produce the first guess fields, and then data are employed.
Combining the above-mentioned data, LAPS produces an analysis by minimizing the 3-D cost function to reduce the difference between the analyzed and observed fields. For a time horizon of 1–3 h, an advection scheme was embedded in LAPS to predict the movement of precipitation [1]. A simple first-order advection equation in two-dimensional (x,y) is the base of this scheme.
1 Δ t R i , j t + 1 R i , j t + u Δ x R i , j t R i 1 , j t + v Δ y R i , j t R i , j 1 t = 0
where R is the meteorological parameter of precipitation, u and v are the wind components, respectively, Δx is the grid increment in the x direction, Δy is the grid increment in the y direction, Δt is the time-step, and (i,j) is the grid point in the domain of LAPS. The stability of the Equation (1) is controlled by the Courant numbers that are given by the Equation (2). The equation C U + C V 1 is used as a stability criterion.
C U = u Δ t Δ x 0 ,   C V = v Δ t Δ y 0
where CV and CU are the Courant numbers in the y and x directions, respectively. Solving Equations (1) through (2), the value of the precipitation (R) is estimated at time t + 1 [1].
In this study, the domain of LAPS covered Attica using a very fine horizontal grid spacing of 1 km and 41 vertical levels, resulting in a total of 110 × 110 × 41 = 496,100 grid points (Figure 2). Three sensitivity experiments were carried out with the following inputs: (a) only GFS near-analysis forecasts, (b) GFS near-analysis forecasts combined with Global Precipitation Measurement (GPM), Tropical Rainfall Measuring Mission (TRMM) retrievals, and radar data, and (c) GFS near-analysis forecasts combined with EUMETSAT Satellite Application Facility on Support to Operational Hydrology and Water Management (H-SAF) retrievals and radar data. LAPS initiated at 03:00 UTC providing nowcasts up to 06:00 UTC on 10 min time frequency. Moreover, the above three sensitivity experiments were also carried out with an initial time of LAPS at 06:00 having an extended duration, up to 12:00 UTC, on 180 min time intervals.

5. Results and Discussion

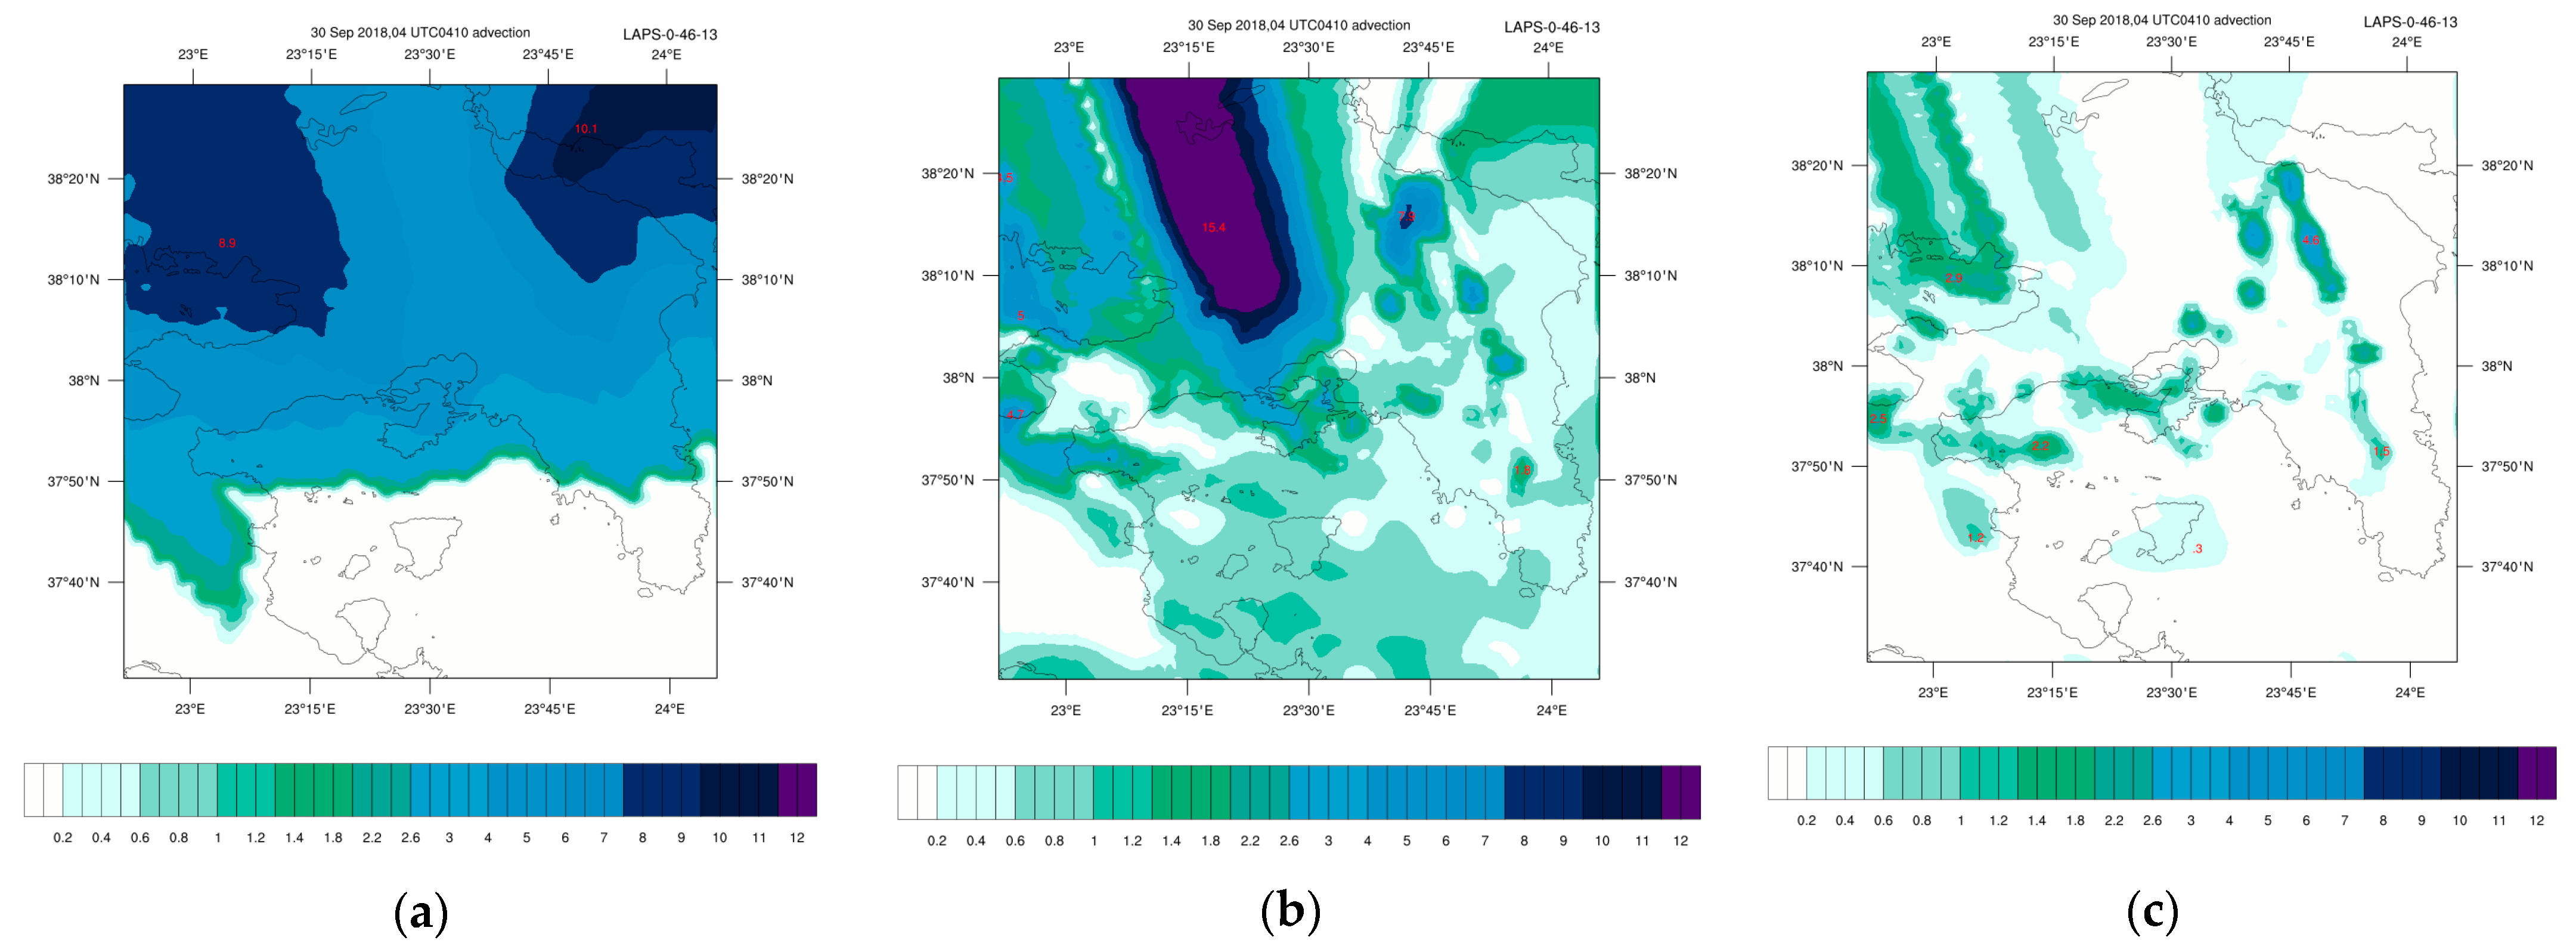
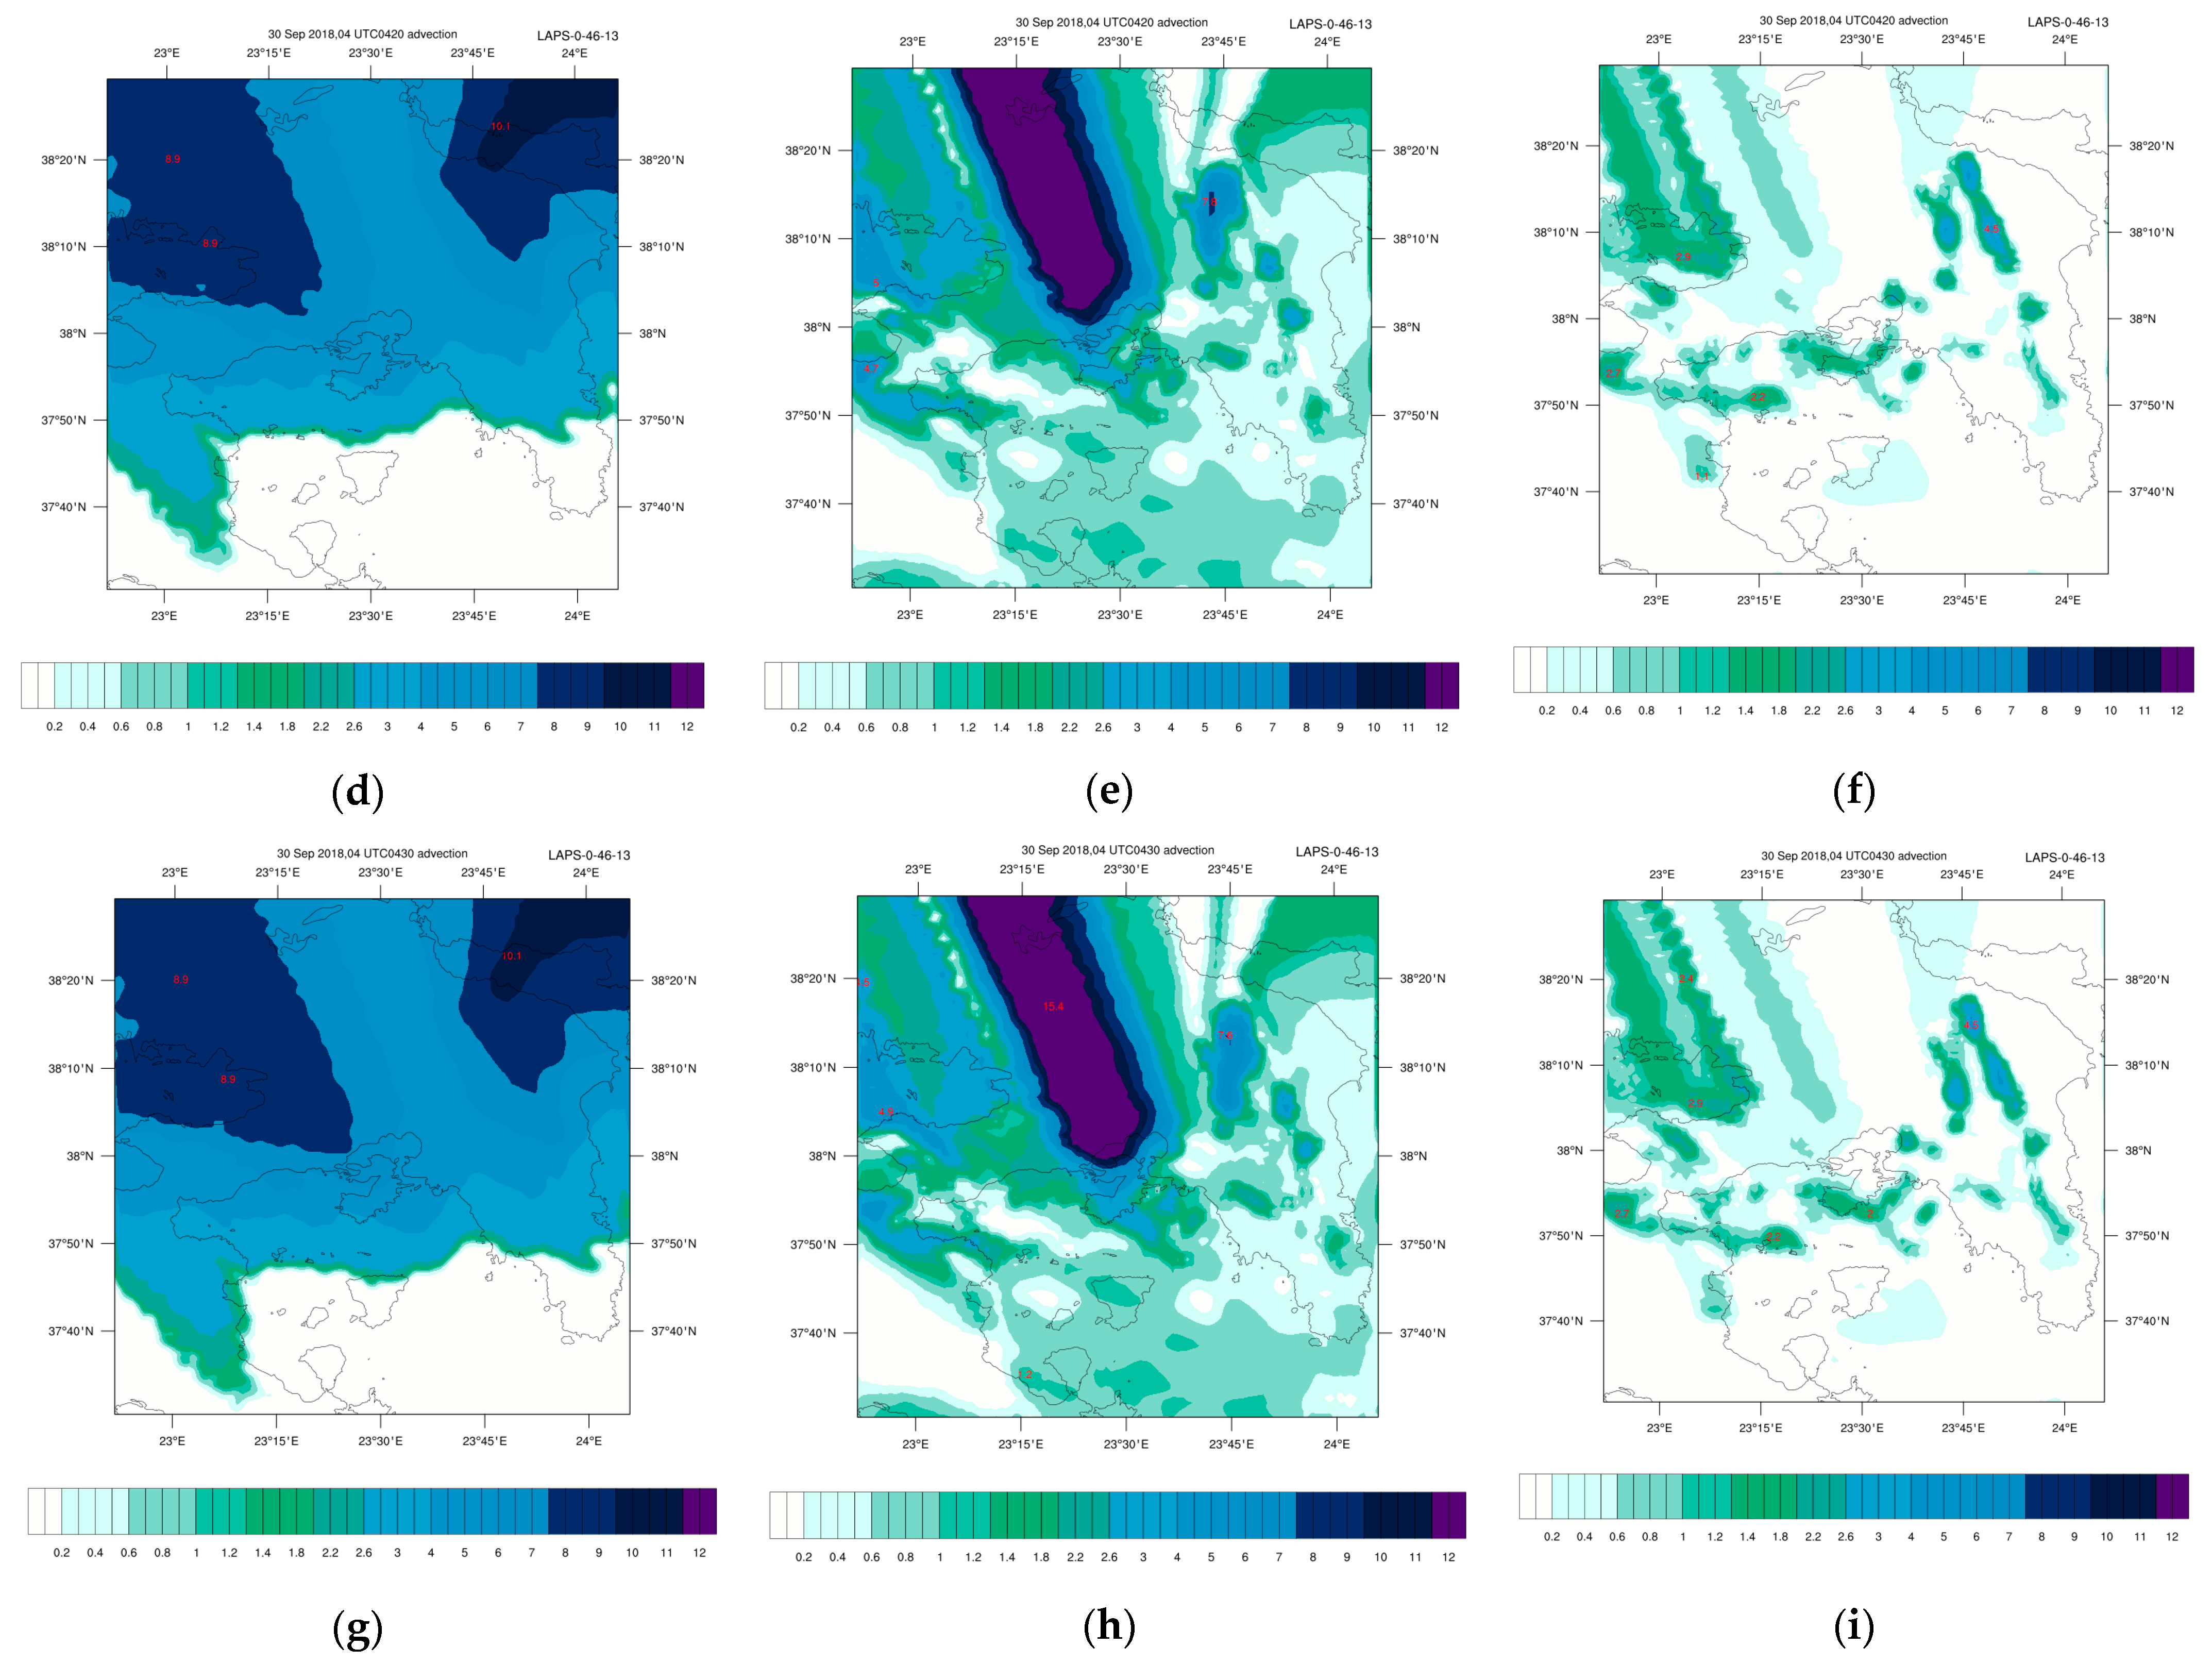
Panel plots in Figure 3 depict 10 min accumulated precipitation (mm) for the LAPS nowcasts on 30 September 2018 from 04:10 to 04:30 UTC by implementing GFS near to analysis forecasts as a background in the control run (Figure 3a,d,g), by additionally assimilating TRMM and IMERG products and XPOL radar data (Figure 3b,e,h) and assimilating H-SAF products and XPOL data (Figure 3c,f,i). Precipitation observations from two independent (i.e., not assimilated) meteorological stations in Attica region (Salamina and Kallithea, Figure 2) were compared to the 10 min precipitation nowcasts, and the results are presented in Table 1 and Table 2. LAPS nowcasts, including IMERG, TRMM, and XPOL retrievals, show an overestimation of the precipitation against the in situ records. On the other hand, the assimilation of H-SAF and XPOL retrievals considerably increase the precipitation accuracy.
The nowcasted and measured precipitation are compared in Table 1 and Table 2. It is shown that nowcasts perform much better when H-SAF satellite products and radar data are assimilated. The assimilation of H-SAF and radar data significantly improved the systematic overestimation of precipitation at the meteorological stations of Salamina and Kallithea in Table 1 and Table 2. There is a slight precipitation difference of around 1% between nowcasts (assimilating H-SAF and radar data) in Salamina station, except for 04:10 UTC, when a small overestimation is presented. The same nowcasts slightly underestimated the precipitation in Kallithea station except for 04:30 UTC, where nowcast was 0.18 mm/10 min instead of the recorded 0.00 mm/10 min, and at 04:10 UTC, where nowcast and recorded value are the same with 0.00 mm/10 min.
However, the main core of precipitation was located away from these two stations. So, there is also a comparison between another three independent meteorological stations of the Hellenic National Meteorological Service (HNMS) network (Figure 2) and the nowcasts at 06:00–12:00 UTC, and the results are presented in Table 3. LAPS nowcasts obtained by assimilating only GFS systematically overestimate the precipitation at all three stations. On the other hand, LAPS nowcasts, including IMERG, TRMM, and XPOL retrievals and H-SAF and XPOL retrievals significantly reduce the overestimation of the precipitation at Tatoi and Elliniko stations, but they underestimate the precipitation at Elefsis station. Moreover, the nowcasted values (by assimilating H-SAF and radar data) are even closer to the independent stations’ values, except for the Elefsis station, for which the forecasted value is 2.31 mm/6 h instead of the recorded value at 17 mm/6 h. It is noteworthy that the nowcasts are deteriorated as the lead time is increased.

6. Conclusions

The accuracy of precipitation nowcasts can be increased by including remote sensing data into NWP models. LAPS is applied in nowcasting mode assimilating a number of remote sensing measurements including XPOL weather radar data. Compared with independent measurements, it was revealed that the assimilation of satellite precipitation together with XPOL radar retrievals significantly reduced the systematic overestimation of the precipitation caused by the GFS background. Moreover, the assimilation of the H-SAF product, instead of TRMM & GPM (IMERG), greatly increased the short-term predictability of precipitation. Additional experiments and sensitivity tests with a combination of satellite and weather radar precipitation estimates are in the authors’ near-future plans.

Author Contributions

A.P. contributed to the methodology, formal analysis, investigation, visualization, and writing—original draft preparation; M.T., J.K., C.S. and G.V. contributed to the methodology, review, and editing; P.K. contributed to the conceptualization, methodology, supervision, investigation, review, and editing. All authors have read and agreed to the published version of the manuscript.

Funding

This research received no external funding.

Institutional Review Board Statement

Not applicable.

Informed Consent Statement

Not applicable.

Data Availability Statement

The data presented in this study are available on request from the corresponding author.

Acknowledgments

The National Centers for Environmental Prediction (NCEP) is gratefully acknowledged for the provision of the Global Forecasting System (GFS) operational analyses. The National Aeronautics and Space Administration (NASA) for the provision of GPM and TRMM data and the European Organization for the Exploitation of Meteorological Satellites (EUMETSAT) for the provision of H-SAF data. The website wetter3.de is acknowledged for the provision of the GFS 850-hPa analysis map and the UK Met Office surface analysis map used in this study. The European Centre for Medium-Range Weather Forecasts (ECMWF) and the Hellenic National Meteorological Service (HNMS) are also acknowledged for the provision of the surface meteorological stations precipitation records.

Conflicts of Interest

The authors declare no conflict of interest.

References

  1. Spyrou, C.; Varlas, G.; Pappa, A.; Mentzafou, A.; Katsafados, P.; Papadopoulos, A.; Anagnostou, M.N.; Kalogiros, J. Implementation of a Nowcasting Hydrometeorological System for Studying Flash Flood Events: The Case of Mandra, Greece. Remote Sens. 2020, 12, 2784. [Google Scholar] [CrossRef]
  2. Raffellini, M.; Martina, F.; Silvestro, F.; Giannoni, F.; Rebora, N. Performance Evaluation of a Nowcasting Modelling Chain Operatively Employed in Very Small Catchments in the Mediterranean Environment for Civil Protection Purposes. Atmosphere 2021, 12, 783. [Google Scholar] [CrossRef]
  3. Mass, C. Nowcasting: The Promise of New Technologies of Communication, Modeling, And Observation. Bull. Am. Meteorol. Soc. 2012, 93, 797–809. [Google Scholar] [CrossRef]
  4. Varlas, G.; Vervatis, V.; Spyrou, C.; Papadopoulou, E.; Papadopoulos, A.; Katsafados, P. Investigating the impact of atmosphere-wave-ocean interactions on a Mediterranean tropical-like cyclone. Ocean Model. 2020, 153, 101675. [Google Scholar] [CrossRef]
  5. Portmann, R.; González-Alemán, J.; Sprenger, M.; Wernli, H. Medicane Zorbas: Origin and impact of an uncertain potential vorticity streamer. Weather Clim. Dyn. Discuss. 2019, 1–30. [Google Scholar] [CrossRef]
  6. Kalogiros, J.; Anagnostou, M.; Anagnostou, E.; Montopoli, M.; Picciotti, E.; Marzano, F. Evaluation of a new polarimetric algorithm for rain-path attenuation correction of X-band radar observations against disdrometer. IEEE Trans. Geosci. Remote Sens. 2014, 52, 1369–1380. [Google Scholar] [CrossRef]
  7. Liu, Z.; Ostrenga, D.; Teng, W.; Kempler, S. Tropical Rainfall Measuring Mission (TRMM) Precipitation Data and Services for Research and Applications. Bull. Am. Meteorol. Soc. 2012, 93, 1317–1325. [Google Scholar] [CrossRef]
  8. Hou, A.; Kakar, R.; Neeck, S.; Azarbarzin, A.; Kummerow, C.; Kojima, M.; Oki, R.; Nakamura, K.; Iguchi, T. The global precipitation measurement mission. Bull. Am. Meteorol. Soc. 2014, 95, 701–722. [Google Scholar] [CrossRef]
  9. Piazzi, G.; Tanis, C.M.; Kuter, S.; Simsek, B.; Puca, S.; Toniazzo, A.; Takala, M.; Akyürek, Z.; Gabellani, S.; Arslan, A.N. Cross-Country Assessment of H-SAF Snow Products by Sentinel-2 Imagery Validated against In-Situ Observations and Webcam Photography. Geosciences 2019, 9, 129. [Google Scholar] [CrossRef]
  10. Albers, S.C. The LAPS Wind Analysis. Weather Forecast. 1995, 10, 342–352. [Google Scholar] [CrossRef]
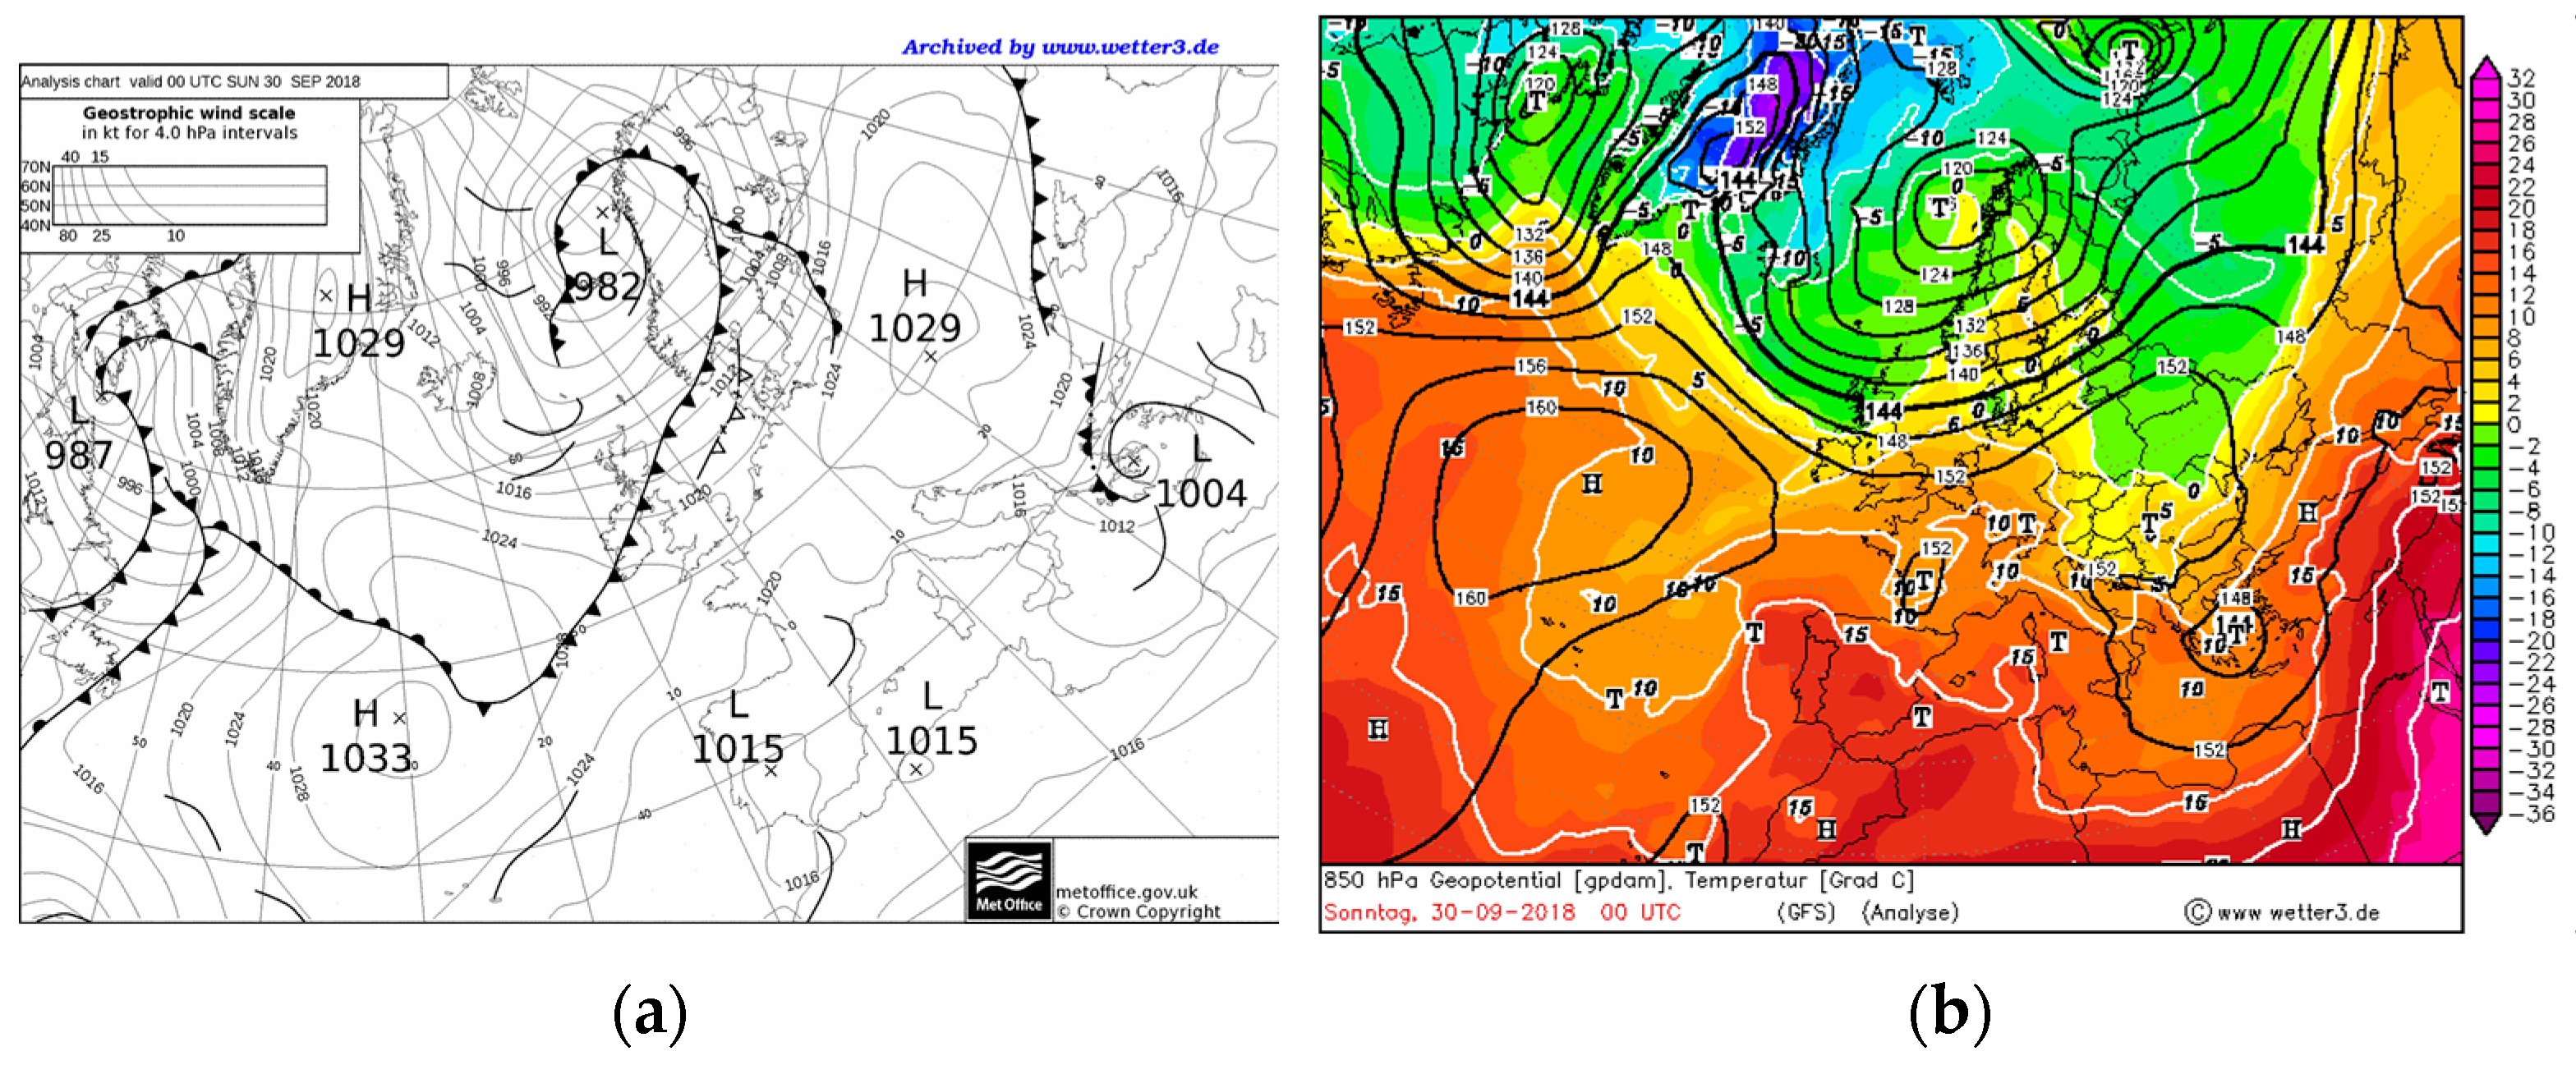
Figure 1. (a) UK Met Office mean sea level pressure (hPa) analysis map for 30 September 2018 at 00:00 UTC; (b) Geopotential height (black contours in gym) and temperature (color-shaded areas and white contours in °C) at 850 hPa on 30 September 2018 at 00:00 UTC. The map is based on analysis data from the Global Forecast System (GFS). The maps were derived from the archive of wetter3.de (http://www1.wetter3.de/ (accessed on 11 May 2023)).
Environsciproc 26 00108 g001
Figure 2. LAPS domain covering Attica and its topography (m). The red spots corresponded to the meteorological stations and the XPOL radar.
Environsciproc 26 00108 g002
Figure 3. Accumulated precipitation (mm) on 30 September 2018 at 04:10 UTC assimilating (a) only GFS, (b) GFS/TRMM/IMERG/radar, and (c) GFS/H-SAF/radar data, respectively, at 04:20 UTC assimilating (d) only GFS, (e) GFS/TRMM/IMERG/radar, and (f) GFS/H-SAF/radar data, respectively, and at 04:30 UTC assimilating (g) only GFS, (h) GFS/TRMM/IMERG/radar, and (i) GFS/H-SAF/radar data, respectively.
Environsciproc 26 00108 g003aEnvironsciproc 26 00108 g003b
Table 1. Comparison between recorded precipitation (mm) at Salamina station and the LAPS precipitation nowcasts (mm) on 30 September 2018 from 04:10 to 04:30 UTC, by assimilating only GFS, GFS/TRMM/IMERG/radar, and GFS/H-SAF/radar data.
Time (UTC)Control (GFS)GFS/TRMM/IMERG/XPOLGFS/H-SAF/XPOLSalamina
04:104.581.780.260.20
04:205.281.180.190.20
04:306.044.560.210.20
Table 2. As in Table 1, but for the recorded precipitation at Kallithea station.
Time (UTC)Control (GFS)GFS/TRMM/IMERG/XPOLGFS/H-SAF/XPOLKallithea
04:103.160.410.000.00
04:203.330.350.000.20
04:304.090.780.180.00
Table 3. Comparison between recorded precipitation (mm) at Tatoi, Elliniko, and Elefsis stations and the LAPS precipitation nowcasts (mm) on 30 September 2018 at 12:00 UTC, by assimilating only GFS, GFS/TRMM/IMERG/radar, and GFS/H-SAF/radar data.
Time (UTC)StationControl (GFS)GFS/TRMM/IMERG/RADARGFS/H-SAF/RADARRecorded 6 h Precipitation
12:00Tatoi31.8113.1012.349.0
12:00Elliniko31.562.431.810.9
12:00Elefsis32.262.602.3117.0
Disclaimer/Publisher’s Note: The statements, opinions and data contained in all publications are solely those of the individual author(s) and contributor(s) and not of MDPI and/or the editor(s). MDPI and/or the editor(s) disclaim responsibility for any injury to people or property resulting from any ideas, methods, instructions or products referred to in the content.