Next Article in Journal
Water Footprint Score: A Practical Method for Wider Communication and Assessment of Water Footprint Performance
Previous Article in Journal
Fuzzy Analytical Solution for the Case of a Semi-Infinite Unconfined Aquifer
 
 
Please note that, as of 4 December 2024, Environmental Sciences Proceedings has been renamed to Environmental and Earth Sciences Proceedings and is now published here.
Proceeding Paper

Assessment of Cyanobacterial Chlorophyll A as an Indicator of Water Quality in Two Wetlands Using Multi-Temporal Sentinel-2 Images †

1
Department of Botany, Faculty of Science, The Maharaja Sayajirao University of Baroda, Vadodara 390002, India
2
Department of Botany, Government College, Daman 396210, India
*
Author to whom correspondence should be addressed.
Presented at the 7th International Electronic Conference on Water Sciences, 15–30 March 2023; Available online: https://ecws-7.sciforum.net.
Presenter.
Environ. Sci. Proc. 2023, 25(1), 68; https://doi.org/10.3390/ECWS-7-14252
Published: 16 March 2023
(This article belongs to the Proceedings of The 7th International Electronic Conference on Water Sciences)

Abstract

:
Cyanobacteria can have a dramatic effect on the quality of water used for human activities, as reported by the World Health Organization. Remote sensing is an appropriate tool for continuous monitoring of the entire water body, given the current state of the lake. In the present study, surface water quality was evaluated using multi-temporal sentinel-2 images based on cyanobacteria’s concentration of chlorophyll a (Chl-a) and the water’s dissolved oxygen content. Chl-a was used as an indicator of cyanobacterial blooms, and dissolved oxygen was used as an indicator of water quality. Dissolved oxygen was generated using Sentinel 2 dataset. For the present study, two wetlands, Wadhwana and Timbi, in Vadodara City, Gujarat, India, were assessed from 2018 to 2022. Analysis showed that dissolved oxygen is an important environmental factor that influences cyanobacteria abundance. It was seen that the increased concentration of chlorophyll a was associated with a reduction in dissolved oxygen and hence deteriorated the water quality.

1. Introduction

Reservoirs are significant freshwater reserves that have experienced severe, negative effects that have changed their physico-chemical composition both qualitatively and quantitatively. These changes have, in turn, had an impact on the fauna and flora [1]. With the growth of industry and agriculture, there was a significant increase in the nutrient inputs into rivers and lakes, which led to the eutrophication of the water bodies [2]. Due to the readily available nutrients in lakes, algal blooms have become more frequent, intense, and widespread around the world in recent years. Information on the algal composition and dominance in a body of water can provide insight into the dynamics of toxin-producing species such as cyanobacteria. A change in the algal population can have serious environmental consequences, especially when there is an increase in harmful species. The cyanobacteria that produce cyanotoxins endanger both the aquatic ecosystem and human health. To evaluate and reduce the impact of potentially harmful species, it is crucial to monitor and model algal blooms and their composition. A significant group of organisms known as cyanobacteria are in charge of eutrophication-related environmental issues [3]. Although other factors such as water temperature, pH, light, and dissolved oxygen also have an impact on cyanobacteria reproduction, the availability of nutrients plays a major role in this process. Among the factors affecting water quality (such as pH, conductivity, nitrate nitrogen, phosphorus, etc.) dissolved oxygen (DO) levels are one of the most crucial general health indicators when evaluating aquatic ecosystems [4]. For the health of aquatic life, inland waters must maintain high DO levels. Aquatic organisms experience negative effects on metabolic activity, predation risk, and behavior when DO concentrations drop to low thresholds (below 5 mg/L) [5].
The Water Policy Framework can be improved by new technologies and methods that have been developed in recent decades. Blue-green algae or cyanobacteria in particular can be found using spectrometric sensors carried by satellites to monitor phytoplankton growth and composition [6]. Sentinel-2 data, which operates at spatial resolutions of 10 m, 20 m, and 60 m and collects data from 13 different wavelengths, is proving to be very helpful for monitoring blue-green algae blooms in aquatic environments. Based on measurements of their primary pigments Chl-a and phycocyanin, these measurement zones have interesting applications in the evaluation of phytoplankton and cyanobacteria [2,7,8,9,10]. Temperature is another crucial indicator of water quality that can be determined using satellite imagery in addition to dissolved oxygen measurement.
An earlier investigation revealed that human activity is to blame for the decline in Wadhwana’s water quality [11]. Therefore, the purpose of this study was to estimate chlorophyll a using multi-temporal Sentinel-2 data along with dissolved oxygen and temperature to comprehend the current water quality of two wetlands in the Vadodara District.

2. Study Area

Vadodara is a city in the state of Gujarat. It is 39 meters above mean sea level and can be located at 22°17′59″ North Latitude and 73°15′18″ East Longitude. The Wadhwana Reservoir was constructed in 1910 in what is now Vadodara, formerly known as the Baroda State. The Wadhwana Wetland (Figure 1), in the Dabhoi taluka, is one of the Ramsar sites and is well known among bird watchers in the state. On a global scale, the wetland is significant for its bird life because it provides a wintering habitat for migratory waterbirds, including more than 80 species that migrate along the Central Asian flyway. The middle of winter in 2020 saw the completion of a waterbird census, which counted about 46,000 different species. The wetland serves as an international example of how a wetland originally developed for irrigation has evolved into an important habitat for water birds and a center for ecotourism and nature education. The wetland is used as a global illustration of how a wetland that was initially developed for irrigation has transformed into an essential water bird habitat and a hub for ecotourism and nature education.
Following Wadhwana, Lake Timbi is the largest lake. It attracts many migratory birds. However, both wetlands are under threat from large amounts of irrigation water and other industrial wastewater. Consequently, the aquatic life in these wetlands is in danger.

3. Materials and Methodology

In this investigation, measurements and water samples were collected in April 2018. Random sampling was used to gather samples from various locations in the wetlands of Wadhwana and Timbi. Dissolved Oxygen was extracted following the standard procedure by the American Public Health Association [12].

Data

Sentinel-2
Free sentinel data were accessed from Copernicus open access hub (https://scihub.copernicus.eu/, accessed on 22 November 2022) and provided the free Sentinel-2 data (Level 2A product reflectance) used in the current study, which covered the period from January 2018 to December 2022. The data were resampled to a resolution of 10 m. The images were stacked and used for additional processing.
Landsat-8/9
From January 2018 to December 2022, the Landsat 8/9 OLI were downloaded (http://earthexplorer.usgs.gov, accessed on 22 November 2022). Bands 10 and 11 are available in the TIR region on the Landsat 8 TIRS sensor. These thermal bands have a native spatial resolution of 100 m but were resampled and released by USGS at 30m. Digital Numbers (DC) were converted to Top of Atmosphere (TOA) reflectance using radiometric coefficients contained in the metadata. Using Jiménez-Muoz et al. algorithm, the TOA bands were converted into brightness temperatures, and the water surface temperature was generated [13].

4. Results

4.1. Retrieval Method of Chlorophyll A Concentration

By utilizing an empirical chlorophyll model created by Mishra and Mishra (2012), pre-processed Sentinel-2 images were used to derive the normalized differential chloro-phyll index (NDCI). Because of backscattering and Chl-a absorption, these bands are most vulnerable to reflection. The spectral difference between bands 665 and 705 is used to calculate NDCI, which is then normalized by the sum of those two bands.
N D C I = 705 665 705 + 665
Further, Chl-a was quantified using following equation as modelled by Kravitz et al. 2020
C h l a m g m 3 = 17.441 e ( 4.7038 × N D C I )
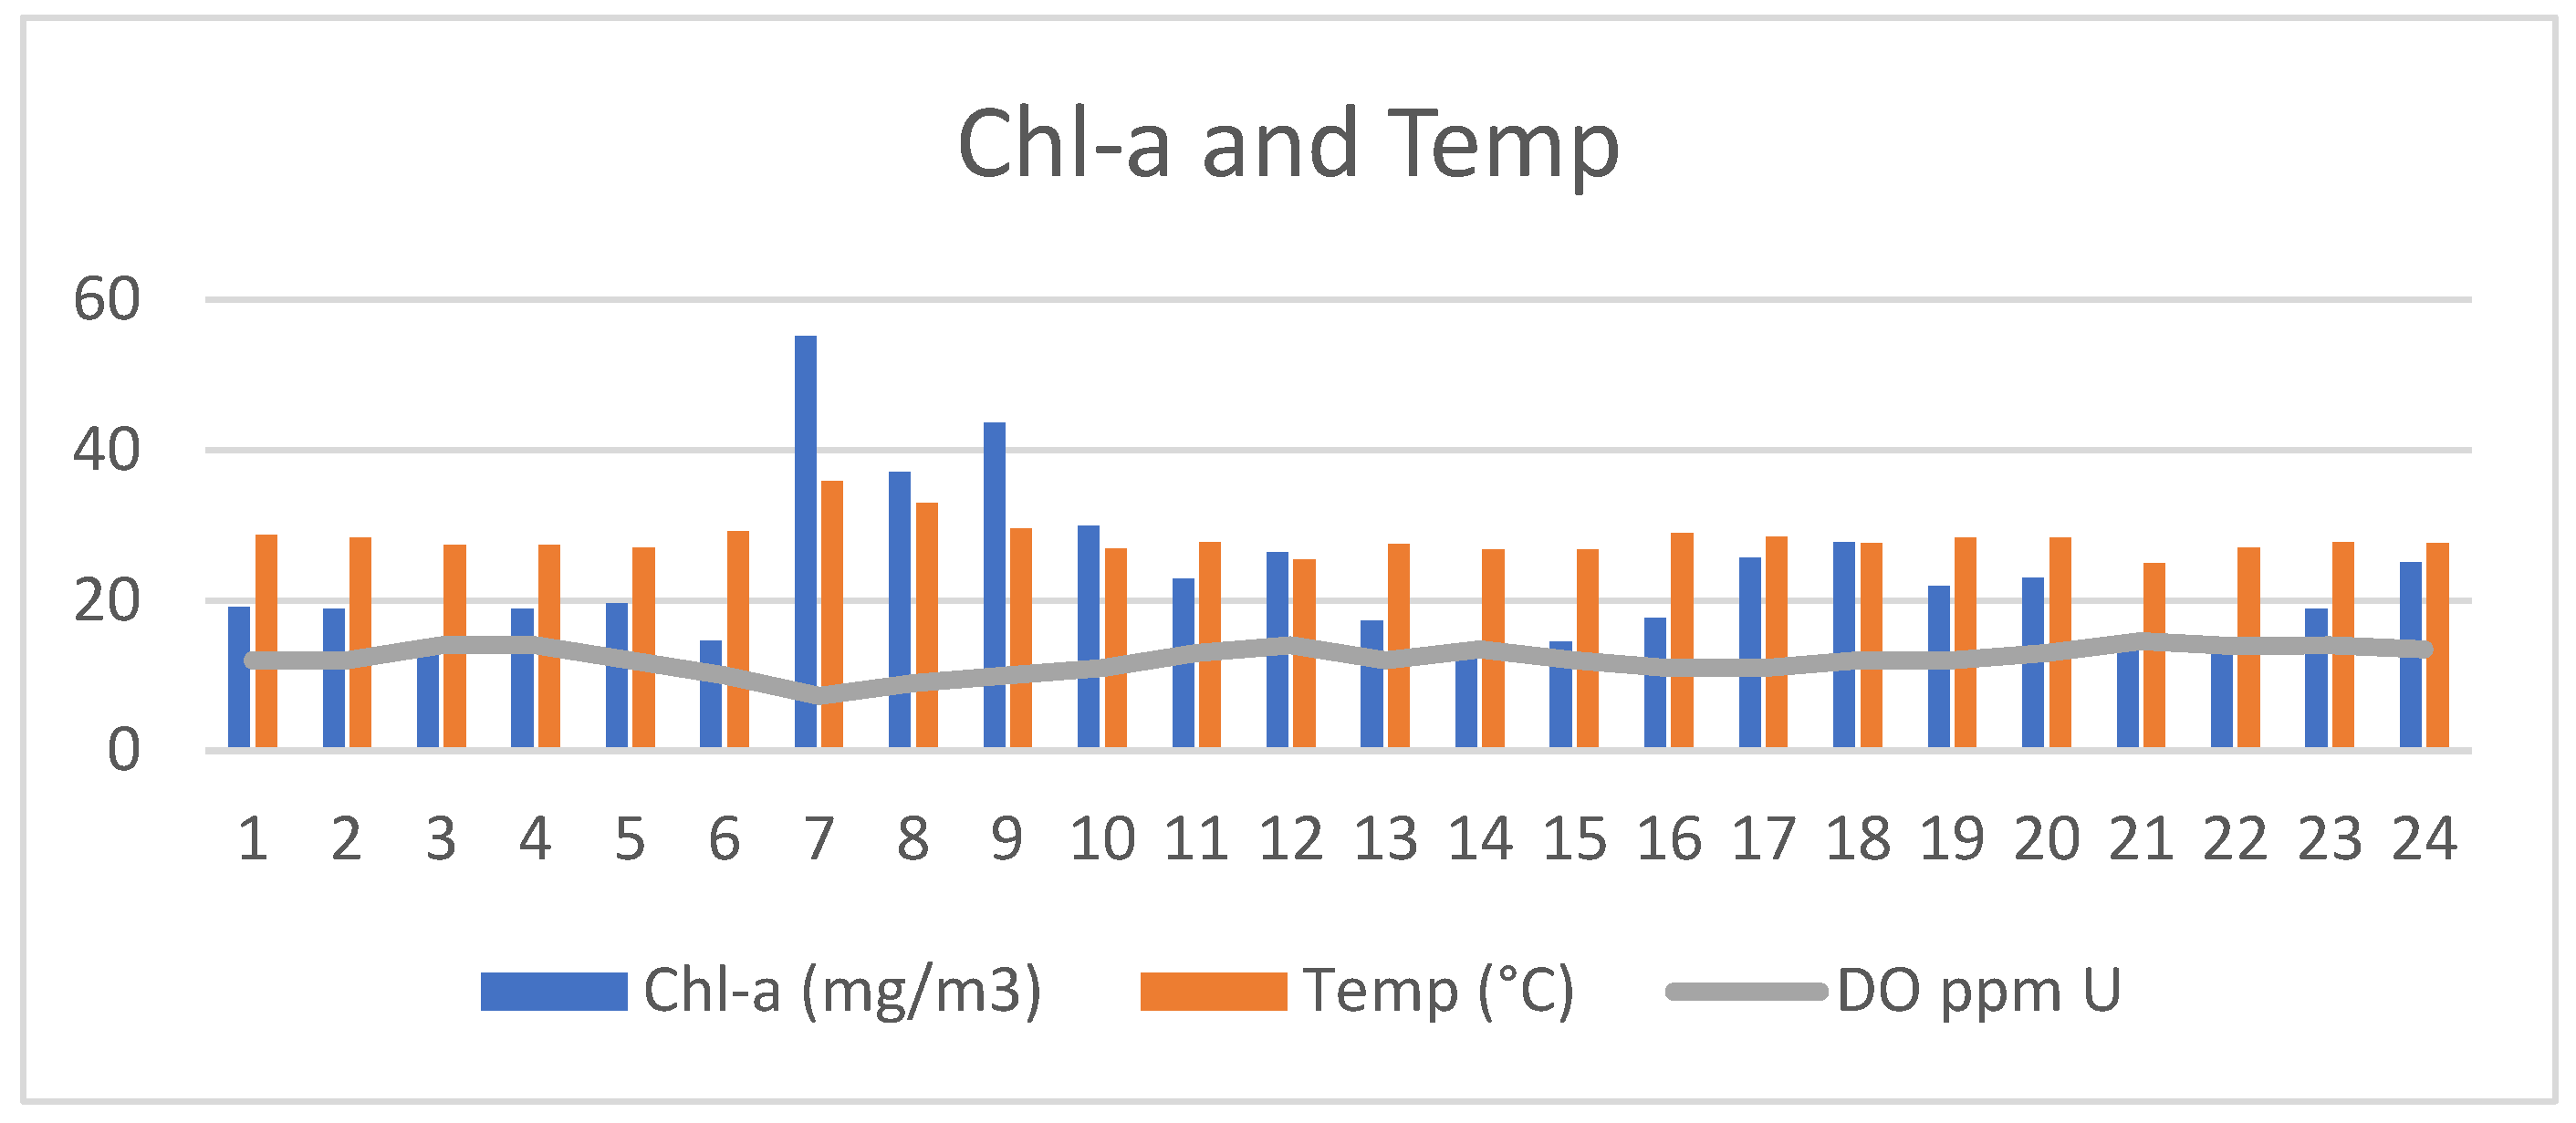
Based on the data coordinates, the values for LST and chlorophyll a from the image bands of the relevant locations were determined (Figure 2). The values were used for further analysis and derivation of dissolved oxygen.

4.2. Dissolved Oxygen (DO)

The sampling data from Wadhwana and Timbi Wetlands in April 2018 matched the Sentinel-2 image. This resulted in 24 in situ water sample matches on 18th April 2018. The in situ DO values ranged from 7.0 to 13.5 ppm in the Wadhwana wetland, while it ranged from 11 to 14.6 ppm in the Timbi Wetland. Field derived DO was further investigated for its relationship with Chl-a and temperature.

4.3. Analysis for Water Quality of Wadhwana and Timbi Wetland

The Chl-a and temperature data for June, 2018 were utilized with field generated dissolved oxygen were used.
From Table 1, correlation between DO and chlorophyll a (Chl-a) shows −0.7204. This means that there is a strong inverse relationship between Chl-a and DO. R-squared (R2) equals 0.519. Dissolved oxygen and chlorophyll a are correlated and closely related, since a decrease in dissolved oxygen leads to an increased quantity of algae (chlorophyll a) in wetlands [14]. The correlation between DO and temperature shows −0.8478. This means that there is a very strong inverse relationship between temperature and DO R-Squared (R2) equals 0.72. According to the results of multiple linear regressions, there is a very strong overall significant relationship between Chl-a, temperature, and DO (F(2,21) = 28.98, p and <0.001, R2 = 0.73, R2 adj = 0.71). R-squared (R2) is 0.734071. The multiple correlation coefficient (R) is 0.85. This indicates that the predicted and observed data are highly correlated. The squared R-adjusted value is 0.71.

4.4. Predictive Models for Water Quality of Wadhwana and Timbi Wetland

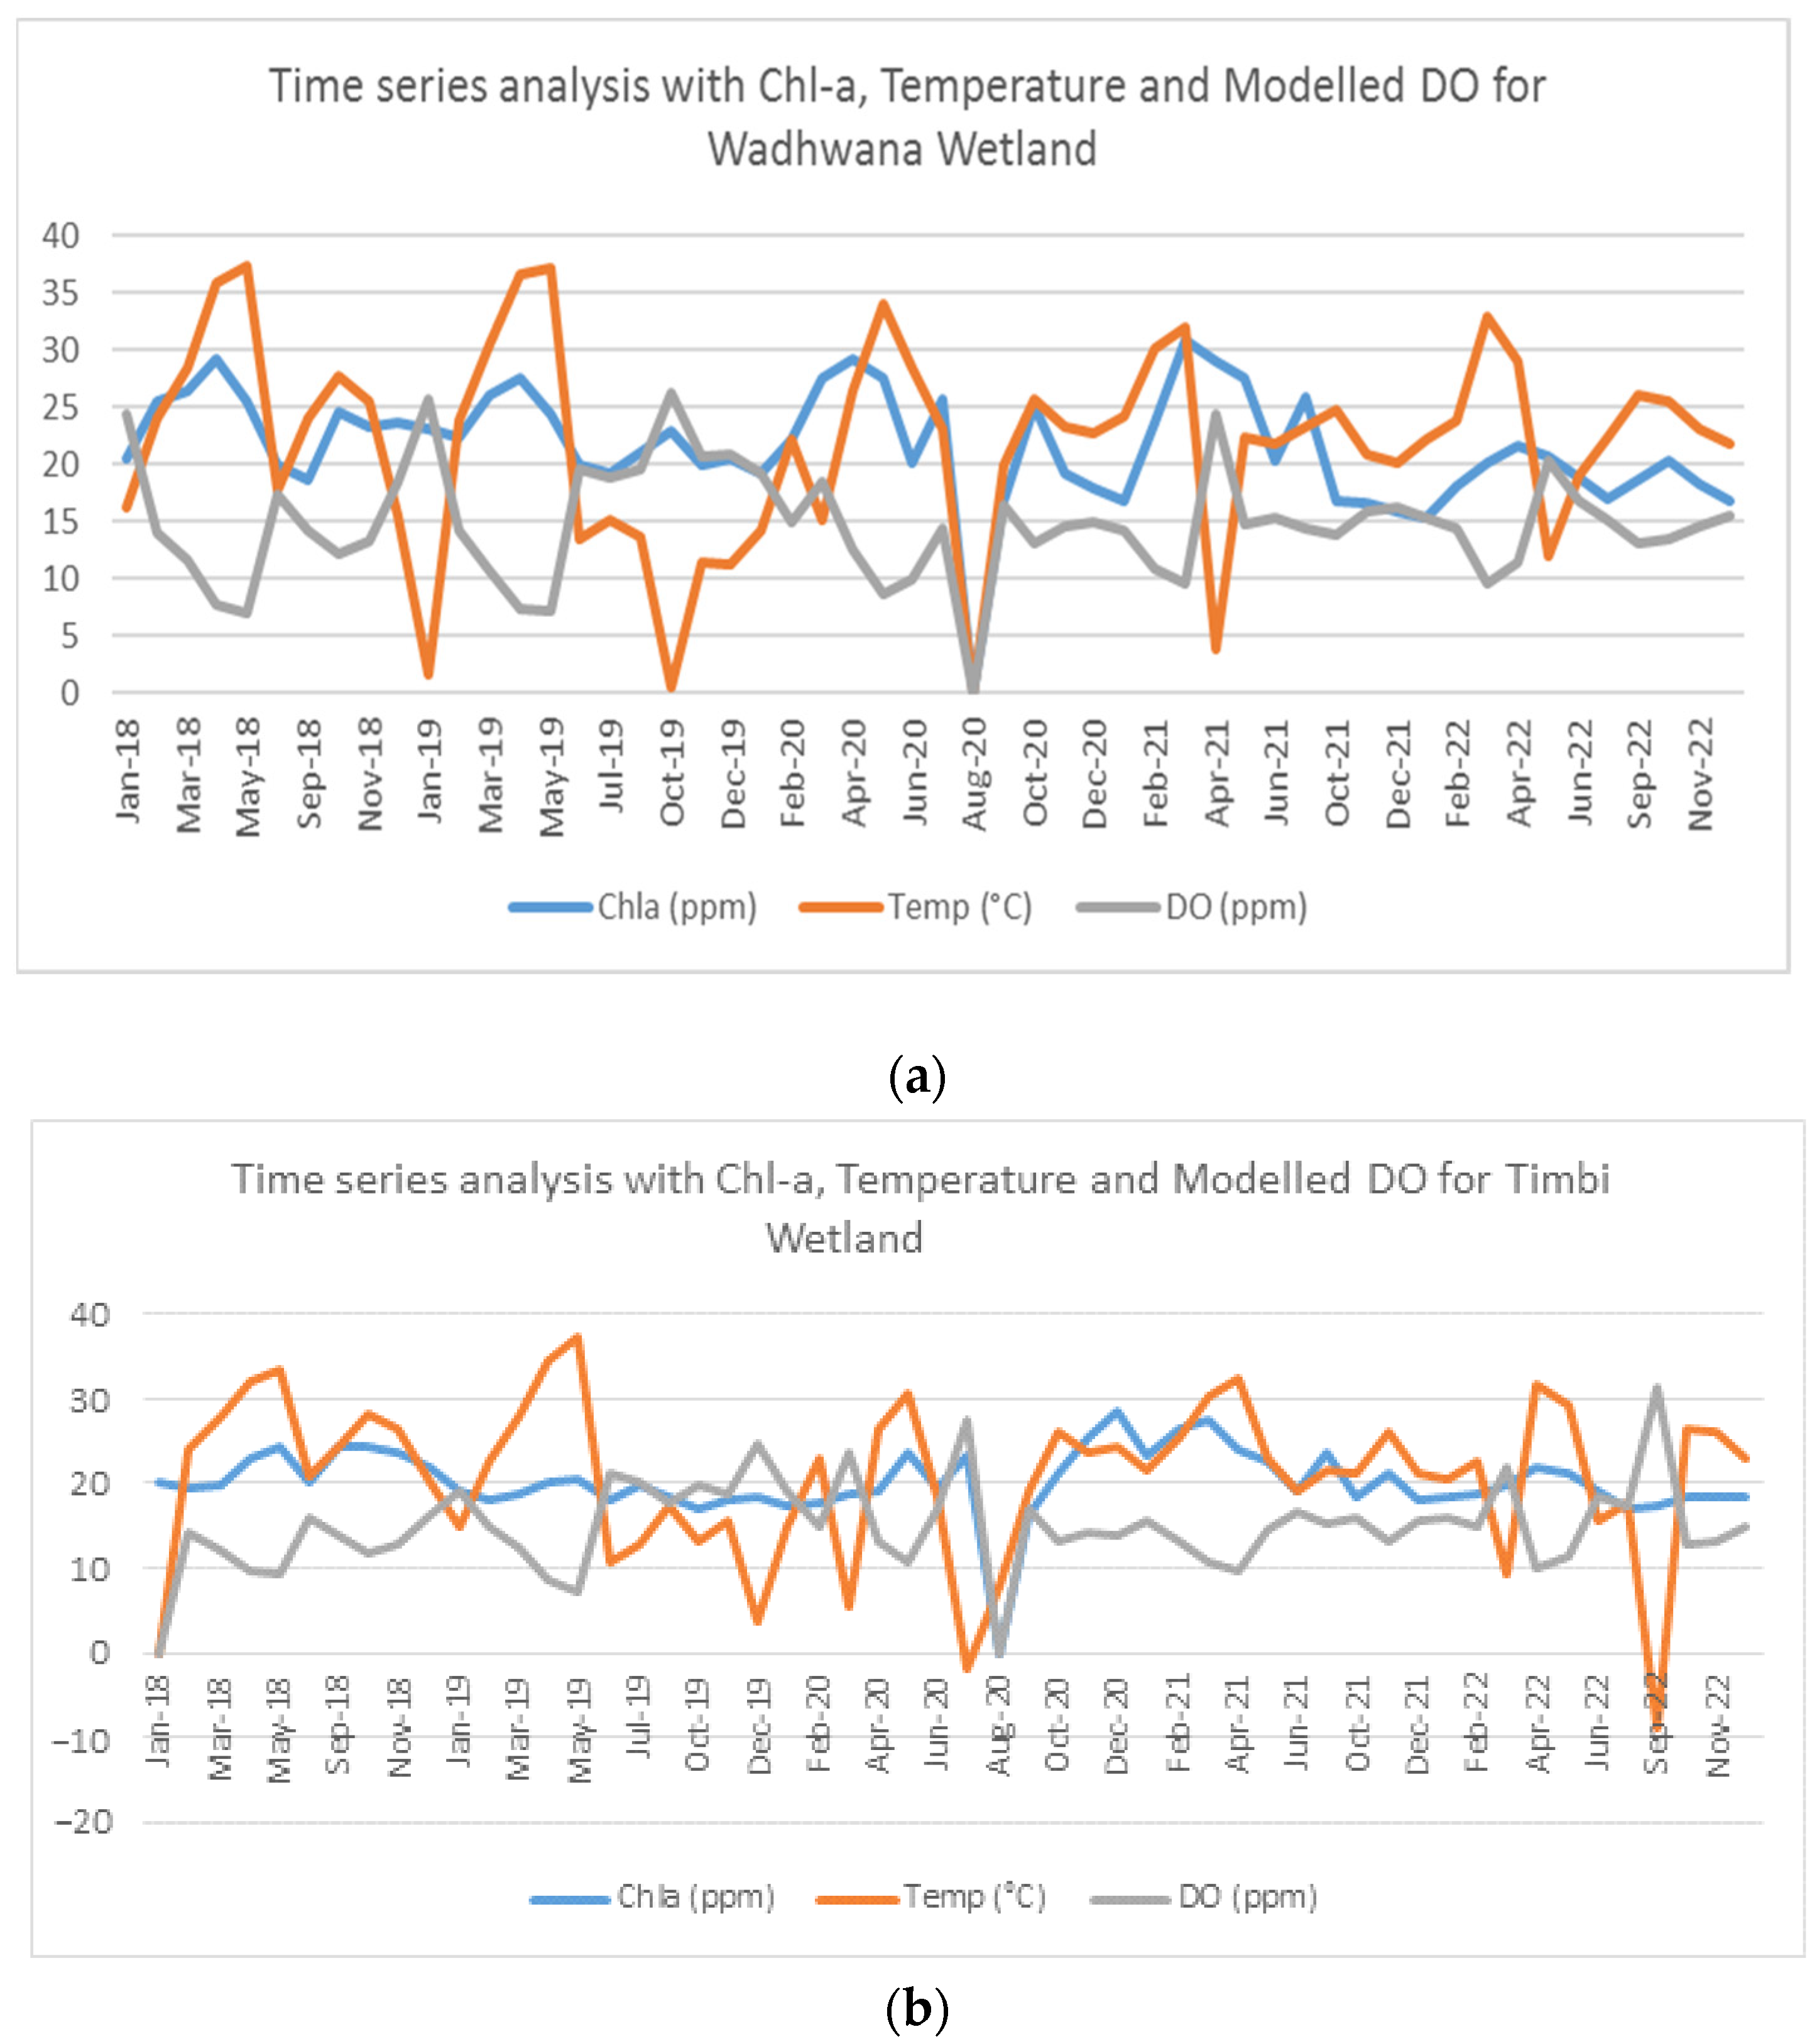
A comparison of time series data from 2018 to 2022 for the Wadhwana (Figure 3a) and Timbi (Figure 3b) was performed to verify the proposed MLR model’s accuracy. The correlation values between Sentinel-2 DO and Chl-a, as well as between the Sentinel-2 DO and temperature, were measured and the test results exceeded 0.6 and 0.89, respectively. Figure 3a,b shows the simulation results in comparison to the measurements. Data prediction by the model was successful. The results of all simulations are good and reasonable when measurement errors and spatiotemporal variations are taken into account. The RMSE for each variable ranges from 0.6 and 1.24.
The Multiple Linear Regression model could effectively simulate interannual dynamics. This model depicts the temporal trend of chlorophyll a with DO and temperature as shown in Figure 3. Increased algal blooms in wetlands and rising temperatures resulted in significant decreases in oxygen, which had far more detrimental effects on the lake’s ecosystem than a decrease in algal blooms. Time series data (Figure 3) showing that during the summer months, i.e., as temperatures rose in March–May 2018–2020, dissolved oxygen levels were found to be low and chlorophyll levels high. A significant algal bloom was observed in the Ramsar Wadhwana wetland in 2021/2022, preceded by March to February. Timbi Wetland, which followed a similar pattern, showed a shift in high temperatures from March to February 2021. From these results, it is evident that the concentration of oxygen-consuming algae always increased after the concentration of dissolved oxygen decreased when compared to the concentration of chlorophyll a. In both wetland types, dissolved oxygen was an indicator that could be used to interpret chlorophyll a levels. The chlorophyll a measurement is necessary because it shows the level of eutrophication that could endanger reservoirs around the world.

5. Conclusions

Based on the findings of this research, Sentinel-2 data could be used effectively to accurately map dissolved oxygen levels in wetlands such as the Timbi and Wadhwana Ramsar sites. Accurate mapping of DO, an indicator of water quality parameters, can be used to provide a complete picture of the variability in algal blooms (chlorophyll a) concentrations due to their significant impact on water quality status.

Author Contributions

This research article has been written by two authors: A.M. and U.P.; A.M. involved in data downloading, processing and analysis, draft preparation, review and editing; U.P. in draft paper and review. All authors have read and agreed to the published version of the manuscript.

Funding

This research received no external funding.

Institutional Review Board Statement

Not applicable.

Informed Consent Statement

Not Applicable.

Data Availability Statement

This study used Sentinel-2 multispectral imagery that is publicly available at https://scihub.copernicus.eu/ (accessed on 22 November 2022) and Landsat-8 multispectral imagery that is publicly available at http://earthexplorer.usgs.gov (accessed on 22 November 2022).

Conflicts of Interest

The authors declare no conflict of interest.

References

  1. Viso-Vázquez, M.; Acuña-Alonso, C.; Rodríguez, J.L.; Álvarez, X. Remote Detection of Cyanobacterial Blooms and Chlorophyll-a Analysis in a Eutrophic Reservoir Using Sentinel 2. Sustainability 2021, 13, 8570. [Google Scholar] [CrossRef]
  2. Zhao, C.S.; Shao, N.F.; Yang, S.T.; Ren, H.; Ge, Y.R.; Feng, P.; Dong, B.E.; Zhao, Y. Predicting cyanobacteria bloom occurrence in lakes and reservoirs before blooms occur. Sci. Total Environ. 2019, 670, 837–848. [Google Scholar] [CrossRef] [PubMed]
  3. Dalu, T.; Wasserman, R.J. Cyanobacteria dynamics in a small tropical reservoir: Understanding spatio-temporal variability and influence of environmental variables. Sci. Total Environ. 2018, 643, 835–841. [Google Scholar] [CrossRef] [PubMed]
  4. Kauppila, P.; Meeuwig, J.J.; Pitkänen, H. Predicting oxygen in small estuaries of the Baltic Sea: A comparative approach Estuar. Coast Shelf Sci. 2003, 57, 1115–1126. [Google Scholar] [CrossRef]
  5. Sand-Jensen, K.; Møller, C.L.; Borum, J. High resistance of oligotrophic isoetid plants to oxic and anoxic dark exposure. Freshw. Biol. 2015, 60, 1044–1051. [Google Scholar] [CrossRef]
  6. Sòria-Perpinyà, X.; Vicente, E.; Urrego, P.; Pereira-Sandoval, M.; Ruíz-Verdú, A.; Delegido, J.; Soria, J.M.; Moreno, J. Remote sensing of cyanobacterial blooms in a hypertrophic lagoon (Albufera of València, Eastern Iberian Peninsula) using multitemporal Sentinel-2 images. Sci. Total Environ. 2020, 698, 134305. [Google Scholar] [CrossRef] [PubMed]
  7. Kravitz, J.; Matthews, M.; Bernard, S.; Griffith, D. Application of Sentinel 3 OLCI for chl-a retrieval over small inland water targets: Successes and challenges. Remote Sens. Environ. 2020, 237, 111562. [Google Scholar] [CrossRef]
  8. Kutser, T.; Paavel, B.; Verpoorter, C.; Ligi, M.; Soomets, T.; Toming, K.; Casal, G. Remote Sensing of Black Lakes and Using 810 nm Reflectance Peak for Retrieving Water Quality Parameters of Optically Complex Waters. Remote Sens. 2016, 8, 497. [Google Scholar] [CrossRef]
  9. Maltese, A.; Capodici, F.; Ciraolo, G.; Corbari, C.; Granata, A.; La Loggia, G. Planktothrix Rubescens in Freshwater Reservoirs: The Sentinel-2 Potentiality for Mapping Phycocyanin Concentration. In Proceedings of the First Sentinel-2 Preparatory Symposium, Frascati, Italy, 23–27 April 2012; Volume 707, p. 37. [Google Scholar]
  10. Mishra, S.; Mishra, D.R. Normalized difference chlorophyll index: A novel model for remote estimation of chlorophyll-a concentration in turbid productive waters. Remote Sens. Environ. 2012, 117, 394–406. [Google Scholar] [CrossRef]
  11. Kiran, G.S.; Joshi, U.B.; Padate, G.; Joshi, A.G. Preliminary investigation of the water quality of Wadhwana reservoir, Gujarat, India: A case study. Bull. Environ. Sci. Res. 2012, 1, 9–13. [Google Scholar]
  12. APHA. Standard Methods for Examination of Water and Waste Water, 20th ed.; APHA, AWAA, WPCF: Washington, DC, USA, 1998. [Google Scholar]
  13. Jiménez-Muñoz, J.C.; Sobrino, J.A.; Skoković, D.; Mattar, C.; Cristóbal, J. Land Surface Temperature Retrieval Methods from Landsat-8 Thermal Infrared Sensor Data. IEEE Geosci. Remote Sens. Lett. 2014, 11, 1840–1843. [Google Scholar] [CrossRef]
  14. Ismail, K.; Boudhar, A.; Abdelkrim, A.; Mohammed, H.; Mouatassime, S.; Kamal, A.O.; Driss, E.; Idrissi, E.A.; Nouaim, W. Evaluating the potential of Sentinel-2 satellite images for water quality characterization of artificial reservoirs: The Bin El Ouidane Reservoir case study (Morocco). Meteorol. Hydrol. Water Manag. 2019, 7, 31–39. [Google Scholar] [CrossRef]
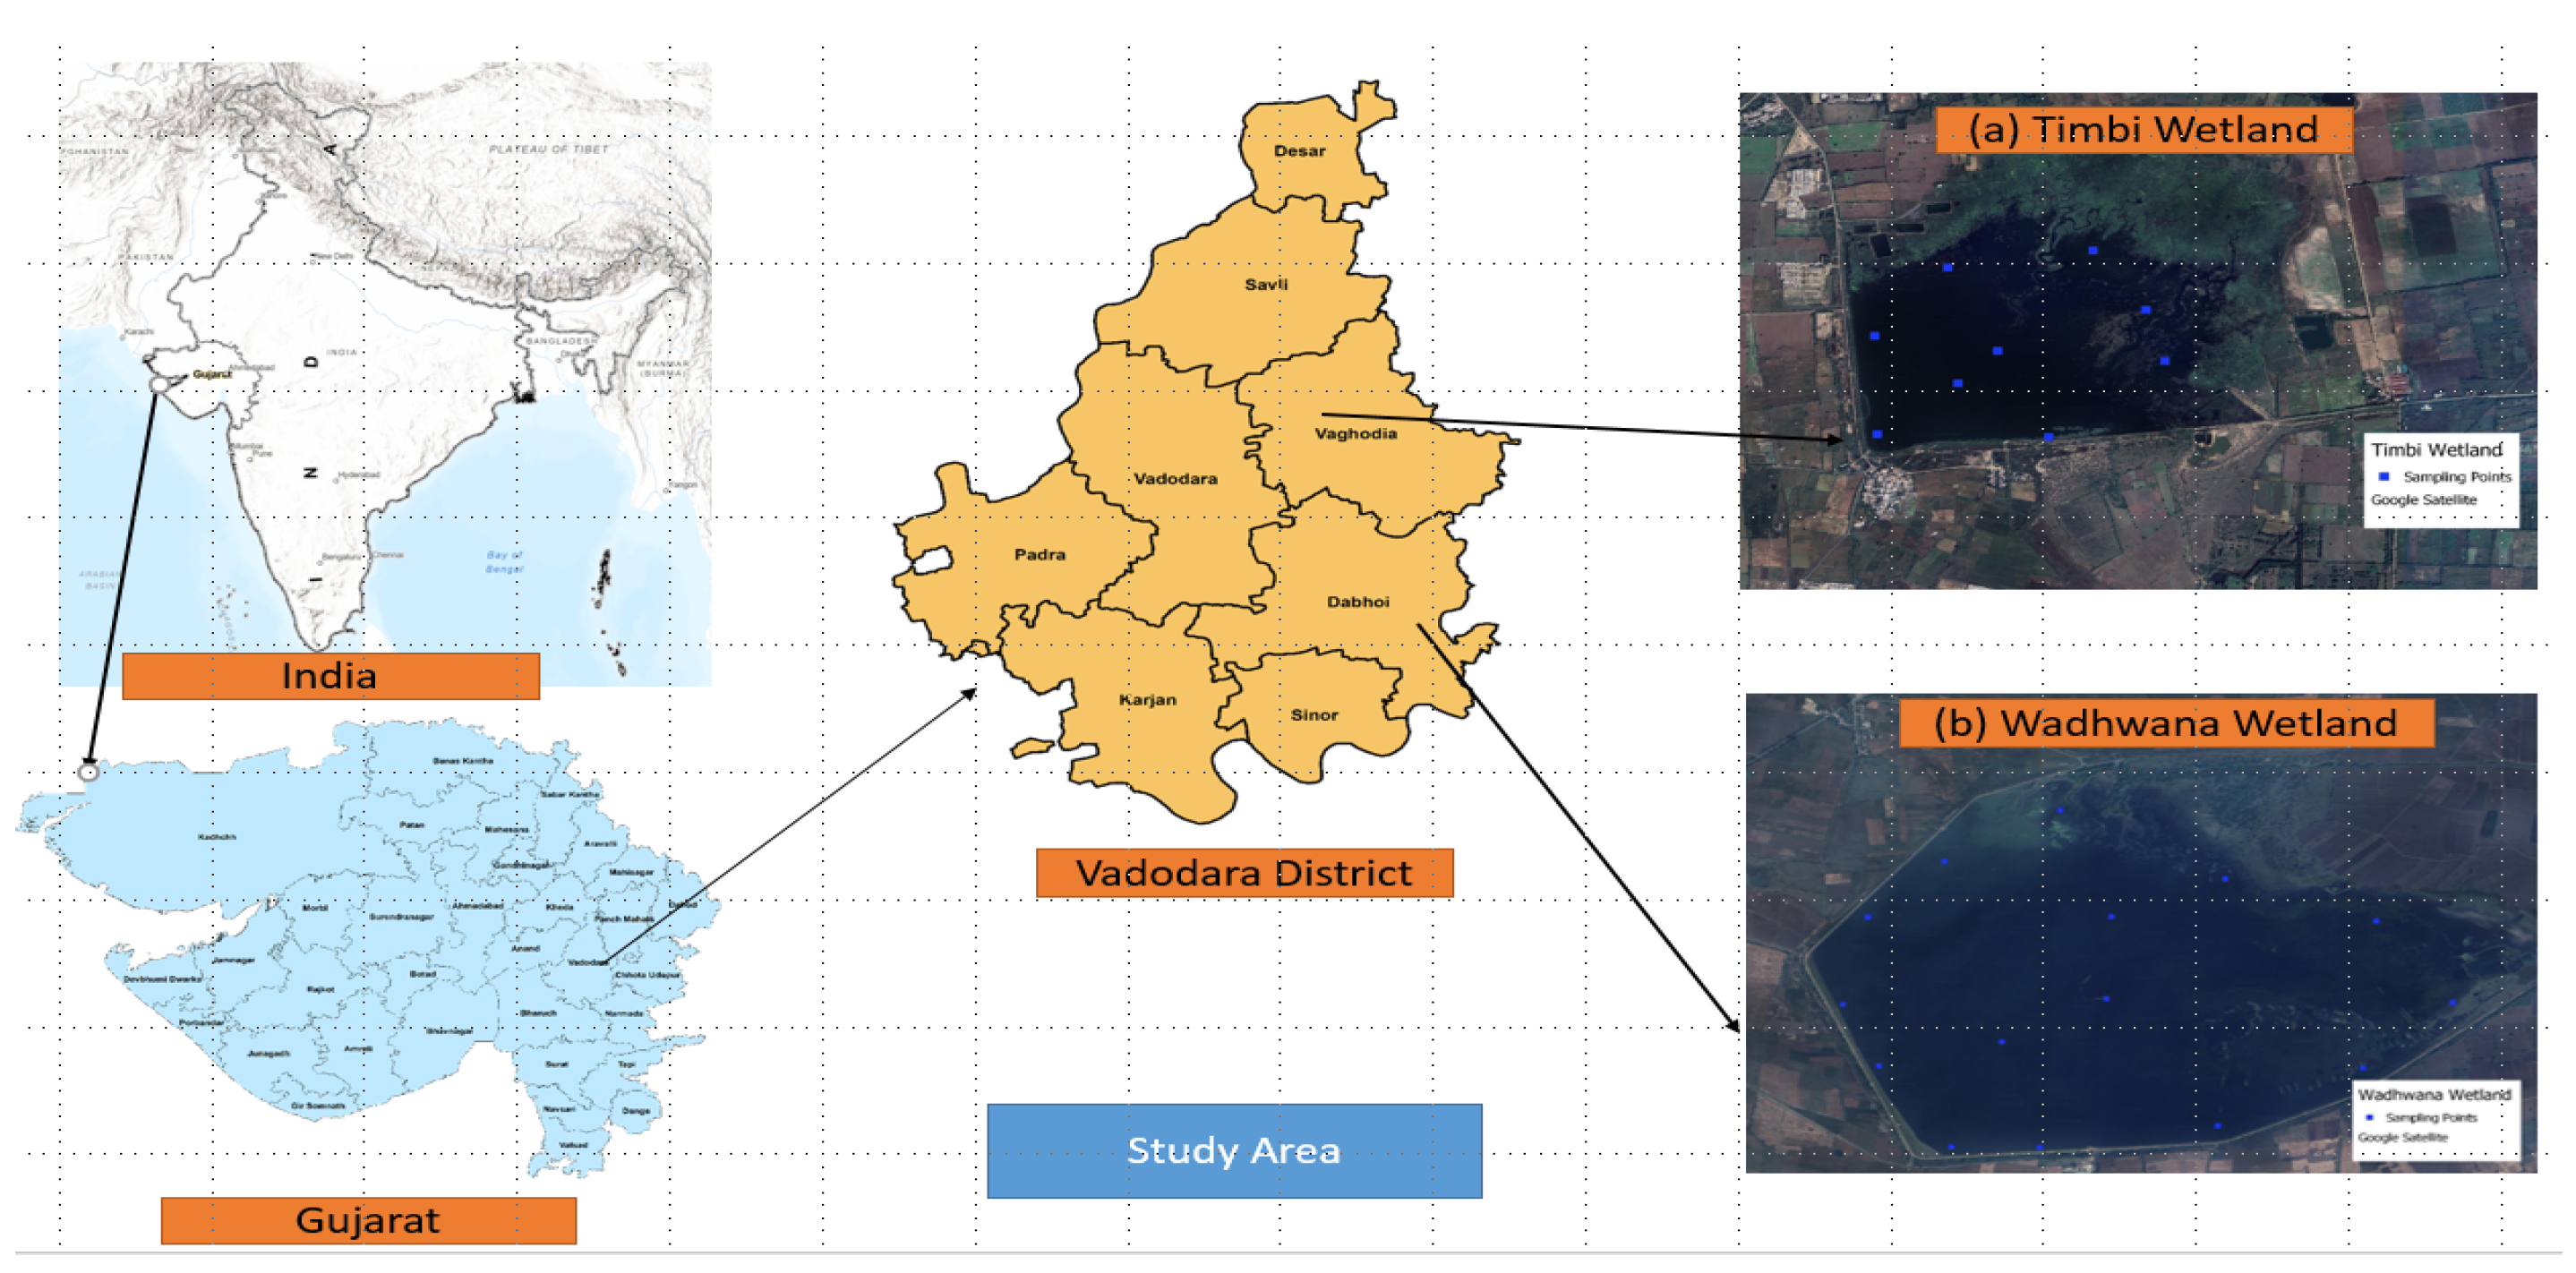
Figure 1. Study area (a) Timbi wetland in Waghodia Taluka and (b) Ramsar site- Wadhwana Wetland.
Environsciproc 25 00068 g001
Figure 2. Satellite derived chlorophyll a and temperature along with in situ DO in the Study area.
Environsciproc 25 00068 g002
Figure 3. Time series analysis with Chl-a, temperature and modelled DO for (a) Wadhwana wetland (b) Timbi Wetland.
Environsciproc 25 00068 g003
Table 1. Relationship between Chla, Dissolved Oxygen and temperature in Wadhwana and Timbi Wetlands.
Regression ModelEmpirical EquationR2R
Chl-a and DODO = 15.0403 − 0.1271 Chla0.52−0.72
Temperature and DODO = 31.364 − 0.6834 Temp0.72−0.85
MLR with Chl-a, DO and TemperatureDO = 28.902228 − 0.0332848 Chl-a − 0.56885 Temp0.730.71
Disclaimer/Publisher’s Note: The statements, opinions and data contained in all publications are solely those of the individual author(s) and contributor(s) and not of MDPI and/or the editor(s). MDPI and/or the editor(s) disclaim responsibility for any injury to people or property resulting from any ideas, methods, instructions or products referred to in the content.