Groundwater Quality Assessment and Evaluation of Scaling and Corrosiveness Potential of Drinking Water Samples †
Abstract
1. Introduction
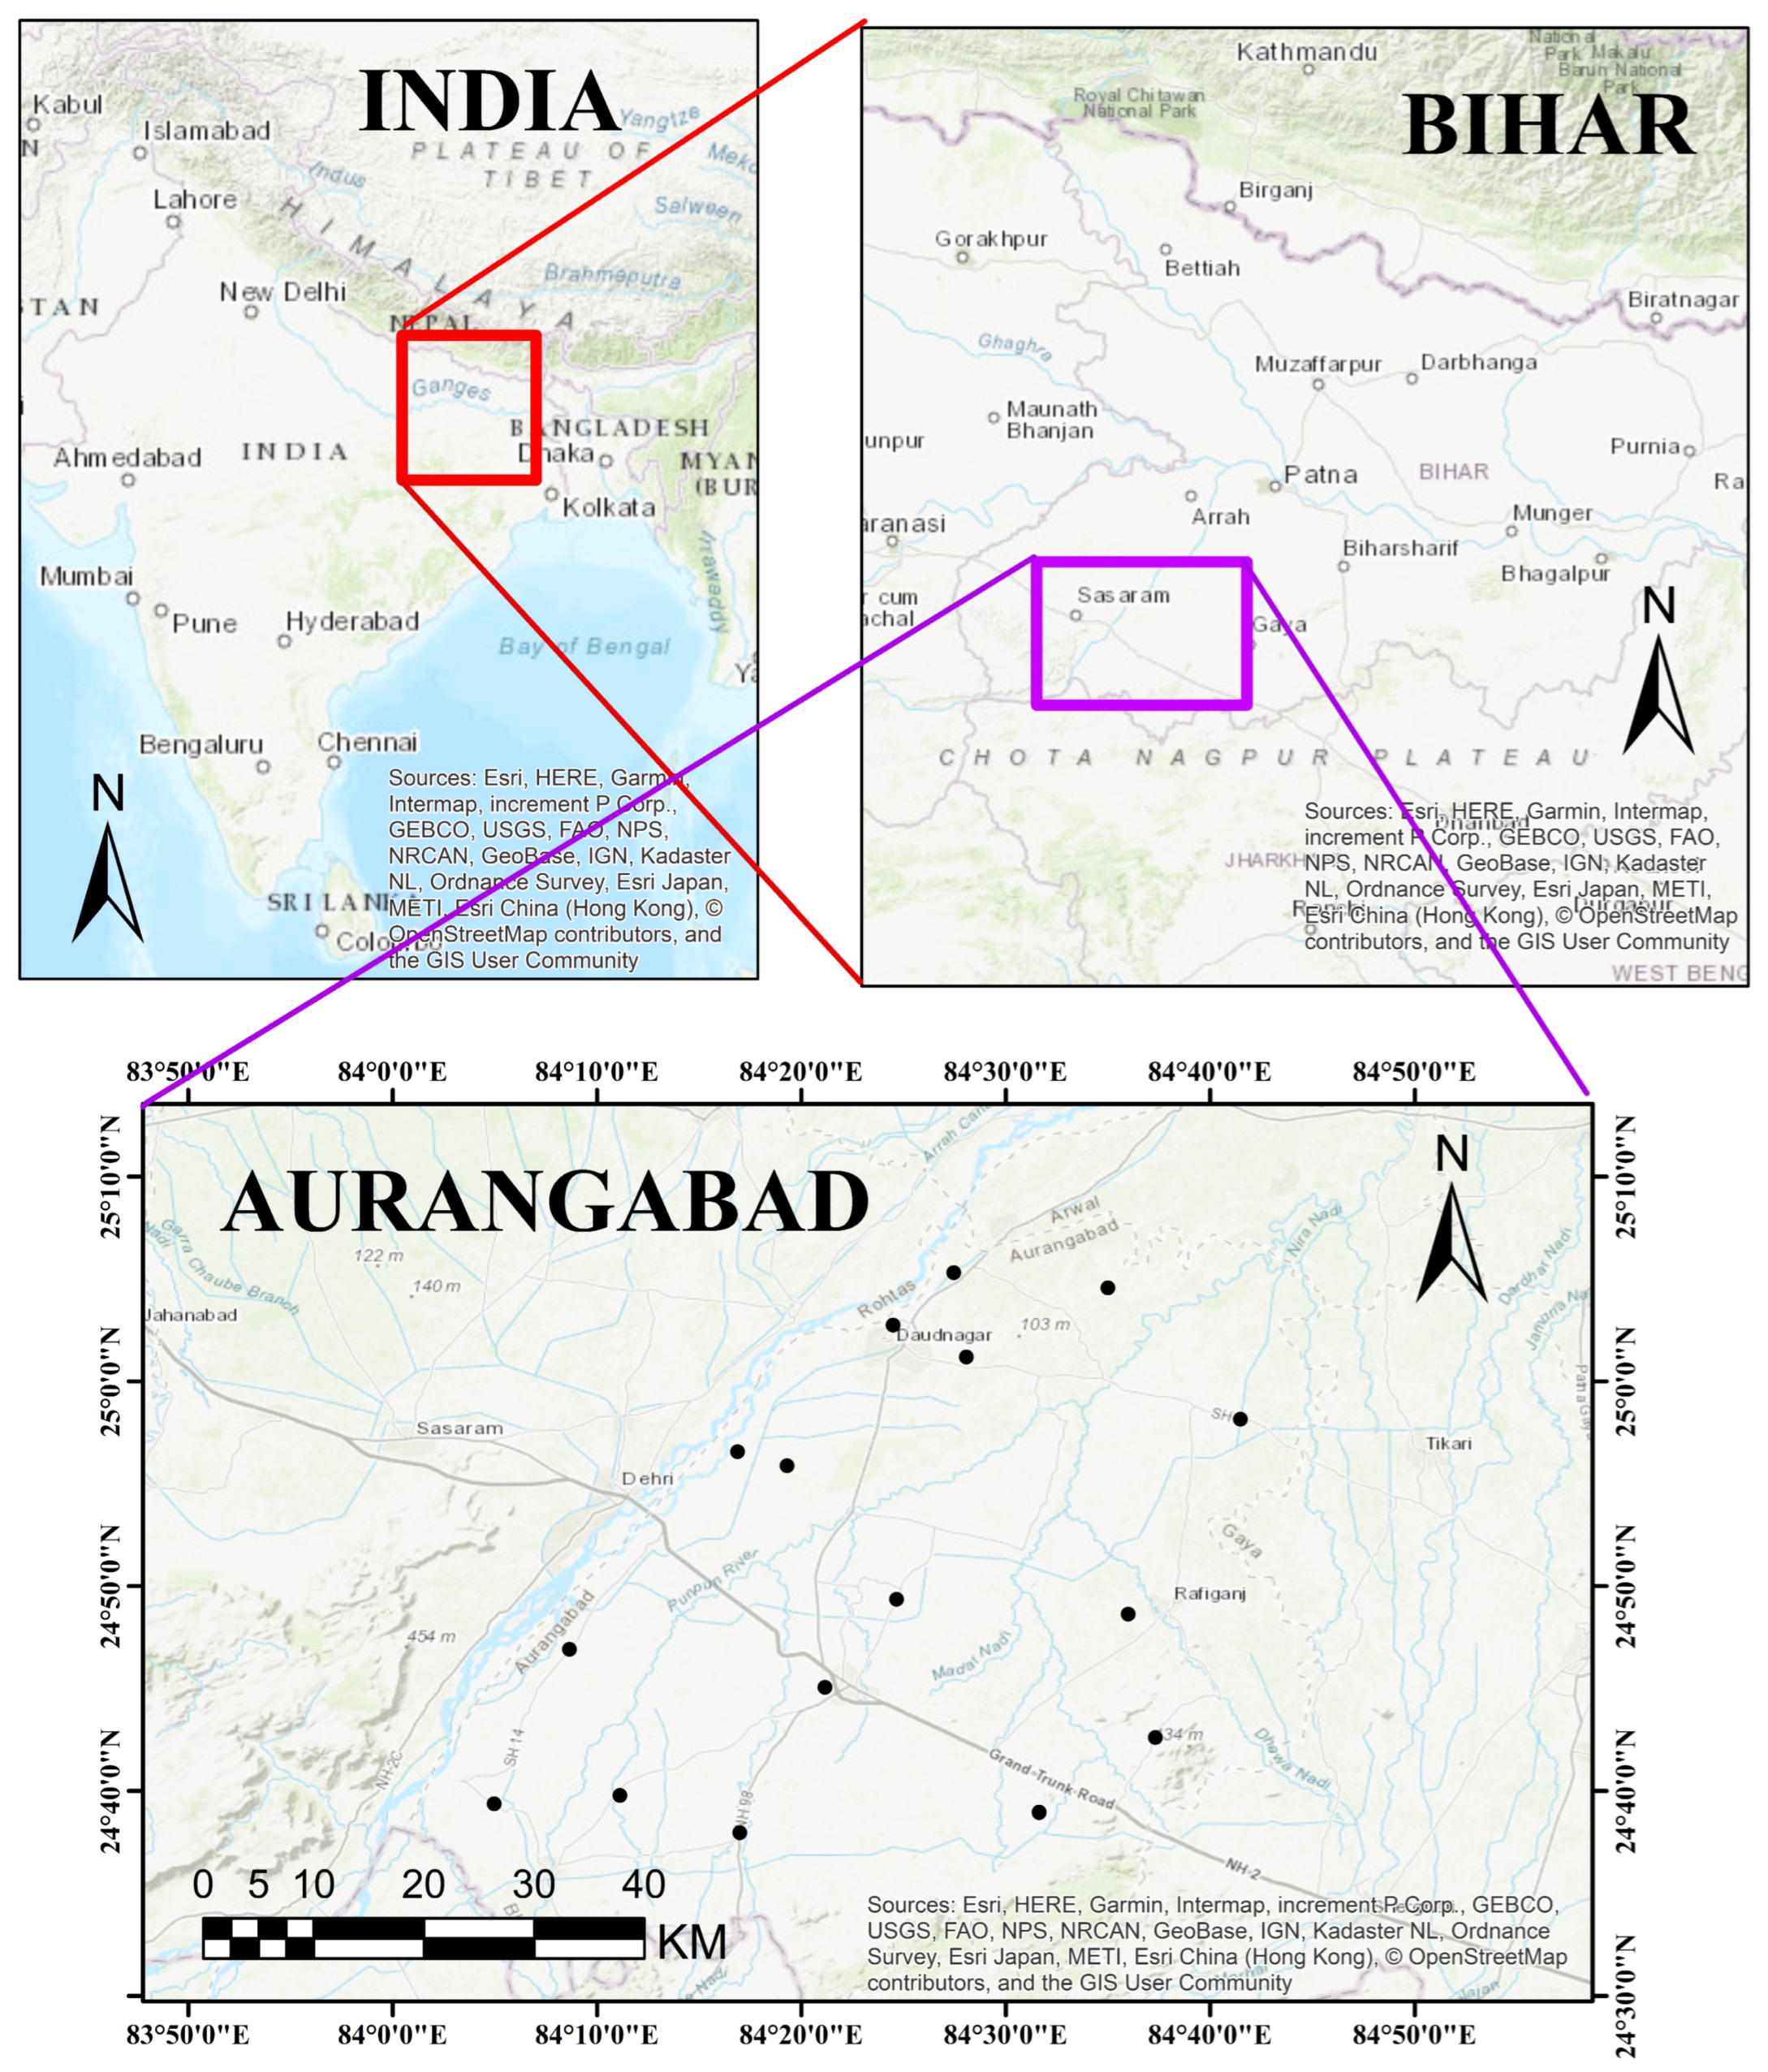
2. Study Area
3. Materials and Methods
3.1. Sampling and Data Analysis
3.2. Determination of Water Quality Index
3.3. Determination of Corrosiveness Indices
4. Results and Discussion
4.1. Physicochemical Analysis
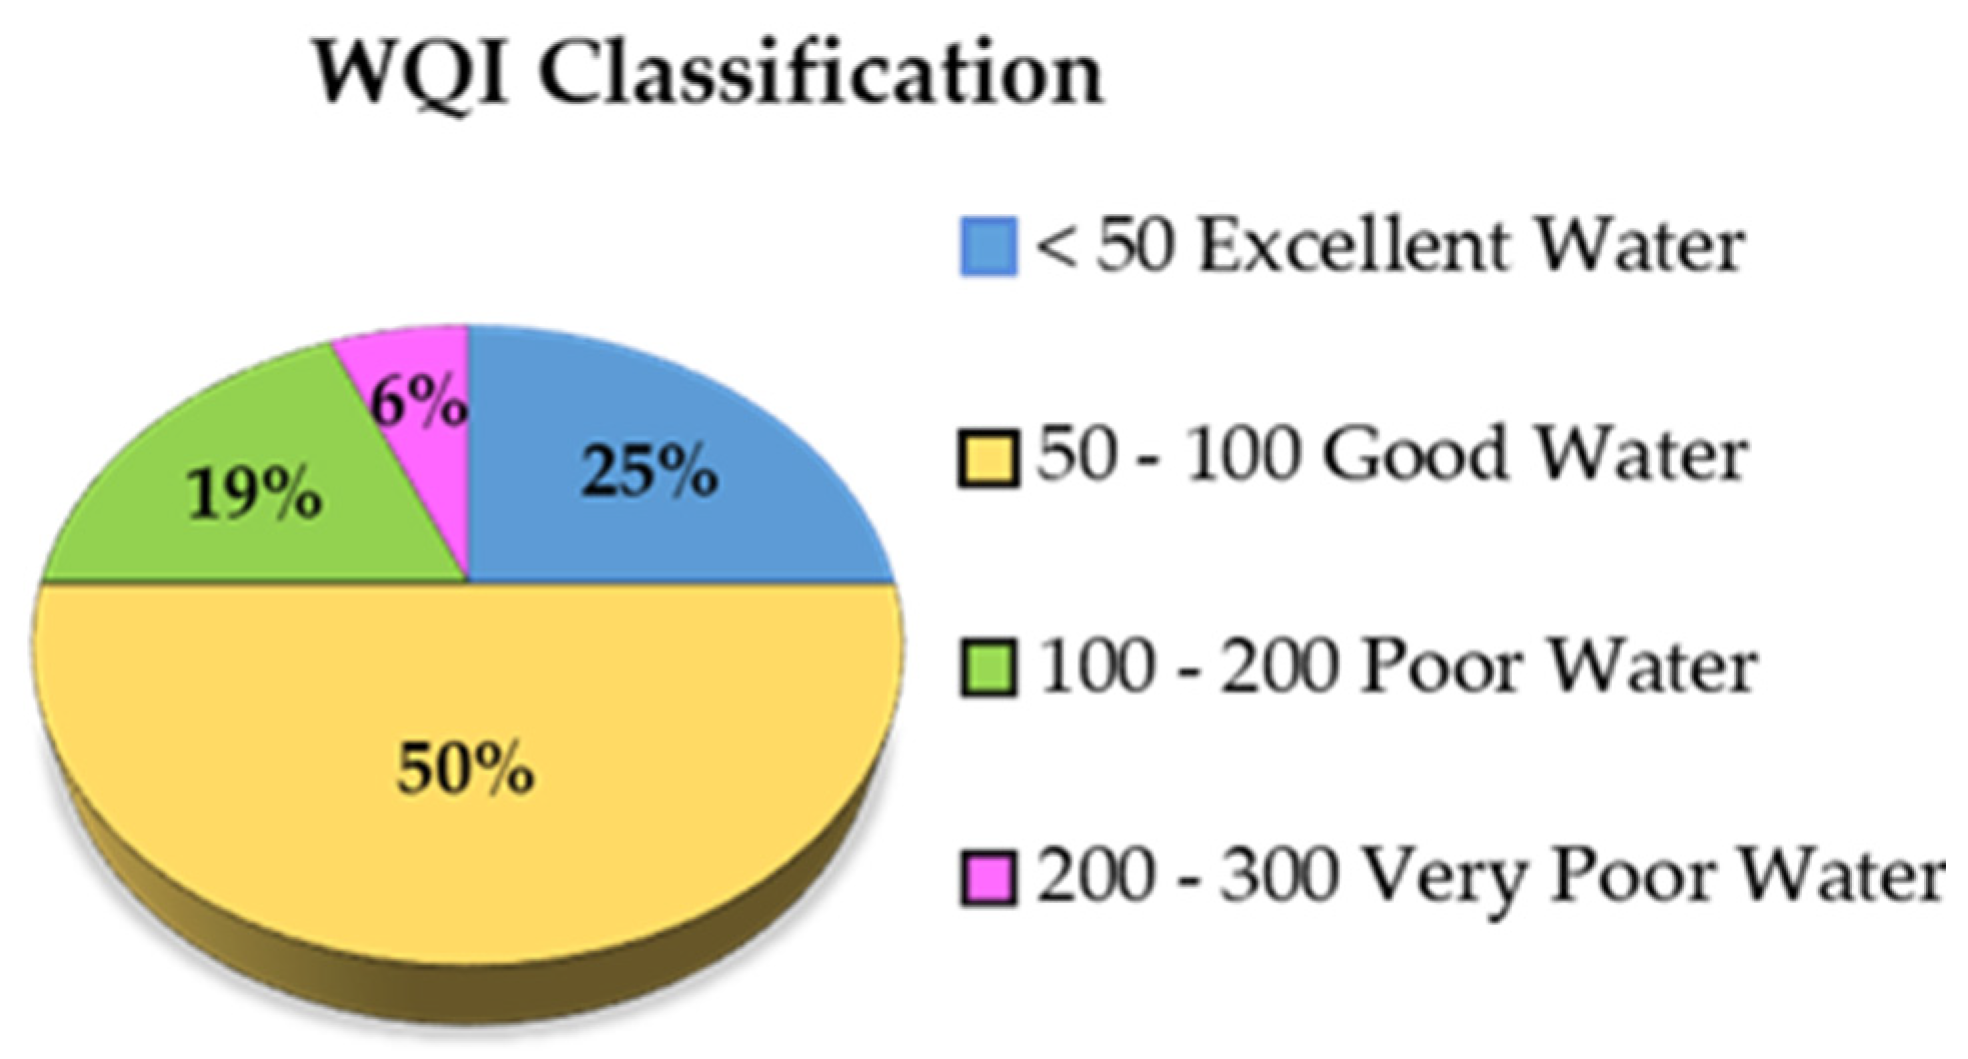
4.2. Water Quality Analysis
4.3. Corrosiveness Potential of Water Samples
4.3.1. Langelier Saturation Index (LSI)
4.3.2. Ryznar Stability Index (RSI)
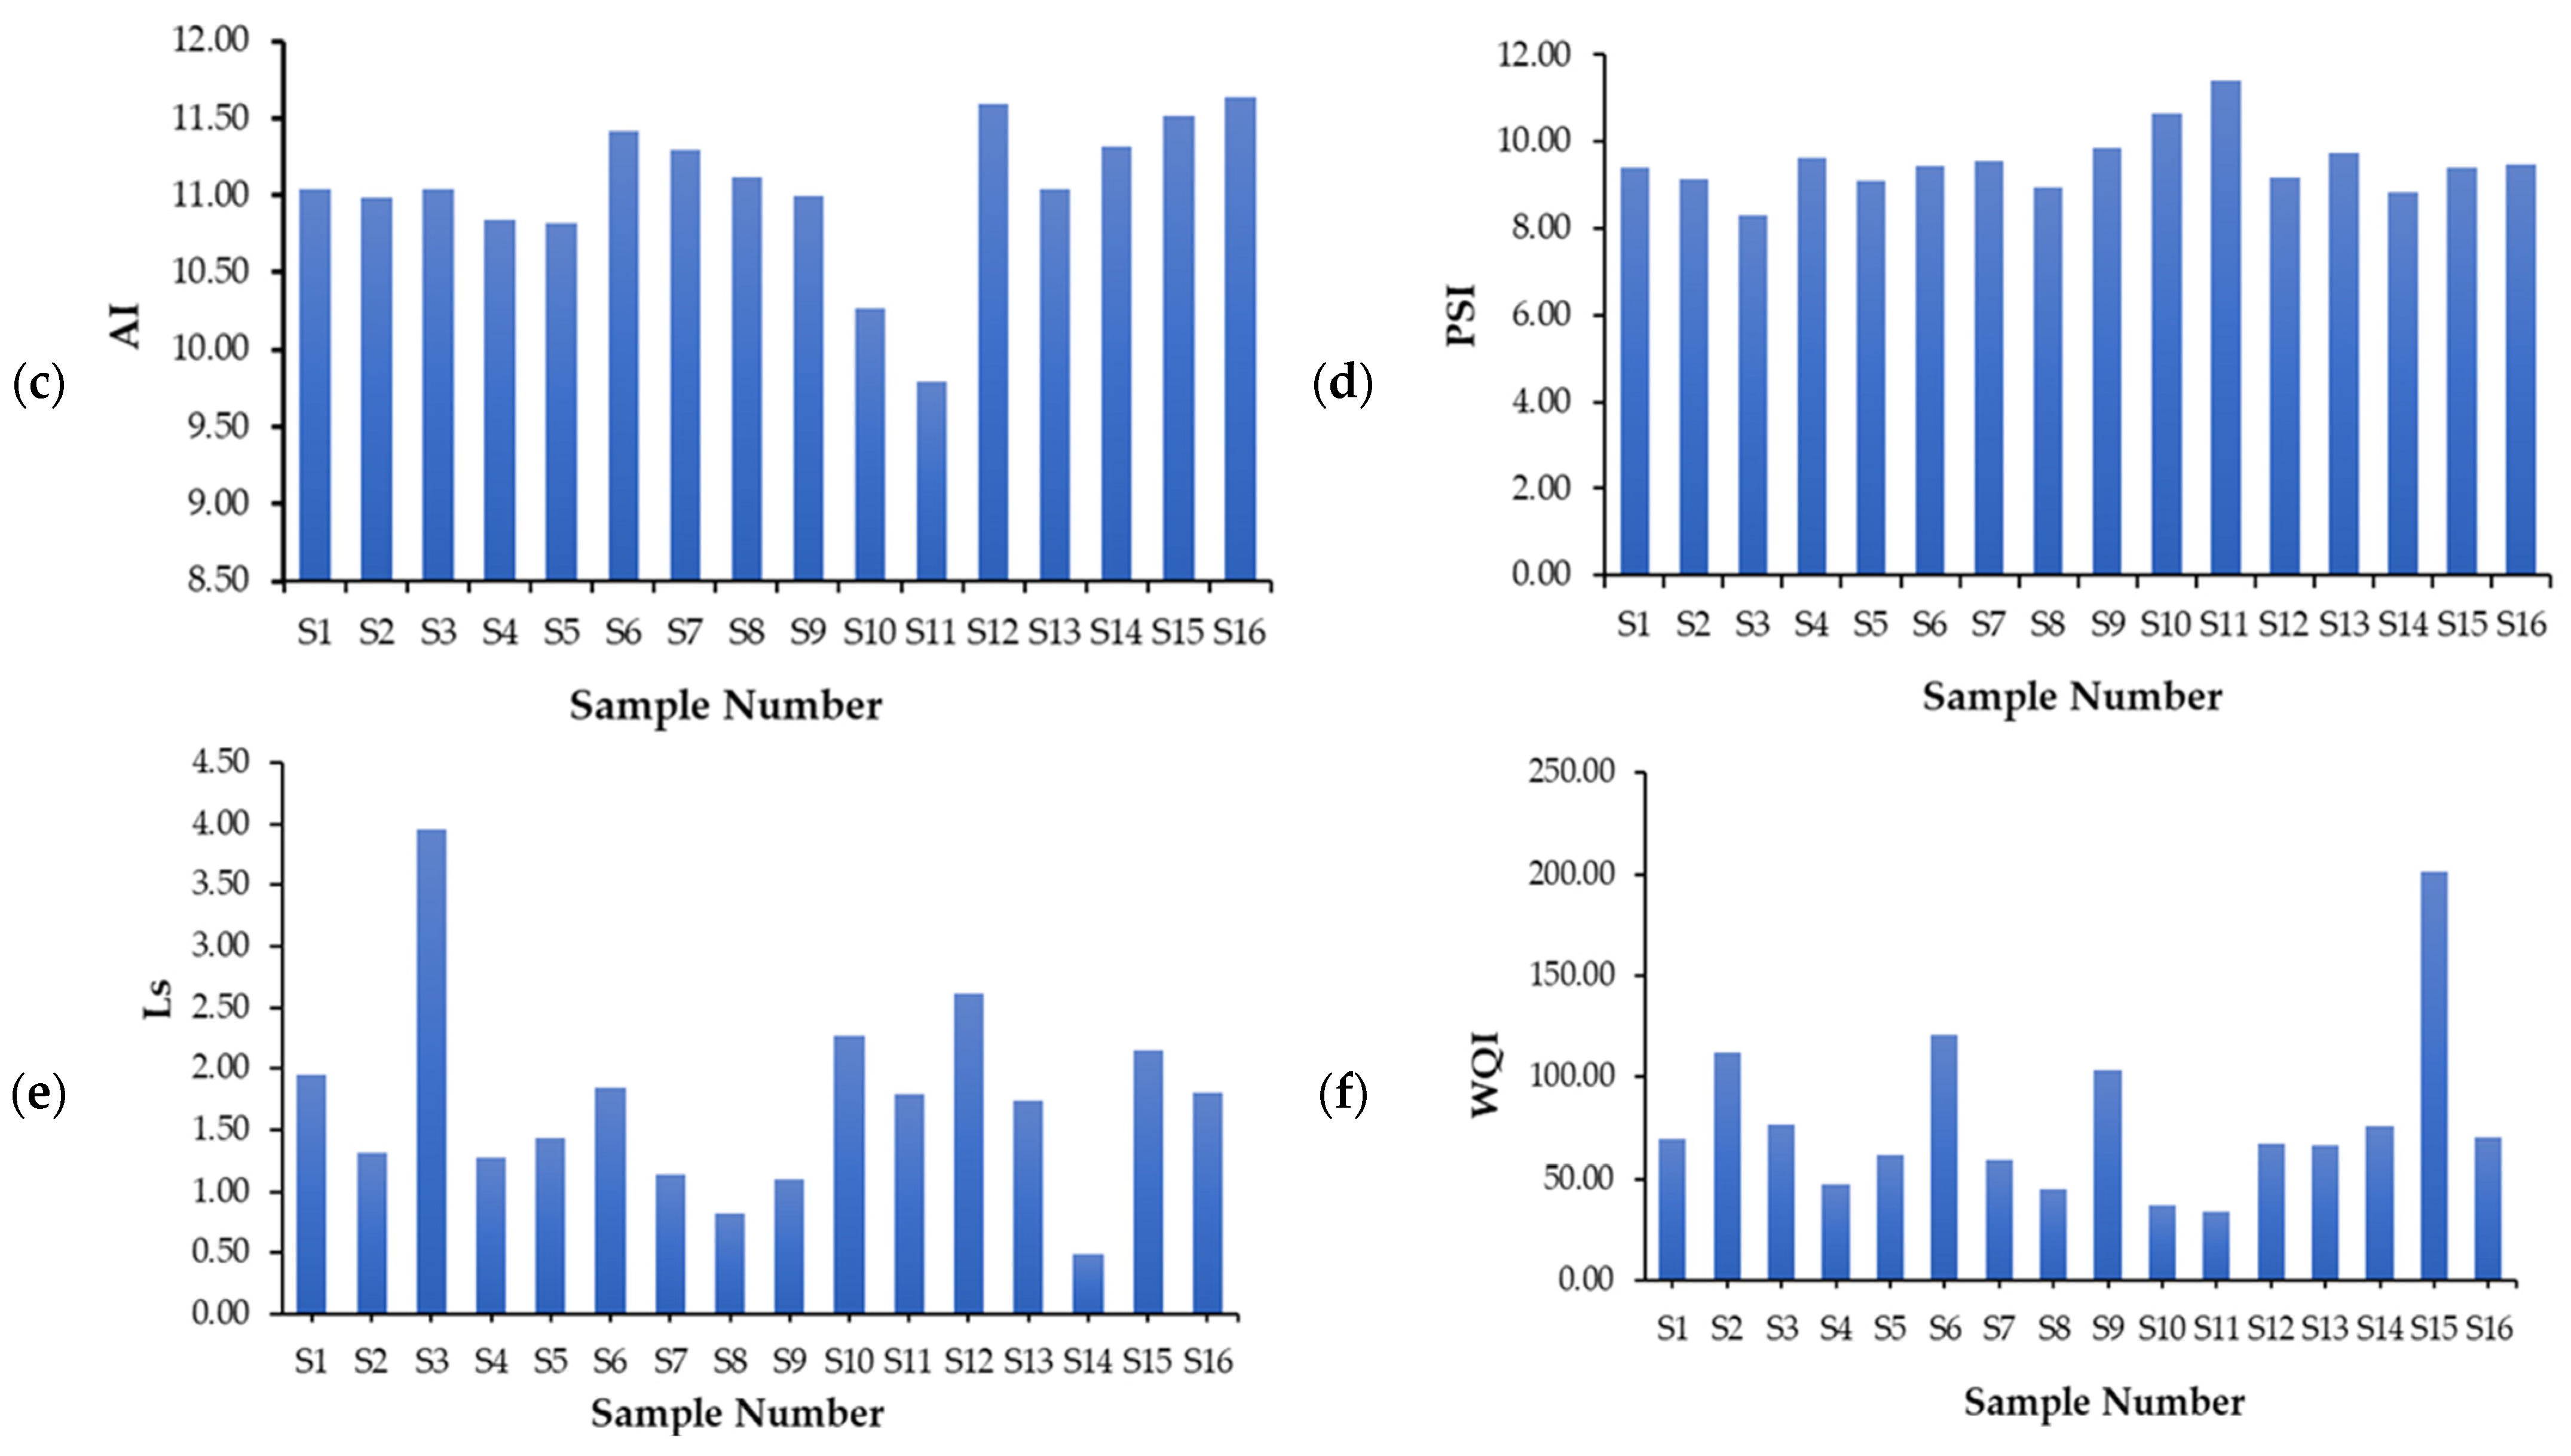
4.3.3. Puckorius Scaling Index (PSI)
4.3.4. Larson-Skold Index (Ls)
4.3.5. Aggressive Index (AI)
5. Conclusions
Author Contributions
Funding
Institutional Review Board Statement
Informed Consent Statement
Data Availability Statement
Acknowledgments
Conflicts of Interest
References
- Wekesa, A.M. Assessment of Groundwater Quality Using Water Quality Index from Selected Springs in Manga Subcounty, Nyamira County, Kenya. Sci. World J. 2022, 2022, 3498394. [Google Scholar] [CrossRef] [PubMed]
- Ram, A.; Tiwari, S.K.; Pandey, H.K.; Chaurasia, A.K.; Singh, S.; Singh, Y.V. Groundwater quality assessment using water quality index (WQI) under GIS framework. Appl. Water Sci. 2021, 2, 46. [Google Scholar] [CrossRef]
- Adimalla, N.; Qian, H. Groundwater quality evaluation using water quality index (WQI) for drinking purposes and human health risk (HHR) assessment in an agricultural region of Nanganur, south India. Ecotoxicol. Environ. Saf. 2019, 126, 153–161. [Google Scholar] [CrossRef] [PubMed]
- Islam, A.R.; Shen, S.; Haque, M.A.; Bodrud-Doza, M.; Maw, K.W.; Habib, M. Assessing groundwater quality and its sustainability in Joypurhat district of Bangladesh using GIS and multivariate statistical approaches. Environ. Dev. Sustain. 2018, 5, 1935–1959. [Google Scholar] [CrossRef]
- Yenugu, S.R.; Vangala, S.; Badri, S. HydroResearch Groundwater quality evaluation using GIS and water quality index in and around inactive mines, Southwestern parts of Cuddapah basin, Andhra. HydroResearch 2020, 3, 146–157. [Google Scholar] [CrossRef]
- Pietrucha-Urbanik, K.; Skowrońska, D.; Papciak, D. Assessment of corrosion properties of selected mineral waters. Coatings 2020, 10, 571. [Google Scholar] [CrossRef]
- Kumar, S.; Singh, R. Qualitative assessment and corrosiveness of the Ganga water: A comparative assessment. Mater. Today Proc. 2021, 45, 5695–5701. [Google Scholar] [CrossRef]
- APHA. Standard Methods for the Examination of Water and Wastewater, 23rd ed.; American Public Health Association: Washington, DC, USA, 2017. [Google Scholar]
- Horton, R.K. An index number system for rating water quality. J. Water Pollut. Control Fed. 1965, 3, 300–306. [Google Scholar]
- Asadi, E.; Isazadeh, M.; Samadianfard, S.; Ramli, M.F.; Mosavi, A.; Nabipour, N.; Shamshirband, S.; Hajnal, E.; Chau, K.W. Groundwater quality assessment for sustainable drinking and irrigation. Sustainability 2020, 1, 177. [Google Scholar] [CrossRef]
- WHO Guidelines for Drinking-Water Quality; WHO: Geneva, Switzerland, 2006; Volume 11, p. 515.
- Langelier, W.F. The Analytical Control of Anti-Corrosion Water Treatment. Am. Water Work. Assoc. 1936, 10, 1500–1521. [Google Scholar] [CrossRef]
- Ryznar, J.W. A New Index for Determining Amount of Calcium Carbonate Scale Formed by a Water. Am. Water Work. Assoc. 1944, 4, 472–483. [Google Scholar] [CrossRef]
- Taghipour, H.; Shakerkhatibi, M.; Pourakbar, M.; Belvasi, M. Corrosion and Scaling Potential in Drinking Water Distribution System of Tabriz, Northwestern Iran. Health Promot. Perspect. 2012, 1, 103–111. [Google Scholar]
- Kumar, S.; Singh, R.; Maurya, N.S. Water Quality Analysis and Corrosion Potential in the Distribution Network Patna, Bihar. J. Environ. Eng. Sci. 2022, 4, 164–174. [Google Scholar] [CrossRef]
- Kumar, S.; Singh, R.; Maurya, N.S. Assessment of Corrosion Potential Based on Water Quality Index in the Distribution Network of urban Patna, Bihar, India. J. Nat. Environ. Pollut. Technol. 2022, 5, 2117–2127. [Google Scholar] [CrossRef]


| Index | Equation | Index Value | Tendency of Water |
|---|---|---|---|
| Langelier saturation index (LSI) | LSI = pH − pHs | LSI < 0 | Corrosive tendency |
| pHs = (9.3 + A + B) − (C + D) | LSI = 0 | Neutral tendency | |
| A = (Log (TDS) − 1)/10 | |||
| B = −13.2(Log (°C + 273)) + 34.55 | LSI > 0 | Scaling tendency | |
| C = Log (Ca++ as CaCO3) − 0.4 | |||
| D = Log (Alkalinity as CaCO3) | |||
| Ryznar stability index (RSI) | RSI = 2pHs − pH | RSI < 5.5 | High Scaling tendency |
| 5.5 < RSI < 6.2 | Scaling tendency | ||
| 6.2 < RSI < 6.8 | Neutral tendency | ||
| 6.8 < RSI < 8.5 | Low corrosive tendency | ||
| RSI > 8.5 | High Corrosive tendency | ||
| Puckorius scaling Index (PSI) | PSI = 2pHs − pHeq pHeq = 1.465log (Alkalinity) + 4.54 Alkalinity = HCO3− + 2(CO3−) + OH− | PSI > 7 | Corrosive tendency |
| PSI < 6 | Scaling tendency | ||
| Larson-Skold Index (Ls) | Ls = ( + )/( + ) C = Concentration in mg/L | Ls > 1.2 | High corrosive tendency |
| 0.8 < Ls < 1.2 | Corrosive tendency | ||
| Ls < 0.8 | Scaling tendency | ||
| Aggressive index (AI) | AI = pH + log ((Ca++) × (Alkalinity)) | AI < 10 | Corrosive tendency |
| 10 < AI < 12 | Moderately Corrosive | ||
| AI > 12 | Scaling tendency |
| pH | TDS (mg/L) | EC (µS/cm) | DO (mg/L) | F− (mg/L) | Cl− (mg/L) | NO3− (mg/L) | SO42− (mg/L | Alk. (mg/L) | TH (mg/L) | Ca2+ (mg/L) | Mg2+ (mg/L) | |
|---|---|---|---|---|---|---|---|---|---|---|---|---|
| Min | 6.67 | 139.0 | 242.5 | 1.15 | 0.10 | 16.81 | 2.791 | 3.85 | 14.66 | 133.5 | 82.89 | 36.84 |
| 1st Qu. | 7.06 | 287.0 | 530.3 | 1.71 | 0.52 | 33.02 | 11.45 | 9.38 | 34.65 | 201.5 | 139.30 | 54.11 |
| Median | 7.24 | 340.2 | 645.0 | 2.05 | 0.71 | 40.13 | 18.64 | 15.78 | 39.24 | 276.3 | 161.18 | 101.31 |
| Mean | 7.26 | 369.8 | 721.8 | 2.02 | 0.90 | 51.55 | 21.63 | 15.28 | 39.91 | 298.7 | 176.43 | 122.32 |
| 3rd Qu. | 7.53 | 387.9 | 771.9 | 2.24 | 1.11 | 63.72 | 31.06 | 18.48 | 47.34 | 351.1 | 184.20 | 174.99 |
| Max. | 7.84 | 839.0 | 1669.0 | 2.89 | 2.20 | 169.28 | 49.34 | 38.69 | 58.81 | 704.6 | 492.74 | 290.12 |
| WHO | 7–8 | 600 | - | - | 1.5 | 250 | 50 | 250 | - | 200 | 100 | - |
| Corrosiveness Indices | Minimum | Maximum | Mean ± Standard Deviation |
|---|---|---|---|
| LSI | −2.12 | −0.31 | −0.92 ± 0.47 |
| RSI | 8.36 | 10.96 | 9.09 ± 0.67 |
| AI | 9.79 | 11.64 | 11.05 ± 0.48 |
| PSI | 8.29 | 11.42 | 9.50 ± 0.73 |
| LS | 0.49 | 3.95 | 1.73 ± 0.78 |
Disclaimer/Publisher’s Note: The statements, opinions and data contained in all publications are solely those of the individual author(s) and contributor(s) and not of MDPI and/or the editor(s). MDPI and/or the editor(s) disclaim responsibility for any injury to people or property resulting from any ideas, methods, instructions or products referred to in the content. |
© 2023 by the authors. Licensee MDPI, Basel, Switzerland. This article is an open access article distributed under the terms and conditions of the Creative Commons Attribution (CC BY) license (https://creativecommons.org/licenses/by/4.0/).
Share and Cite
Alam, A.; Kumar, S. Groundwater Quality Assessment and Evaluation of Scaling and Corrosiveness Potential of Drinking Water Samples. Environ. Sci. Proc. 2023, 25, 64. https://doi.org/10.3390/ECWS-7-14316
Alam A, Kumar S. Groundwater Quality Assessment and Evaluation of Scaling and Corrosiveness Potential of Drinking Water Samples. Environmental Sciences Proceedings. 2023; 25(1):64. https://doi.org/10.3390/ECWS-7-14316
Chicago/Turabian StyleAlam, Aftab, and Saurabh Kumar. 2023. "Groundwater Quality Assessment and Evaluation of Scaling and Corrosiveness Potential of Drinking Water Samples" Environmental Sciences Proceedings 25, no. 1: 64. https://doi.org/10.3390/ECWS-7-14316
APA StyleAlam, A., & Kumar, S. (2023). Groundwater Quality Assessment and Evaluation of Scaling and Corrosiveness Potential of Drinking Water Samples. Environmental Sciences Proceedings, 25(1), 64. https://doi.org/10.3390/ECWS-7-14316


