1. Introduction
Groundwater is critical for supporting human well-being and economic development. During recent decades, groundwater has been under increasing pressure and the threat of pollution due to agricultural and industrial activities, urbanization, and tourism development. In addition, the climate crisis will affect the parameters of the hydrologic cycle (increase in temperature, reduction of rainfall, droughts, floods) and, consequently, the natural recharge of the aquifers, alongside the quantity and quality of groundwater resources. In groundwater, dissolved ions and solids are always present. That defines its physical and physicochemical characteristics. When the concentration of pollutants is greater than threshold values, then it is unsuitable for irrigation and/or other uses.
The Mygdonia hydrologic basin consists of a rare complex of ecosystems, including the lakes, Koronia and Volvi, which constitute an important wetland system of high ecological and international importance (protected by Ramsar Convention), but over the years, a degradation, especially of Lake Koronia, has been observed [
1]. The main causes of the water quality deterioration of Lake Koronia are the water withdrawals and the uncontrollable discharge of untreated domestic and industrial effluents [
2,
3].
This work investigates the groundwater quality of the Mygdonia basin. Conventional statistical methods, hydrogeochemical diagrams, along with data reduction methods, such as factor analysis, were applied in order to describe groundwater quality, classify samples according to their water type, and identify the prevailing hydrogeological processes that take place in the aquifers of the basin. Some proposals to improve the sustainability of groundwater resources in the Mygdonia basin are presented.
2. Study Area-Data Collection
2.1. General Characteristics
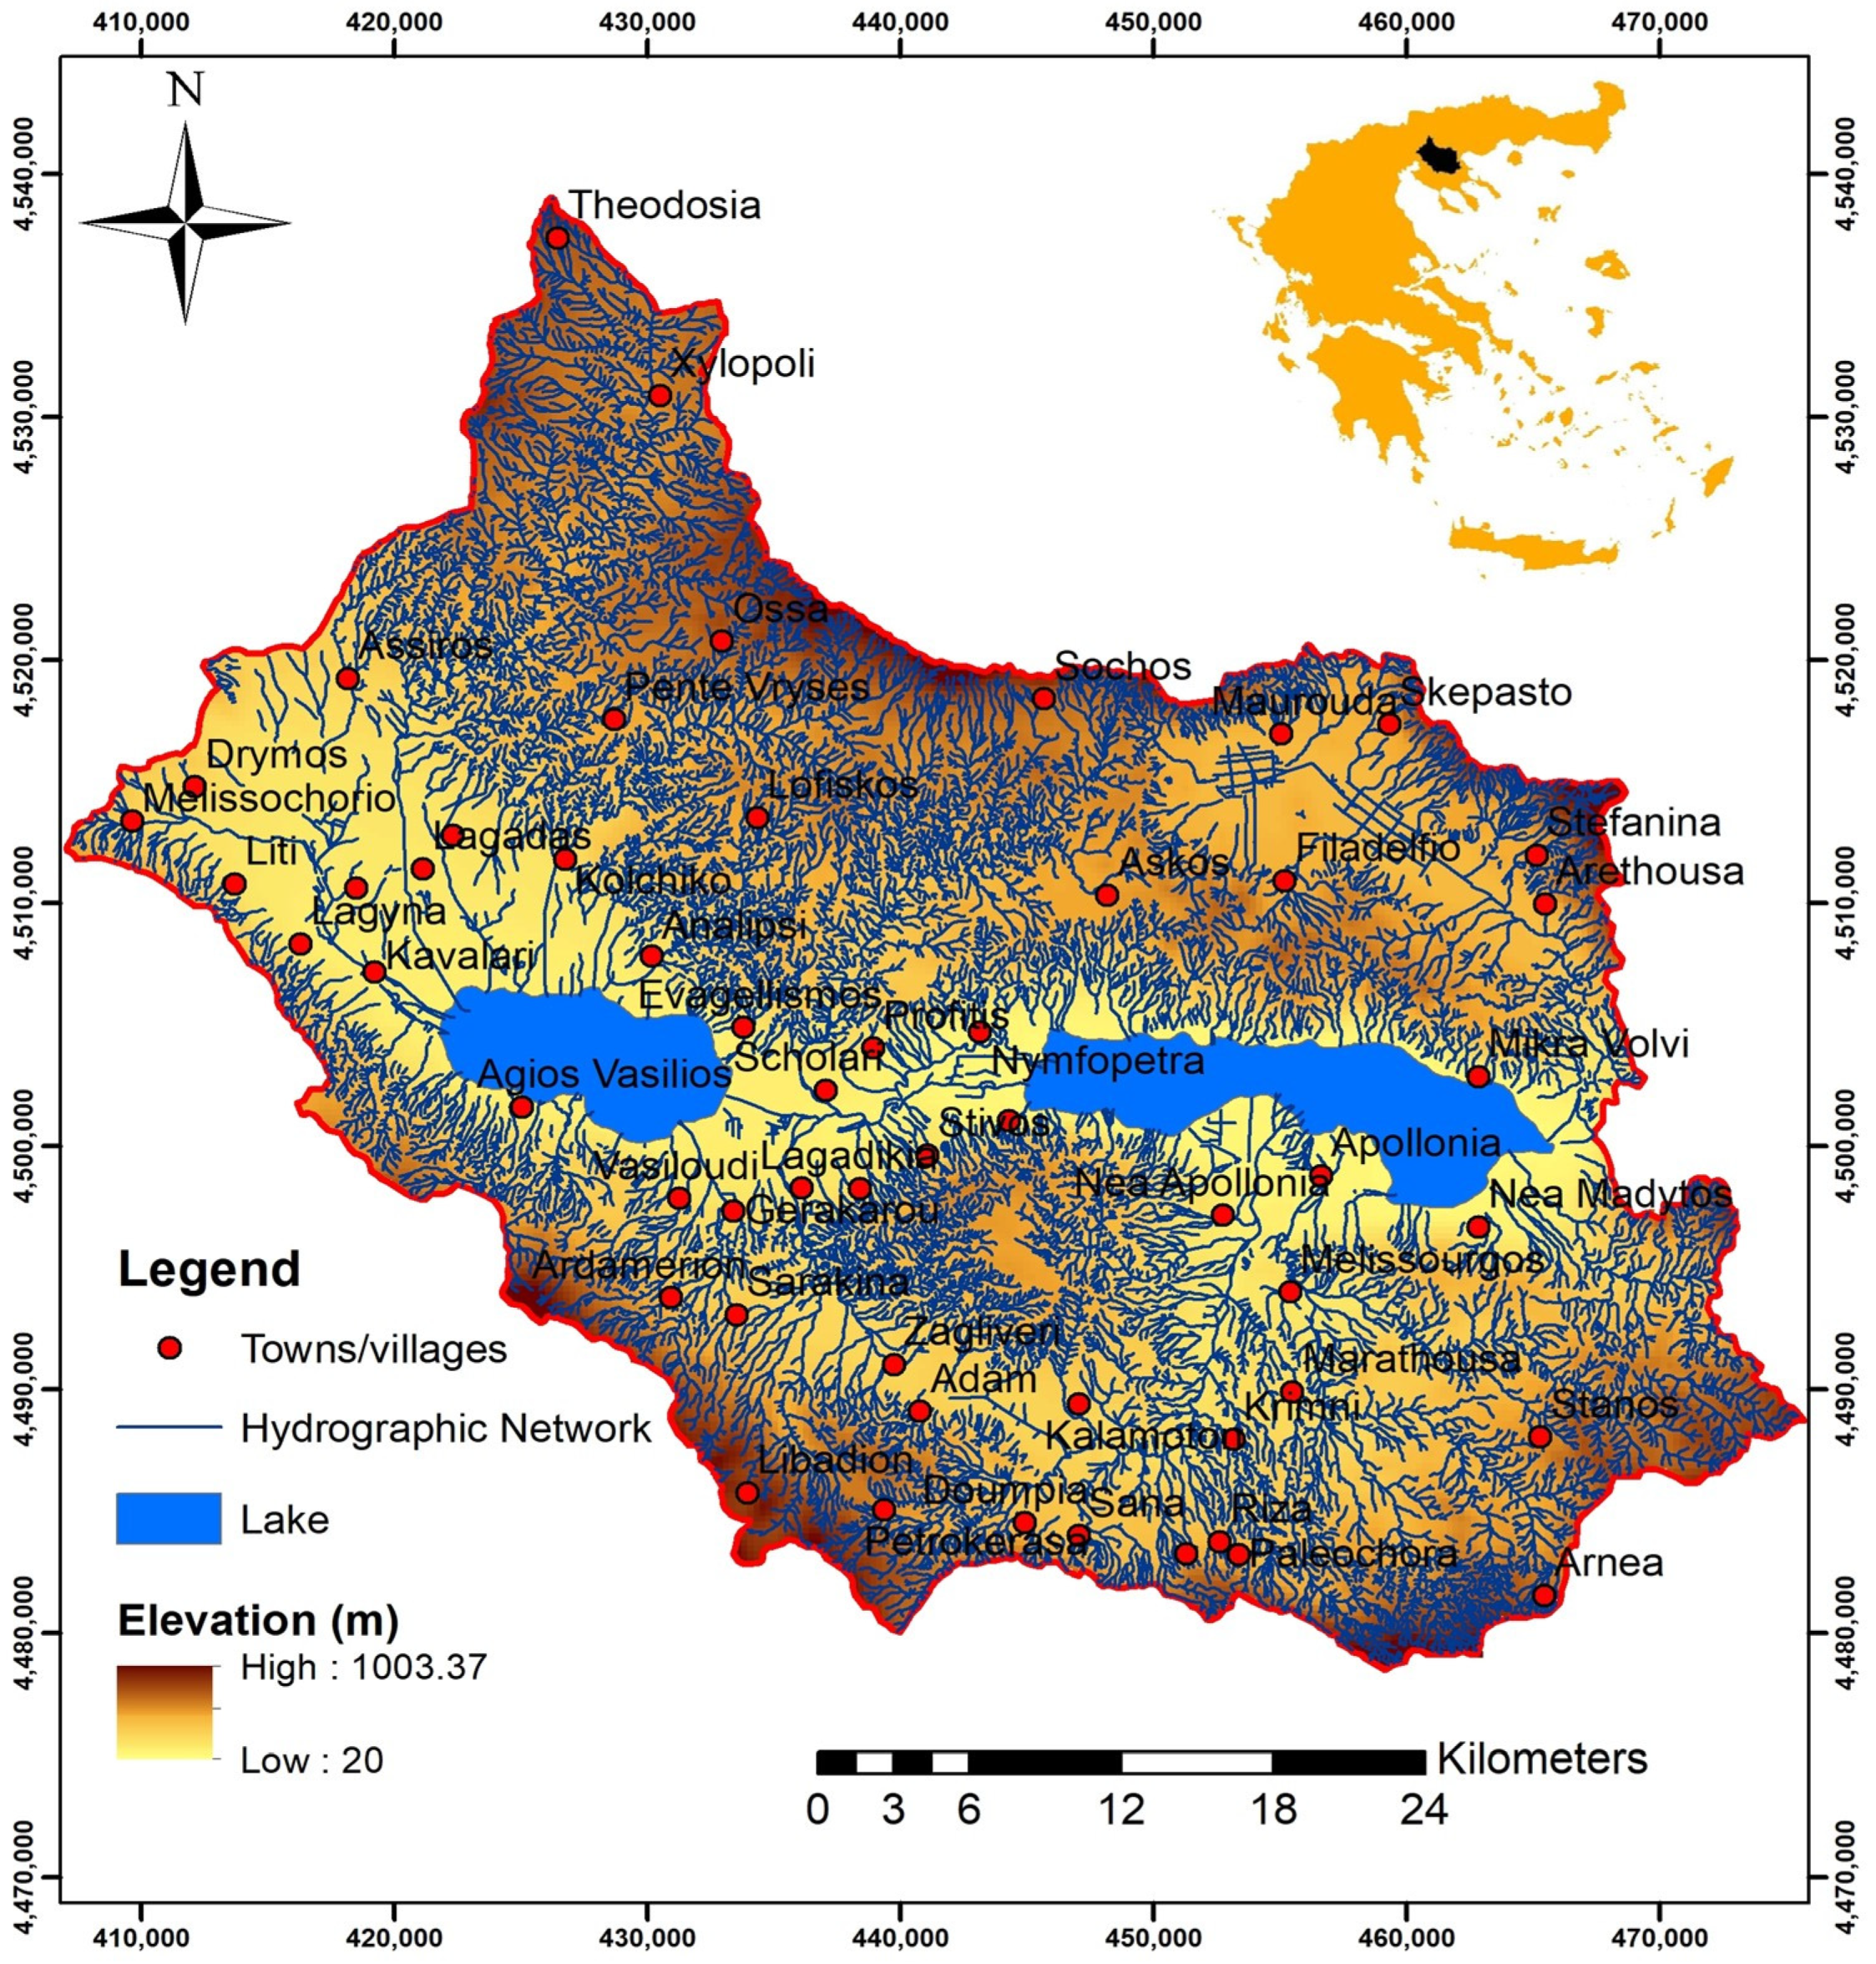
Mygdonia basin, covering an area of more than 2000 km
2 (650 km
2 in the lowland), is located in the Thessaloniki Prefecture, central Macedonia, North Greece (
Figure 1). It is characterized by the typical Mediterranean and continental climate with wet (October–April) and dry periods (May–September).The mean annual rainfall is 585 mm, and the mean annual temperature is 13.5 °C [
4].
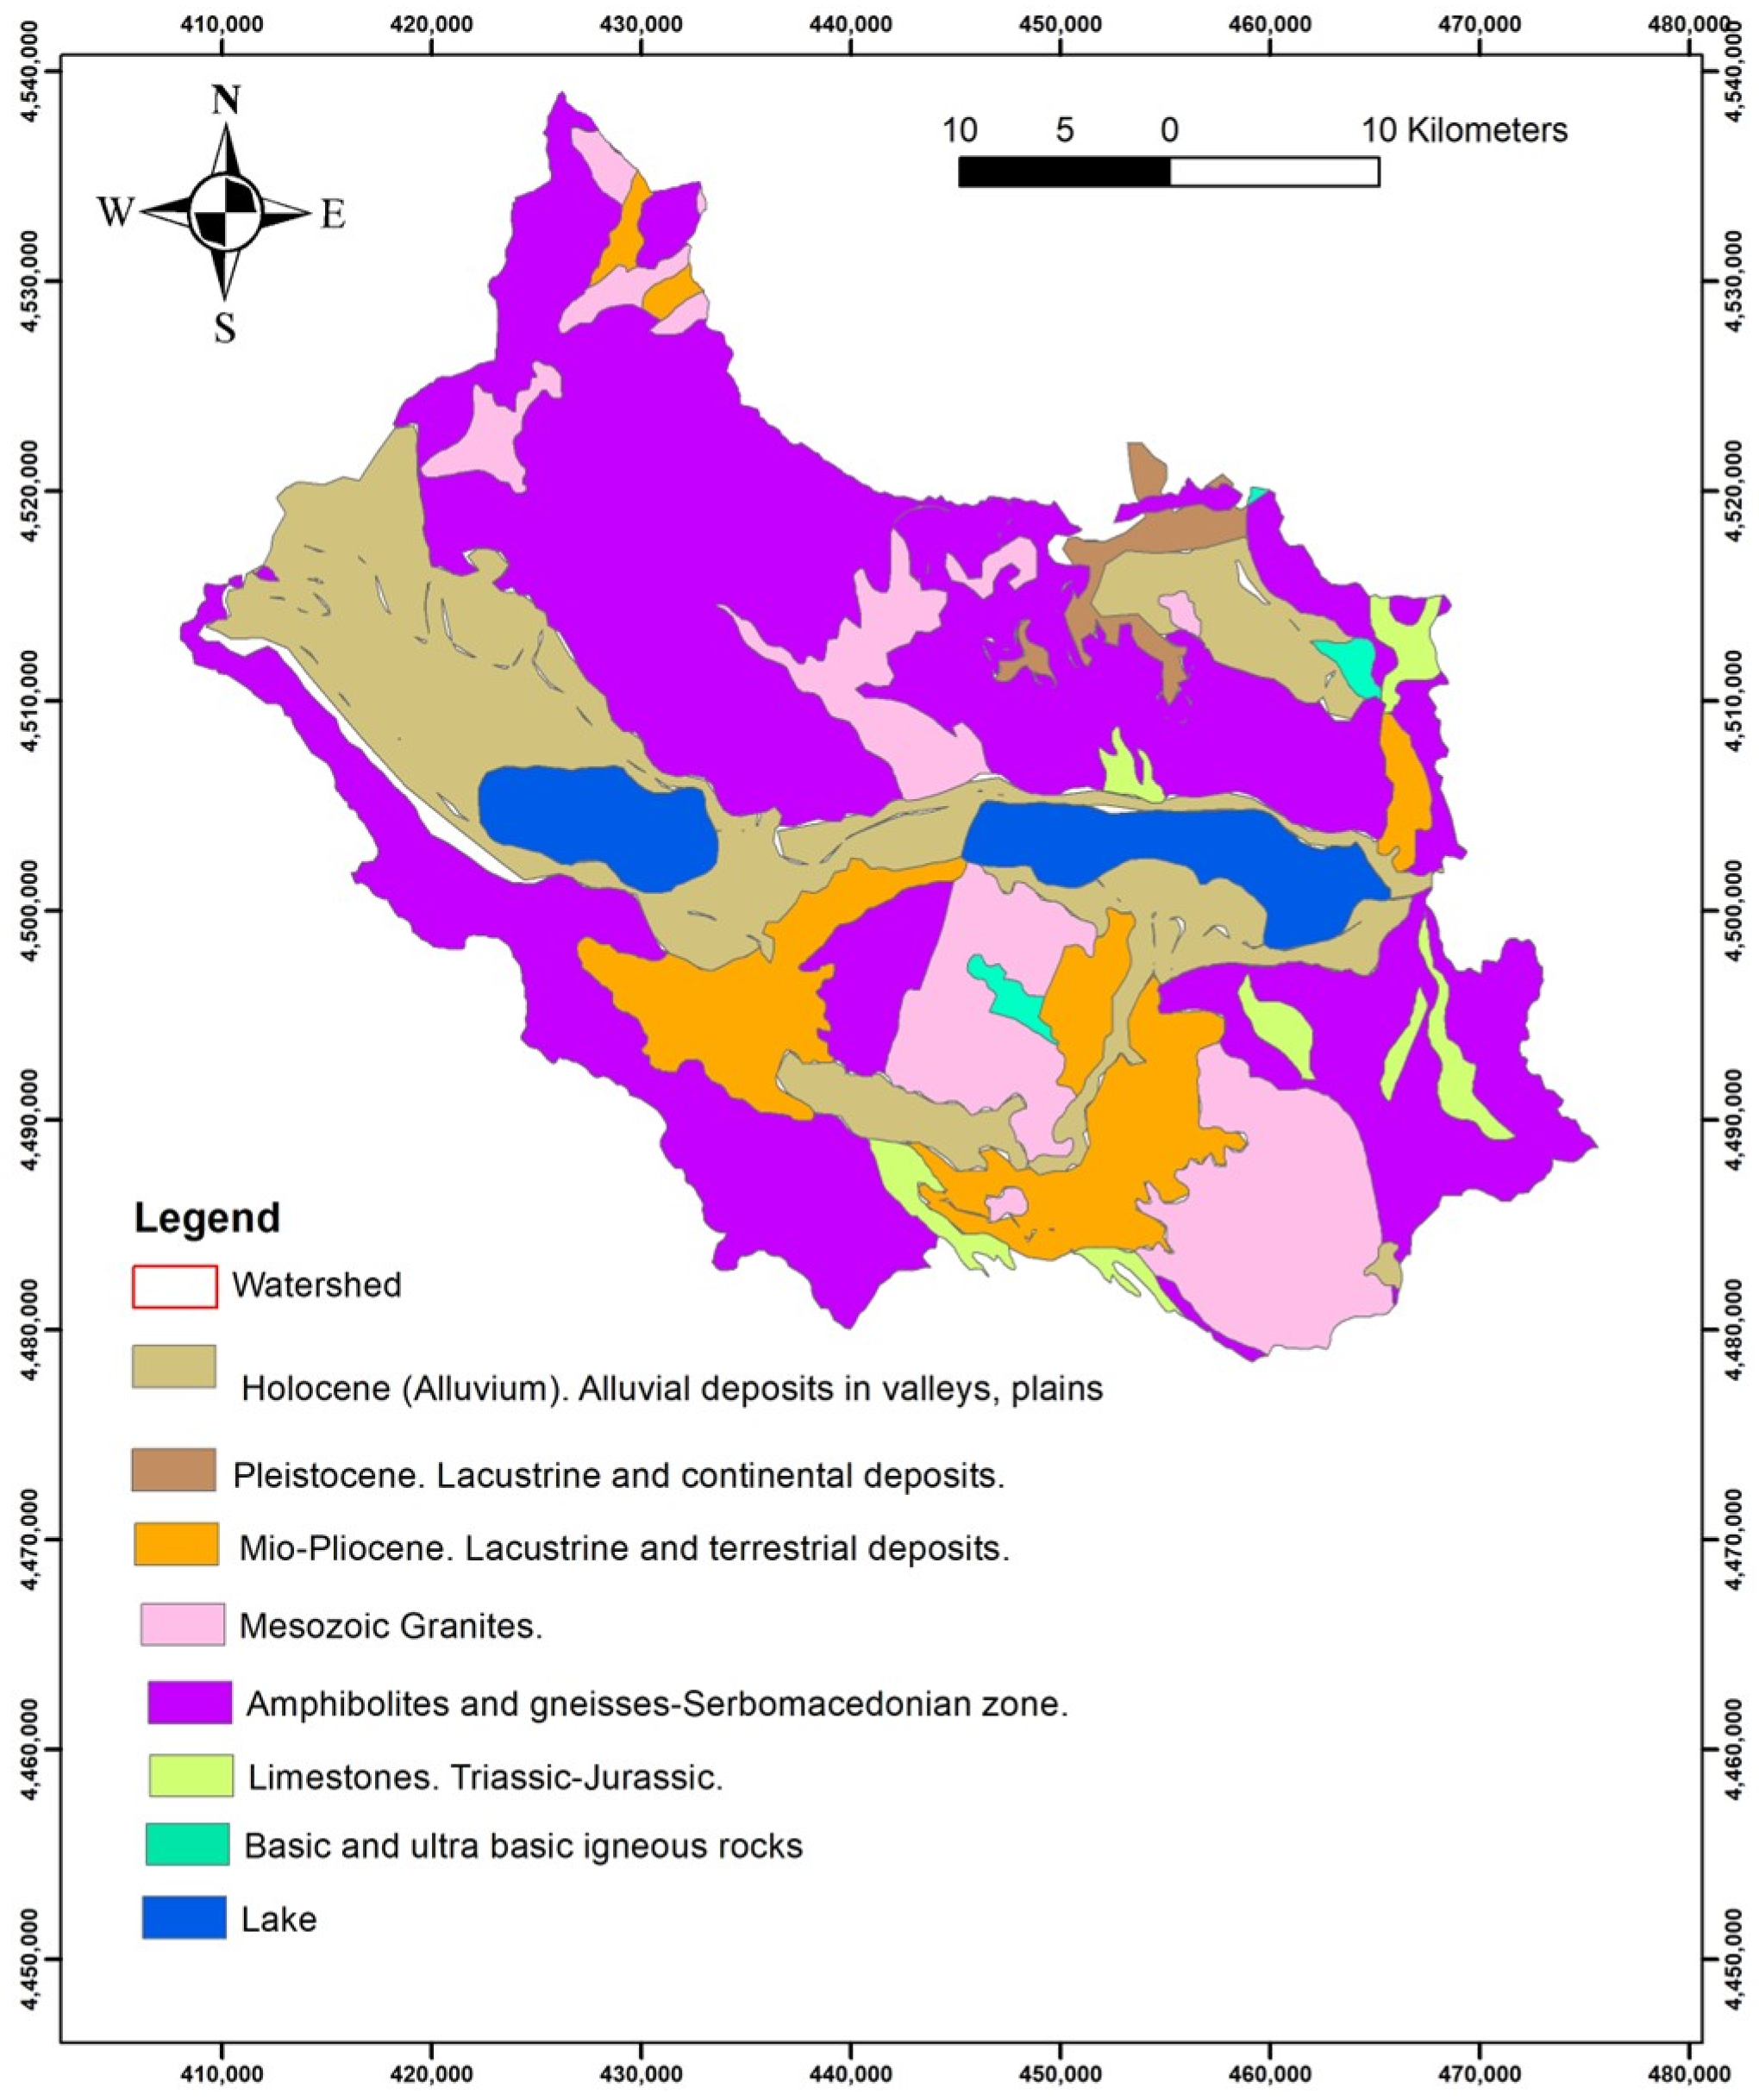
From a geological point of view (
Figure 2), as a tectonically active basin, the lowland of the Mygdonia basin is formed from recent unconsolidated materials consisting of sands, clay, and silty sand sediments [
5]. The bedrocks are paleozoic gneisses, amphibolites, schists, marbles, and granitic intrusions of the Serbomacedonian massif [
6].
Within the Quaternary deposits of lowland, aquifer systems are developed, including an unconfined shallow aquifer and deeper confined aquifers. The groundwater level is 0.7–43 m below the ground’s surface. Generally, the highest values are recorded in April (end of wet period) and the lowest in early October (end of dry period) [
1].
Groundwater recharge occurs through direct infiltration of rainfall, seepage from torrents, lateral subsurface inflows from mountainous areas, and return water flow from irrigation use [
8].
2.2. Data Collection
Groundwater samples were collected during the wet (May) and dry (September) periods over the years from 2013 to 2015, showing similar results along with in situ measurements of the physicochemical characteristics. In this work, the results of the year 2014 are presented. The samples were analyzed in the Laboratory of Engineering Geology and Hydrogeology at the Aristotle University of Thessaloniki for eightmajor ions (Ca2+, Na+, Mg2+, K+, NO3−, SO42−, Cl−, and HCO3−).Sampling point locations aimed to cover the entire basin. Maps showing the spatial distribution of Electrical Conductivity (EC), temperature (T in C°), and pH were created.
The AQUACHEM software was used to create Piper and Durov diagrams, and also the SAR (sodium adsorption ratio) value was calculated. Finally, factor analysis was applied in order to identify the main hydrochemical processes and uncover relationships between ions.
3. Results of Groundwater Quality Analysis
Summary statistics of the results of chemical analyses are presented in
Table 1. The electrical conductivity (EC) mean values are equal to 916.5 μS/cm for May and 889 μS/cm for September. High values are attributed to the intensive agricultural activities, the existence of geothermal fields and human activities in the area. It is known that during the previous decades, many textile dyeing units operated in the area. The uncontrolled disposal of untreated waste in the channels resulted in the degradation of soil and groundwater resources.
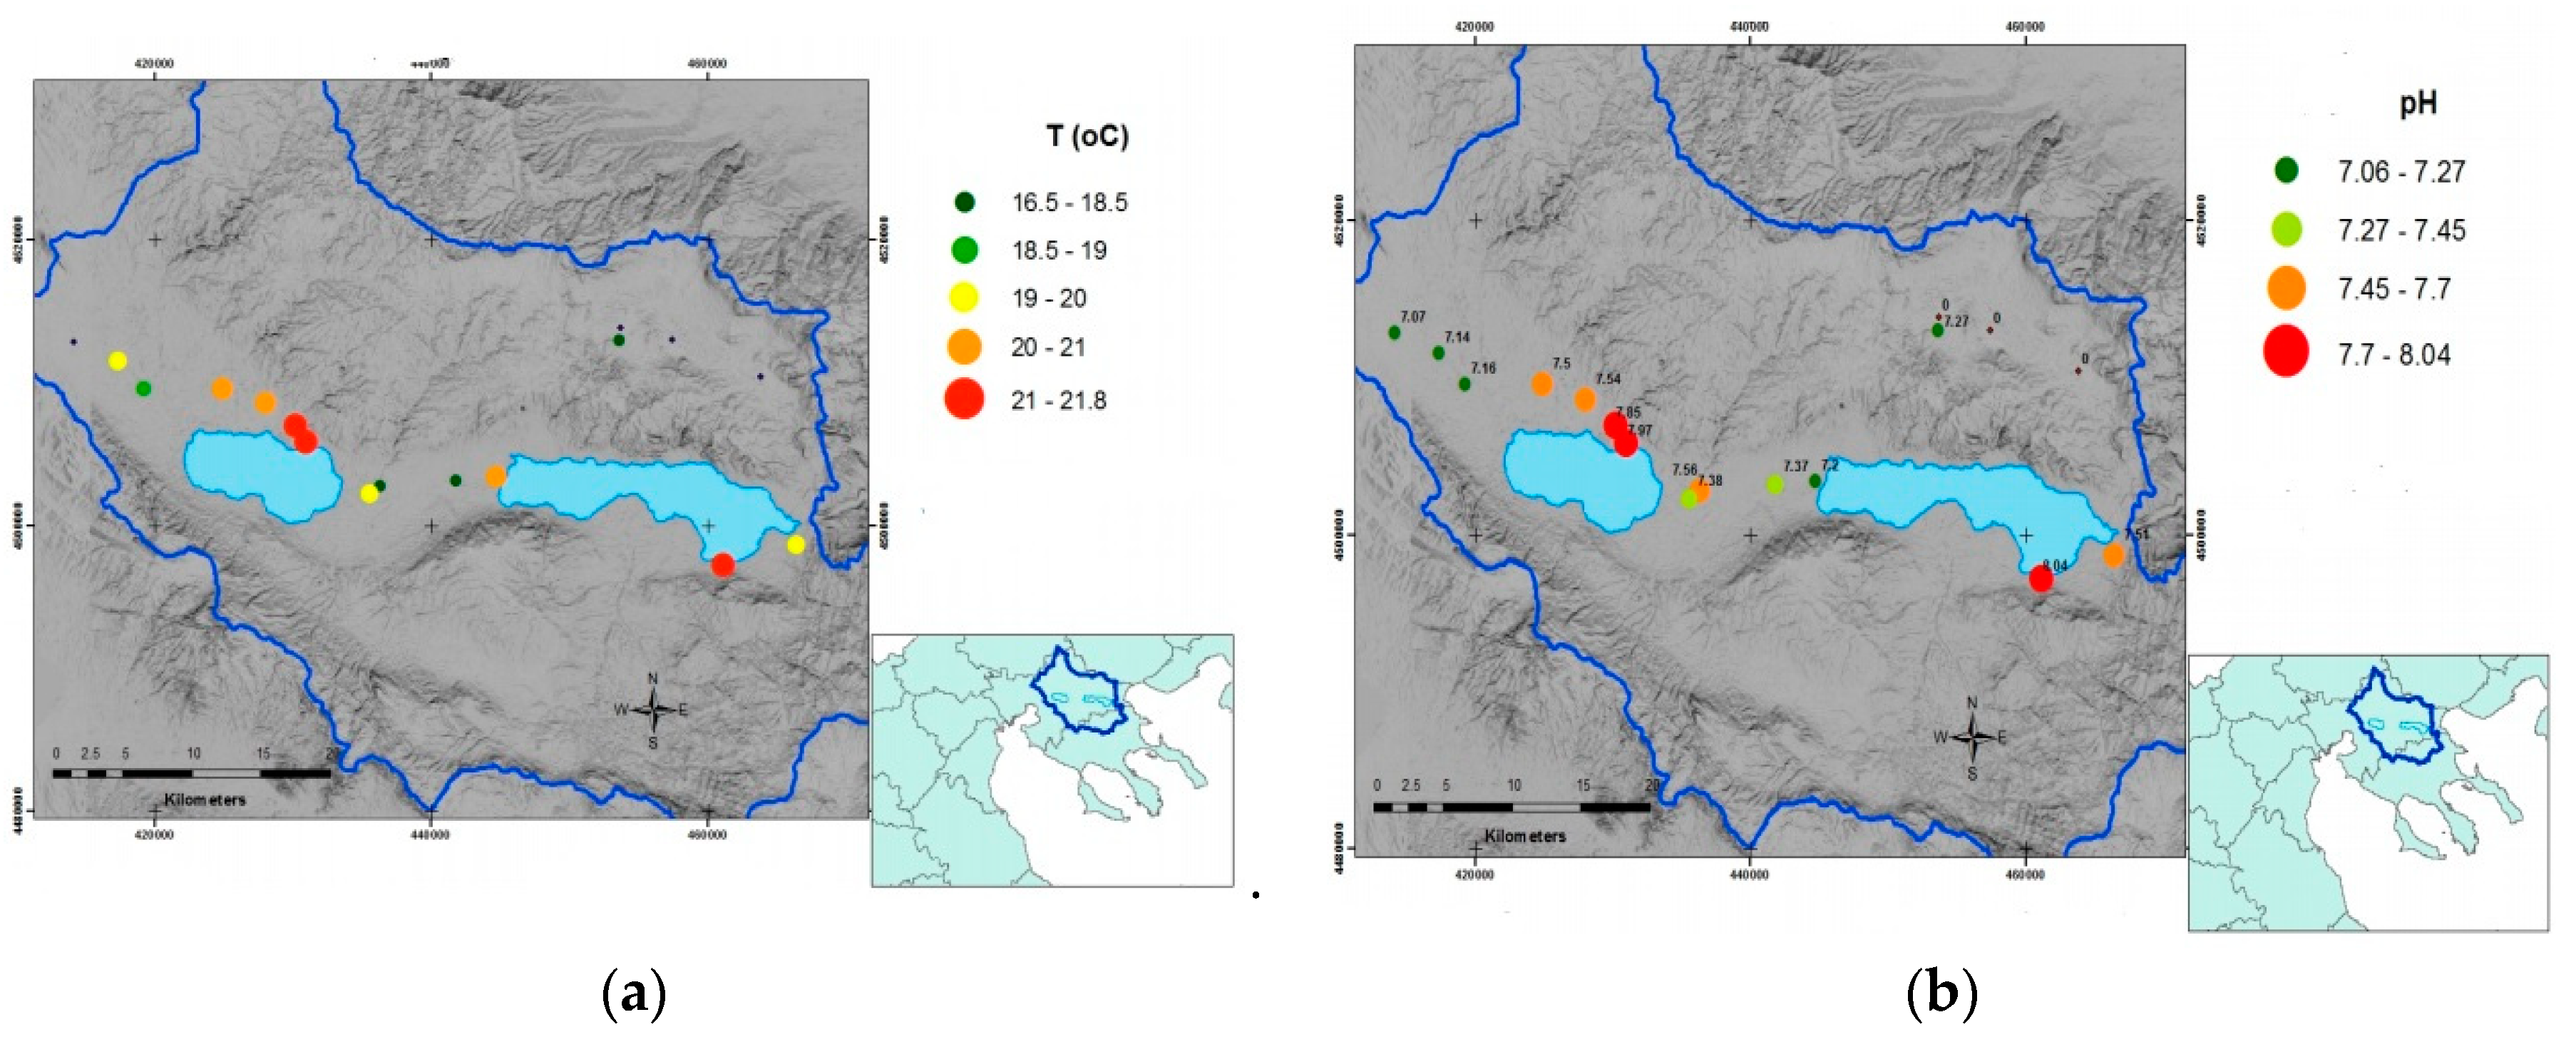
pH values range from 6.29 to 8.04,and groundwater temperatures range from 16.5 °C to 21.8 °C (
Figure 3). The spatial variation and especially the high temperatures could be caused by the mixing of groundwater with geothermal fluids.
A high percentage of the groundwater samples (25%) exceeds the maximum permissible limit for drinking purposes set by Directive 2006/118 EC, the Joint Ministerial Decision 39626/208/E130, and the Ministerial Decision 1811/2011 (Official Government Gazette 3322 B/2011). This is associated with the use of nitrogen fertilizers in agriculture. It is pointed out that the common fertilizers in the area contain nitrogen, phosphate, sulfate, and potassium.
Sodium values exceed the threshold value of 150 mg/L in seven out of forty-four samples. The high sodium values were recorded at boreholes close to the geothermal field and at livestock units. Groundwater quality regarding sodium could be affected by the geothermal fluids, and the use of salt in the livestock units could locally increase the sodium concentration in water samples.
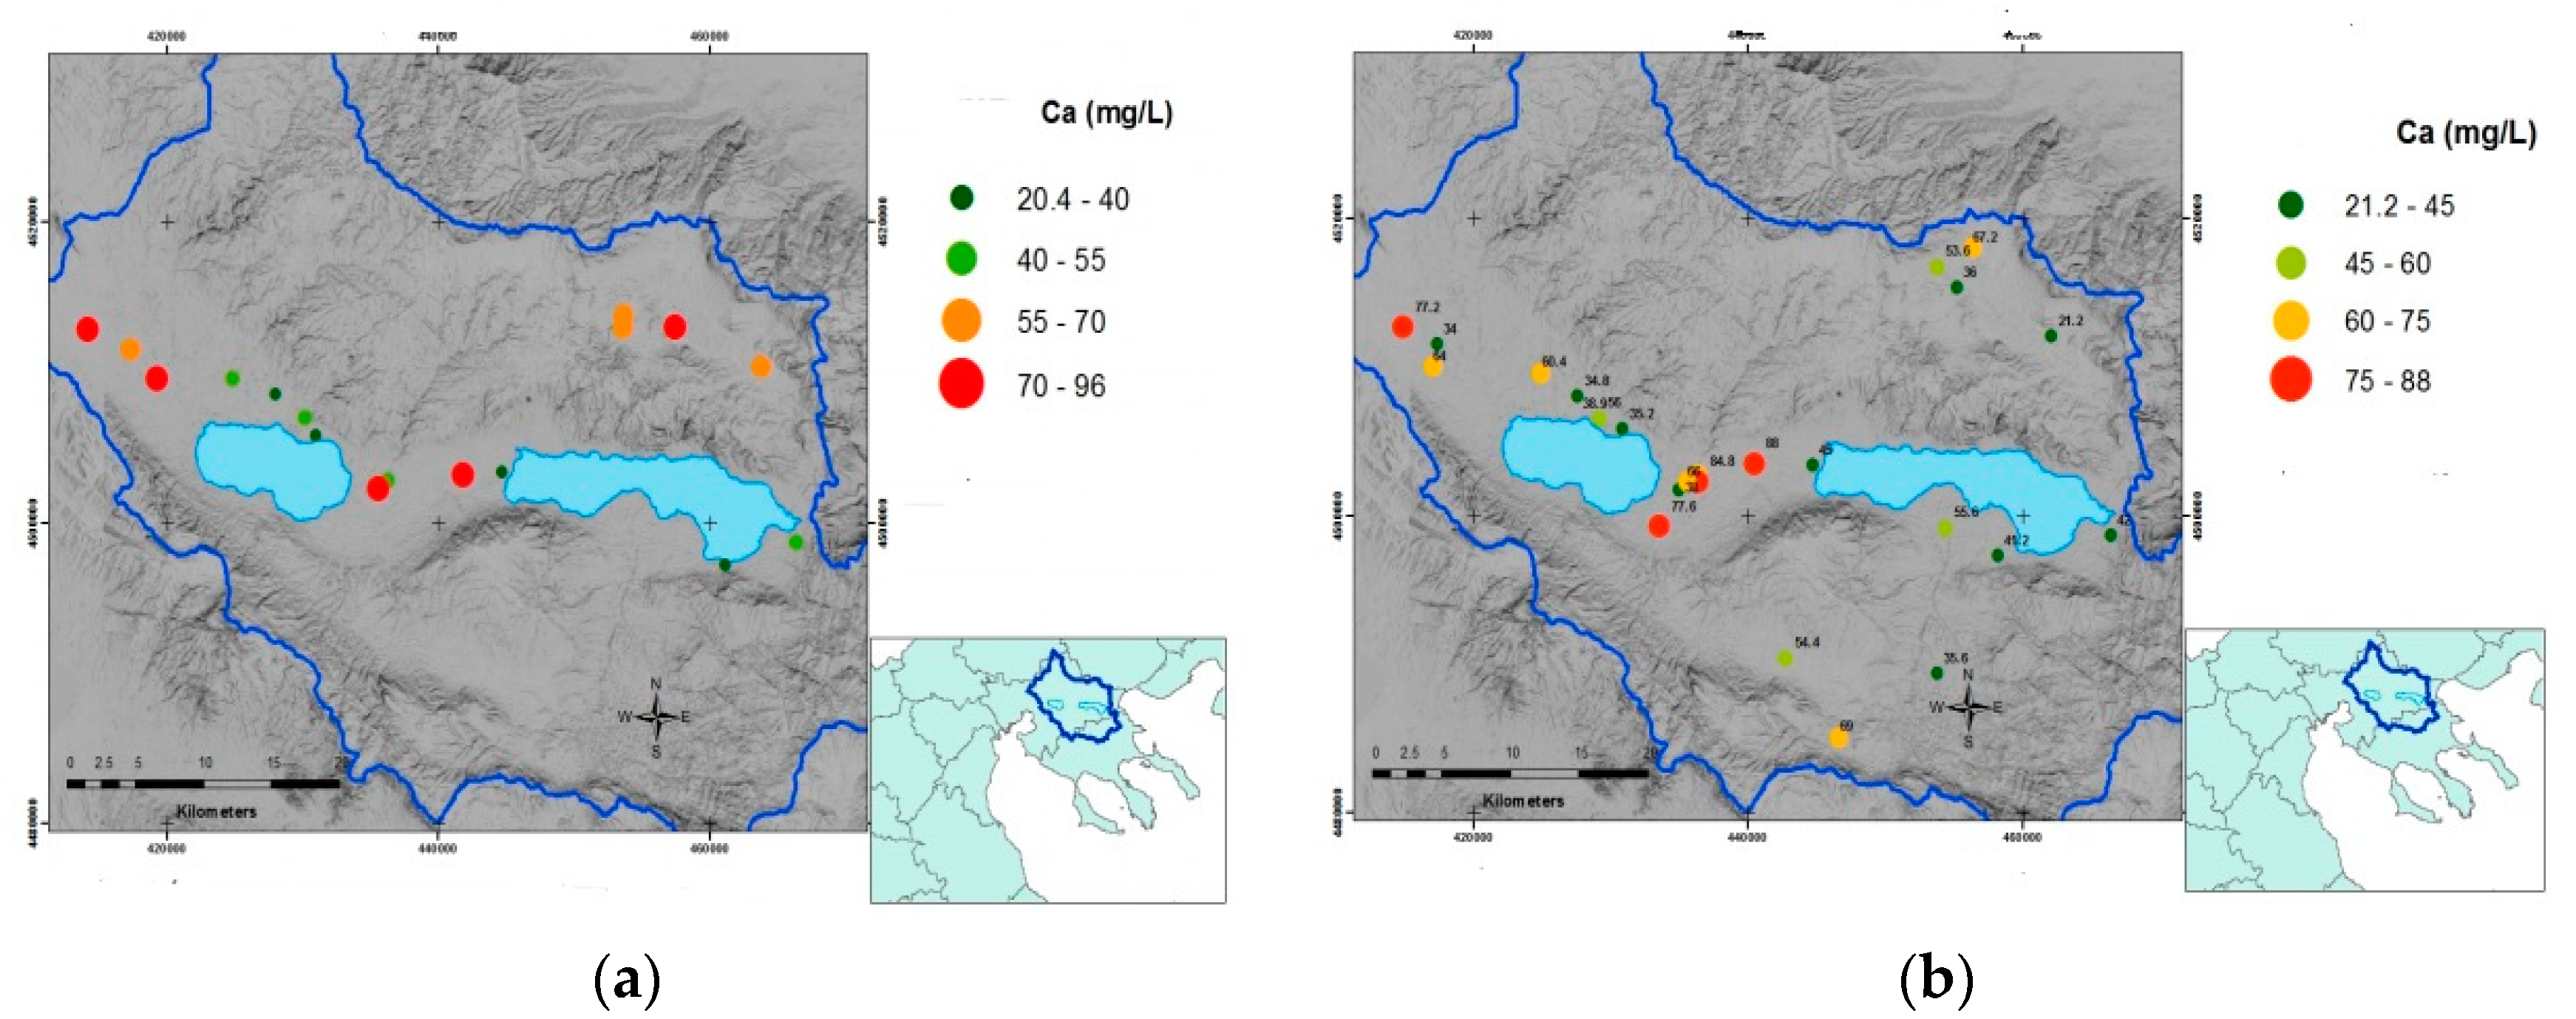
Typically, the distribution of calcium (Ca
2+) ions for the two sampling periods is shown in the maps of
Figure 4, constituting a typical example given that calcium is one of the most important dissolved ions in water since the content of groundwater is directly linked to the geological environment through which the groundwater moves from the moment of its infiltration up to the entire period of its storage in the aquifer. Its highest concentrations are found in areas where water remains for a long time in the aquifer, as in the area between Koronia and Volvi lakes. High values of sulfates are locally recorded and should be attributed to the use of fertilizers and/or the mixing with geothermal fluids.
Hydrochemical diagrams were created, providing information about the water type. In
Figure 5, Durov diagrams for both sampling periods were created, showing that all samples belong to bicarbonates in terms of anions. Regarding cations, samples belong to calcium and sodium, while based on anions and cations (square), several of them belong to bicarbonate, sulfate, and chloride. It is, therefore, concluded that the groundwater type is calcium-bicarbonate (Ca-HCO
3), while some samples are a mixture of different hydrochemical types of water [
9].
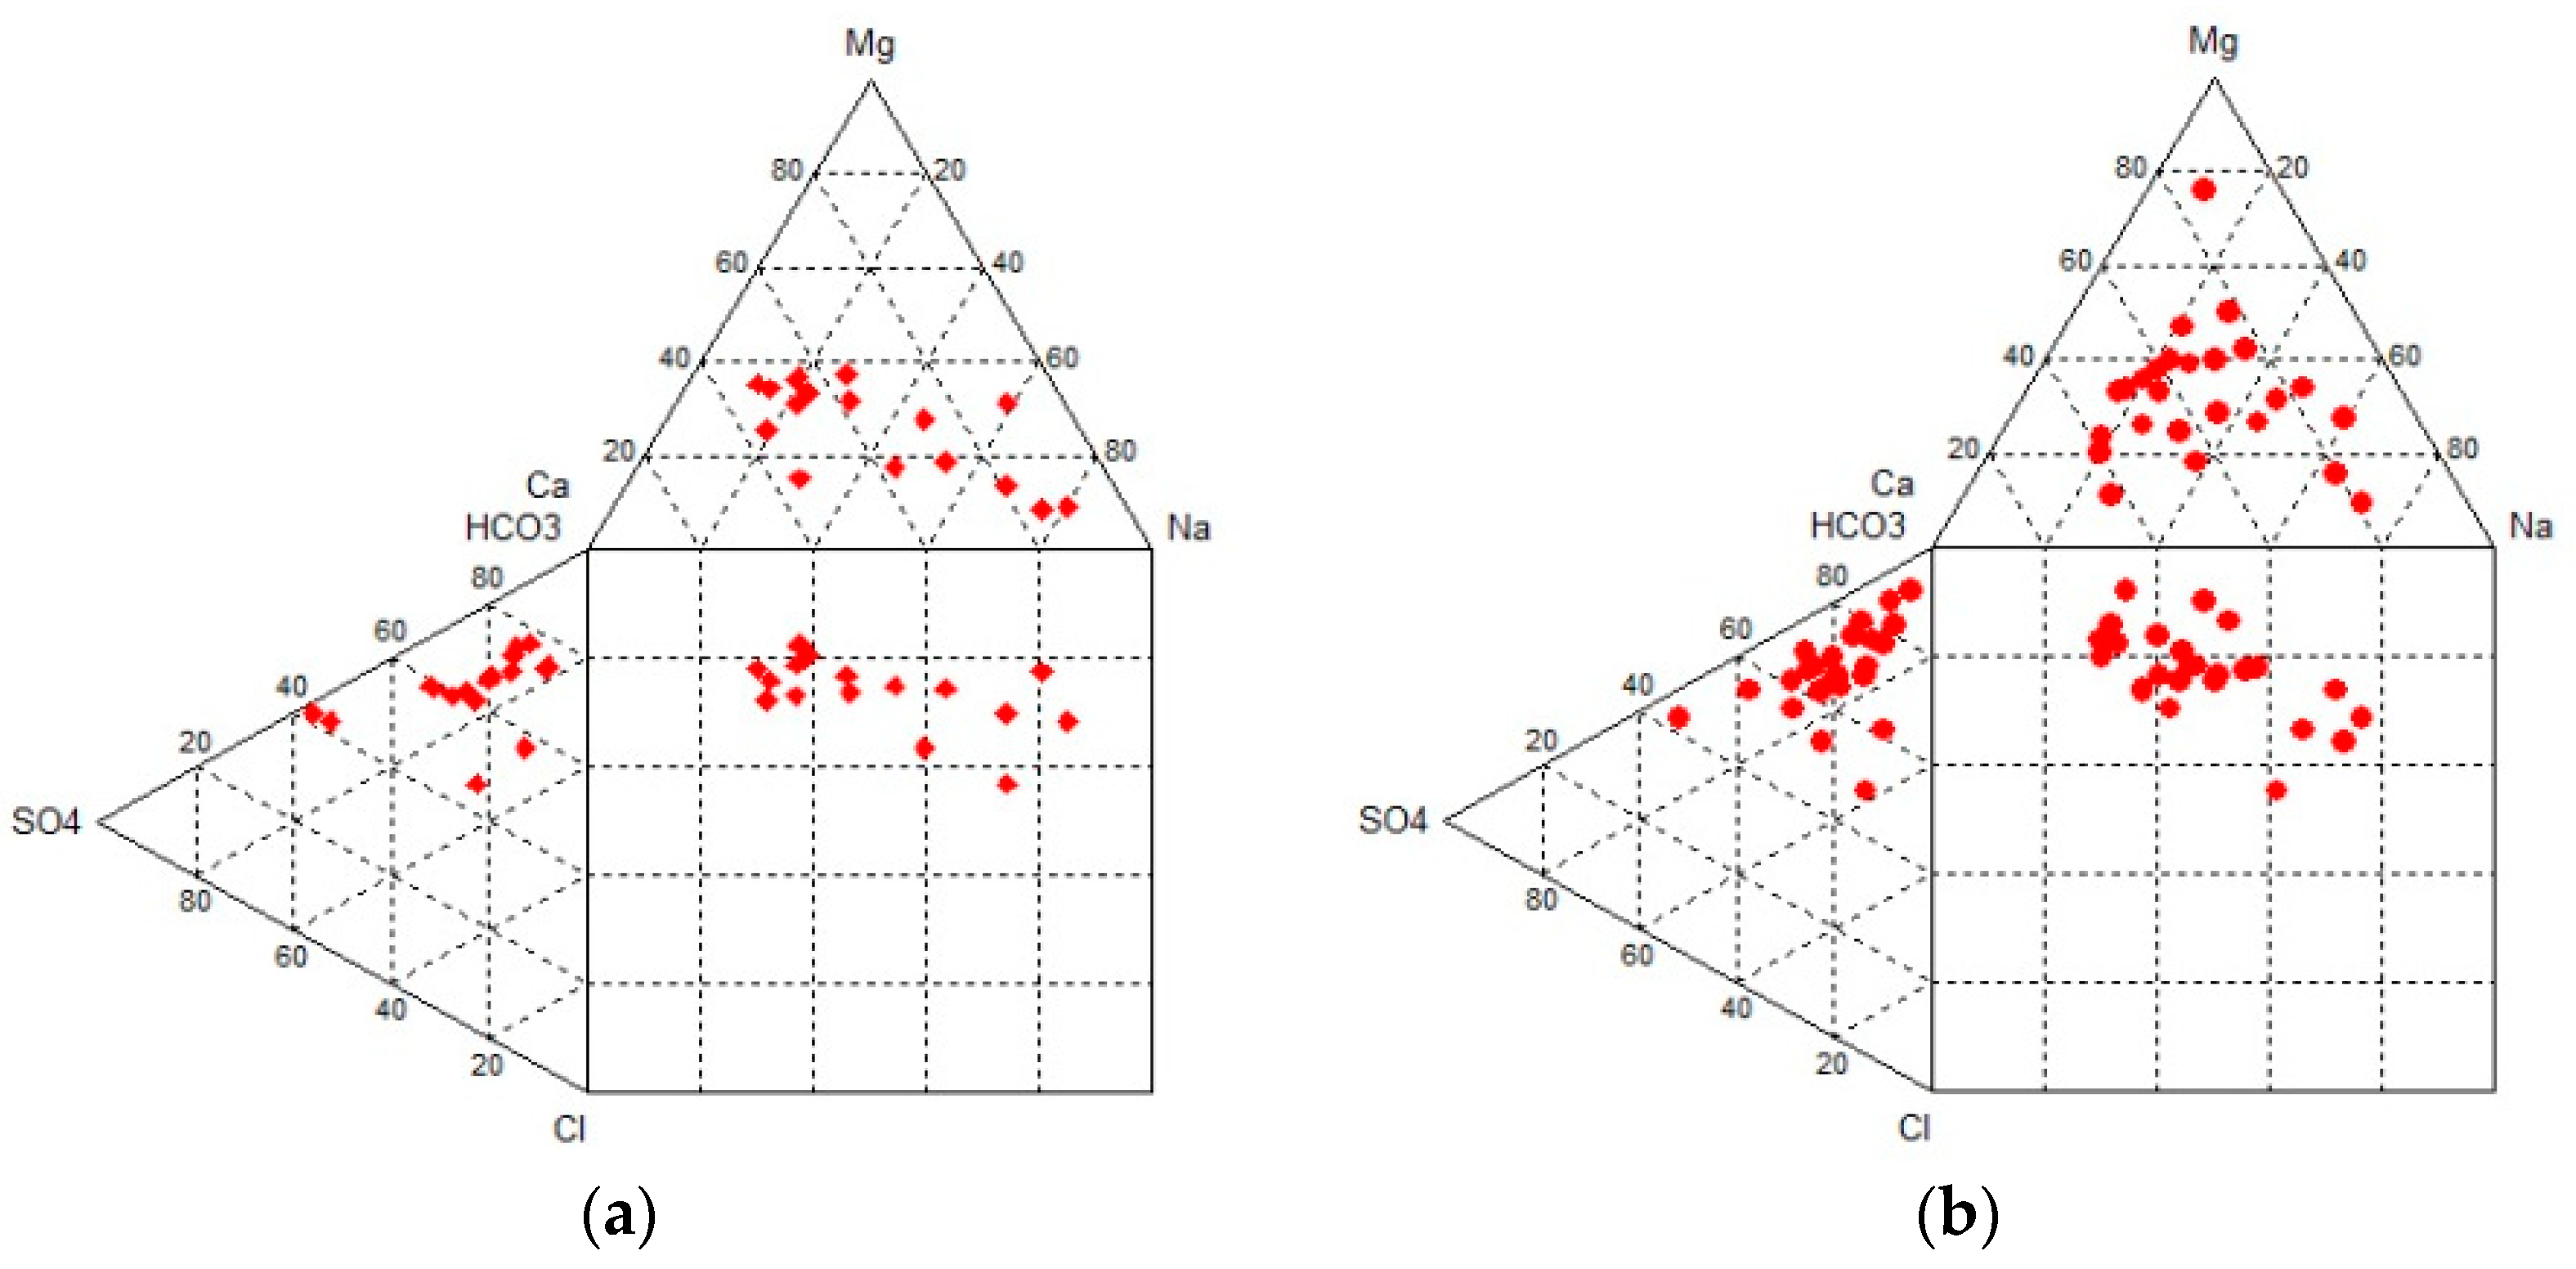
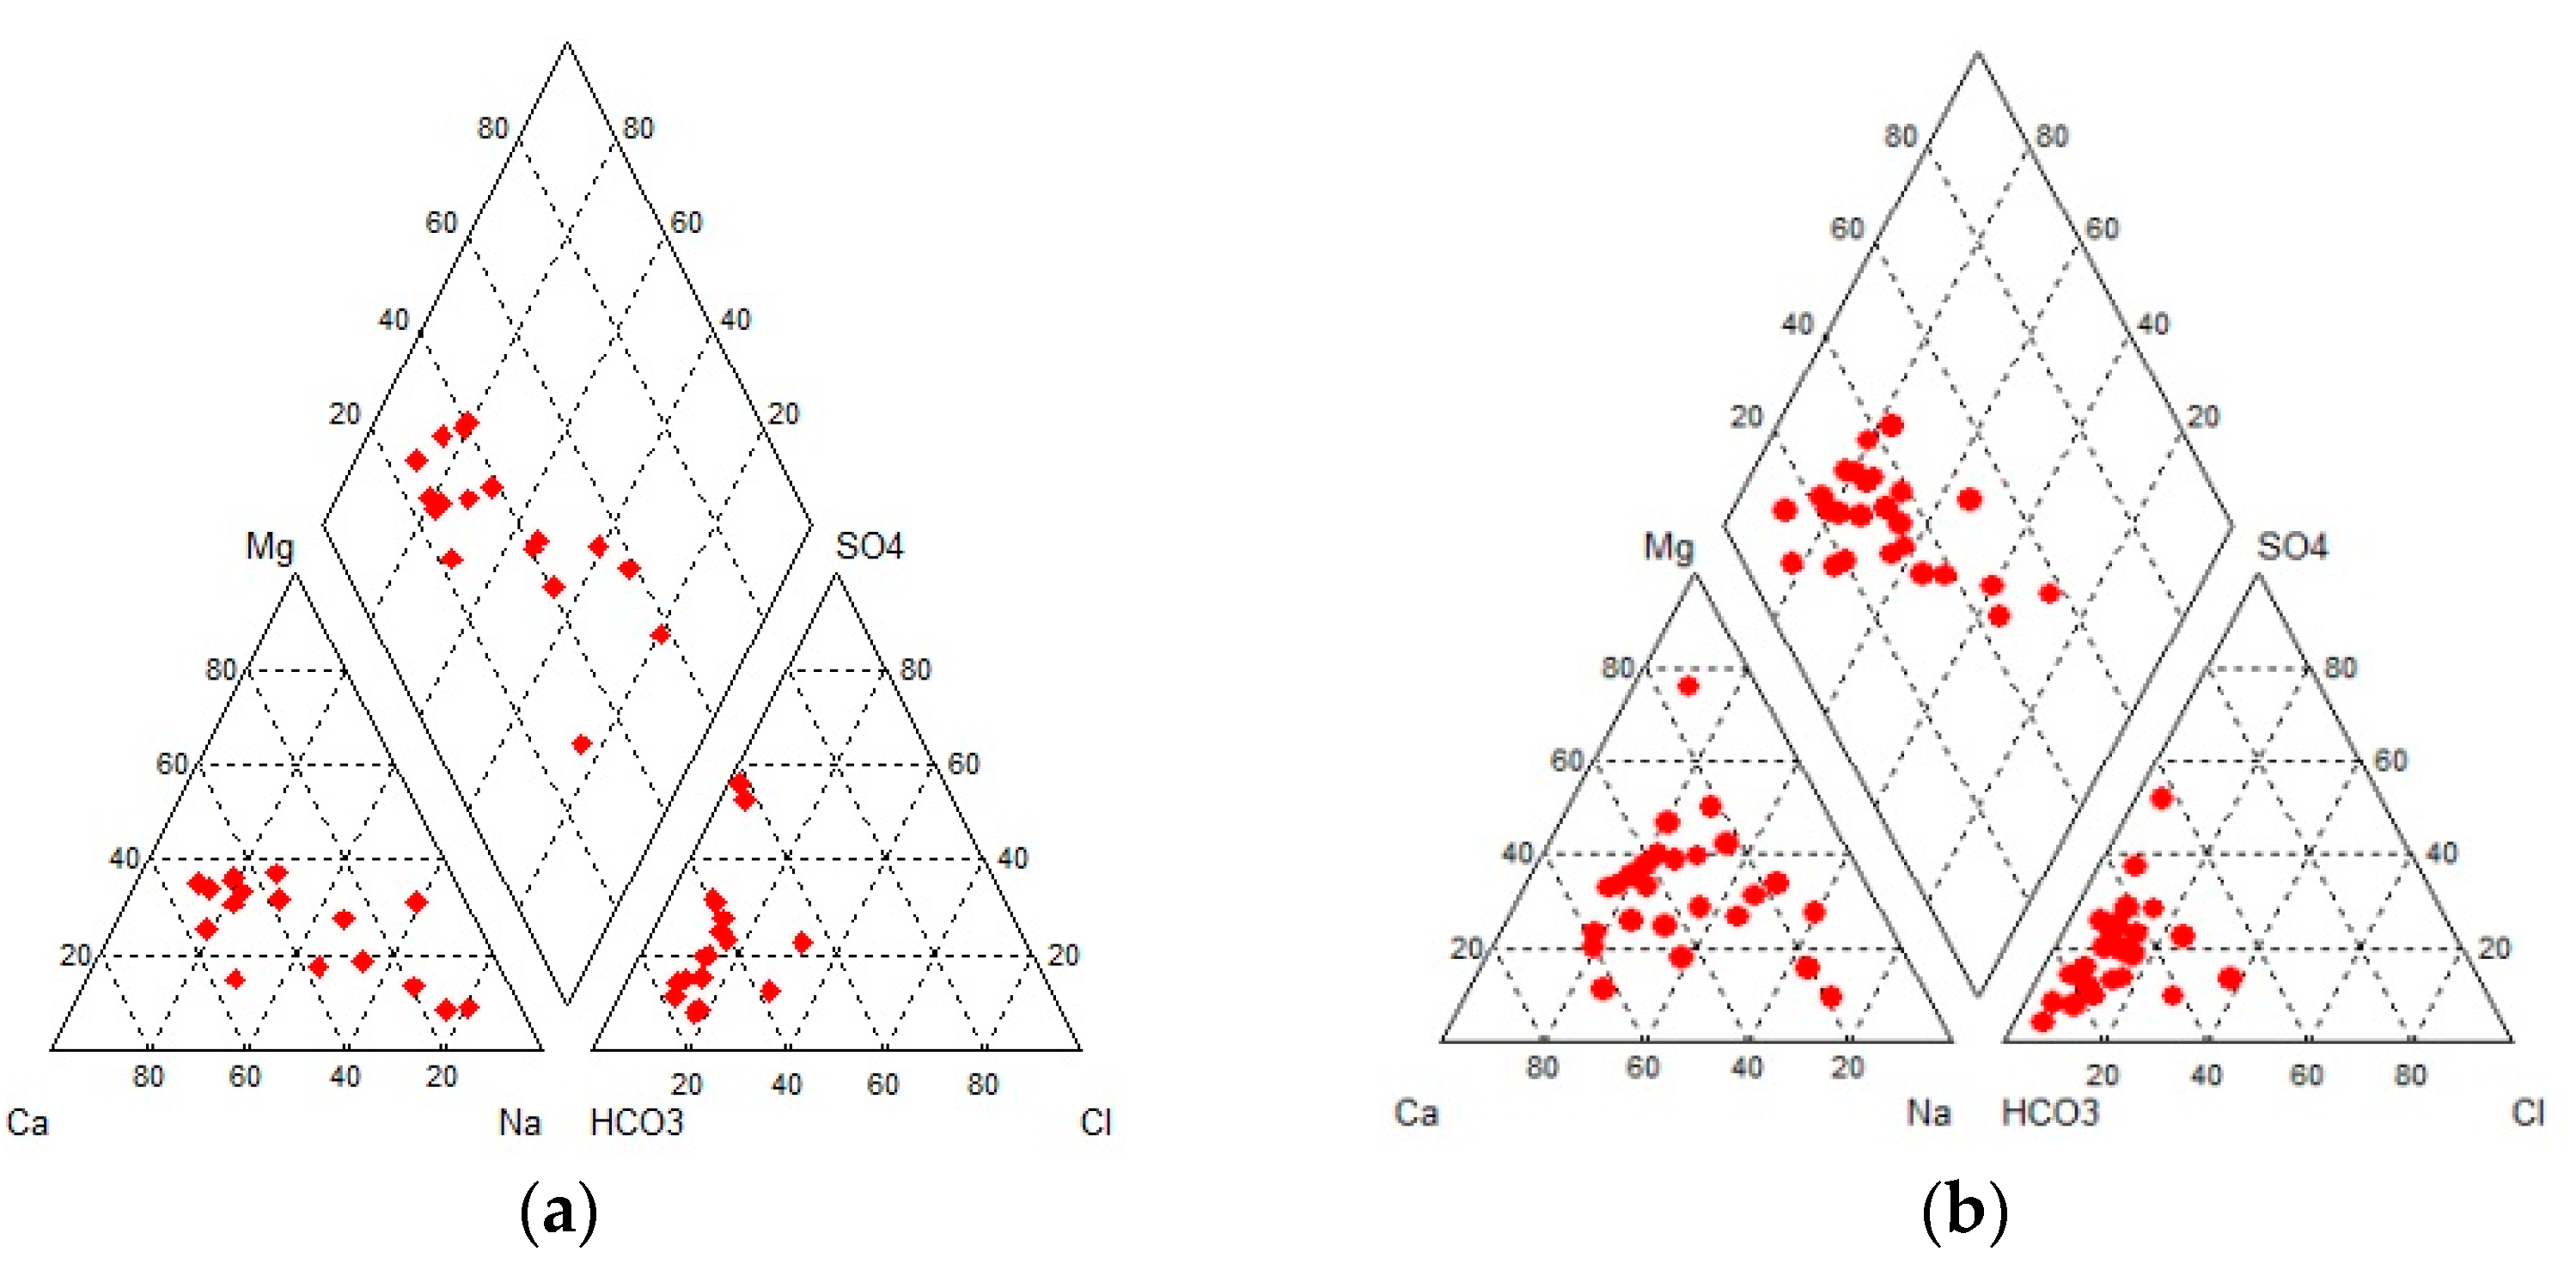
Concerning Piper diagrams, all samples regarding anions belong to bicarbonate, while in terms of cations, samples belong to calcium and sodium. Based on anions and cations (diamond), the majority belongs to the category of water coming from mixing processes with increased values of sodium. There are no dominant ions (
Figure 6).
The SAR index proposed by the salinity laboratory of the US Department of Agriculture defines the degree of Na
+ adsorption by soil because this ion influences soil permeability [
10]. SAR values range between 0.15 and 0.5, indicating that the water is suitable or permissible for irrigation use.
Statistical Analysis
Application of factor analysis [
11,
12,
13] in all the chemical analyses of the period 2014–2016 showed that three factors, explaining 71% of the total variance, could describe the main hydrogeological and hydrochemical processes which take place in the Mygdonia basin. The first factor accounts for 32.6% of the total variance of the data and has high loadings on Mg, Na, EC, HCO
3, and Cl. This factor correlates to the mixing activities of water.
The second factor accounts for 21.5% of the total variance and exhibits high loadings with respect to calcium (dissolution of carbonates), and the third factor (16.8% of the total variance) shows high loadings on sulfate indicating an origin from fertilizers and/or geothermal fluids [
14].
4. Conclusions and Discussion
Hydrochemical analysis was carried out to draw conclusions about the groundwater quality of the Mygdonia basin. From the analysis, a possible connection with geothermal fluids emerged. More specifically, regarding temperature values in some places, they were slightly increased (values up to 21.8 °C), which is probably connected to the existence of a geothermal field, while SO42− appears elevated along the northern coastline of Lake Koronia, which may also be due to their mixing with geothermal fluids. Alongside, nitrate ions show high concentration values in the lowland part of the Mygdonia basin, probably due to the intense agricultural activity and use of fertilizers.
Based on Piper and Durov diagrams, it follows that the groundwater of the area has calcium and sodium as its main cations and bicarbonate as its main anion. That is, the dominant hydrochemical type of groundwater is Ca-HCO3 and mixing water types. Based on SAR values, the water is suitable for irrigation. Large numbers of samples exceeded the permissible upper limit of 50 mg/L (EU Council) for drinking water.
A set of measures, including monitoring (water quality, groundwater level, level of lakes, climatic data, water abstractions, etc.), should be applied for the protection of water quality and the sustainability of aquifers alongside the socio-economic development of the wider area. The application of rational fertilization waste-water treatment plants, as well as the delineation of protection zones around the boreholes and springs for water supply, will contribute to water quality protection.
Further investigation into the role of the geothermal field on groundwater quality should be implemented in the area of the boreholes in which high-temperature values were recorded. The continuous monitoring of groundwater quality characteristics is essential for the rational and sustainable management of groundwater in the Mygdonia basin.
Author Contributions
Conceptualization, K.V.; methodology, K.D. and K.V.; data curation, K.D., T.K. and C.M.; writing—original draft preparation, K.D. and C.M.; writing—review and editing, K.D., C.M. and T.K.; supervision, K.V. All authors have read and agreed to the published version of the manuscript.
Funding
This research received no external funding.
Institutional Review Board Statement
Not applicable.
Informed Consent Statement
Not applicable.
Data Availability Statement
Not applicable.
Acknowledgments
A part of this research was carried out in the framework of the Thesis of Kyriaki Devlioti, Laboratory of Engineering Geology & Hydrogeology, Department of Geology, Aristotle University of Thessaloniki, Greece (Supervisor: K. Voudouris).
Conflicts of Interest
The authors declare no conflict of interest.
References
- Devlioti, K. Hydrogeological Research and Groundwater Quality of the Mygdonia Basin. Master Thesis, School of Geology, Aristotle University of Thessaloniki, Thessaloniki, Greece, 2016; p. 128. (In Greek). [Google Scholar]
- Ballas, L.G. Use of Fuzzy Rules in Water Resources Management-Application to the Volvi Hydrological Basin. Ph.D. Thesis, Aristotle University Thessaloniki, Thessaloniki, Greece, 2007. [Google Scholar]
- Malamataris, D.; Kolokytha, E.; Loukas, A. Integrated hydrological modelling of surface water and groundwater under climate change: The case of the Mygdonia basin in Greece. J. Water Clim. Chang. 2020, 11, 1429–1454. [Google Scholar] [CrossRef]
- Chantzi, P.; Dotsika, E. Mygdonia Basin (N. Greece) in the View of Isotope Geochemistry. In Energy, Transportation and Global Warming, Green Energy and Technology; Grammelis, P., Ed.; Springer International Publishing: Cham, Switzerland, 2016. [Google Scholar] [CrossRef]
- Psilovikos, A. Paleogeographic Development of the Basin and Lake of Mygdonia (Lagada and Volvi Area, Greece). Ph.D. Thesis, Department of Geology, Aristotle University of Thessaloniki, Thessaloniki, Greece, 1977. (In Greek). [Google Scholar]
- Mountrakis, D. Geology of Greece; University Studio Press: Thessaloniki, Greece, 1985. [Google Scholar]
- Bornovas, J.; Rondoyanni, T. Geological Map of Greece, Scale 1:500.000, 2nd ed.; Institute of Geology and Mineral Exploration: Thessaloniki, Greece, 1983. [Google Scholar]
- Nimfopoulos, M.K.; Mylopoulos, M.; Katirtzoglou, K. A qualitative-quantitative study of water and environmental pollution at the broader area of the Mygdonia basin, Thessaloniki, n. Greece. In Proceedings of the 6th Pan-Hellenic Geographical Conference of the Hellenic Geographical Society, Thessaloniki, Greece, 3–6 October 2002. [Google Scholar]
- Mattas, C.; Kaklis, T.; Devlioti, K.; Vouvalidis, K. Groundwater qualitative characteristics of Mygdonia basin. Investigation of the pollution sources and suitability for human use. Bull. Geol. Soc. Greece 2016, L, 854–864. [Google Scholar]
- Tizro, T.A.; Voudouris, K. Groundwater quality in the semi-arid region of the Chahardouly basin, West Iran. Hydrol. Process. 2008, 22, 3066–3078. [Google Scholar] [CrossRef]
- Voudouris, K.; Lambrakis, N.; Papatheodorou, G.; Daskalaki, P. An application of factor analysis for the study of the Hydrogeological conditions in Plio-Pleistocene aquifers of NW Achaia (NW Peloponnesus, Greece). Math. Geol. 1997, 29, 43–59. [Google Scholar] [CrossRef]
- Voudouris, K.; Panagopoulos, A.; Koumantakis, J. Multivariate statistical analysis in the assessment of Hydrochemistry of the Northern Korinthia Prefecture alluvial aquifer system (Peloponnese, Greece). Nat. Resour. Res. 2000, 9, 135–146. [Google Scholar] [CrossRef]
- Busico, G.; Cuoco, E.; Kazakis, N.; Colombani, N.; Mastrocicco, M.; Tedesco, D.; Voudouris, K. Multivariate statistical analysis to characterize/discriminate between anthropogenic and geogenic trace element occurrence in the Campania Plain, Southern Italy. Environ. Pollut. 2018, 234, 260–269. [Google Scholar] [CrossRef] [PubMed]
- Poutoukis, D.; Ntotsika, E. Hydrogeochemical and isotopic investigation of the thermal bath water from Lagada and Volvi. In Proceedings of the 2nd Hydrogeological Congress, Patras, Greece, 24–28 November 1993; Greek Committee of Hydrogeology: Athens, Greece, 1994; Volume B, pp. 679–689. (In Greek). [Google Scholar]
| Disclaimer/Publisher’s Note: The statements, opinions and data contained in all publications are solely those of the individual author(s) and contributor(s) and not of MDPI and/or the editor(s). MDPI and/or the editor(s) disclaim responsibility for any injury to people or property resulting from any ideas, methods, instructions or products referred to in the content. |
© 2023 by the authors. Licensee MDPI, Basel, Switzerland. This article is an open access article distributed under the terms and conditions of the Creative Commons Attribution (CC BY) license (https://creativecommons.org/licenses/by/4.0/).


_S._Voudouris.png)


