1. Introduction
India is a diverse country with a wide variety of agricultural products owing to its different climatic conditions. Banana ranks second amongst fruit consumption in India after mango due to its low price and high nutritional value [
1]. The area under banana cultivation has increased up to 880 thousand hectares, with a production of approximately 35 million metric tons in 2022 [
2]. The leading producers of bananas are the Tamil Nadu, Maharashtra, and Gujarat states of India, indicating their important contribution in banana crop production. Anand is one of the important banana producing districts of Gujarat and contributes significantly to the total banana production of the state. However, the latest data of the year 2022 shows that farmers are turning to other fruit crops because the banana is a water-intensive crop and water levels across the state are declining. In addition, the overall yield of the banana is decreasing due to climate change and irregular precipitation, and it is getting every day. In contrast to this, the demand for the banana is increasing gradually due to its high nutritional value and its affordability.
Accurate predictions of crop production are critical for developing effective strategies at the farm level [
3]. Prediction of banana crop yield, therefore, has become imperative given the fact that its importance is increasing so incredibly. The availability of different types of spatial data makes it easy to carry out geospatial analysis and understand the impact of different ecological factors on the banana crop. This study utilized various parameters like Normalized Difference Water Index (NDWI), Land Surface Temperature (LST), Evapotranspiration (ET), Normalized Difference Vegetation Index (NDVI), Enhanced Vegetation Index (EVI), and Leaf Area Index (LAI) to forecast the banana yield of the Anand district. In this study, LAI is considered as a proxy for the banana yield given that high LAI indicates healthy crop and high production. Modelling carried out using different techniques aids our understanding of the impact of various parameters on crop yield and helps to generate accurate models for the prediction of the yield. Among the different models, a mathematical model provides a description of the behaviour of real-world systems in mathematical concepts, terms, and languages such as equations, inequalities, functions, variables, and constraints [
4]. Moreover, these models allow us to make crop predictions under specific environmental conditions [
5].
Therefore, this study attempts to utilize a geospatial approach in order to forecast the banana crop yield of the Anand district of Gujarat using mathematical modeling.
2. Study Area
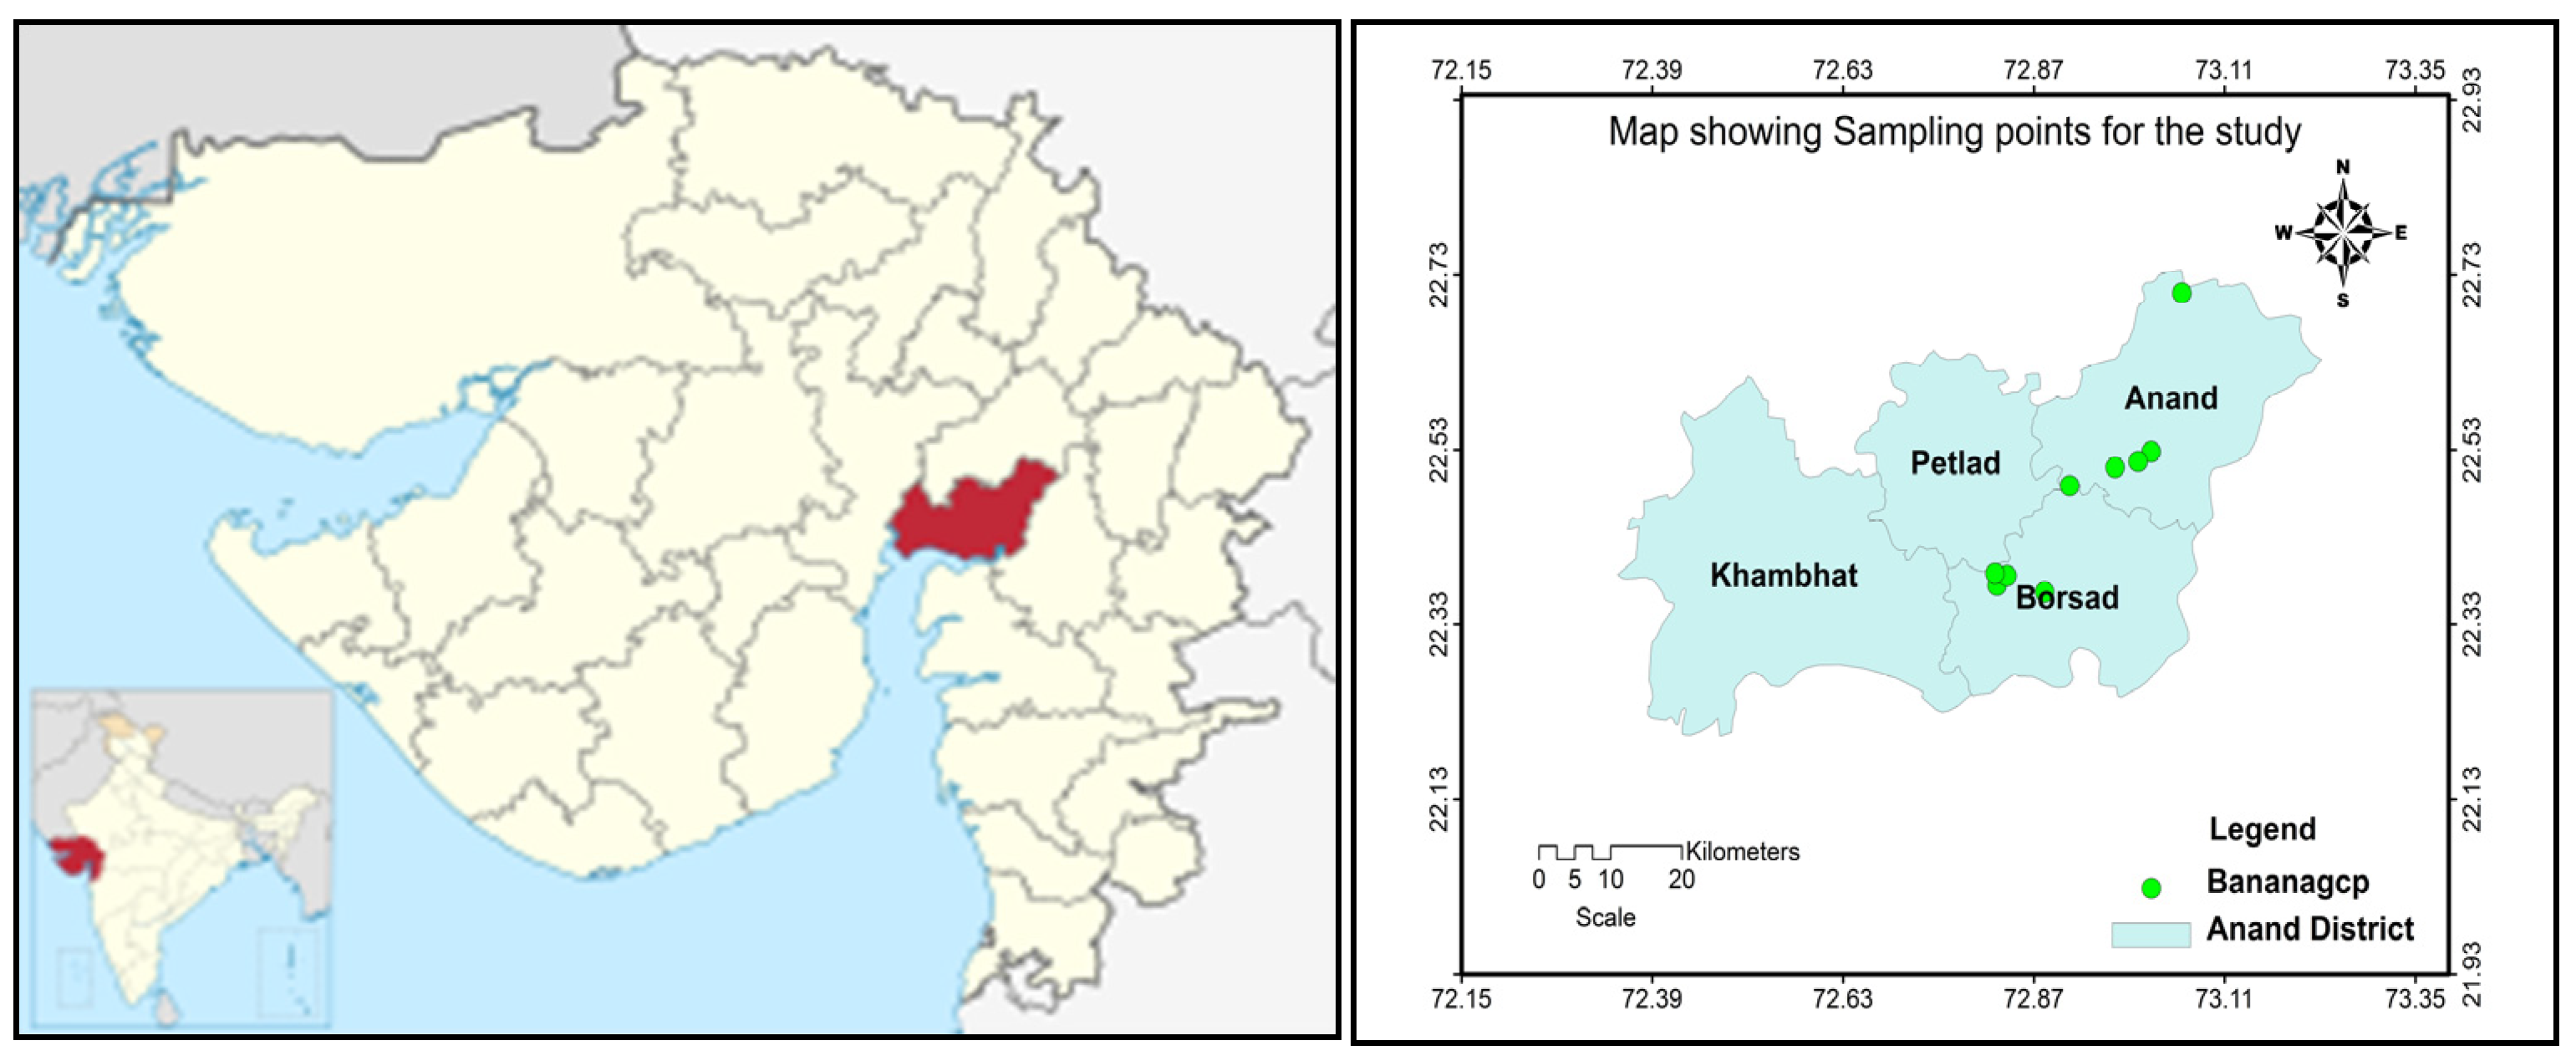
Anand is primarily an agricultural district of the Gujarat State of India (
Figure 1). As per climatological data of the nearest Indian Meteorological Department (IMD) Station at Ahmedabad, the summers are generally hot and the winters are cool. Mean maximum temperature ranges between 28.4 °C during January and about 41.8 °C during May, and the mean minimum temperatures vary between 11.7 °C during January and 27 °C during June. Long-term average annual rainfall for the Ahmedabad IMD station is 799.6 mm. Most of the rainfall is received during the south-west monsoon between June and September [
6]. The banana is one of the key crops grown in the district in terms of its value. The planting season of the banana varies between mid-February and the first week of March. More than 10,000 Ha land is under banana cultivation, and since it is an annual crop and needs more investment, even the scale of finance for banana cultivation is reasonably high.
3. Methodology and Material
The banana crop yield forecasting needs different parameters to be assessed to understand their impact on yield. A field study was carried out in the Anand district to locate banana fields, and Ground Control Points (GCP) were collected. A total of 11 different fields were identified, which covered the different parts of the district. The duration of the study was from January 2018 to December 2021 for all of the parameters. Sentinel 2 data was utilized to derive various indices like NDVI, EVI, and NDWI. LAI was derived from EVI using the following formula:
LST was also derived using a Landsat dataset after processing using ERDAS 9.1. ET data was also extracted from MODIS satellite data. Sentinel 2 data has a repetition of every 8 days, whereas MODIS satellite data has the repetition of every 15 days. Data for both the satellites collected from January 2018 to December 2021 were averaged out monthly, and values were extracted corresponding to GCPs using ENVI 5.1 software. Various statistical methods like regression, t-test, etc. were utilized to understand the impact of different parameters on the banana yield and to forecast that yield.
4. Result and Discussion
Agricultural production is significantly affected by environmental factors. Weather influences crop growth and development, causing large intra-seasonal yield variability. The Anand district, which is located in central Gujarat, shows significant variations in various environmental parameters. Application of geospatial approach helps in easy derivation of these parameters for a long timeseries of more than 10 years depending upon the requirement [
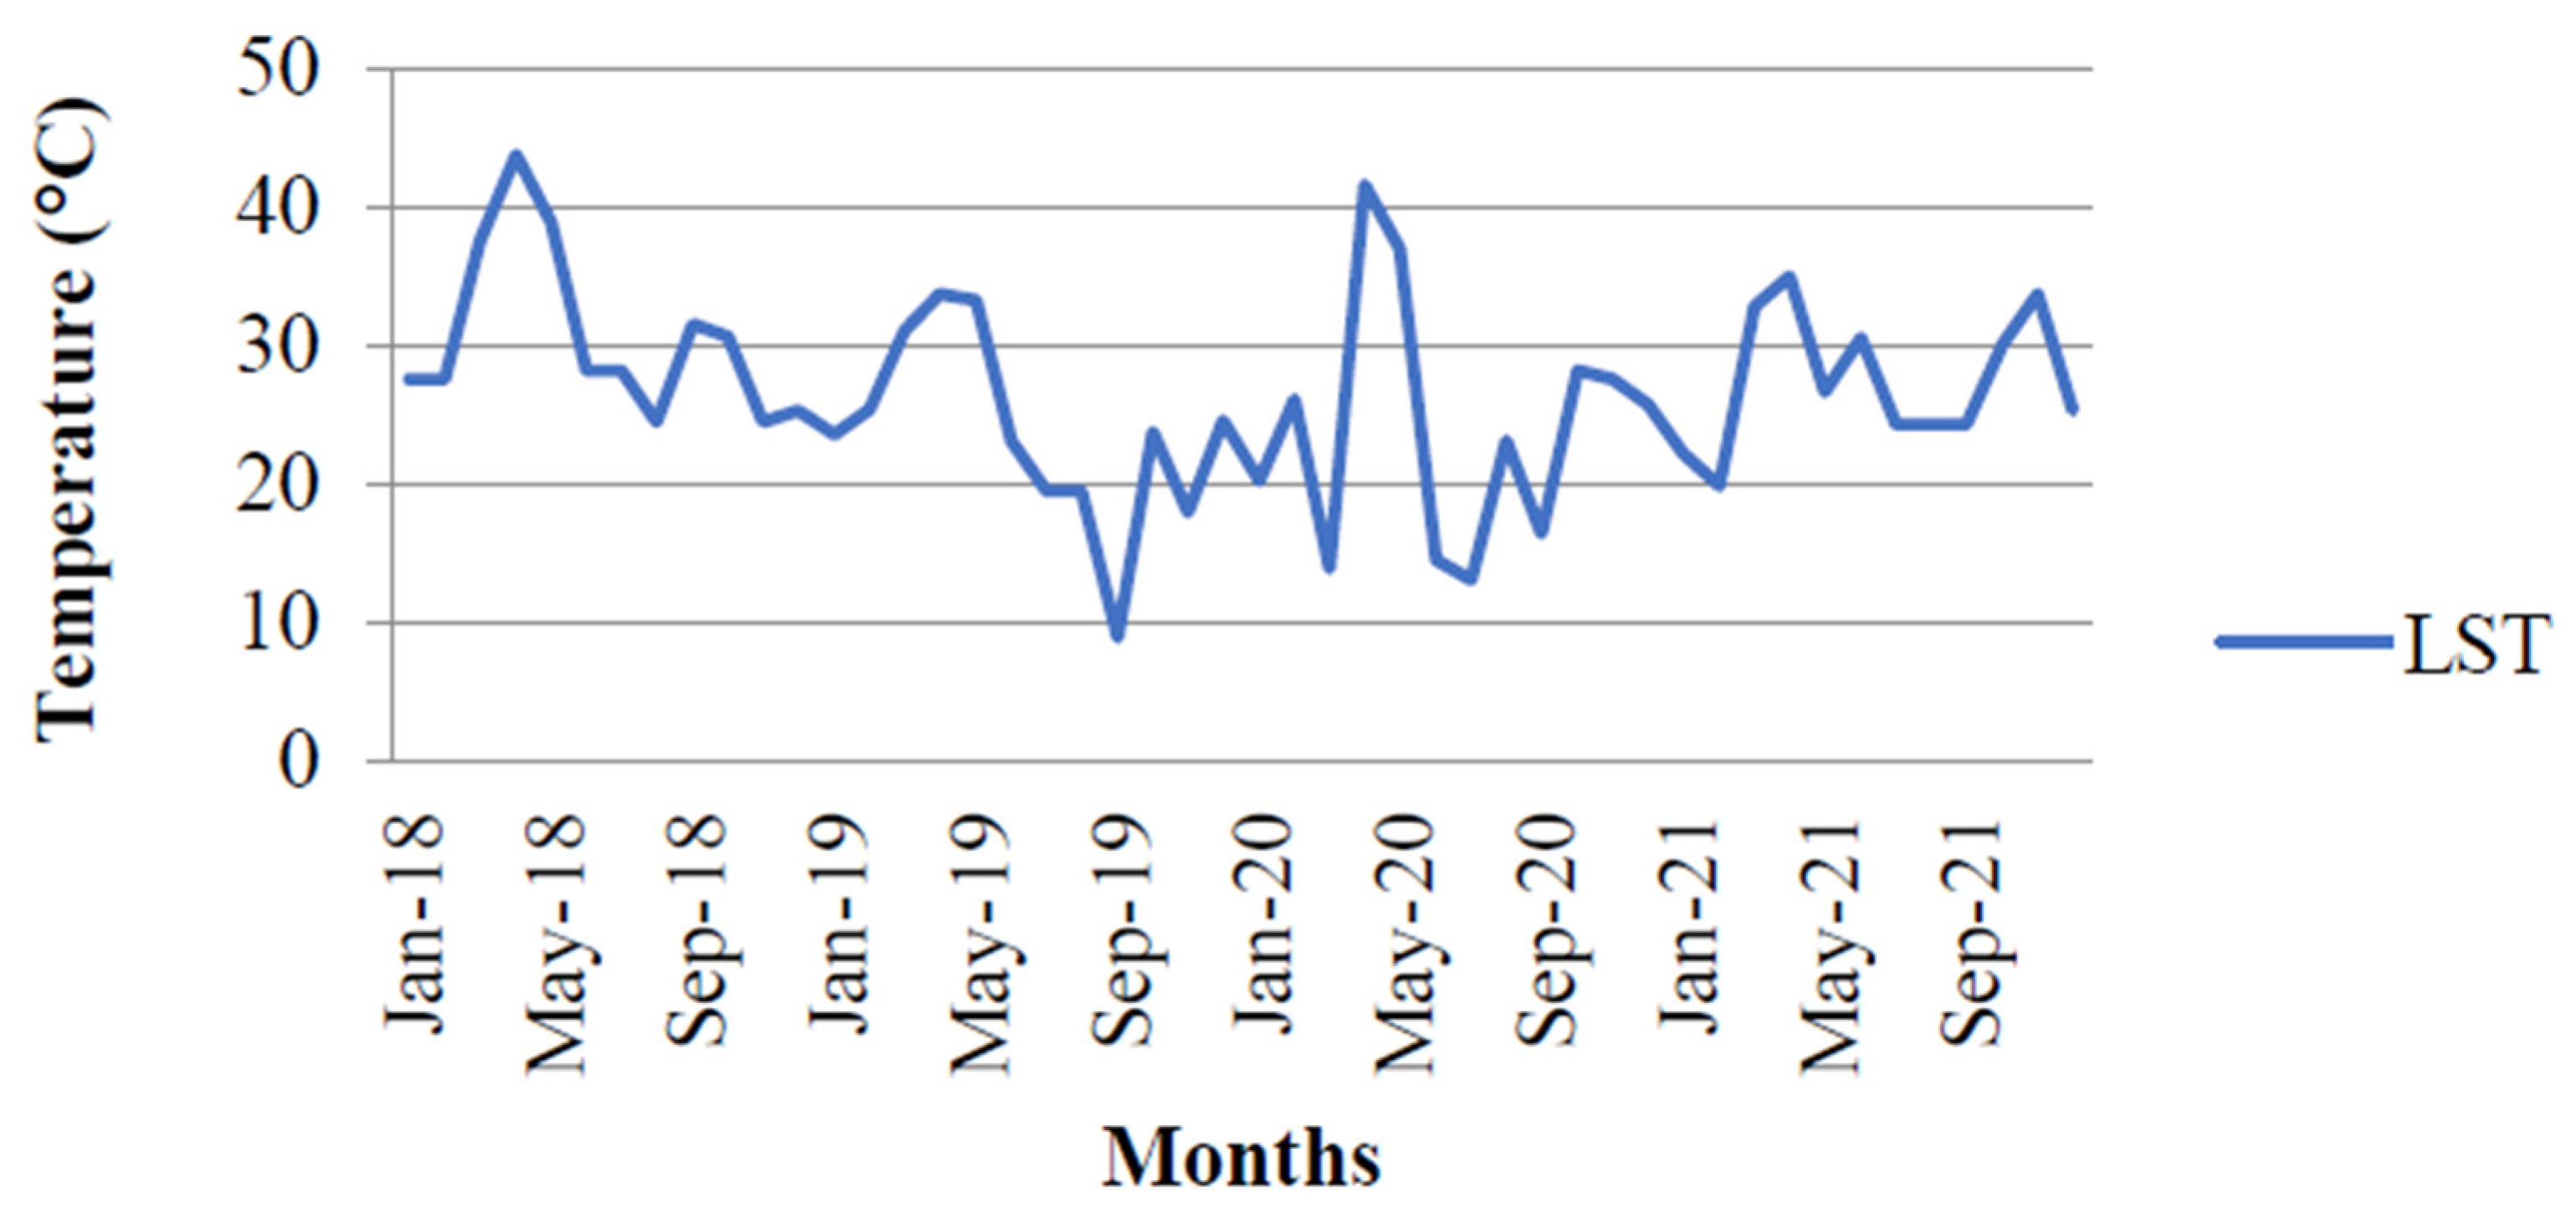
7]. Various parameters considered for the study showed a significant seasonal variation during the study period. LST varied from 8 °C in winter to 43 °C in summer, indicating the year round variations in temperature (
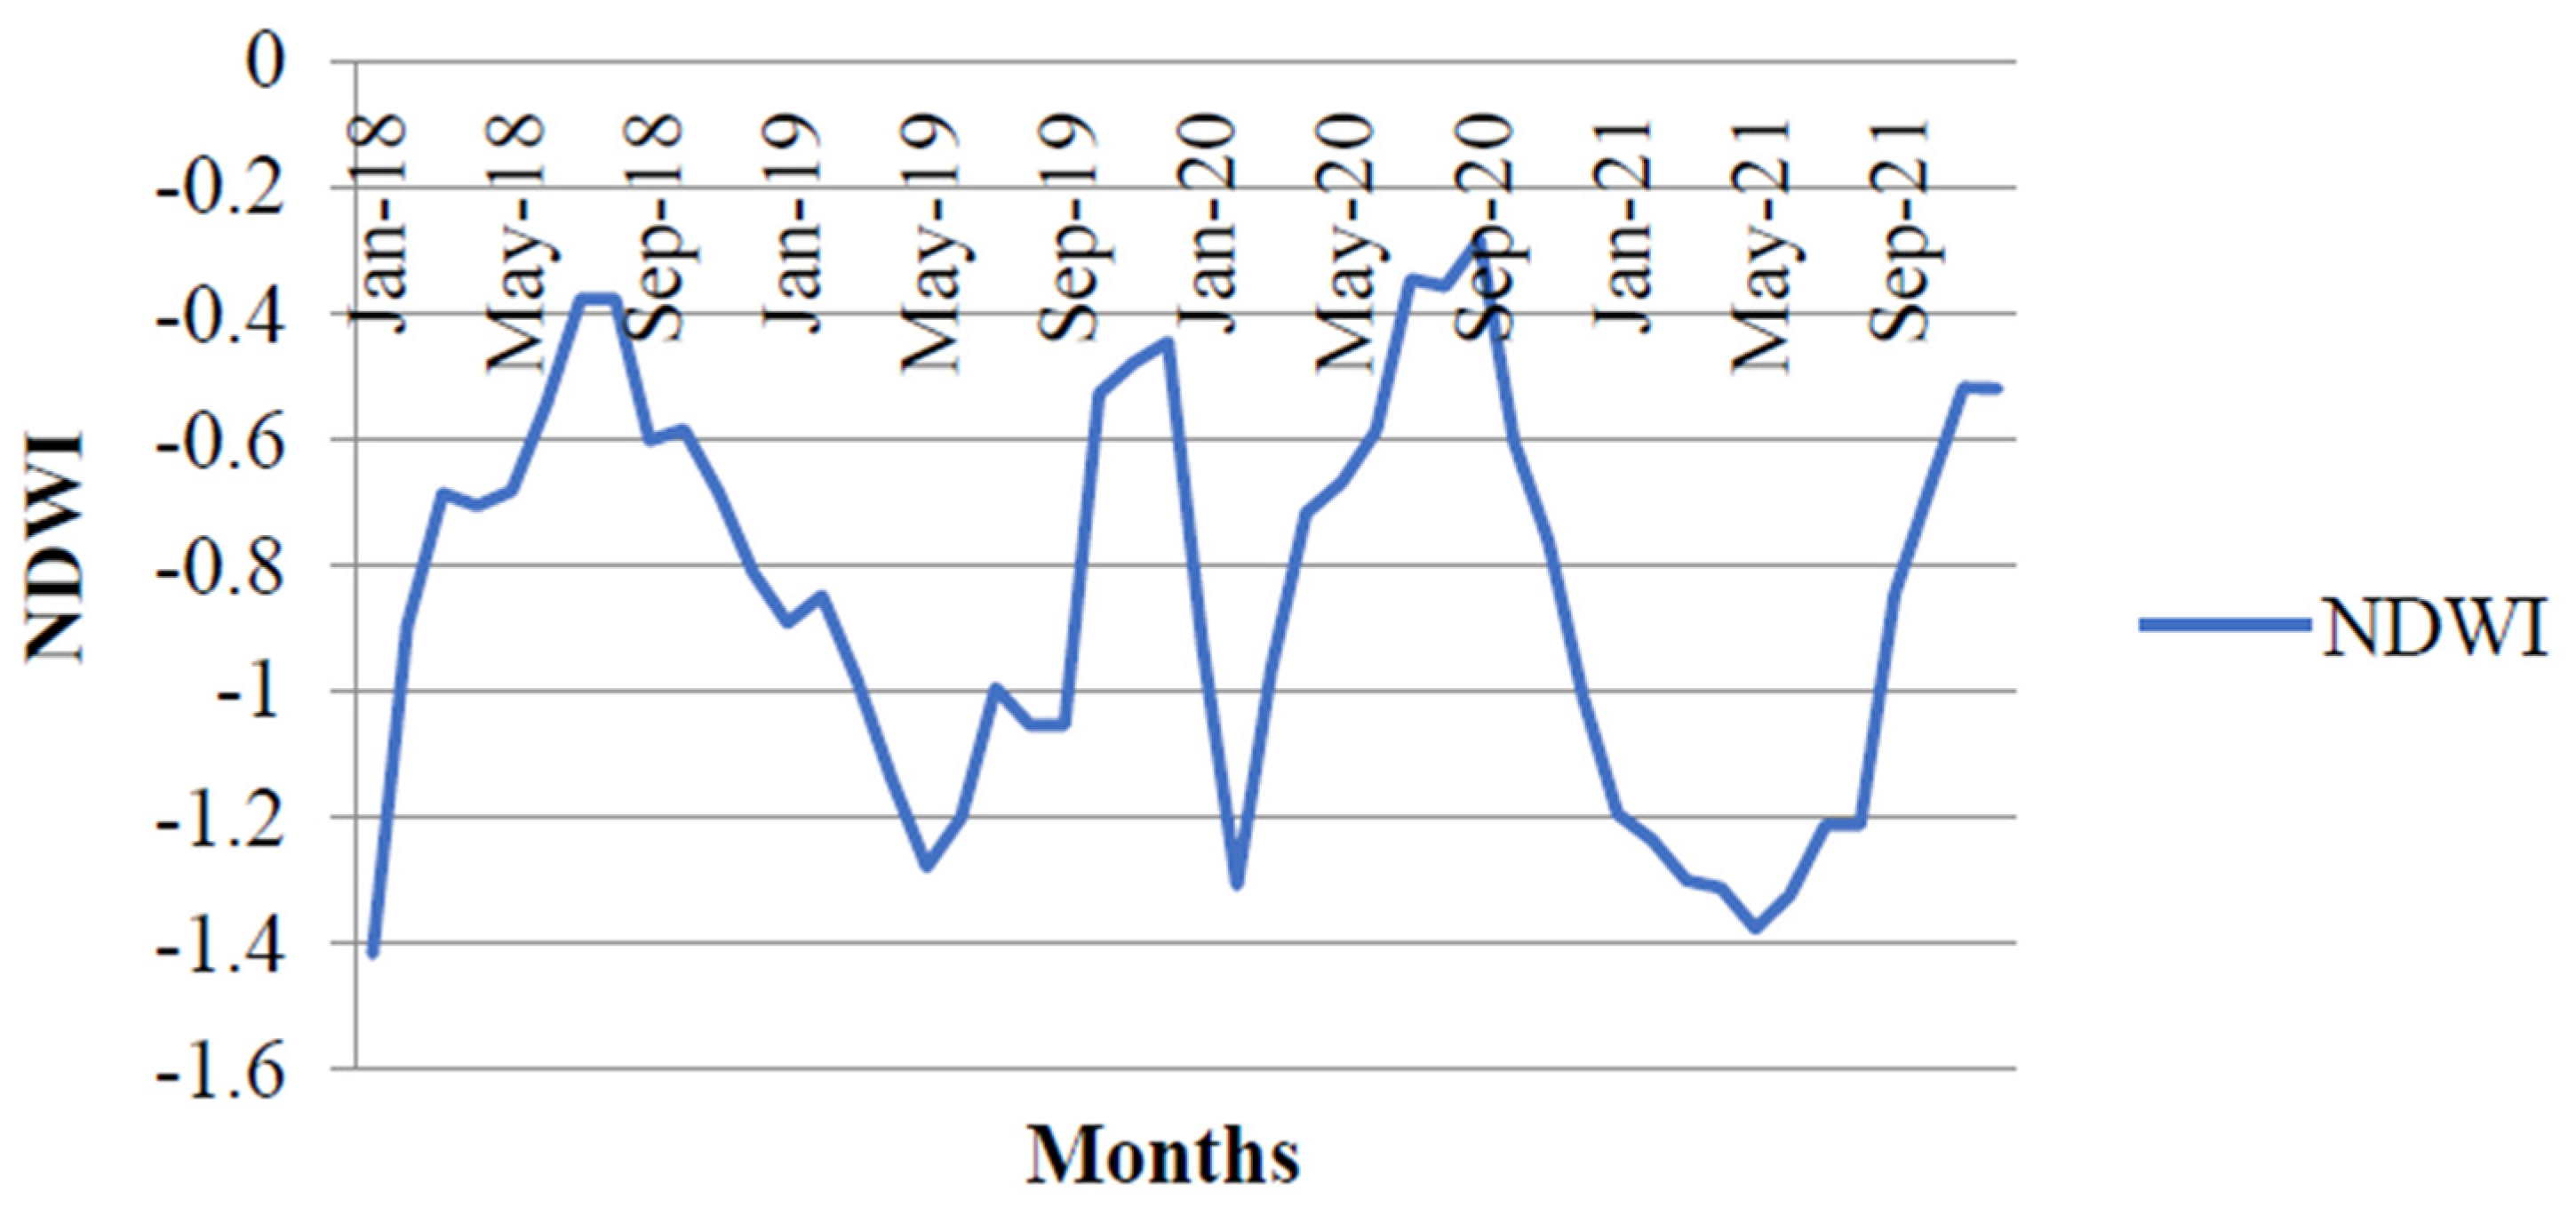
Figure 2). NDWI was found to vary from −1.41 to −0.28, indicating the variation in the water regime of the agricultural fields (
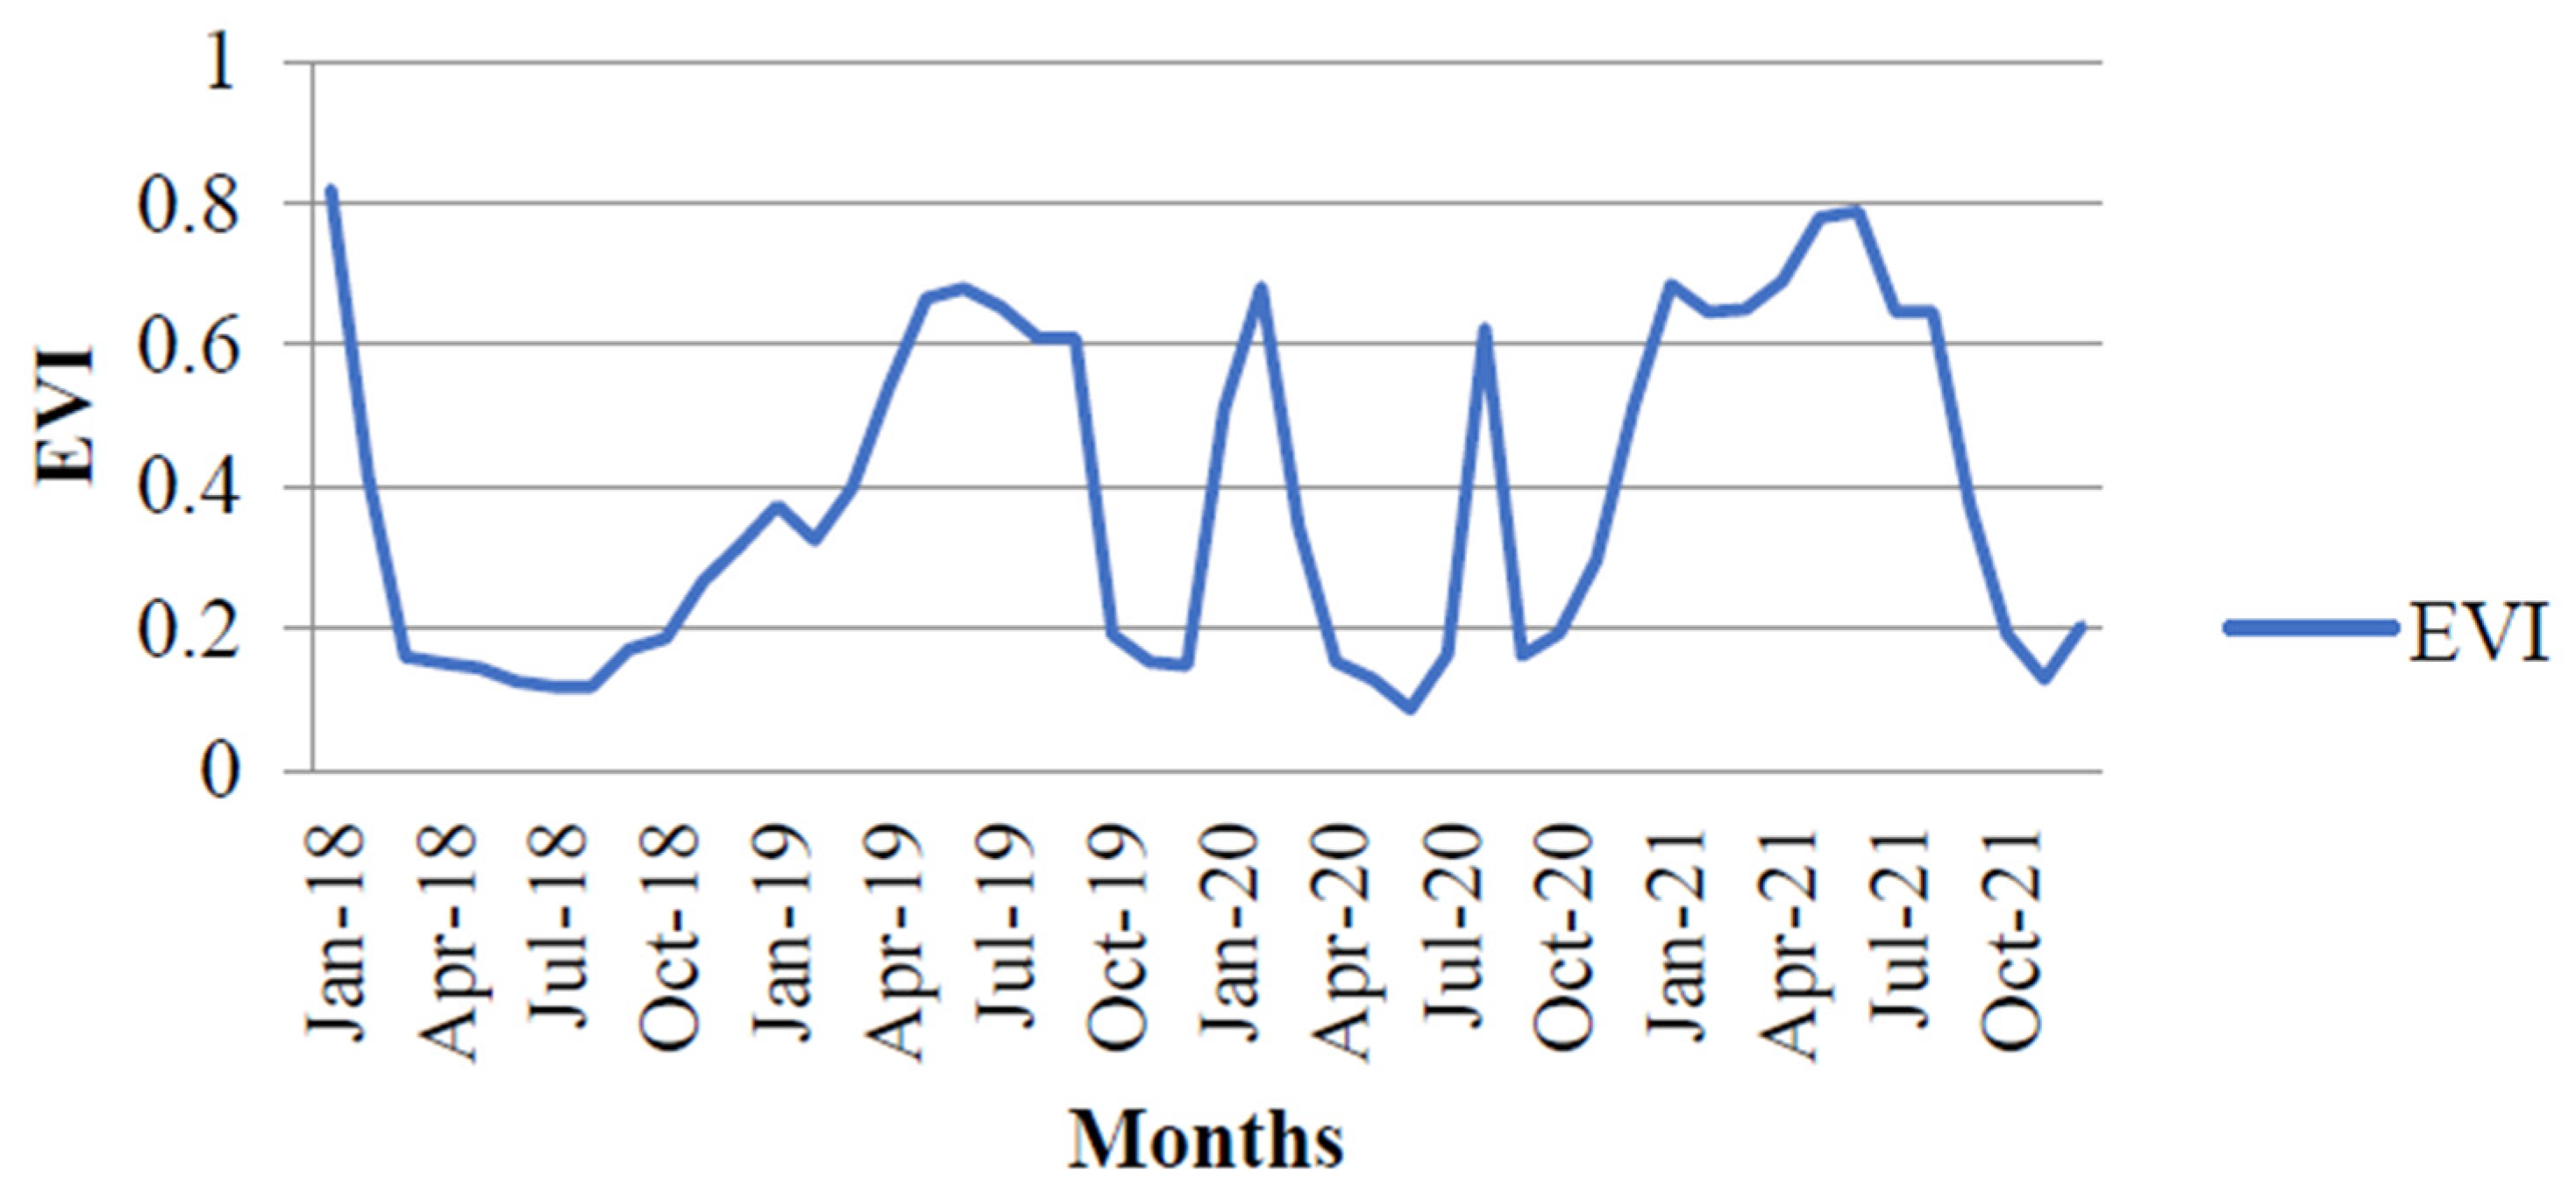
Figure 3). Low NDWI values were observed from January to June––months corresponding to the dry season of the year. EVI varied from 0.09 to 0.82 during the study period (
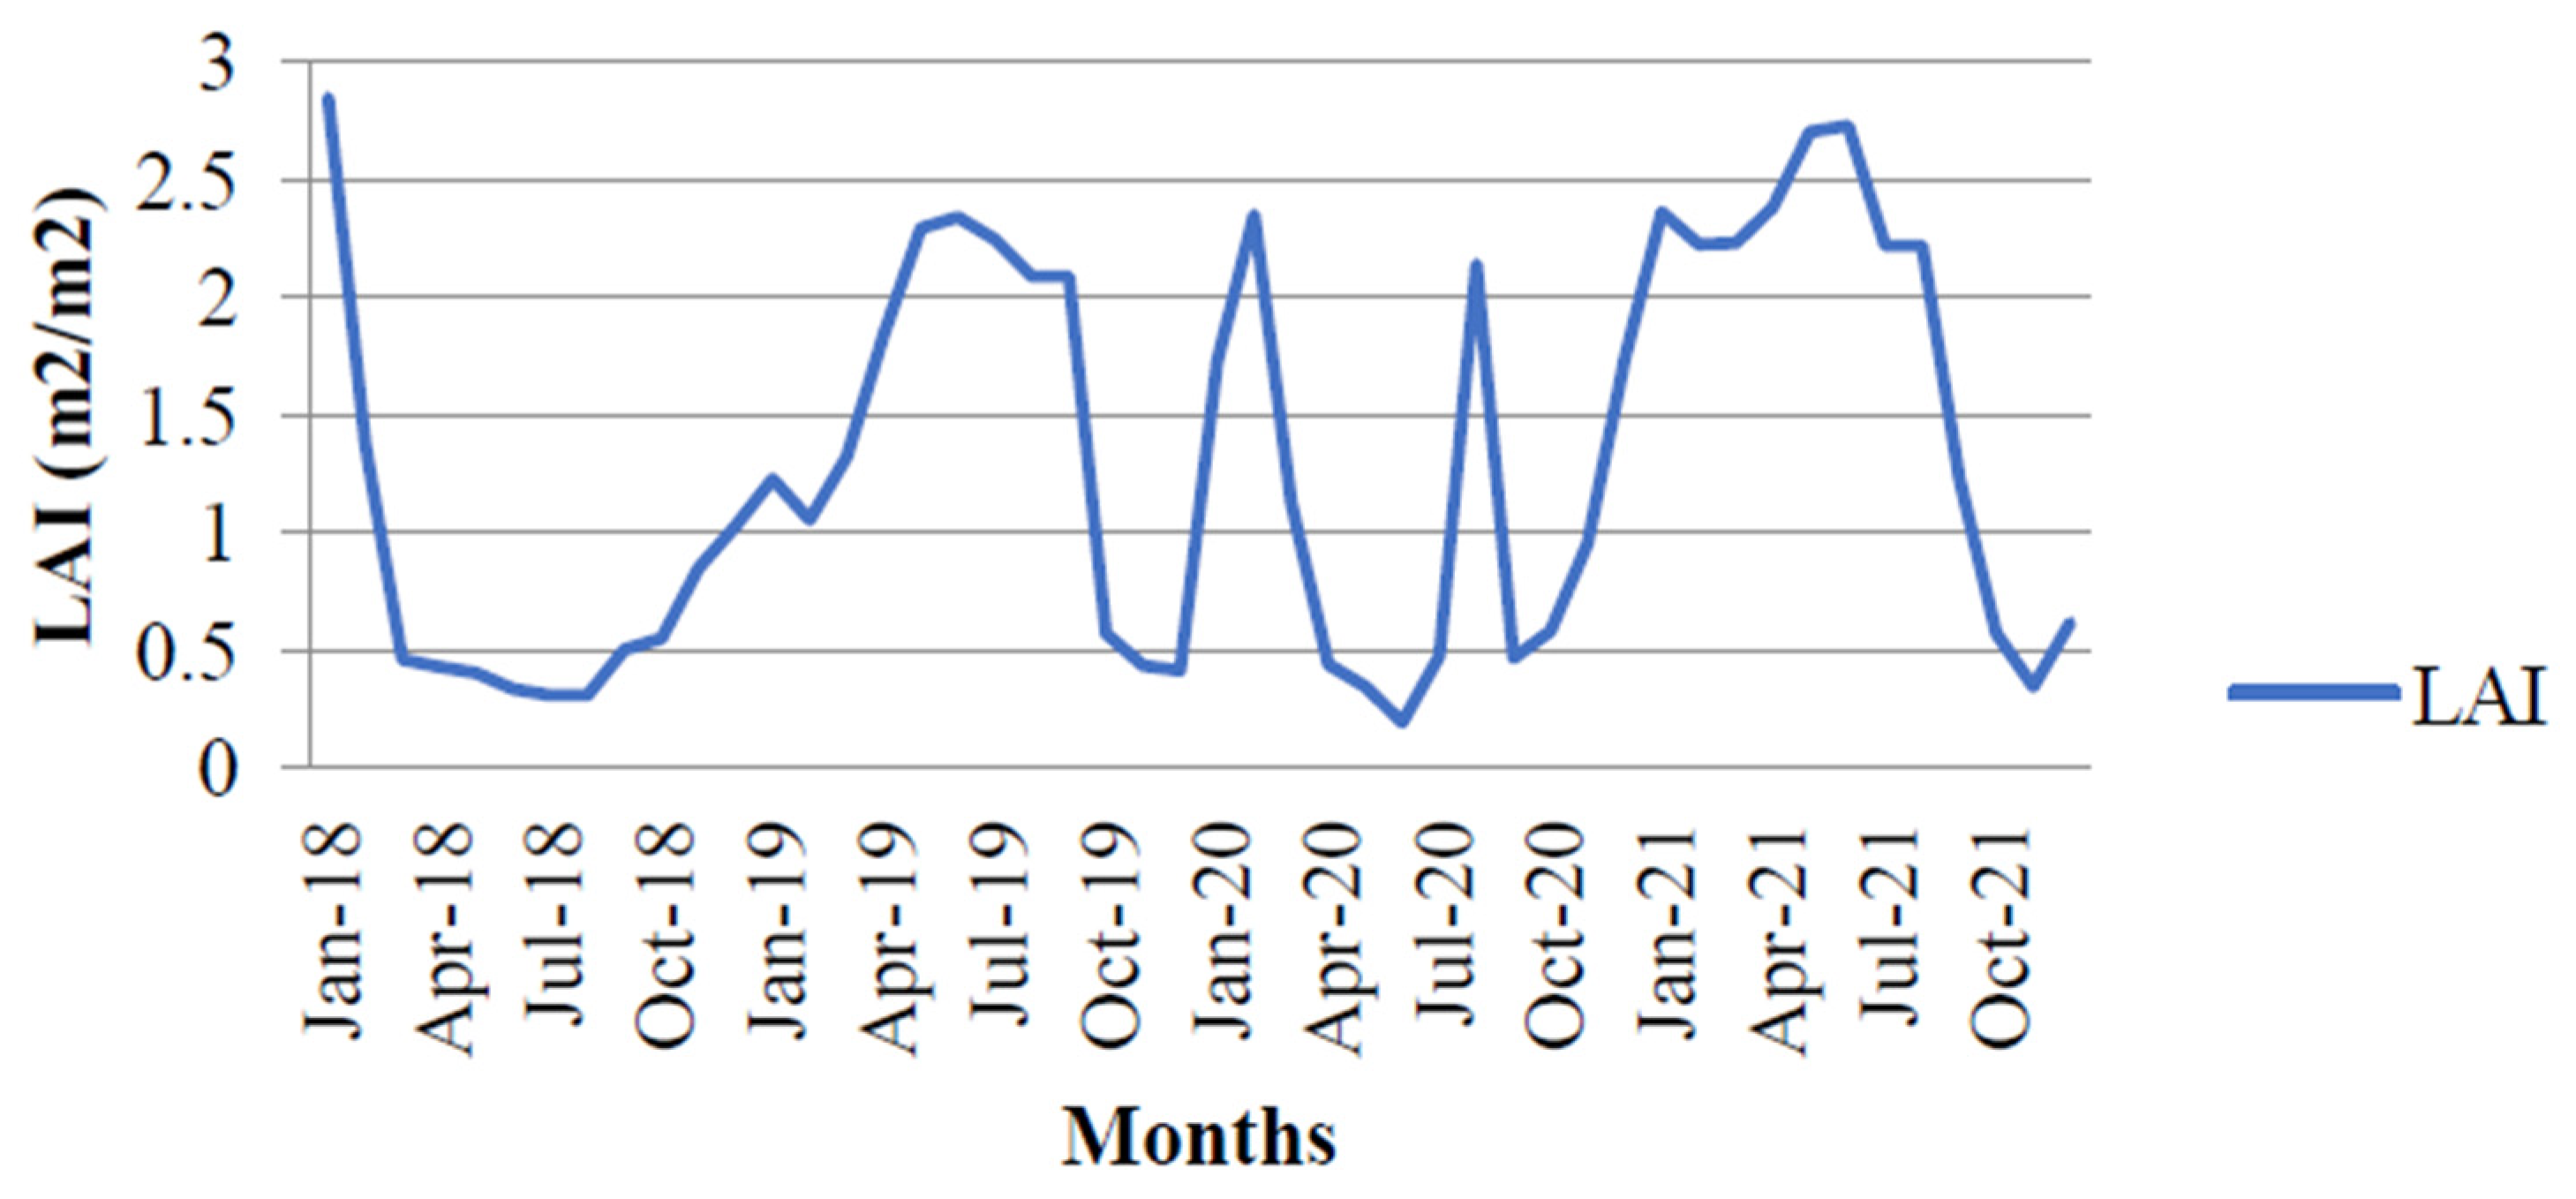
Figure 4). Correspondingly, LAI of the banana crop varied from 0.19 to 2.85, indicating the vigour of the crop (
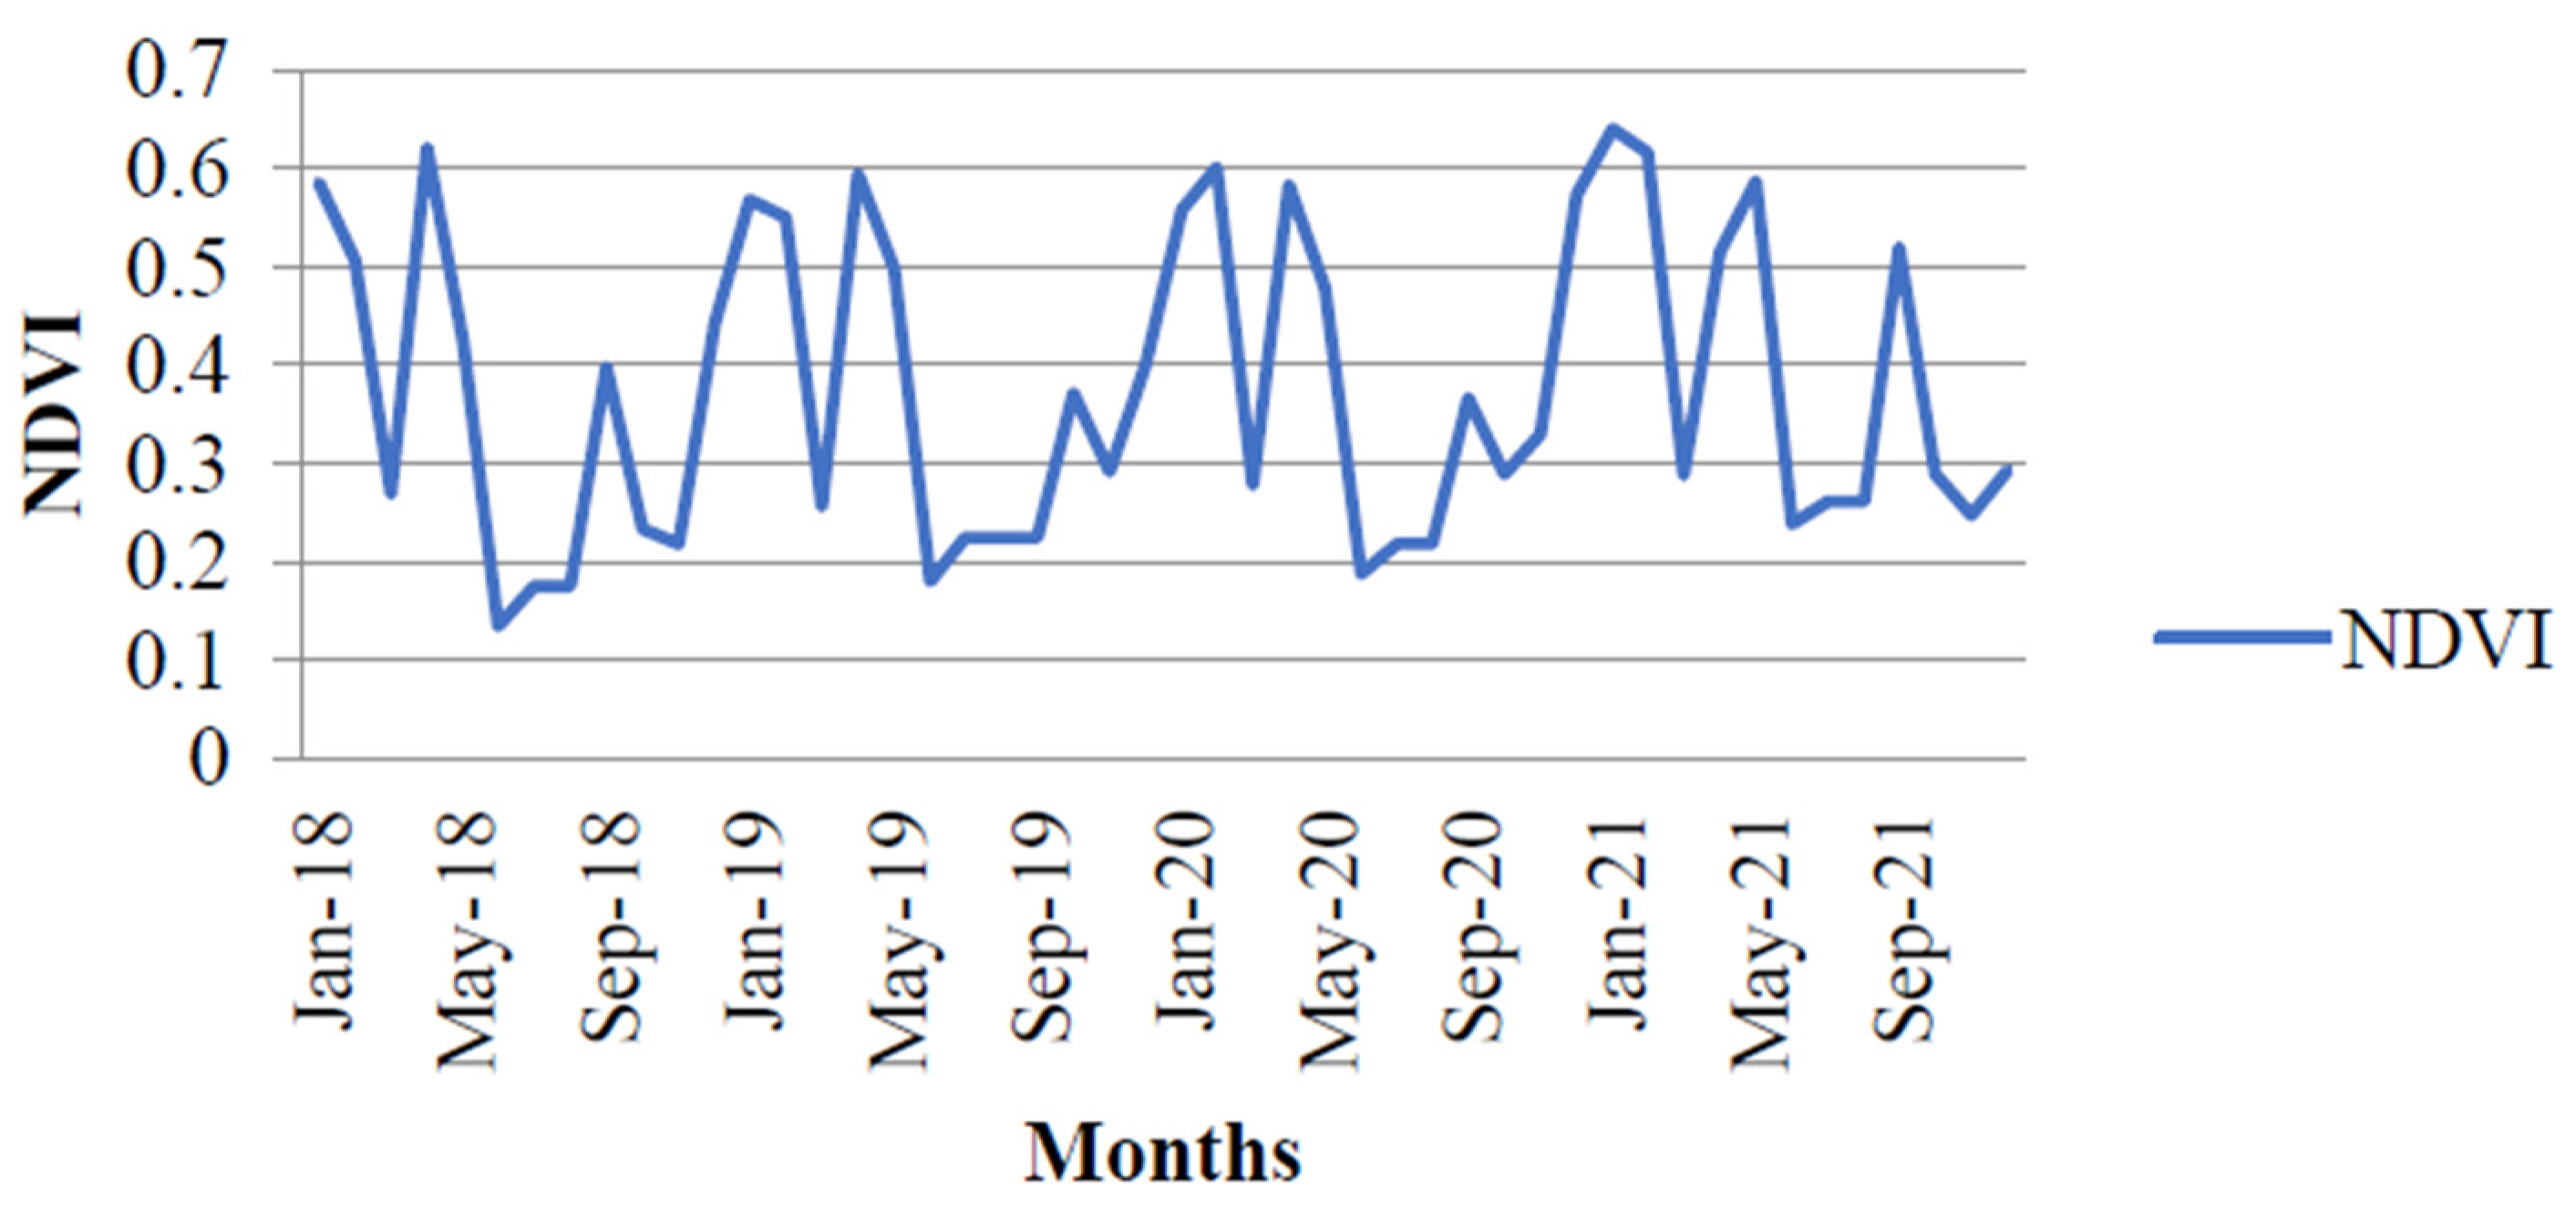
Figure 5). EVI and LAI were found to be high during the months from February to July, months of the year representing the plantation period of the banana crop. NDVI values were found to be vary from 0.14 to 0.58, wherein high values indicated the growing season of banana crop (
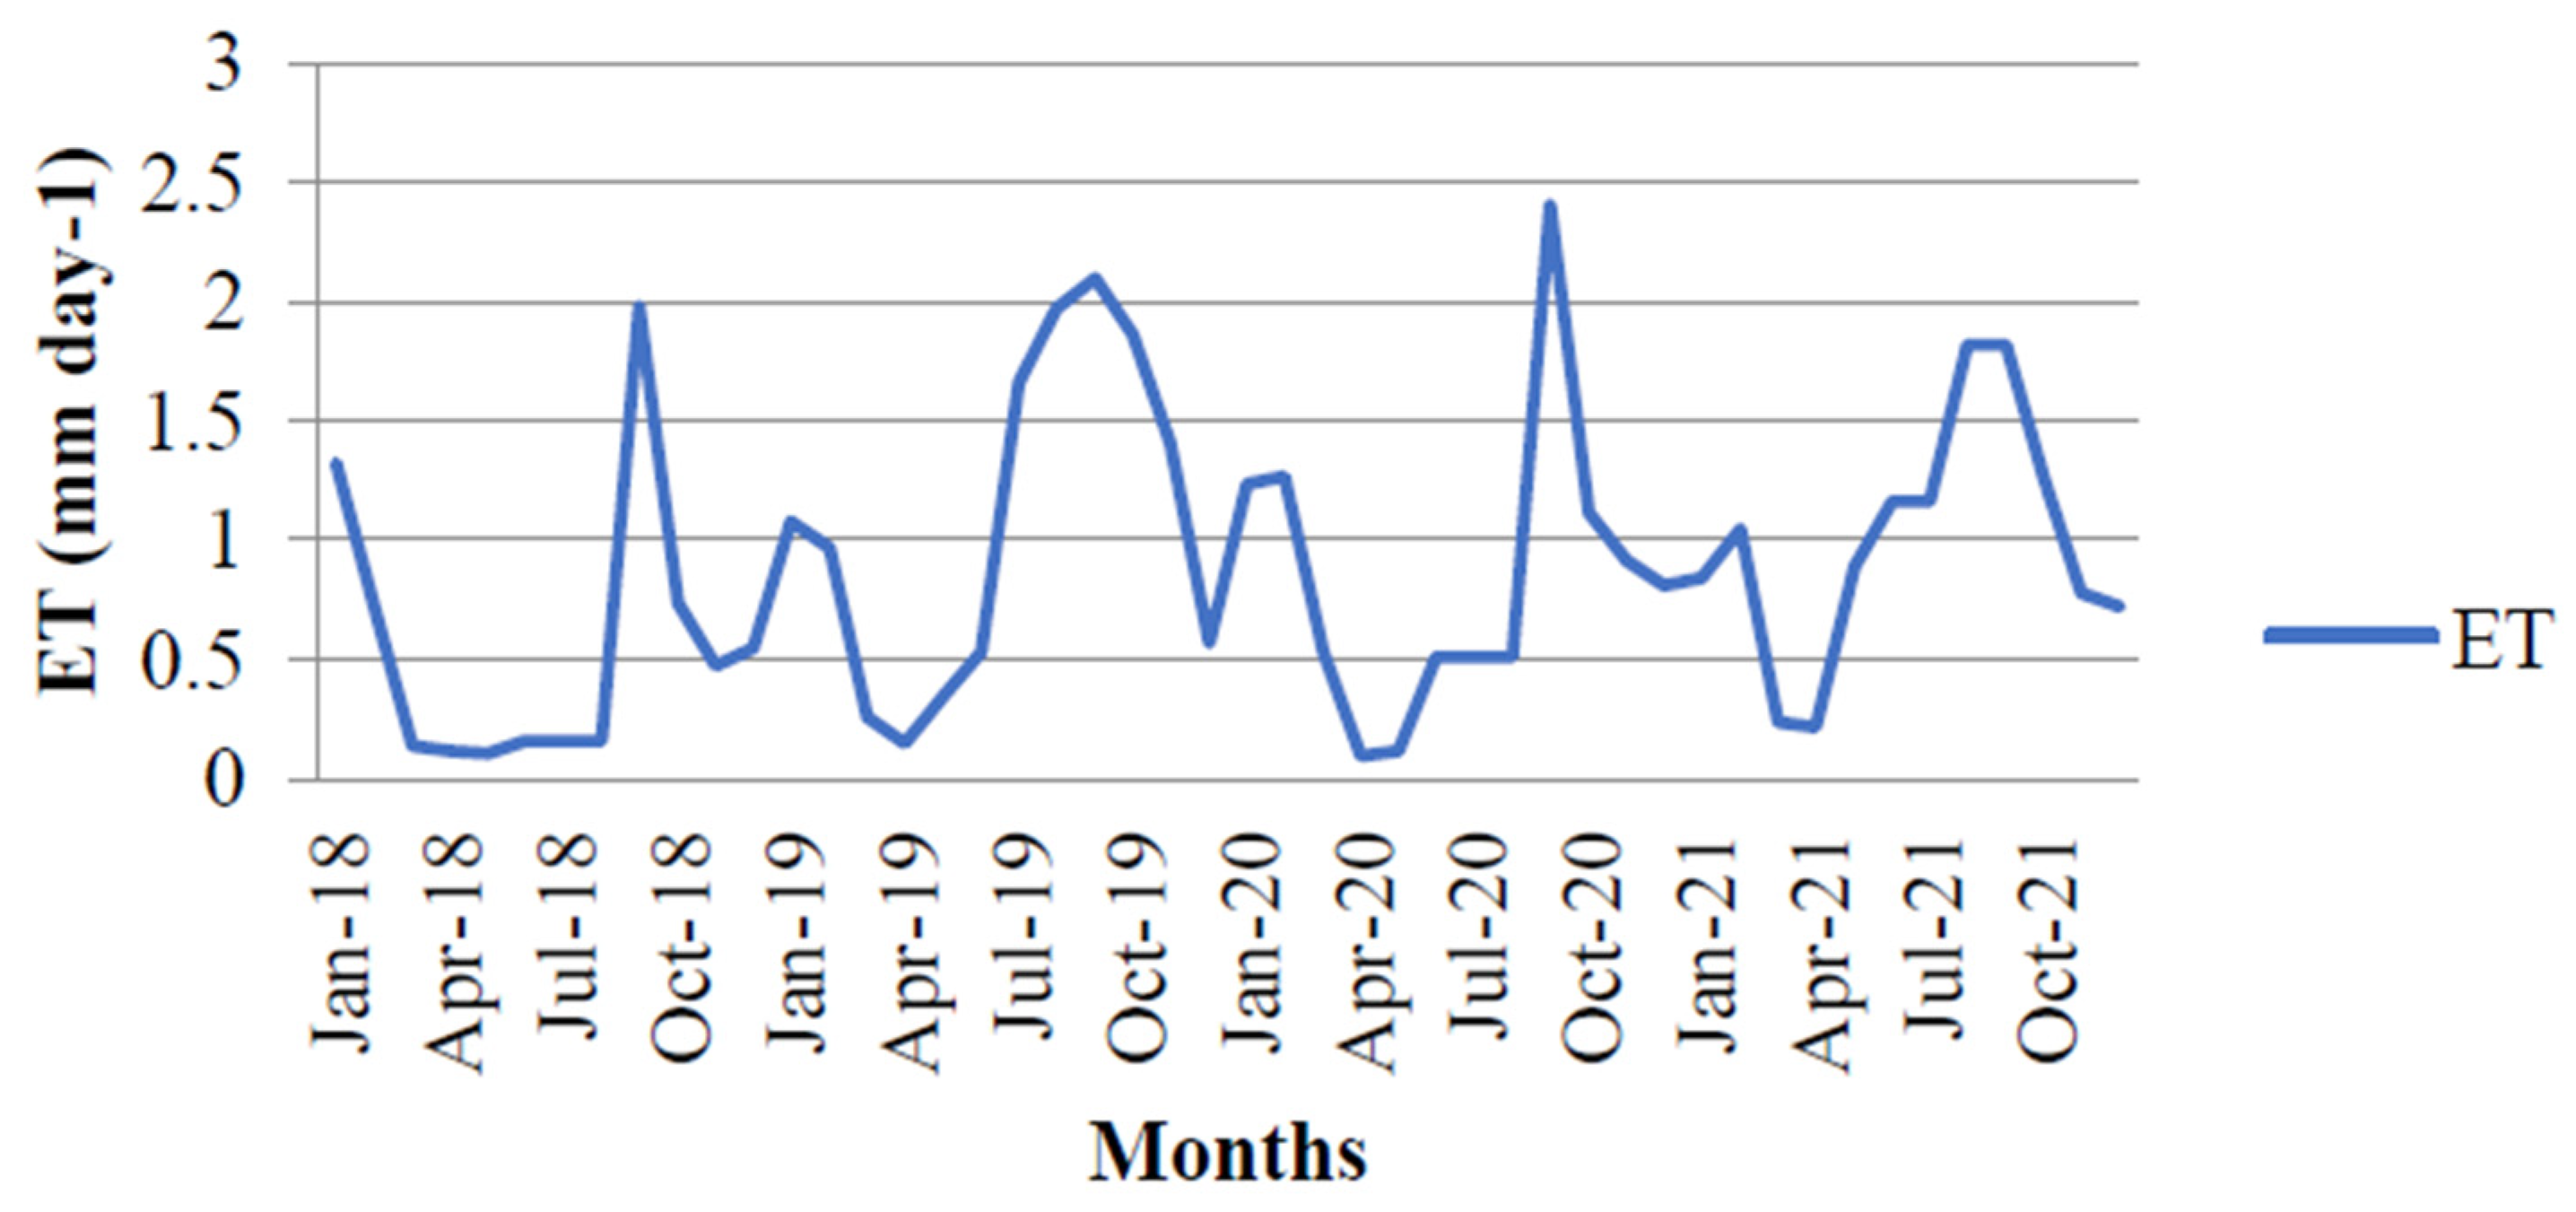
Figure 6). ET varied from 0.1 to 2.41 mm day
−1, revealing its seasonal variation (
Figure 7). It showed higher values during monsoon season, indicating its role in crop growth.
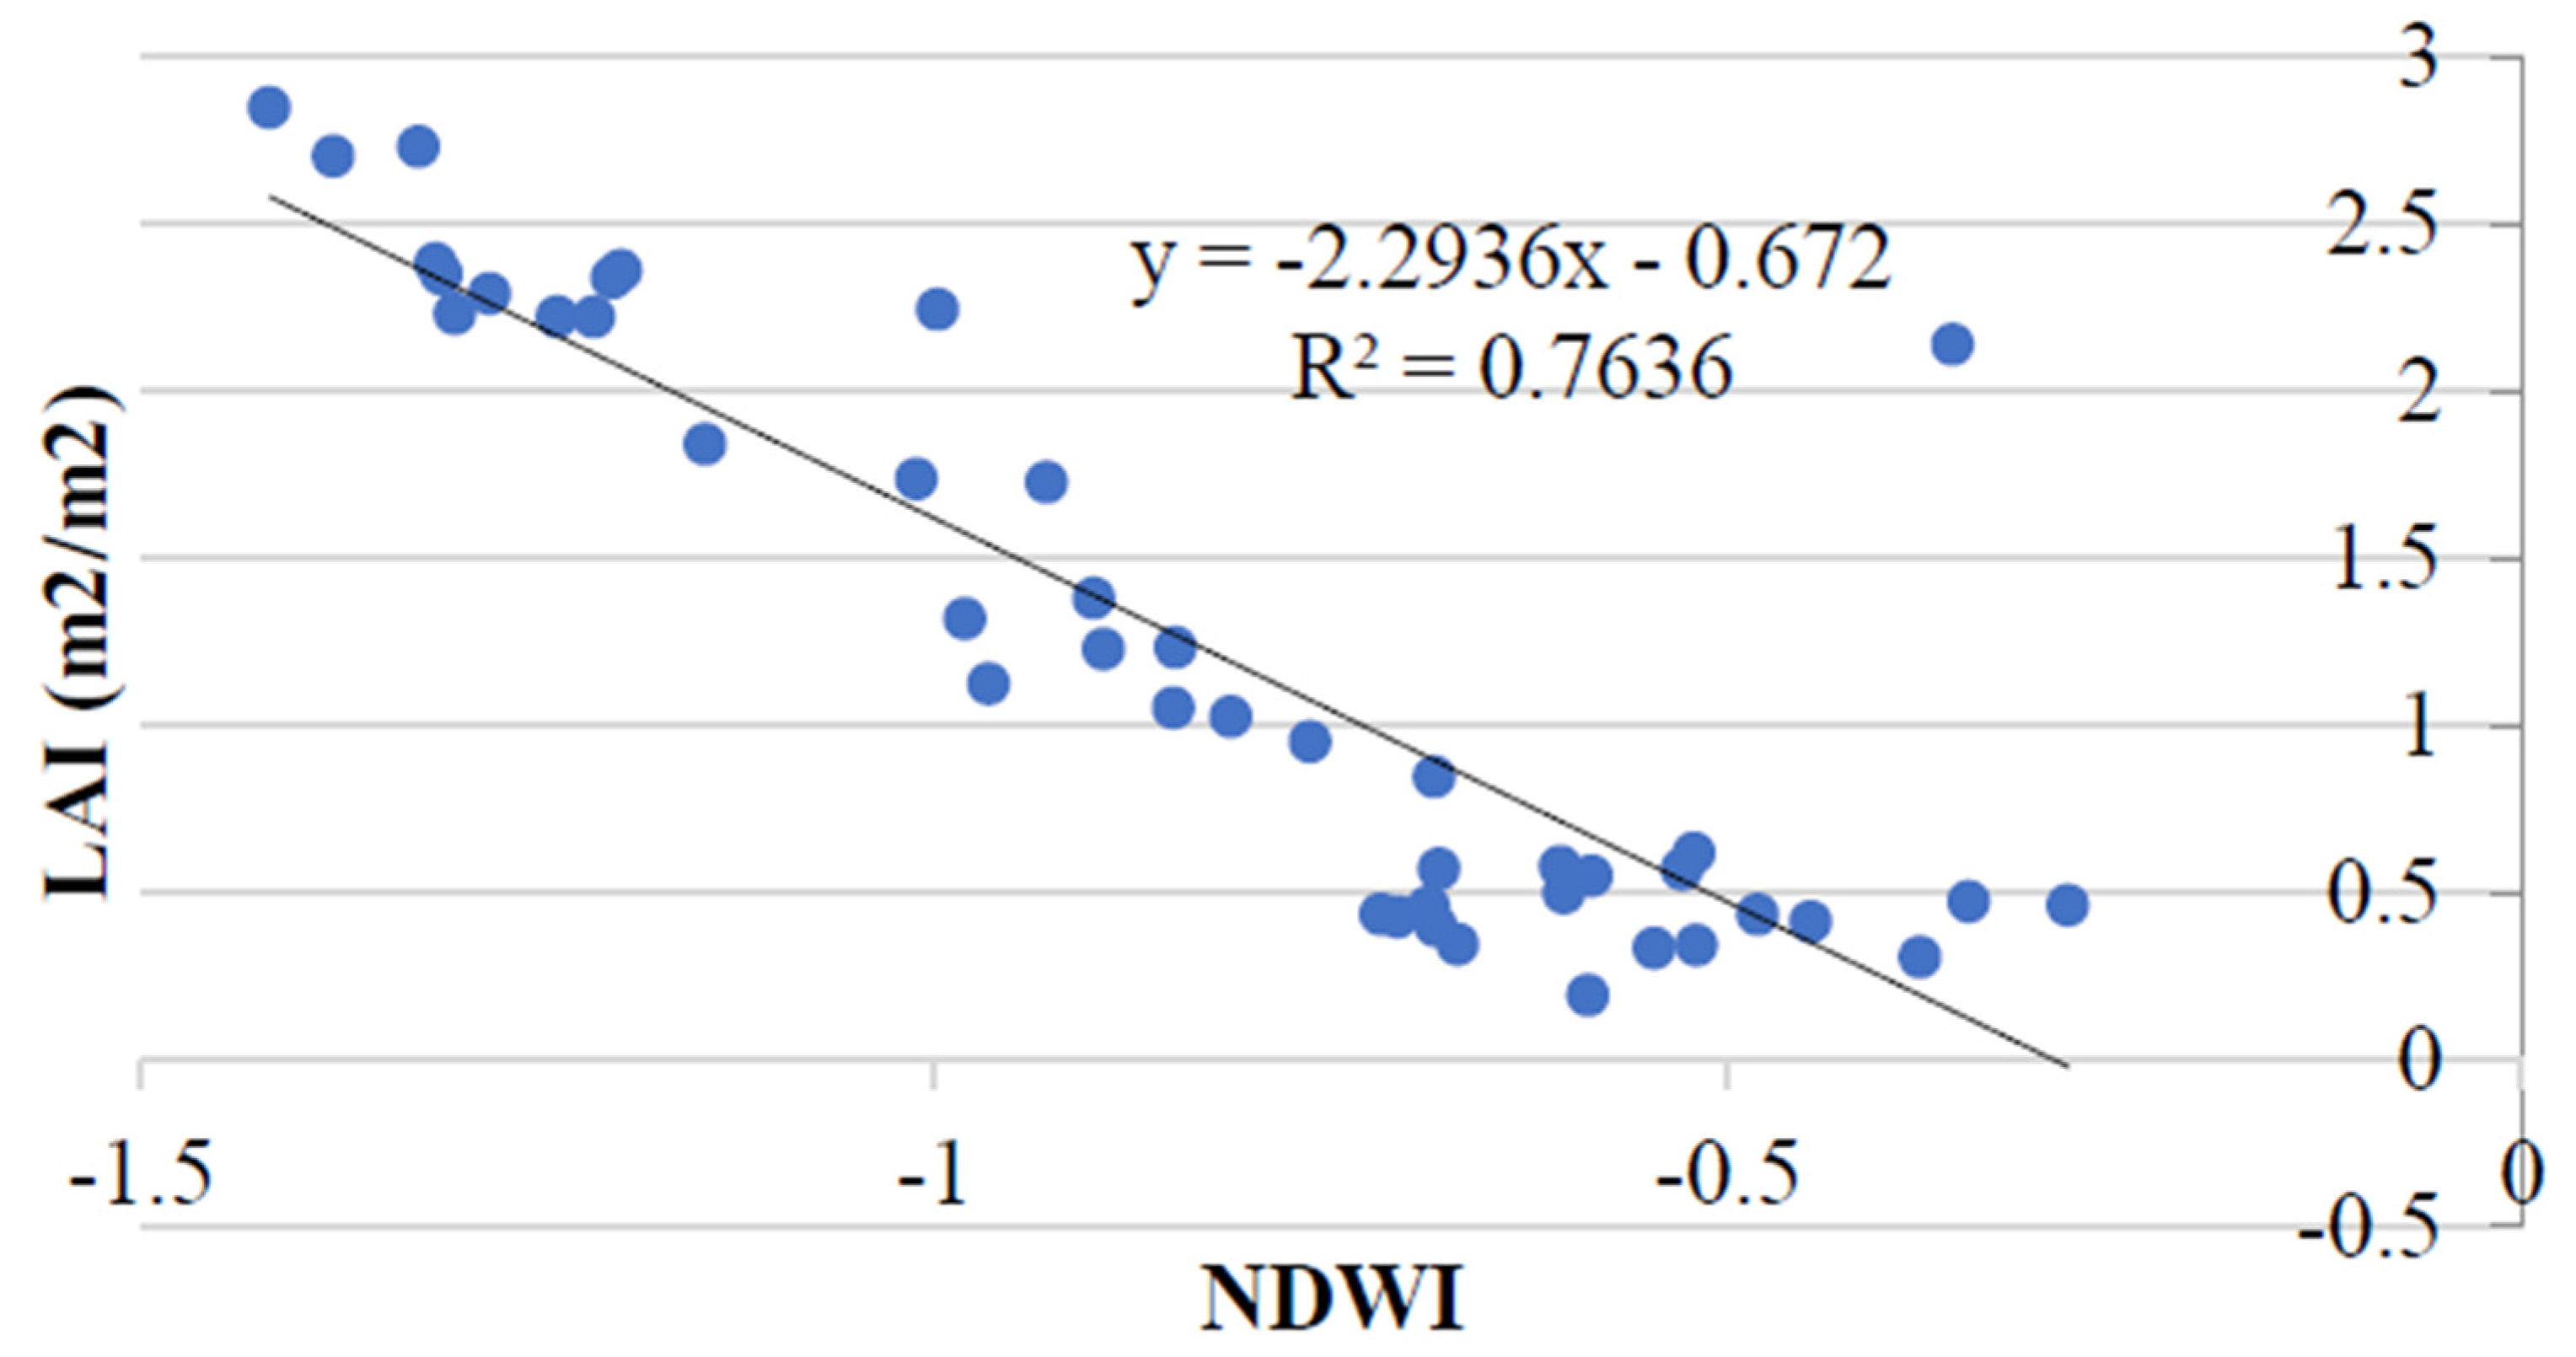
Values derived from these parameters were analysed statistically to understand the relationship between different parameters. The regression analysis between different parameters revealed an interesting result. It was clear from the analysis that since R2 was only 0.02, LAI was, therefore, not dependent on LST, indicating that the temperature variations were having less impact on crop growth. The ET and LAI were also poorly related with each other, with an R2 value as low as 0.01. However, the crop was dependent on NDVI, as revealed by an R2 value of 0.64 when regressed with LAI. EVI also played a major role in crop growth as it was the main parameter with LAI. Regression analysis between NDWI and LAI showed that these two variables were highly dependent on each other, with an R2 value as high as 0.76. This indicated that the growth of the banana crop was highly influenced by NDWI, and that the yield of the crop varied with varying values of NDWI. These results were also supported by the T-test.
Therefore, the regression model derived using these two parameters was found to be significant for forecasting the banana yield (
Figure 8).
5. Conclusions
The banana is one of the most important fruit crops of India and at a global level. Increased water stress due to unpredicted rainfall and competition for water resources is leading to a reduced yield of the crop. This study attempted to generate banana crop productivity based on the various parameters derived using a geospatial approach. Regression analysis revealed that the banana crop is highly dependent on NDWI, i.e., on the ground water condition of the agricultural field, as indicated by high R2 values. The regression model derived using these parameters can be utilized to predict banana yield.
Author Contributions
Conceptualization, U.P. and A.M.; methodology, U.P.; software, A.M.; validation, U.P, A.M. and A.G.; formal analysis, A.G.; resources, A.M., writing—original draft preparation, U.P.; writing—review and editing, U.P., A.M. and A.G. All authors have read and agreed to the published version of the manuscript.
Funding
This research received no external funding.
Institutional Review Board Statement
Not applicable.
Informed Consent Statement
Not applicable.
Data Availability Statement
Conflicts of Interest
The authors declare no conflict of interest.
References
- Dave, A.K.; Zala, Y.C.; Pundir, R.S. Comparative economics of Banana cultivation in Anand district of Gujarat. Econ. Aff. 2016, 61, 305–312. [Google Scholar] [CrossRef]
- Anonymous. 2022. Available online: https://www.statista.com/statistics/1038905/india-production-of-banana/#:~:text=During%20fiscal%20year%202022%2C%20the,during%20the%20measured%20time%20period (accessed on 9 January 2023).
- Olivares, B.O.; Vega, A.; Rueda Calderón, M.A.; Montenegro-Gracia, E.; Araya-Almán, M.; Marys, E. Prediction of Banana Production Using Epidemiological Parameters of Black Sigatoka: An Application with Random Forest. Sustainability 2022, 14, 14123. [Google Scholar] [CrossRef]
- Chaturvedi, D.K. Modeling and Simulation of Systems Using MATLAB and Simulink; CRC Press: Boca Raton, FL, USA, 2017. [Google Scholar]
- Medina-Ruíz, C.; Mercado-Luna, I.; Soto-Zarazúa, G.; Torres-Pacheco, I.; Rico-García, E. Mathematical modeling on tomato plants: A review. Afr. J. Agric. Res. 2011, 6, 6745–6749. [Google Scholar] [CrossRef]
- Yadav, S.S. District Groundwater Brochure Anand District Gujarat; Government of India Ministry of Water Resources, Central Ground Water Board West Central Region: Ahmedabad, India, 2013. [Google Scholar]
- Zhang, H.; Zhang, Y.; Li, X.; Li, M.; Tian, Z. Predicting Banana Yield at the Field Scale by Combining Sentinel-2 Time Series Data And Regression Models. Appl. Eng. Agric. 2023, 39, 81–94. [Google Scholar] [CrossRef]
| Disclaimer/Publisher’s Note: The statements, opinions and data contained in all publications are solely those of the individual author(s) and contributor(s) and not of MDPI and/or the editor(s). MDPI and/or the editor(s) disclaim responsibility for any injury to people or property resulting from any ideas, methods, instructions or products referred to in the content. |
© 2023 by the authors. Licensee MDPI, Basel, Switzerland. This article is an open access article distributed under the terms and conditions of the Creative Commons Attribution (CC BY) license (https://creativecommons.org/licenses/by/4.0/).


