Next Article in Journal
Pesticide Distribution in Pond Sediments from an Agricultural Catchment (Auradé, SW France)
Previous Article in Journal
Intrinsic Resilience in Levant Water-Based Infrastructures
 
 
Please note that, as of 4 December 2024, Environmental Sciences Proceedings has been renamed to Environmental and Earth Sciences Proceedings and is now published here.
Proceeding Paper

Nonlinear Autoregressive Exogenous (NARX) Neural Network Models for Storm Tide Forecasting in the Venice Lagoon †

Department of Civil and Mechanical Engineering (DICeM), University of Cassino and Southern Lazio, Via Di Biasio, 43, 03043 Cassino, FR, Italy
*
Author to whom correspondence should be addressed.
Presented at the International Conference EWaS5, Naples, Italy, 12–15 July 2022.
Environ. Sci. Proc. 2022, 21(1), 93; https://doi.org/10.3390/environsciproc2022021093
Published: 15 February 2023

Abstract

:
Venice and its lagoon represent an extraordinary architectural, artistic and cultural heritage. However, due to the combination of astronomical and meteorological causes, as well as by the conformation of the sea basin, the city and its lagoon are frequently affected by high tides that have caused significant damage over the centuries. Therefore, a proper prediction of the tide level, especially storm surges, is an essential task for the protection of Venice and its lagoon. The aim of this study is to provide a prediction of storm tide events based on nonlinear autoregressive exogenous (NARX) neural network models. Therefore, the developed model could act as a reliable tool for the MOSE system management, which will protect Venice from high waters.

1. Introduction

The Venice Lagoon is an enclosed bay of the Adriatic Sea, in northern Italy, in which the city of Venice is situated. The lagoon is known for its high-tide events, called “acqua alta” (high waters) in Italian, that have afflicted it throughout its history [1] and are becoming more and more frequent due to climate change.
These events occur when the astronomical tide effects, that depend on celestial bodies’ attraction, are enhanced by meteorological disturbances. In the particular case of the Venice Lagoon, the most relevant meteorological factors are wind, Scirocco from the southeast and Bora from the north-northeast, and barometric pressure.
The highest tide level observed in Venice is equal to 194 cm and dates back to 4 November 1966 [2]. However, more recently, in November 2019, a level equal to 187 cm was reached. Moreover, this level is continuously decreasing due to additional factors such as groundwater pumping and eustatism [3].
The MOSE system (MOdulo Sperimentale Elettromeccanico in Italian—electromechanical experimental module) is being completed to protect Venice from high waters. It consists of a system of submerged barriers that, when the water level reaches 110 cm, rises, blocking the water that flows from the Adriatic Sea [4]. Therefore, a proper prediction of the tide level for the Venice Lagoon represents a topic of significant interest, from both practical and scientific points of view.
Currently, different statistical and hydrodynamic models are applied for tide level forecasting. However, these models are very complex and require a large number of exogenous inputs.
Artificial Intelligence (AI) algorithms have become increasingly popular in recent years to investigate complex hydrological parameters [5,6,7,8,9,10]. In particular, Machine Learning (ML) algorithms do not require a complex relationship between inputs and target parameters. In addition, for recurrent neural networks (RNNs), which are a particular type of artificial neural networks (ANNs), both predictors and model parameters are updated recursively providing good predictions even when only short time series are available [11,12,13].
In this study, the nonlinear autoregressive exogenous (NARX) neural networks were applied to develop models for storm tide predictions. This particular neural network has been successfully used in hydrology and combines the classic artificial neural networks (ANNs) with ARX models in order to detect the non-linearity along time series [14,15,16,17].
The developed model could act as a reliable tool for the MOSE system’s management. In particular, MOSE barriers need at least 48 h in advance for their activation; therefore, reliable tide predictions—with a predictive horizon up to 48 h—is fundamental to protect Venice.

2. Materials and Methods

2.1. Study Area and Dataset

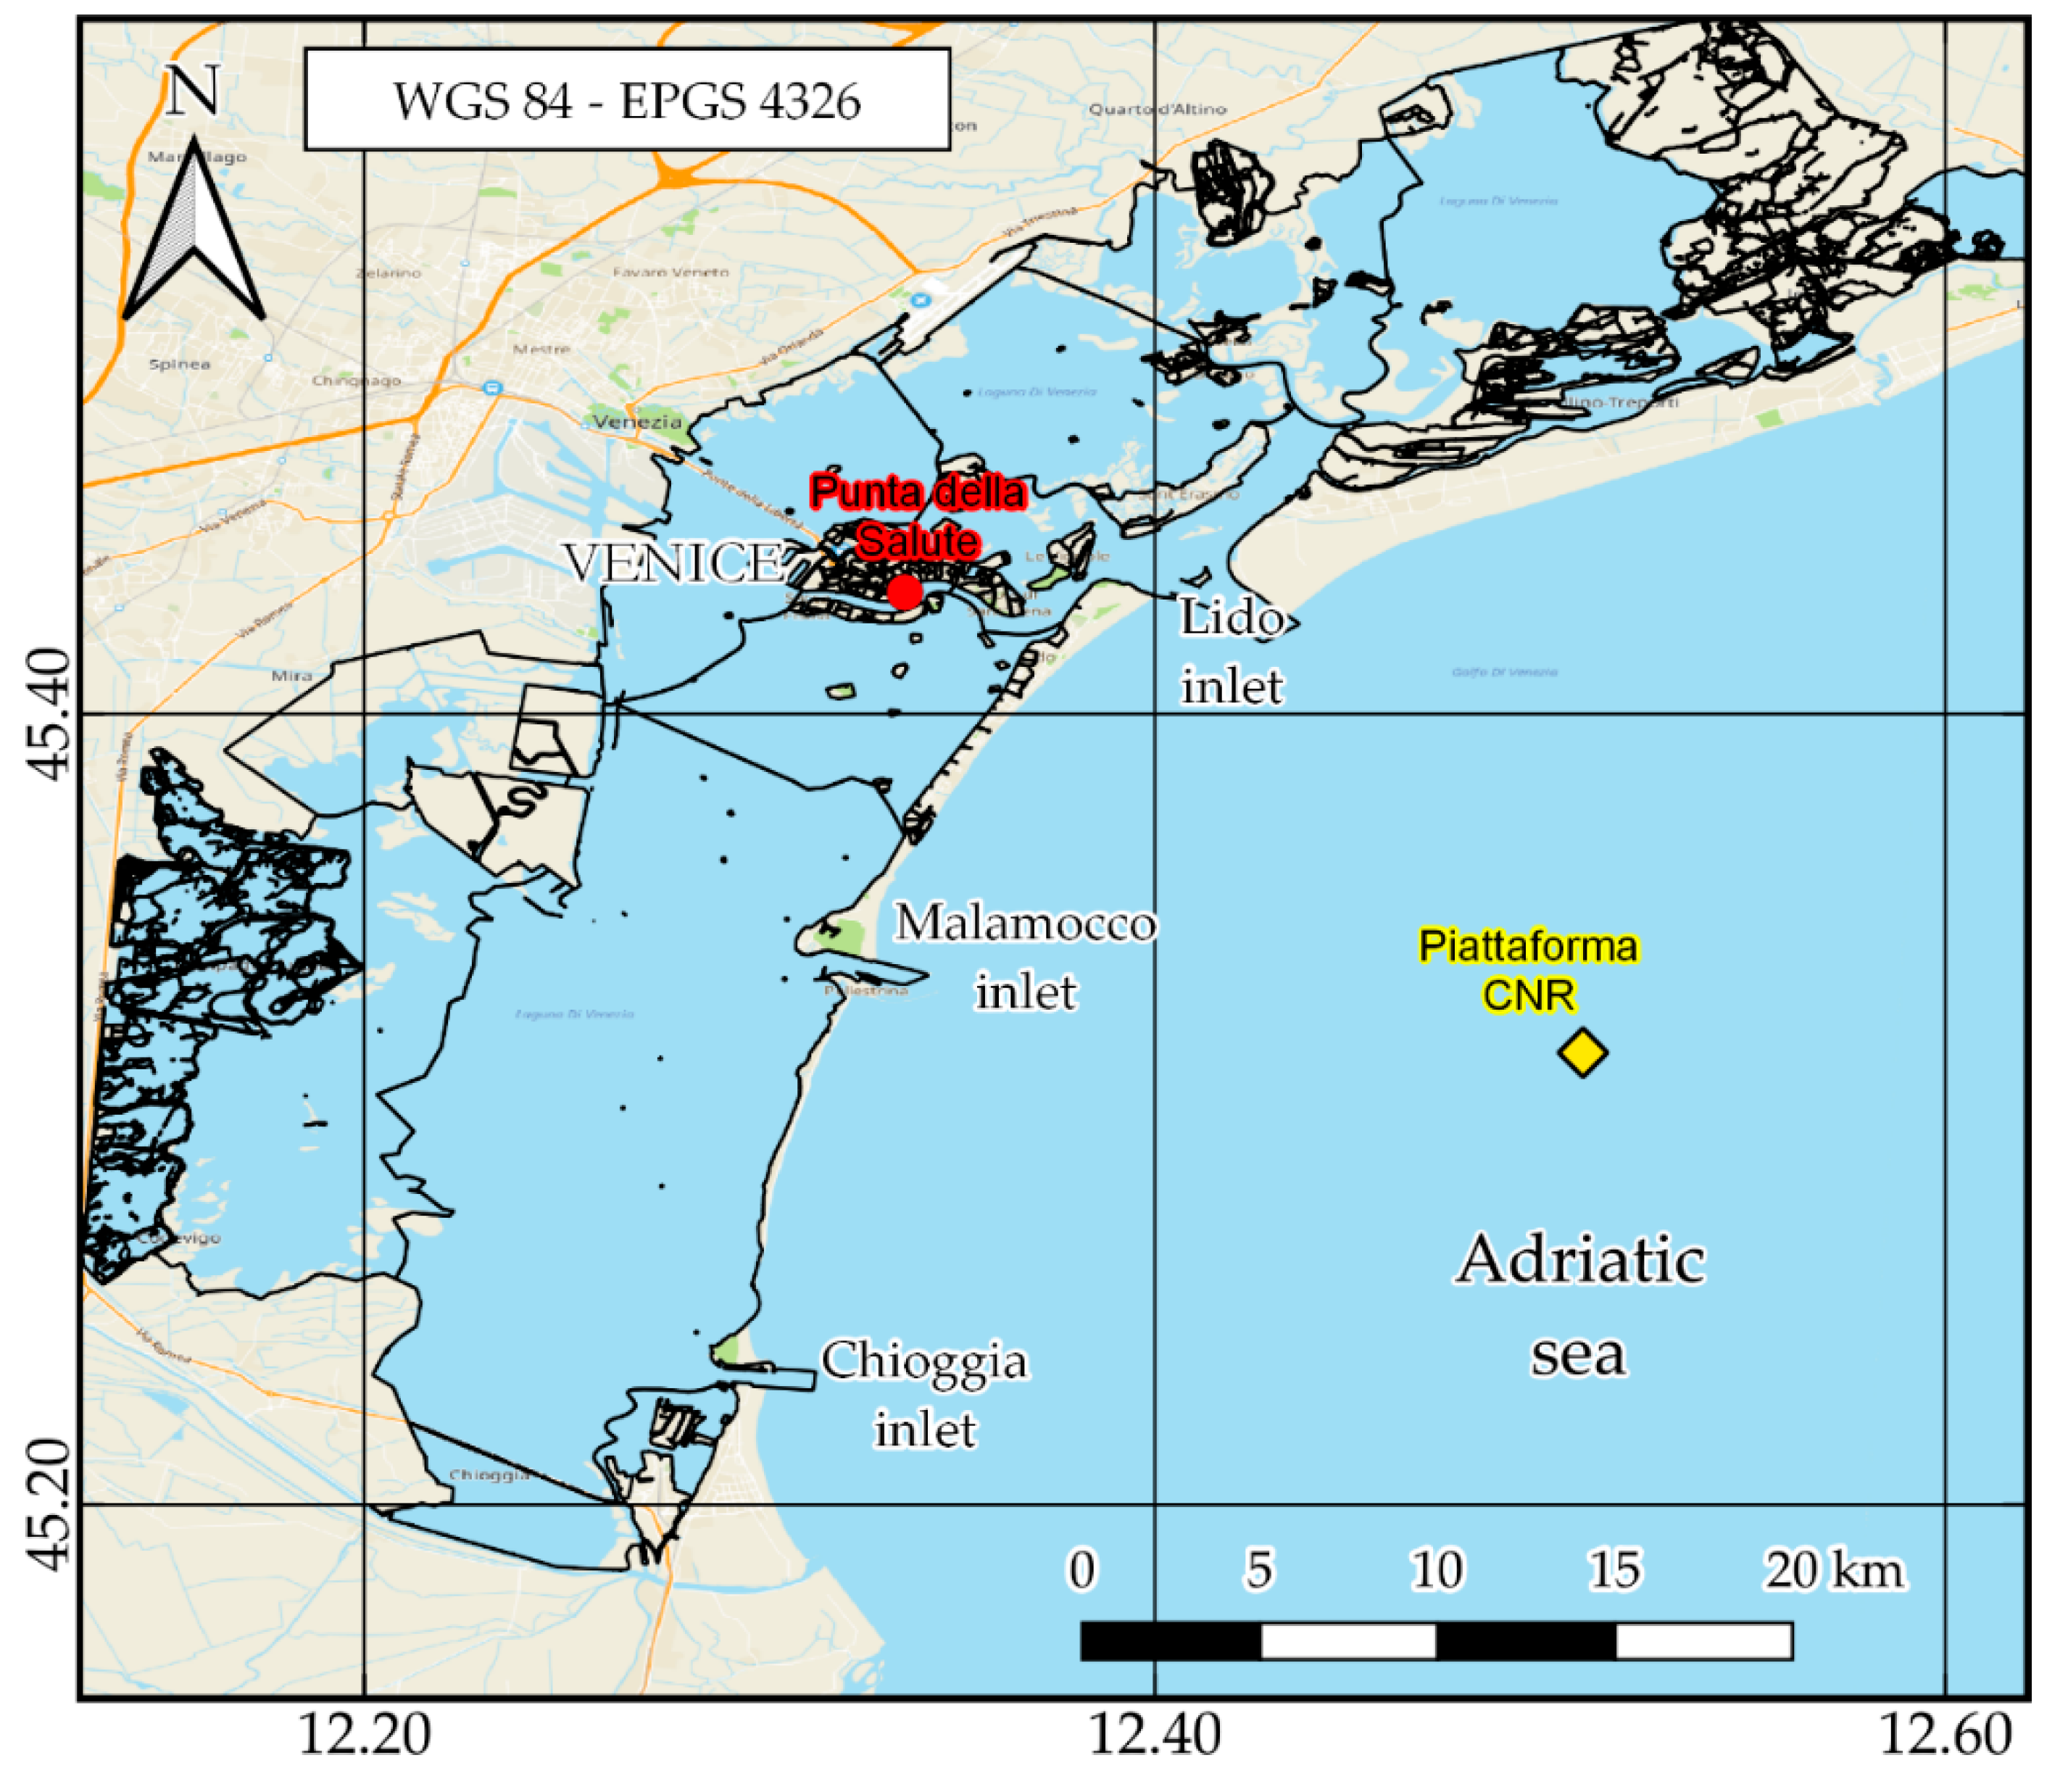
The Venice Lagoon covers a surface of 550 km2 from the Sile river to the Brenta river, from north to south, making it the largest Mediterranean wetland. Only 8% of its surface is represented by land, including Venice and several small islands. Mudflats, tidal shallows and salt marshes cover 80%. The remaining 11% is permanently covered by water. Three inlets connect the lagoon to the Adriatic Sea: Lido, Malamocco and Chioggia.
Under ordinary conditions, the sea level in the lagoon is very different from that induced by the astronomical tide due to small meteorological effects. However, under particularly adverse weather conditions, with significant drops in pressure and a strong southeast wind (Scirocco), the meteorological effects become significant. In particular, when in phase with an astronomical high tide, they can lead to high waters, which, for the Venice Lagoon, are conventionally defined as a tide level above 80 cm with reference to the tide gauge at Punta della Salute. Exceeding this value, the lower part of the city begins to be flooded. In addition, storm surges can be accentuated by the simultaneous presence of strong low and high pressure in the upper and lower Adriatic, respectively. An additional element that can increase storm surges is a strong northeast wind (Bora) together with the Sirocco, which leads to the convergence of wind-induced sea currents. The conjunction of these factors can lead to extreme values of storm tide levels, which have been frequently observed in recent decades.
The dataset consisted of measurements every 30 min recorded from the Punta della Salute tide gauge station, located at the center of the lagoon. Wind direction, wind speed and barometric pressure were taken from a meteorological station called the Piattaforma CNR, located 13 km from the Malamocco inlet in the Adriatic Sea. The gravitational effect was included by taking into account the astronomical height of the tide hastr, calculated by harmonic analysis:
h a s t r = A 0 + n = 1 N A n cos ( σ n t k n )
with A0 = average sea level, An = amplitude, σn = angular frequency, t = time, kn = phase delay of component n and N = number of harmonics used to evaluate the astronomical tide height. These quantities were available on the website of the Venice Municipality [18]. In Figure 1, the tide gauge and weather station locations in the Venice Lagoon are represented.

2.2. NARX Model Architectures

The defining equation for the NARX model is:
y ( t ) = f ( y ( t 1 ) , y ( t 2 ) , , y ( t n y ) , u ( t 1 ) , u ( t 2 ) , , u ( t n u ) )
with u(t) = input at time t, y(t) = target at time t, nu = lagged input values, ny = lagged targe values and f = non-linear function. The architectures of a NARX network (Figure 2) consist of three different layers: input, which includes the input parameters of the network, hidden, which is the computational step between input and output, and output, which leads to the forecasted value y(t). A sketch of the NARX model architecture is shown in Figure 2. A preliminary analysis led to the best number of hidden nodes, equal to 3 (h1, h2 and h3 in Figure 2). Moreover, sigmoid (f1) and linear (f2) activation functions were used for the hidden layer and output layer, respectively. Bayesian Regularization was used as a training algorithm to optimize the weight w and bias b of the NARX mode in the output layer. The NARX process stopped when one of the following parameters was reached: a number of epochs equal to 1000; a Levenberg–Marquardt adjustment parameter equal to 1 × 10⁻¹⁰ or an error gradient below 1 × 10⁻⁷. For the modeling, the normalized values (between 0 and 1) of astronomical tide (hastr), wind speed (vwind) and direction (αwind) and barometric pressure (Patm) were considered. In order to evaluate the impact of the forecast horizon ta on the prediction accuracy, different values of ta were tested.
Table 1 reports the evaluation metrics used to evaluate the accuracy of the storm tide predictions. The metrics were computed considering only htide ≥ 110 cm.

3. Results and Discussion

For the training of the NARX models, data between January 2009 and June 2019 were considered. Then, the trained models were tested on 52 storm tide events, with htide greater than 110 cm that occurred in the period 2009–2020. Moreover, a preliminary analysis based on the autocorrelation function applied on the tide level [15] led to the selection of four different forecasting horizons, equal to 12 h, 24 h, 48 h and 72 h.
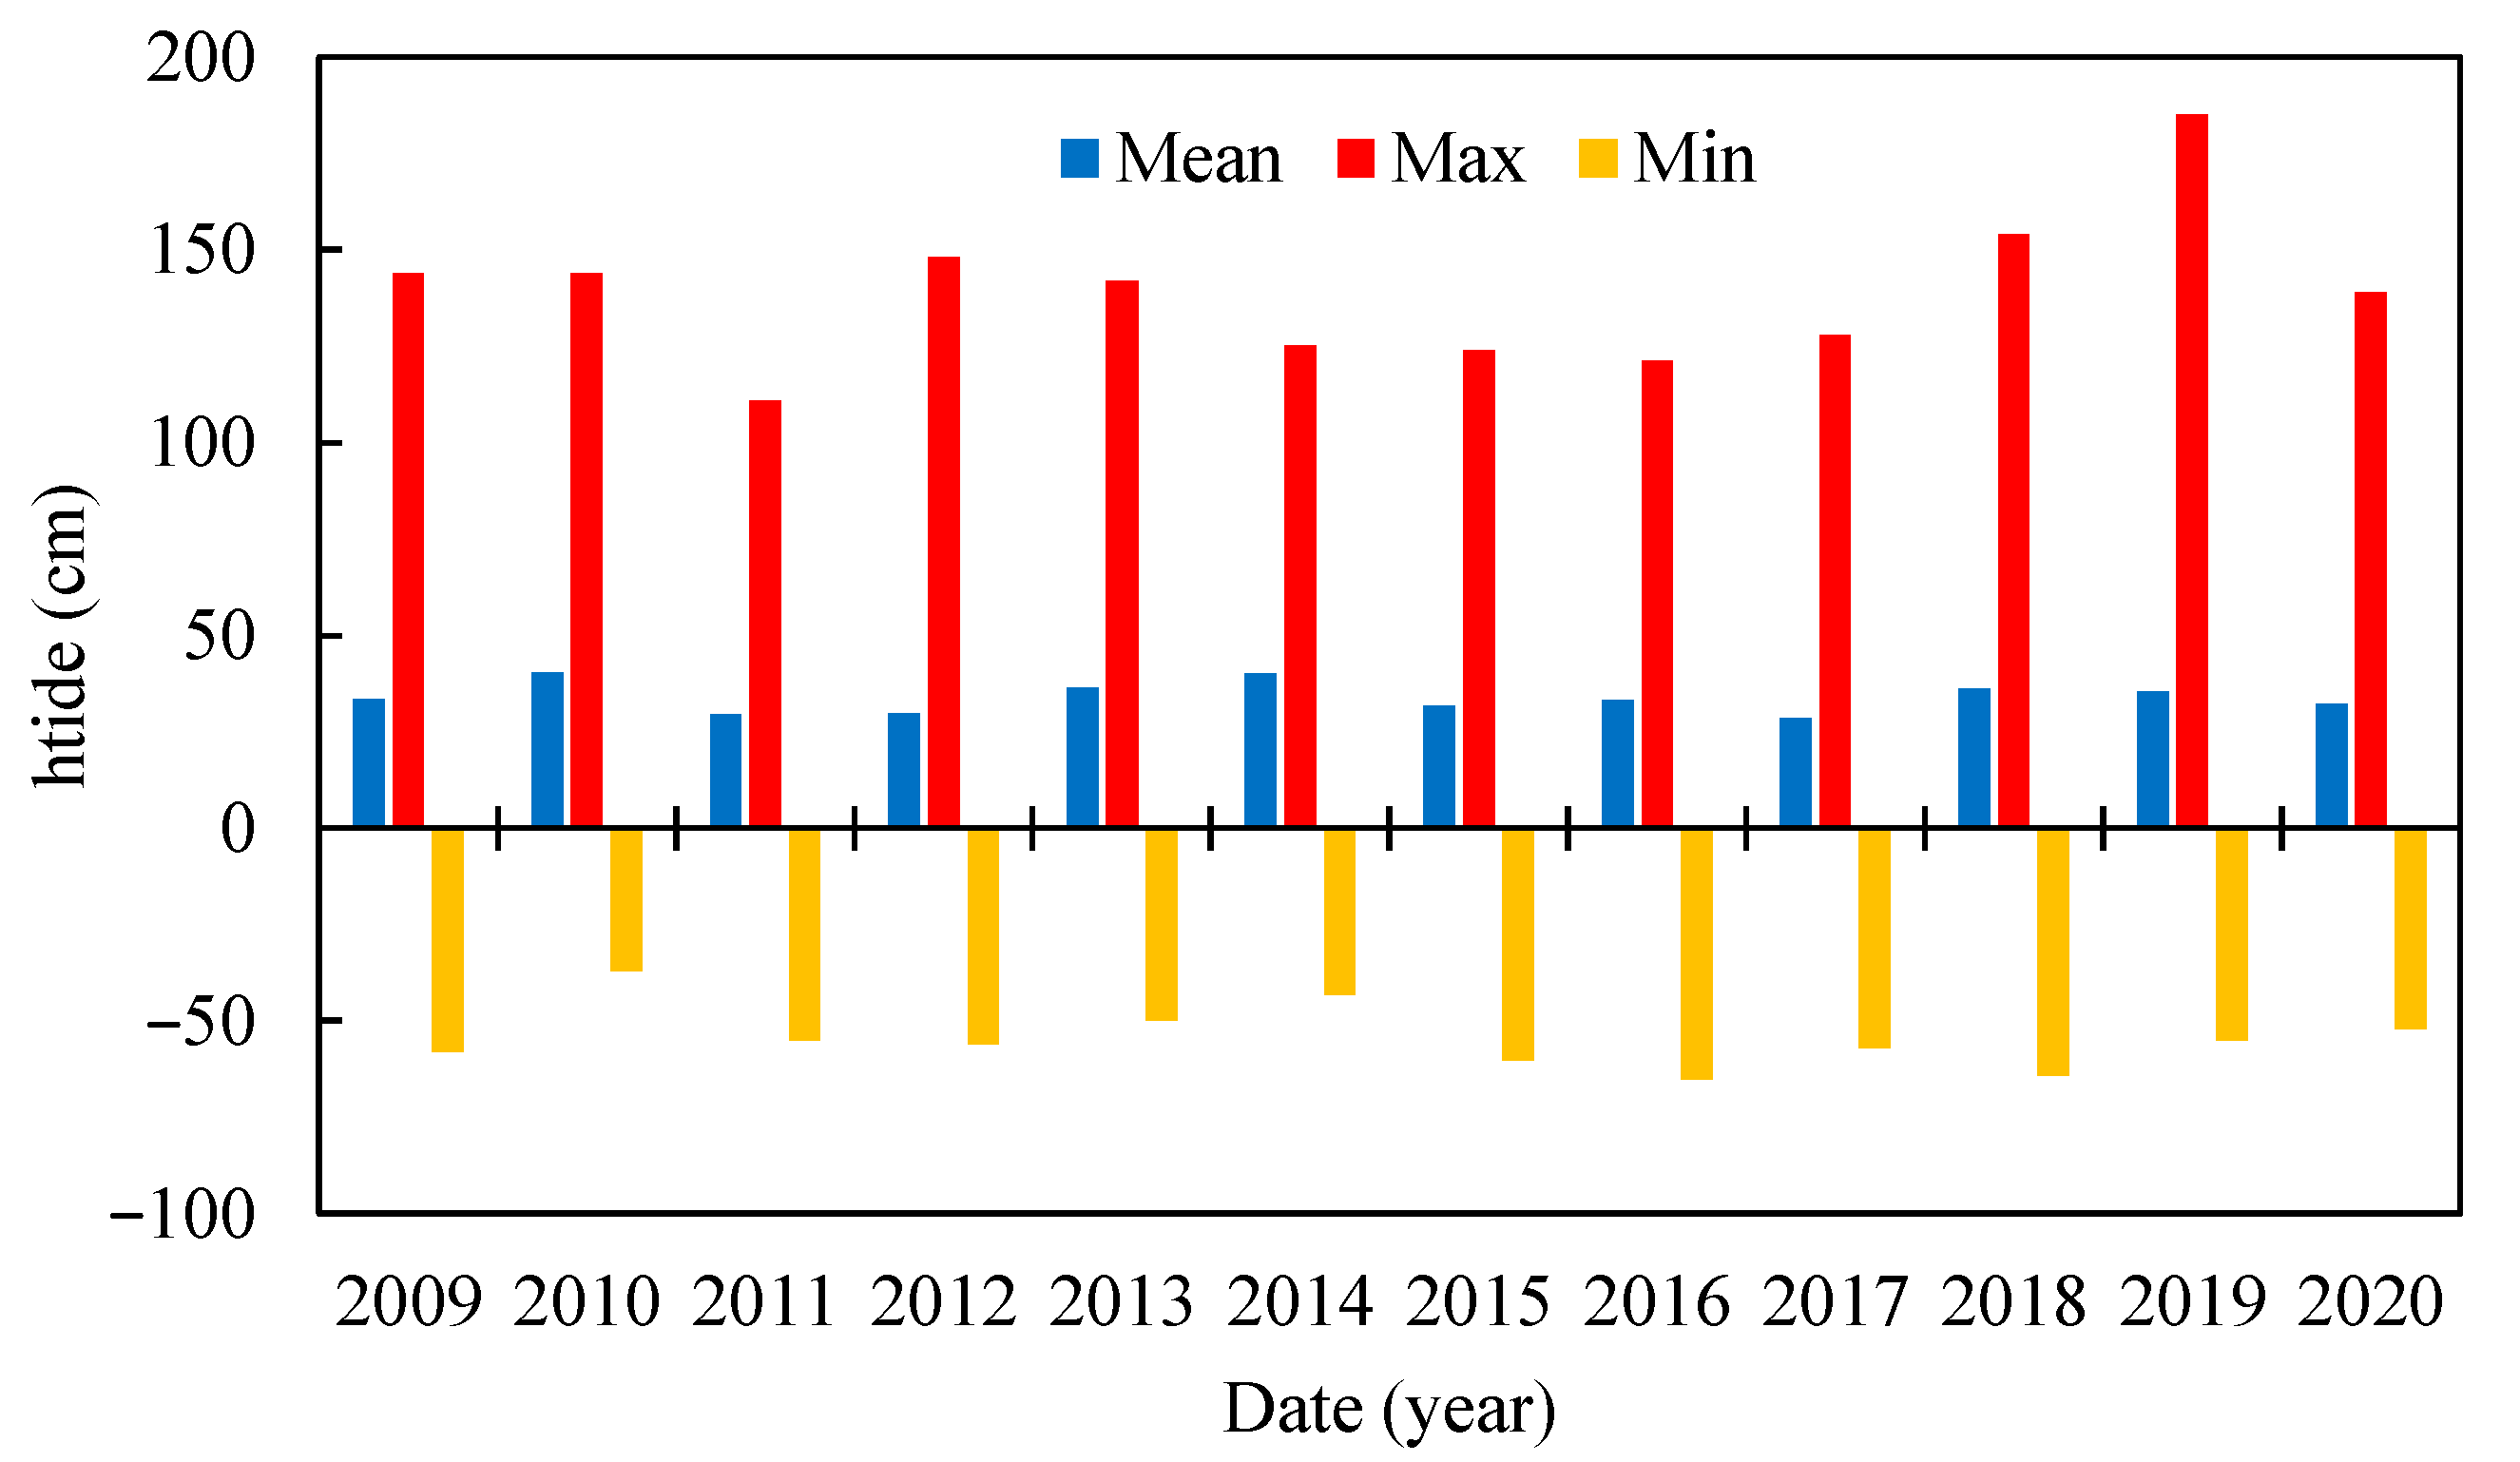
Below, Table 2 reports the statistics for the period 2009–2020 related to htide measured in Punta della Salute, with σ = standard deviation, CV = σ/Mean = coefficient of variation and Skew = 3 × (Mean – Median)/σ = skewness. In addition, Figure 3 shows the maximum, mean and minimum tide levels for the investigated period. In particular, the highest peak was observed in 2019, equal to 187 cm. The values of CV were lower than 1 for the whole period, with, however, a significant variation between a minimum of 0.67 in 2014 and a maximum of 0.97 in 2012.
The NARX model showed a very good fit for all forecast horizons (Table 3). Figure 4 provides the comparison between measured and predicted storm tide events for the four-forecast horizon.
A slight performance decrease was observed as the forecast horizon increased, with the best predictions obtained for the lower forecast horizon (ta = 12 h, R2 = 0.950, MAE = 1.96 cm and RAE = 23.03%). However, the forecasts were satisfactory also for the higher forecast horizon (ta = 72 h, R2 = 0.899, MAE = 2.91 cm and RAE = 34.25%). As can be observed in Figure 4, there was only a slight underestimation of the extreme events.
Moreover, the violin plots of the residuals, computed as the difference between the predicted and measured values, are reported in Figure 5. The violins provide information on the median (white dot), interquartile range (grey bars in the center of each violin) and the lower/upper adjacent values (the black stretched lines from the bar). As the forecast horizon increases, higher residuals were observed, with a negative median peak for ta = 72 h.

4. Conclusions

The ability of NARX to develop storm tide forecast models for the Venice Lagoon was assessed in the present study. The models include, for the prediction, different exogenous inputs: astronomical tide, wind speed and direction and barometric pressure. The NARX models proved to be reliable in providing predictions of storm tide events. In particular, good predictions were also obtained for a forecasting horizon of up to 72 h. This could enable a safe activation of the MOSE barrier system.

Author Contributions

Conceptualization, F.G. and F.D.N.; methodology, F.D.N. and F.G.; software, F.D.N. and F.G.; validation, F.G. and F.D.N.; formal analysis, F.G. and F.D.N.; investigation, F.D.N., F.G., R.G. and G.D.M.; resources, F.G. and F.D.N.; data curation, F.D.N. and F.G.; writing—original draft preparation, F.D.N.; writing—review and editing, F.D.N., F.G., R.G. and G.D.M.; supervision, F.G.; project administration, G.D.M. All authors have read and agreed to the published version of the manuscript.

Funding

This research received no external funding.

Institutional Review Board Statement

Not applicable.

Informed Consent Statement

Not applicable.

Data Availability Statement

The data are freely available online on the website https://www.venezia.isprambiente.it/index.php?folder_id=20&lang_id=2 (accessed on 27 October 2022).

Conflicts of Interest

The authors declare no conflict of interest.

References

  1. Umgiesser, G. The impact of operating the mobile barriers in Venice (MOSE) under climate change. J. Nat. Conserv. 2020, 54, 125783. [Google Scholar] [CrossRef]
  2. Trincardi, F.; Barbanti, A.; Bastianini, M.; Benetazzo, A.; Cavaleri, L.; Chiggiato, J.; Papa, A.; Pomaro, A.; Sclavo, M.; Tosi, L.; et al. The 1966 Flooding of Venice: What Time Taught Us for the Future. Oceanography 2016, 29, 178–186. [Google Scholar] [CrossRef] [Green Version]
  3. Tosi, L.; Teatini, P.; Strozzi, T. Natural versus anthropogenic subsidence of Venice. Sci. Rep. 2013, 3, 2710. [Google Scholar] [CrossRef] [PubMed] [Green Version]
  4. Reimann, L.; Vafeidis, A.; Brown, S.; Hinkel, J.; Tol, R. Mediterranean UNESCO World Heritage at risk from coastal flooding and erosion due to sea-level rise. Nat. Commun. 2018, 9, 4161. [Google Scholar] [CrossRef] [PubMed] [Green Version]
  5. Canestrelli, E.; Canestrelli, P.; Corazza, M.; Filippone, M.; Giove, S.; Masulli, F. Local Learning of Tide Level Time Series using a Fuzzy Approach. In Proceedings of the IEEE International Joint Conference on Neural Networks, Orlando, FL, USA, 12–17 August 2007; pp. 1813–1818. [Google Scholar]
  6. Danandeh Mehr, A.; Nourani, V.; Karimi Khosrowshahi, V.; Ghorbani, M.A. A hybrid support vector regression—Firefly model for monthly rainfall forecasting. Int. J. Environ. Sci. Technol. 2019, 16, 335–346. [Google Scholar] [CrossRef]
  7. Di Nunno, F.; Alves, P.F.; de Marinis, G.; Di Felice, F.; Gargano, R.; Miozzi, M.; Granata, F. Deformation of Air Bubbles Near a Plunging Jet Using a Machine Learning Approach. Appl. Sci. 2020, 10, 3879. [Google Scholar] [CrossRef]
  8. Granata, F.; Di Nunno, F. Artificial Intelligence models for prediction of the tide level in Venice. Stoch. Environ. Res. Risk Assess. 2021, 35, 2537–2548. [Google Scholar] [CrossRef]
  9. Granata, F.; Di Nunno, F. Air Entrainment in Drop Shafts: A Novel Approach Based on Machine Learning Algorithms and Hybrid Models. Fluids 2022, 7, 20. [Google Scholar] [CrossRef]
  10. Di Nunno, F.; Granata, F.; Pham, Q.B.; de Marinis, G. Precipitation Forecasting in Northern Bangladesh Using a Hybrid Machine Learning Model. Sustainability 2022, 14, 2663. [Google Scholar] [CrossRef]
  11. Guzman, S.M.; Paz, J.O.; Tagert, M.L.M.; Mercer, A.E. Evaluation of seasonally classified inputs for the prediction of daily groundwater levels: NARX networks vs support vector machines. Environ. Model. Assess. 2019, 24, 223–234. [Google Scholar] [CrossRef]
  12. Riazi, A. Accurate tide level estimation: A deep learning approach. Ocean Eng. 2020, 198, 107013. [Google Scholar] [CrossRef]
  13. Ghamariadyan, M.; Imteaz, M.A. A Wavelet Artificial Neural Network method for medium-term rainfall prediction in Queensland (Australia) and the comparisons with conventional methods. Int. J. Climatol. 2021, 41, E1396–E1416. [Google Scholar] [CrossRef]
  14. Di Nunno, F.; Granata, F.; Gargano, R.; de Marinis, G. Prediction of spring flows using nonlinear autoregressive exogenous (NARX) neural network models. Environ. Monit. Assess. 2021, 193, 350. [Google Scholar] [CrossRef] [PubMed]
  15. Di Nunno, F.; de Marinis, G.; Gargano, R.; Granata, F. Tide Prediction in the Venice Lagoon Using Nonlinear Autoregressive Exogenous (NARX) Neural Network. Water 2021, 13, 1173. [Google Scholar] [CrossRef]
  16. Di Nunno, F.; Granata, F.; Gargano, R.; de Marinis, G. Forecasting of Extreme Storm Tide Events Using NARX Neural Network-Based Models. Atmosphere 2021, 12, 512. [Google Scholar] [CrossRef]
  17. Di Nunno, F.; Race, M.; Granata, F. A nonlinear autoregressive exogenous (NARX) model to predict nitrate concentration in rivers. Environ. Sci. Pollut. Res. 2022, 29, 40623–40642. [Google Scholar] [CrossRef] [PubMed]
  18. Comune di Venezia. Centro Previsioni e Segnalazioni Maree—La marea—La marea astronomica, 2020. Available online: https://www.comune.venezia.it/it/content/la-marea-astronomica (accessed on 13 May 2022).
Figure 1. Venice Lagoon with the location of the tide gauge (Environsciproc 21 00093 i001) and weather station (Environsciproc 21 00093 i002).
Environsciproc 21 00093 g001
Figure 2. NARX architecture.
Environsciproc 21 00093 g002
Figure 3. Mean, maximum and minimum tide levels for Punta della Salute.
Environsciproc 21 00093 g003
Figure 4. Comparison between measured and predicted storm tide.
Environsciproc 21 00093 g004
Figure 5. Violin plots of the residuals.
Environsciproc 21 00093 g005
Table 1. Evaluation metrics.
Evaluation MetricsDescriptionEquation
R2Measure of linear correlation between measured and predicted values R 2 = 1 i = 1 n ( h t i d e P i h t i d e A i ) 2 i = 1 n ( h t i d e ¯ h t i d e A i ) 2 (3)
MAE (cm)Absolute error between predicted and measured values normalized by the number of samples M A E = i = 1 n | h t i d e P i h t i d e A i | n (4)
RAE (%)Ratio between absolute error between predicted and measured values and absolute value of the error of the simple measured values R A E = i = 1 n | h t i d e P i h t i d e A i | i = 1 n | h t i d e ¯ h t i d e A i | (5)
Table 2. Statistics for the period 2009–2020 related to htide measured in Punta della Salute.
YearMean
(cm)
Max
(cm)
Min
(cm)
σ
(cm)
Median
(cm)
CVSKEW
200933.38144.00−58.0028.7834.000.86−0.06
201040.52144.00−37.0028.1741.000.70−0.05
201129.48111.00−55.0025.9530.000.88−0.06
201229.56148.00−56.0028.6530.000.97−0.05
201336.41142.00−50.0027.6137.000.76−0.06
201440.02125.00−43.0026.8140.000.670.00
201531.65124.00−60.0027.2332.000.86−0.04
201633.18121.00−65.0026.6334.000.80−0.09
201728.62128.00−57.0026.5129.000.93−0.04
201836.17154.00−64.0027.0036.000.750.02
201935.44185.00−55.0029.5136.000.83−0.06
202032.12139.00−52.0027.5733.000.86−0.10
Table 3. Forecasting performance.
ta = 12 hta = 24 hta = 48 hta = 72 h
R20.9500.9230.9110.899
MAE (cm)1.962.462.912.91
RAE (%)23.0328.9534.2134.25
Disclaimer/Publisher’s Note: The statements, opinions and data contained in all publications are solely those of the individual author(s) and contributor(s) and not of MDPI and/or the editor(s). MDPI and/or the editor(s) disclaim responsibility for any injury to people or property resulting from any ideas, methods, instructions or products referred to in the content.