Proceeding Paper

The Theoretical Probability Distribution of Peak Outflows of Small Detention Dams †

by
Salvatore Manfreda
1,
Domenico Miglino
1,* and
Cinzia Albertini
2,3
1
Dipartimento di Ingegneria Civile, Edile e Ambientale (DICEA), Università degli Studi di Napoli Federico II, 80125 Napoli, Italy
2
Dipartimento di Scienze Agro-Ambientali e Territoriali (DISAAT), Università degli Studi di Bari Aldo Moro, 70126 Bari, Italy
3
Dipartimento di Ingegneria Civile, Ambientale, del Territorio, Edile e di Chimica (DICATECh), Politecnico di Bari, 70125 Bari, Italy
*
Author to whom correspondence should be addressed.
Presented at the International Conference EWaS5, Naples, Italy, 12–15 July 2022.
Environ. Sci. Proc. 2022, 21(1), 90; https://doi.org/10.3390/environsciproc2022021090
Published: 6 February 2023

Abstract

:
The functional relationship between detention dam inflows and outflows was derived in a closed form in a recent work, which led to a theoretically derived probability distribution (TDD) of the peak outflows from in-line detention dams. This TDD is tested using the generalized extreme value (GEV) as a reference distribution for floods.

1. Introduction

During the last decades, the growing number of extreme rainfall events has risen the flood risk perception at the global scale [1,2]. It is recognized that hydrology has been profoundly altered by several factors, such as climate change and anthropization. Therefore, there is an urgent need to identify new methods and approaches able to take into account the non-stationarity of the hydrological forcings, the increase in impervious areas, as well as the presence of hydraulic infrastructures along rivers. In particular, artificial lakes can significantly modify the downstream dynamics of river systems both during low- and high-flow conditions.
Nowadays, most of the existing river basins contain one or more reservoirs that can produce an attenuation of floods (e.g., [3,4]). Such a process is influenced by hydrologic and hydraulic factors, such as flood wave shape and duration, as well as by the storage capacity and geometric characteristics of the detention basin. Therefore, it is crucial to build a mathematical scheme able to interpret the functional relationships, even in a simplified form, between inflows and expected outflows in order to revise the expected impact of floods downstream a given dam [5].
With this aim, Manfreda et al. [6] introduced a theoretically derived probability distribution (TDD) of detention basins peak outflows, which was obtained assuming the incoming flood peaks to be randomly distributed and characterized by rectangular hydrographs of fixed duration (see, for example, [7]). The undisturbed flood peak distribution can be any distribution model commonly used in flood frequency analysis, to be exploited within the mathematical formulation provided in the original manuscript. This characteristic makes the methodology adaptable to several study cases to support the design of flood control systems. Here, we tested the proposed mathematical formulation assuming the generalized extreme value (GEV) distribution as the reference model for the inflow peaks, confirming the flexibility of the method and highlighting its potential to support flood risk analyses.

2. The Theoretically Derived Probability Distribution of Peak Outflows of a Dam

Theoretically derived probability distributions have been widely adopted for flood maxima [8,9,10]; soil moisture [11,12]; scour process [7], and, recently, outflows of a detention dam [6].
Outflows of a detention dam for a given hydrograph are controlled by the characteristics of the spillways. In particular, the presence of detention dams, like those schematically represented in Figure 1, would not significantly influence the outflow as long as the lower opening is not submerged; thereafter, there will be a phase of reservoir filling during which the outflow is almost constant (especially if the dam has a relatively small elevation), and only when the dam is filled up to the level of the spillway the equation [1] can be applied. Therefore, the final TDD should take into account the three possible configurations of the detention dams: (1) undisturbed flow; (2) accumulation of water in the reservoir; and (3) activation of the crest spillway. Based on these assumptions, the probability density function (pdf) of the outflow assumes the flowing form:
p ( Q p , o u t ) = { p Q m a x ( Q p , o u t ) ,             Q p , o u t < Q c Q c W m a x t p + Q c p Q m a x ( Q p , o u t ) d q ,         Q p , o u t = Q c T D D 3 ,                                               Q p , o u t > Q c
Equation (1) describes the general form of the probability distribution of the outflow from a detention dam, where the first component coincides with the distribution of the incoming flow as long as it is below the control discharge of the lower opening ( Q p , o u t < Q c ). In this phase, the probability distribution of outflows can be assumed to be identical to the one of the inflows ( p Q m a x ( Q p , o u t ) ). Assuming that the lower opening can control the outflow around Q c after submergence, there is a mass probability in Q c depending on the storage volume of the reservoir ( Q p , o u t = Q c ). After these two phases, the outflow is affected by the lamination due to the water volume accumulation above the crest level ( Q p , o u t > Q c ). In this last phase, the probability density function can be derived once the relationship between the peak discharge, Q m a x (m3/s), incoming in the detention basin with the peak outflow, Q p , o u t (m3/s), is defined.
The relationship can be derived under the hypothesis that the dam is filled up to the level of the crest spillway. The inverse function assumes the following form [6]:
Q m a x = g 1 ( Q p , out ) = ( W m a x ( 2 Q c t p + W m a x ) k e q Q c ( Q c t p + W m a x ) ) e W m a x t p k e q ( Q c t p + W m a x ) + k e q ( Q c t p + W m a x ) Q ( p , o u t ) e t p k e q k e q ( Q c t p + W m a x ) e t p k e q + ( t p W m a x k e q ( Q c t p + W m a x ) ) e W m a x t p k e q ( Q c t p + W m a x ) ,
where t p (s) is the equivalent event duration of the incoming flood hydrograph reaching the detention dam; k e q   (s) is the equivalent delay constant of the conceptual reservoir associated with the outflow; W m a x (m3) is the volume of water accumulated in the dam at the crest level, h s (m) (height of the spillway crest); and Q c (m3/s) is the control value of discharge that is computed using the discharge equation of the submerged opening assuming h = h s .
In order to take into account the shape of flood hydrographs, Manfreda et al. [6] introduced an equivalent duration, t p (s), based on the synthetic exponential hydrographs proposed by Fiorentino [13], since the assumed rectangular hydrographs would overestimate the overall volume associated with the flood. Therefore, it is necessary to assign to such a simplified hydrograph an equivalent duration expressed as follows:
t p = 0.632   ω
where ω is a function of the lag time, t r ( s ) , of the river basin upstream the detention dam. It can be estimated as follows:
ω = 1.027   t r   e 2.277   n
where n is the exponent of the intensity duration curve of rainfall.
Equation [2] can be used to analytically compute the TDD3 of the peak outflow from an in-line detention dam when the water level is at the crest of the spillway. Given the monotonic nature of the above expression, any probability distribution of the undisturbed flood peaks can be adopted. The expression of the TDD3 will be as follows [14]:
f y ( y ) = | d g 1 ( y ) d y | f x ( g 1 ( y ) ) ,
where the derivative of g 1 ( Q p , o u t ) assumes the following form:
d g 1 ( Q p , o u t ) d Q p , o u t = k e q ( Q c t p + W m a x ) e t p k e q k e q ( Q c t p + W m a x ) e t p k e q + ( t p W m a x k e q ( Q c t p + W m a x ) ) e W m a x t p k e q ( Q c t p + W m a x ) .
Finally, the TDD3 of the outflow when Q p , o u t > Q c assumes the following form:
p ( Q p , o u t ) = | d g 1 ( Q p , o u t ) d Q p , o u t | f Q p , o u t ( g 1 ( Q p , o u t ) ) .

3. Application

The results reported in Manfreda et al. [6] highlighted the ability of the TDD to properly interpret the impact of a detention dam on the final outflow. The proposed framework can be adapted to any probability distribution of floods, making it applicable to several case studies. In this context, we tested three different probability distributions of the incoming flood peaks (i.e., the families of the GEV distributions) and compared theoretical distributions with the results obtained from a numerical simulation.
In Figure 2, the TDD of the three considered distribution models and the empirical pdfs obtained via numerical hydraulic simulations (red dots for inflows, blue dots for outflows) are depicted. The three graphs were obtained by modifying the shape parameter, ξ, of the GEV distribution, which is equal to 0 for the Gumbel distribution (A), 0.5 for the Fréchet distribution (B), and −0.5 for the Weibull distribution (C). Looking at the results, it can be noted that a very good agreement between the obtained TDDs and the numerical simulations was achieved in all three families of distribution models.

4. Conclusions

The present manuscript reviewed the recent formulation to quantify the impact of detention dams on the probability distribution of floods. Despite the necessary simplifications of the method, it can be extremely useful in properly addressing the impacts of the presence of water infrastructures on floods. The methodology is flexible and can efficiently be used for the projects and design of small detention dams. For instance, this method has been recently applied to identify optimal solutions in flood control systems and quantify the impact of hydraulic structures on flood risk [15].

Author Contributions

Conceptualization: S.M. and D.M.; methodology: S.M. and D.M.; validation: D.M., S.M. and C.A.; writing—review and editing: C.A., D.M. and S.M. All authors have read and agreed to the published version of the manuscript.

Funding

This work was by the Italian Ministry of Environment, Land and Sea with the project entitled “Hydraulic risk mitigation in coastal basins with in-line expansion tanks: an integrated sizing approach (MATCAS)”—CUP E68D20000010001.

Institutional Review Board Statement

Not applicable.

Informed Consent Statement

Not applicable.

Data Availability Statement

Codes used to generate the TDD are available on MATLAB Central at the following link: https://it.mathworks.com/matlabcentral/fileexchange/95813-peak-outflows-of-a-detention-basin (Manfreda, 2021) (accessed on 1 Febuary 2023).

Conflicts of Interest

The authors declare no conflict of interest.

Notations

α (-)Scale parameter of the GEV distribution
β (-)Location parameter of the GEV distribution
ξ (-)Shape parameter of the GEV distribution
μf (-)Coefficient of discharge of the submerged low-level opening
μs (-)Coefficient of discharge of the crest spillway
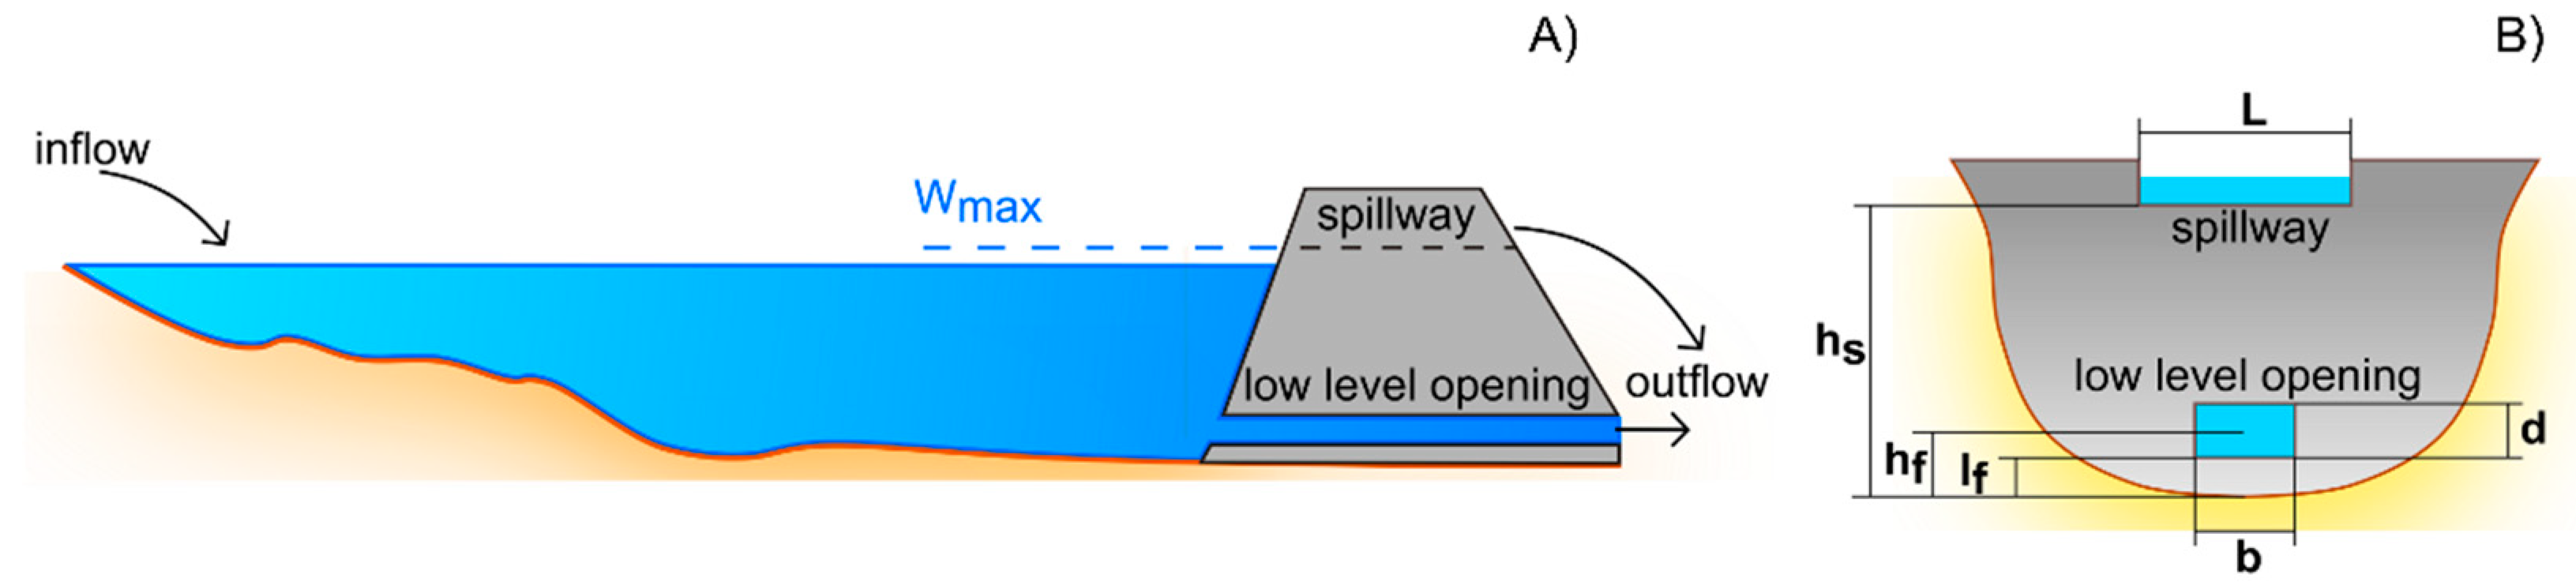
b (m)Width of the low-level opening rectangular section
d (m) Height of the low-level opening
h (m) Variable water level within the detention basin
hs (m) Height of the spillway crest
hf (m) Height of the barycenter of the low-level opening
keq (s)Equivalent delay constant of the conceptual reservoir associated with the outflow
L (m)Effected crest length
n (-)Exponent of the stage-storage capacity curve
n' (-)Exponent of the rainfall intensity duration function
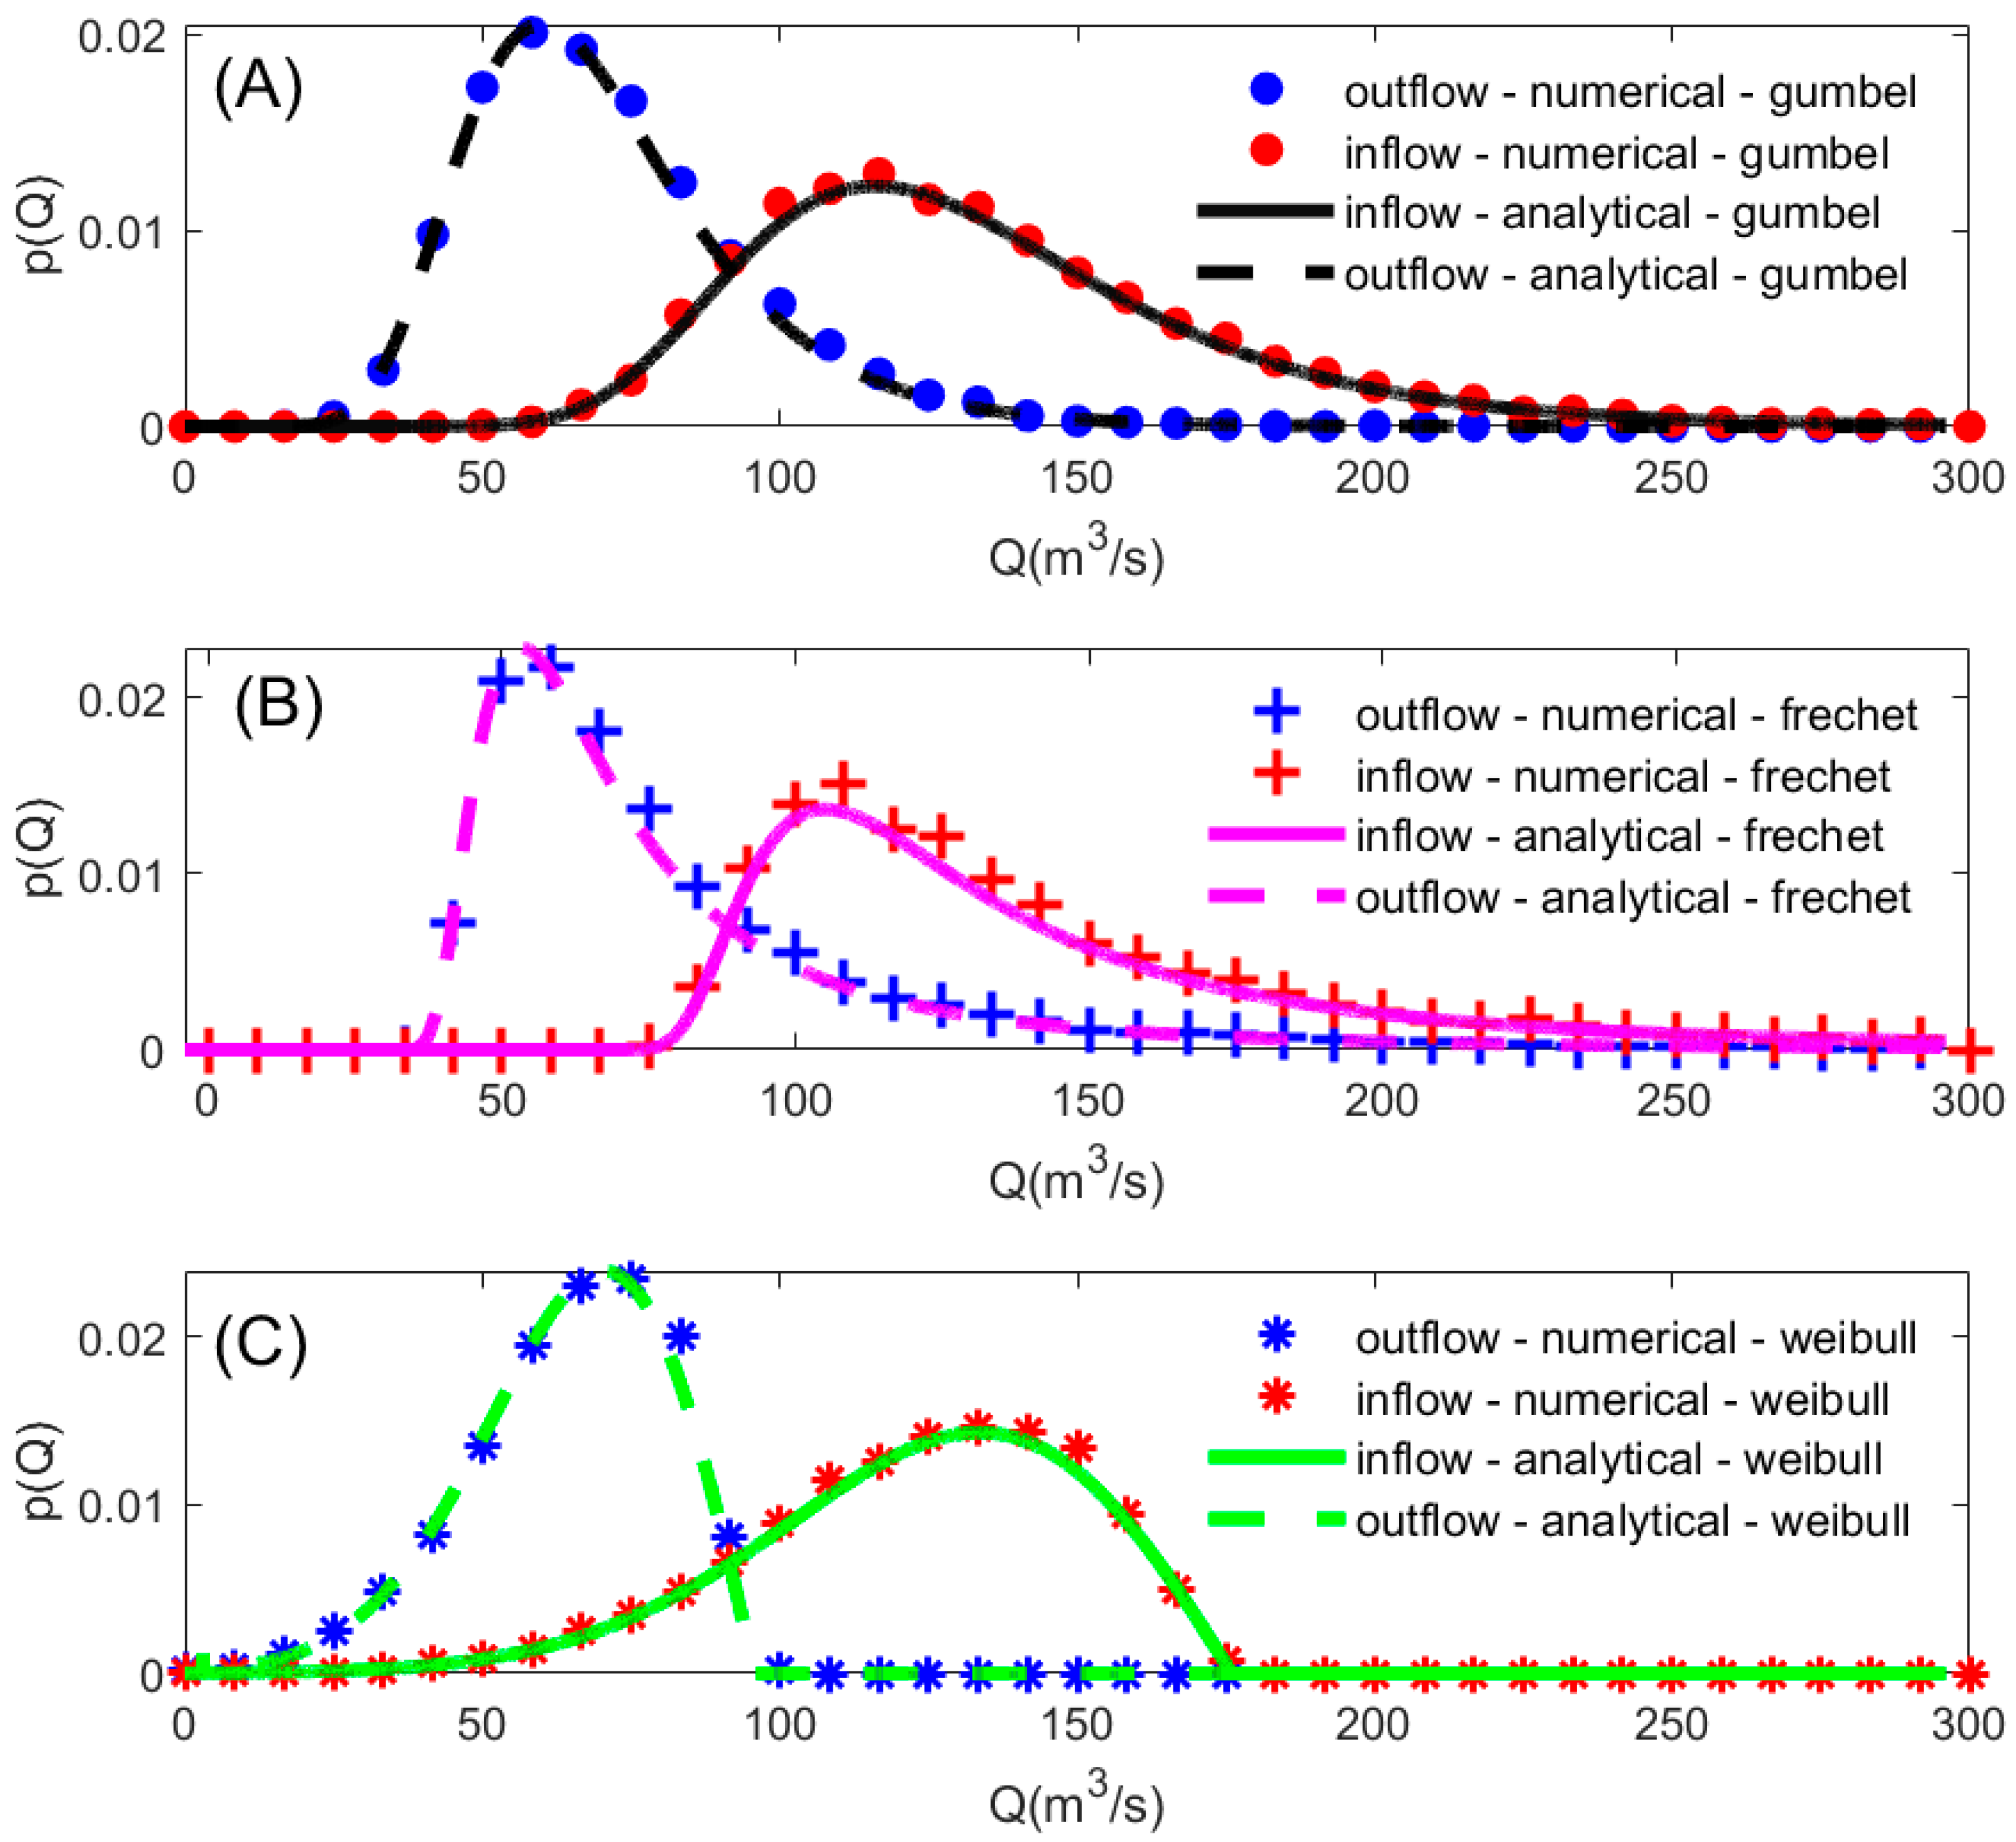
p(Q) (-) Probability density function of outflows
Qc (m3/s) Design outflow from the low-level opening
Qp,out (m3/s)Peak outflow from the detention basin
Qmax (m3/s)Peak flow incoming in the detention basin
tp (s)Equivalent flood duration
tr (s)Basin lag time
Wmax (m3)Water storage capacity at the crest level
w1 (m3−n)Parameter of the stage-storage capacity curve

References

  1. Di Baldassarre, G.; Montanari, A.; Lins, H.; Koutsoyiannis, D.; Brandimarte, L.; Bloeschl, G. Flood fatalities in Africa: From diagnosis to mitigation. Geophys. Res. Lett. 2010, 37, L22402. [Google Scholar] [CrossRef]
  2. Winsemius, H.C.; Aerts, J.C.J.H.; van Beek, L.P.H.; Bierkens, M.F.P.; Bouwman, A.; Jongman, B.; Kwadijk, J.C.J.; Ligtvoet, W.; Lucas, P.L.; van Vuuren, D.P.; et al. Global drivers of future river flood risk. Nat. Clim. Chang. 2015, 6, 381–385. [Google Scholar] [CrossRef]
  3. Jacob, A.C.P.; Rezende, O.M.; de Sousa, M.M.; de França Ribeiro, L.B.; de Oliveira, A.K.B.; Arrais, C.M.; Miguez, M.G. Use of detention basin for flood mitigation and urban requalification in Mesquita, Brazil. Water Sci. Technol. 2019, 79, 2135–2144. [Google Scholar] [CrossRef] [PubMed]
  4. Seibert, S.P.; Skublics, D.; Ehret, U. The potential of coordinated reservoir operation for flood mitigation in large basins–A case study on the Bavarian Danube using coupled hydrological–hydrodynamic models. J. Hydrol. 2014, 517, 1128–1144. [Google Scholar] [CrossRef]
  5. Cipollini, S.; Fiori, A.; Volpi, E. A New Physically Based Index to Quantify the Impact of Multiple Reservoirs on Flood Frequency at the Catchment Scale Based on the Concept of Equivalent Reservoir. Water Resour Res. 2022, 58, e2021WR031470. [Google Scholar] [CrossRef]
  6. Manfreda, S.; Miglino, D.; Albertini, C. Impact of detention dams on the probability distribution of floods. Hydrol. Earth Syst. Sci. 2021, 25, 4231–4424. [Google Scholar] [CrossRef]
  7. Manfreda, S.; Link, O.; Pizarro, A. The Theoretically Derived Probability Distribution of Scour. Water 2018, 10, 1520. [Google Scholar] [CrossRef]
  8. De Michele, C.; Salvadori, G. On the derived flood frequency distribution: Analytical formulation and the influence of antecedent soil moisture condition. J. Hydrol. 2002, 262, 245–258. [Google Scholar] [CrossRef]
  9. Eagleson, P.S. Dynamics of flood frequency. Water Resour Res. 1972, 8, 878–898. [Google Scholar] [CrossRef]
  10. Gioia, A.; Iacobellis, V.; Manfreda, S.; Fiorentino, M. Runoff thresholds in derived flood frequency distributions. Hydrol. Earth Syst. Sci. 2008, 12, 1295–1307. [Google Scholar] [CrossRef] [Green Version]
  11. Manfreda, S.; Fiorentino, M. A Stochastic Approach for the Description of the Water Balance Dynamics in a River Basin. Hydrol. Earth Syst. Sci. 2008, 12, 1189–1200. [Google Scholar] [CrossRef]
  12. Rodríguez-Iturbe, I.; Porporato, A. Ecohydrology of Water-Controlled Ecosystems: Soil Moisture and Plant Dynamics; Cambridge University Press: Cambridge, UK, 2007. [Google Scholar]
  13. Benjamin, J.R.; Cornell, C.A. Probability, Statistics, and Decision for Civil Engineers; Courier Corporation: Chelmsford, MA, USA, 2014. [Google Scholar]
  14. Fiorentino, M. La valutazione dei volumi dei volumi di piena nelle reti di drenaggio urbano. Idrotecnica 1985, 3, 141–152. [Google Scholar]
  15. Albertini, C.; Miglino, D.; Bove, G.; De Falco, M.; De Paola, F.; Dinuzzi, A.M.; Petroselli, A.; Pugliese, F.; Samela, C.; Santo, A.; et al. Integration of a Probabilistic and a Geomorphic Method for the Optimization of Flood Detention Basins Design. Environ. Sci. Proc. 2022, 21, 9. [Google Scholar] [CrossRef]
Figure 1. Example of a detention dam composed of a low-level opening (b × d), a crest spillway of length L and height hs, and with a capacity equal to Wmax. The figure provides the longitudinal (A) and the frontal sections (B).
Environsciproc 21 00090 g001
Figure 2. Comparison between three different derived pdfs of the peak outflows obtained using three different flood peak distributions and the empirical pdfs derived via numerical hydraulic simulation (red dots for inflows, blue dots for outflows). The three graphs were obtained by modifying the shape parameter, ξ, of the GEV distribution, which is equal to 0 for Gumbel distribution (A), 0.5 for Fréchet distribution (B), and −0.5 for Weibull distribution (C). Remaining parameters are as follows: the scale parameter of the GEV distribution α = 30 m3/s; the location parameter of the GEV distribution β = 120 m3/s; w1 = 5000; hs = 4 m; b = 1 m; d = 1 m; n = 1.9; hf = d/2; μf = 0.85; μs = 0.385; L = 3 m; tp = 1 h.
Environsciproc 21 00090 g002
Disclaimer/Publisher’s Note: The statements, opinions and data contained in all publications are solely those of the individual author(s) and contributor(s) and not of MDPI and/or the editor(s). MDPI and/or the editor(s) disclaim responsibility for any injury to people or property resulting from any ideas, methods, instructions or products referred to in the content.

