Abstract
The design of hydraulic structures needs to account for a trade-off between implementation costs and flood damages, as well as for the impacts on basins hydrological responses over a wide spectrum of events. In this work, a new methodology for dimensioning an in-line detention dam that integrates geomorphic, probabilistic and economic modeling is proposed. It is formulated as an economic optimization problem aimed at minimizing the sum of the construction cost and the cost of the residual flood risk on residential buildings. The optimization procedure was applied to a hypothetical in-line detention dam located upstream of the urban area of Castellammare di Stabia (Naples, Italy).
1. Introduction
Common floodplain management practices often rely on the implementation of detention dams, either in-line or off-line, to both store a certain amount of a flood event volume and reduce flow peak values. The mitigation effect is ensured by a controlled outflow structure, usually a weir, that limits the amount of floodwater released downstream, thus reducing flood losses. Traditional methodologies for sizing these structures are based on an assumed flood event with specified return period. However, return period approaches appear to suffer from some shortcomings and to neglect economic, environmental and social factors of the specific construction project [1].
On the other hand, risk-based design of flood mitigation structures has been proposed as an alternative to the return period method. At the local scale, the modeling framework of this approach is based on the optimum design of hydraulic infrastructures, looking for trade-offs between construction costs and the monetary risk of failure, whereas at the catchment scale it is aimed at evaluating alternatives among different solutions through multi-criteria decision-making analyses [2]. Optimal risk-based design methods were applied to levee systems to determine the best design parameters [3], as well as to retention basins [4] and multiple detention dams [5] to get the ideal location and/or geometry.
While risk-based design of flood protection systems allows implementing the most reliable and optimum mitigation measure in terms of risk reduction and implementation costs, dimensioning of flood protection structures needs to account for the effectiveness of flood control over a wide spectrum of events. Recently, Manfreda et al. [6] proposed a probabilistic approach for the assessment of flood peaks in river basins characterized by the presence of detention dams. This model allows overcoming the shortcomings of traditional design approaches and evaluating the flood mitigation capacity of detention dams over the full spectra of flood events, thus assessing the influence of these structures on the probability distribution of floods.
In the present work, the abovementioned probabilistic method has been combined with geomorphological and economic analyses in an integrated modeling framework for the design of an in-line detention dam. In detail, the Theoretically Derived probability Distribution (TDD) of the peak outflows from the detention dam [6] was considered to determine flood risk scenarios for events exceeding its flood mitigation capacity. The TDD was coupled with the Geomorphic Flood Index (GFI) method [7] to map areas at risk of flooding and assess the vulnerability of exposed elements. Finally, the monetary values of flood damages to vulnerable residential buildings in the flooded areas and the cost of construction of the detention dam were evaluated considering economic quantifications found in the literature. The mathematical formulation is described as an optimization problem aimed at minimizing the sum between damage and construction costs to look for the ideal sizing parameters of the detention dam.
This paper is organized in the following way. Section 2 describes the study area selected to test the proposed methodology. Section 3 illustrates the optimization procedure and the quantification of the construction and flood damages costs. In addition, hydraulics and hydrologic simulations carried out for both the detention dam design optimization and for validation purposes are briefly introduced. Section 4 presents the results of the dimensioning of a hypothetical in-line detention dam in the study area. Finally, in Section 5, the main outcomes are discussed and conclusions are drawn.
2. Study Area
To test the proposed methodology for the optimization of the design of an in-line detention dam, we implemented the modeling framework to the San Pietro Creek in the Campania region, Italy. Specifically, the optimal location identified for the detention dam is characterized by a narrow and deep gorge. It is worth noting that this is a synthetic case study and not an actual ongoing project for the realization of the hydraulic structure in the study region.
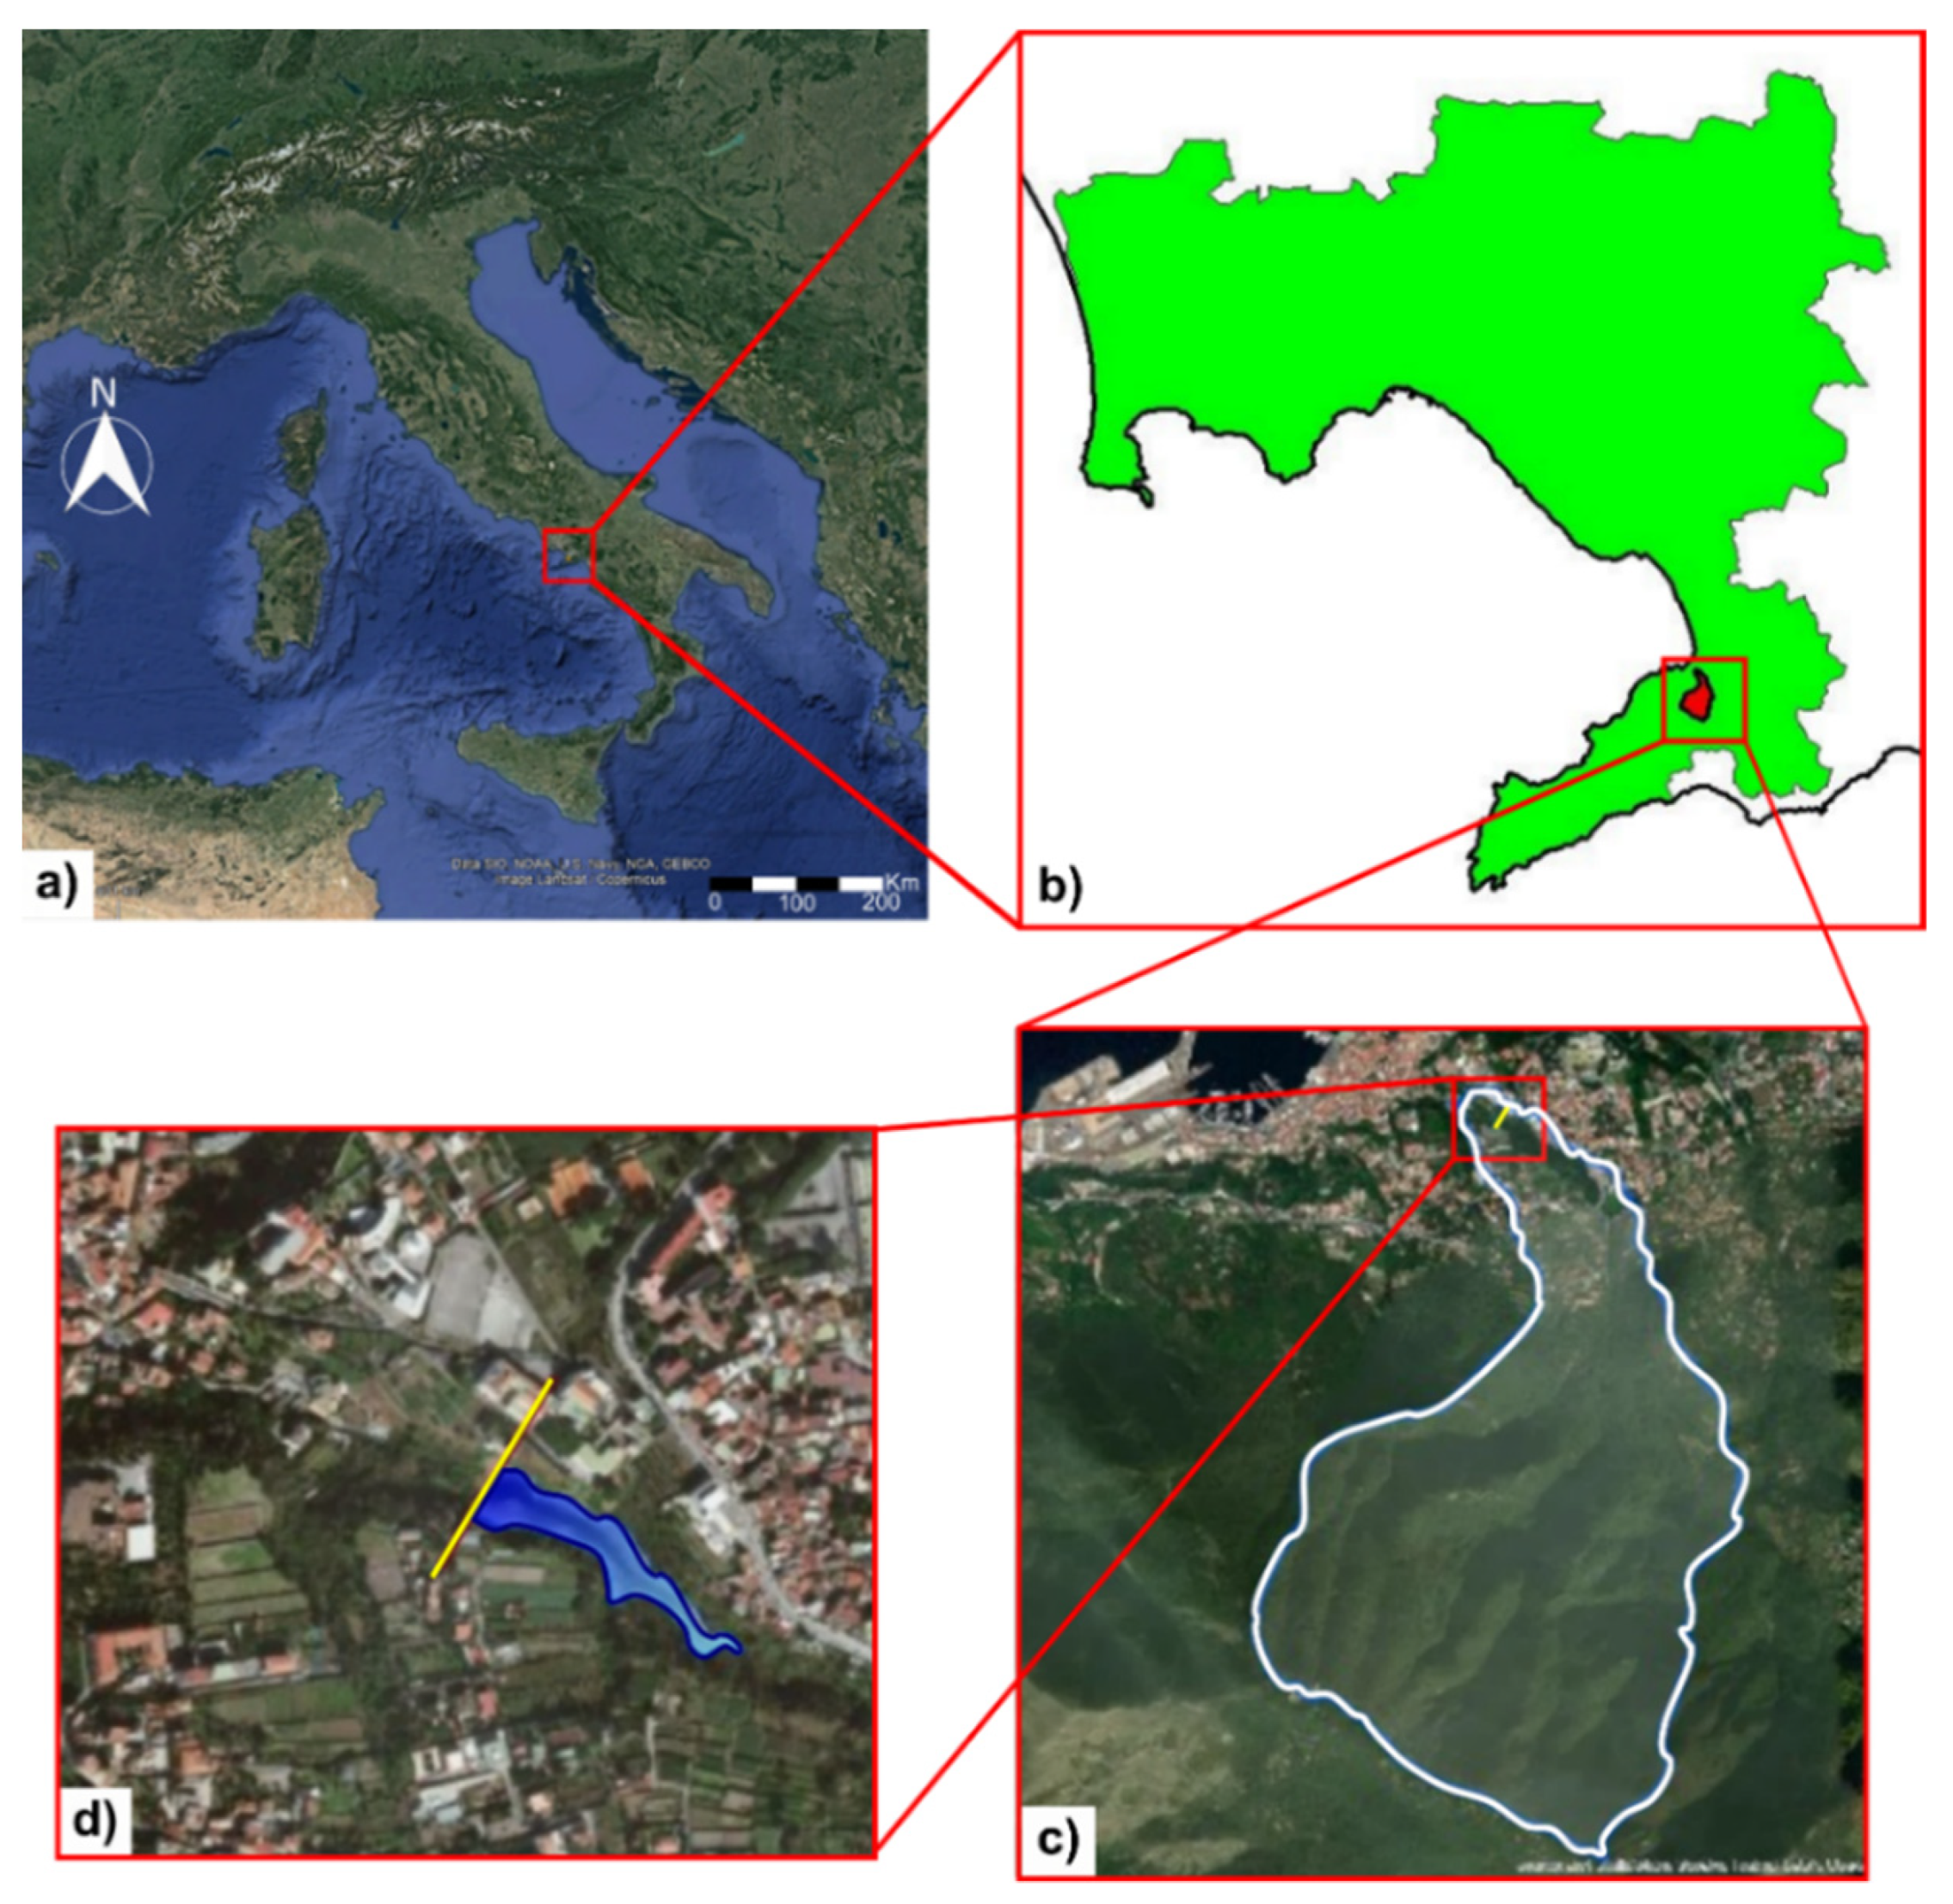
The study area is located in Castellammare di Stabia (Figure 1) and mainly extends on active alluvial fans [8]. It is characterized by geological and geomorphological features similar to other areas and foothills in the Sorrentine Peninsula–Lattari Mts, formed by Triassic and Miocene carbonate ridges [8]. This region experiences heavy convective precipitation with mean annual values ranging between 1000 and 2000 mm [9]. The urban area of Castellammare di Stabia is frequently affected by flooding, especially by flash floods [10] with torrential regime, as a consequence of the high slopes and short concentration time that characterize the small river basins crossing the urban area.
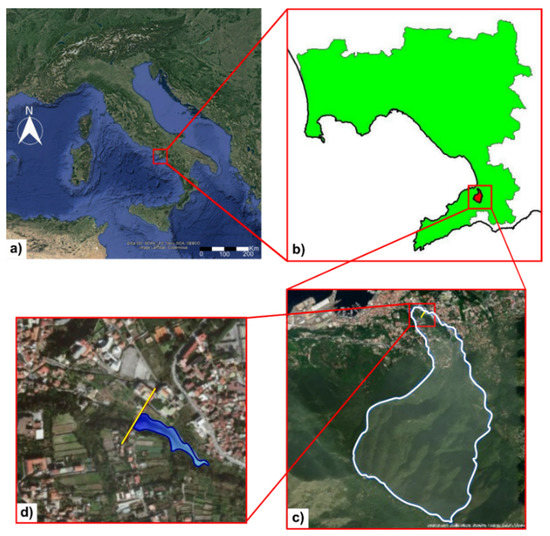
Figure 1.
Location of the study area in Castellammare di Stabia. (a) topographic map of Italy, (b) position of the basin (in red) within the Province of Naples (in green), (c) focus on the watershed (in white) and aerial photo near the closing section (in yellow) of the basin and (d) location of the detention dam (in blue) (map source: Google, SIO, NCAA, US Navy, NGA, GEBCO, Landsat).
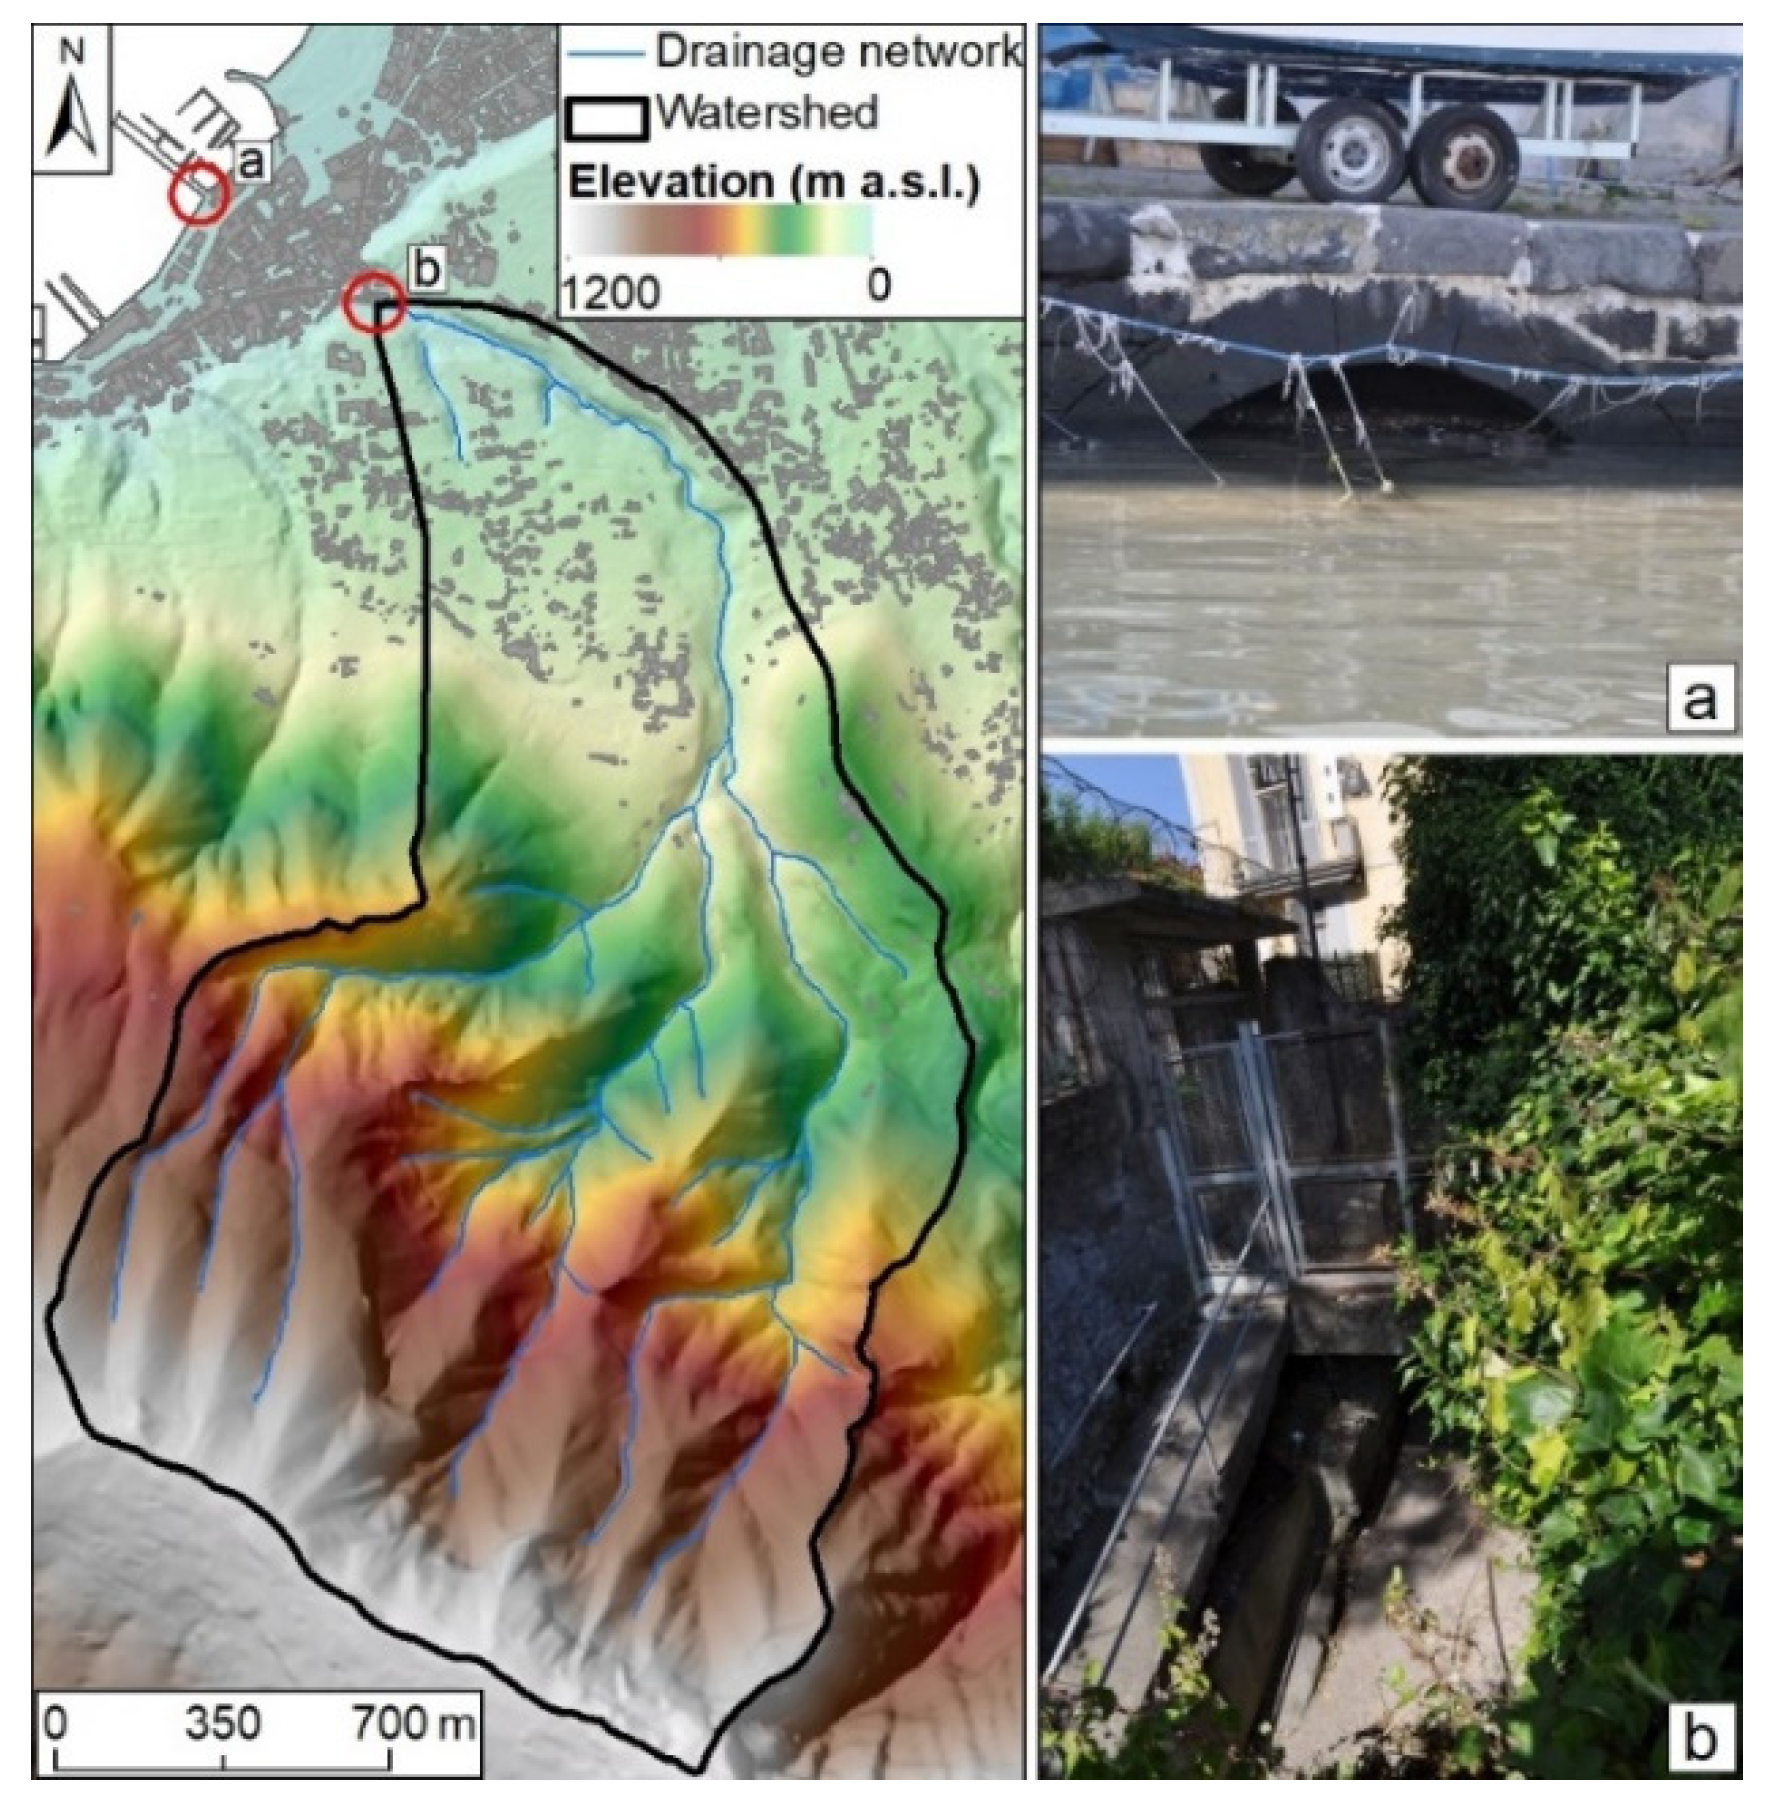
The San Pietro Creek is a torrential river that originates from the northern part of the Lattari Mts and flows into the Tyrrhenian Sea in the Gulf of Castellammare di Stabia. The contributing area is relatively small (3.10 km2), but the average basin slope is around 83%, with a very short response time (less than one hour). Before reaching the sea, the San Pietro Creek is canalized and forced to flow into a hydraulic structure, i.e., a bypass, to cross beneath the urban area. Figure 2 shows the topography of the study area and details of the bypass at the inlet and outlet sections.
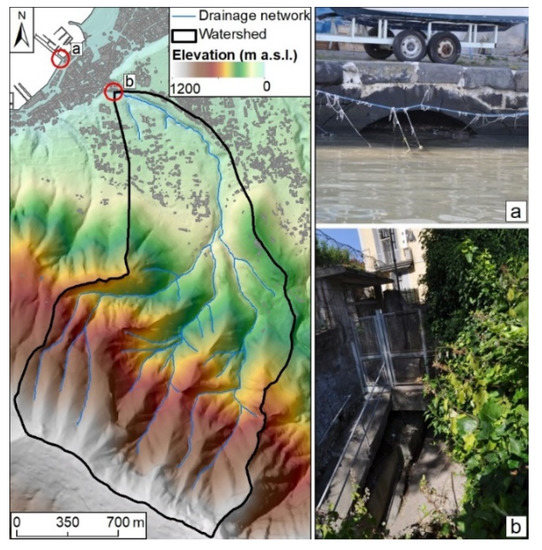
Figure 2.
Topographic charachteristics of the study area (left panel) and details of the bypass (right panel) at the (a) outlet and (b) inlet sections.
3. Methodology
3.1. Economic Optimization of the Detention Dam
The design of the detention dam was formulated as an economic optimization problem to derive the most convenient construction parameters in terms of implementation costs and flood mitigation effectiveness, i.e., minimizing residual risk. According to this formulation, the total costs, [€], is expressed as the sum of the construction costs, [€], and the damage costs, [€], due to residual risk of flooding. In optimal conditions, must be minimized:
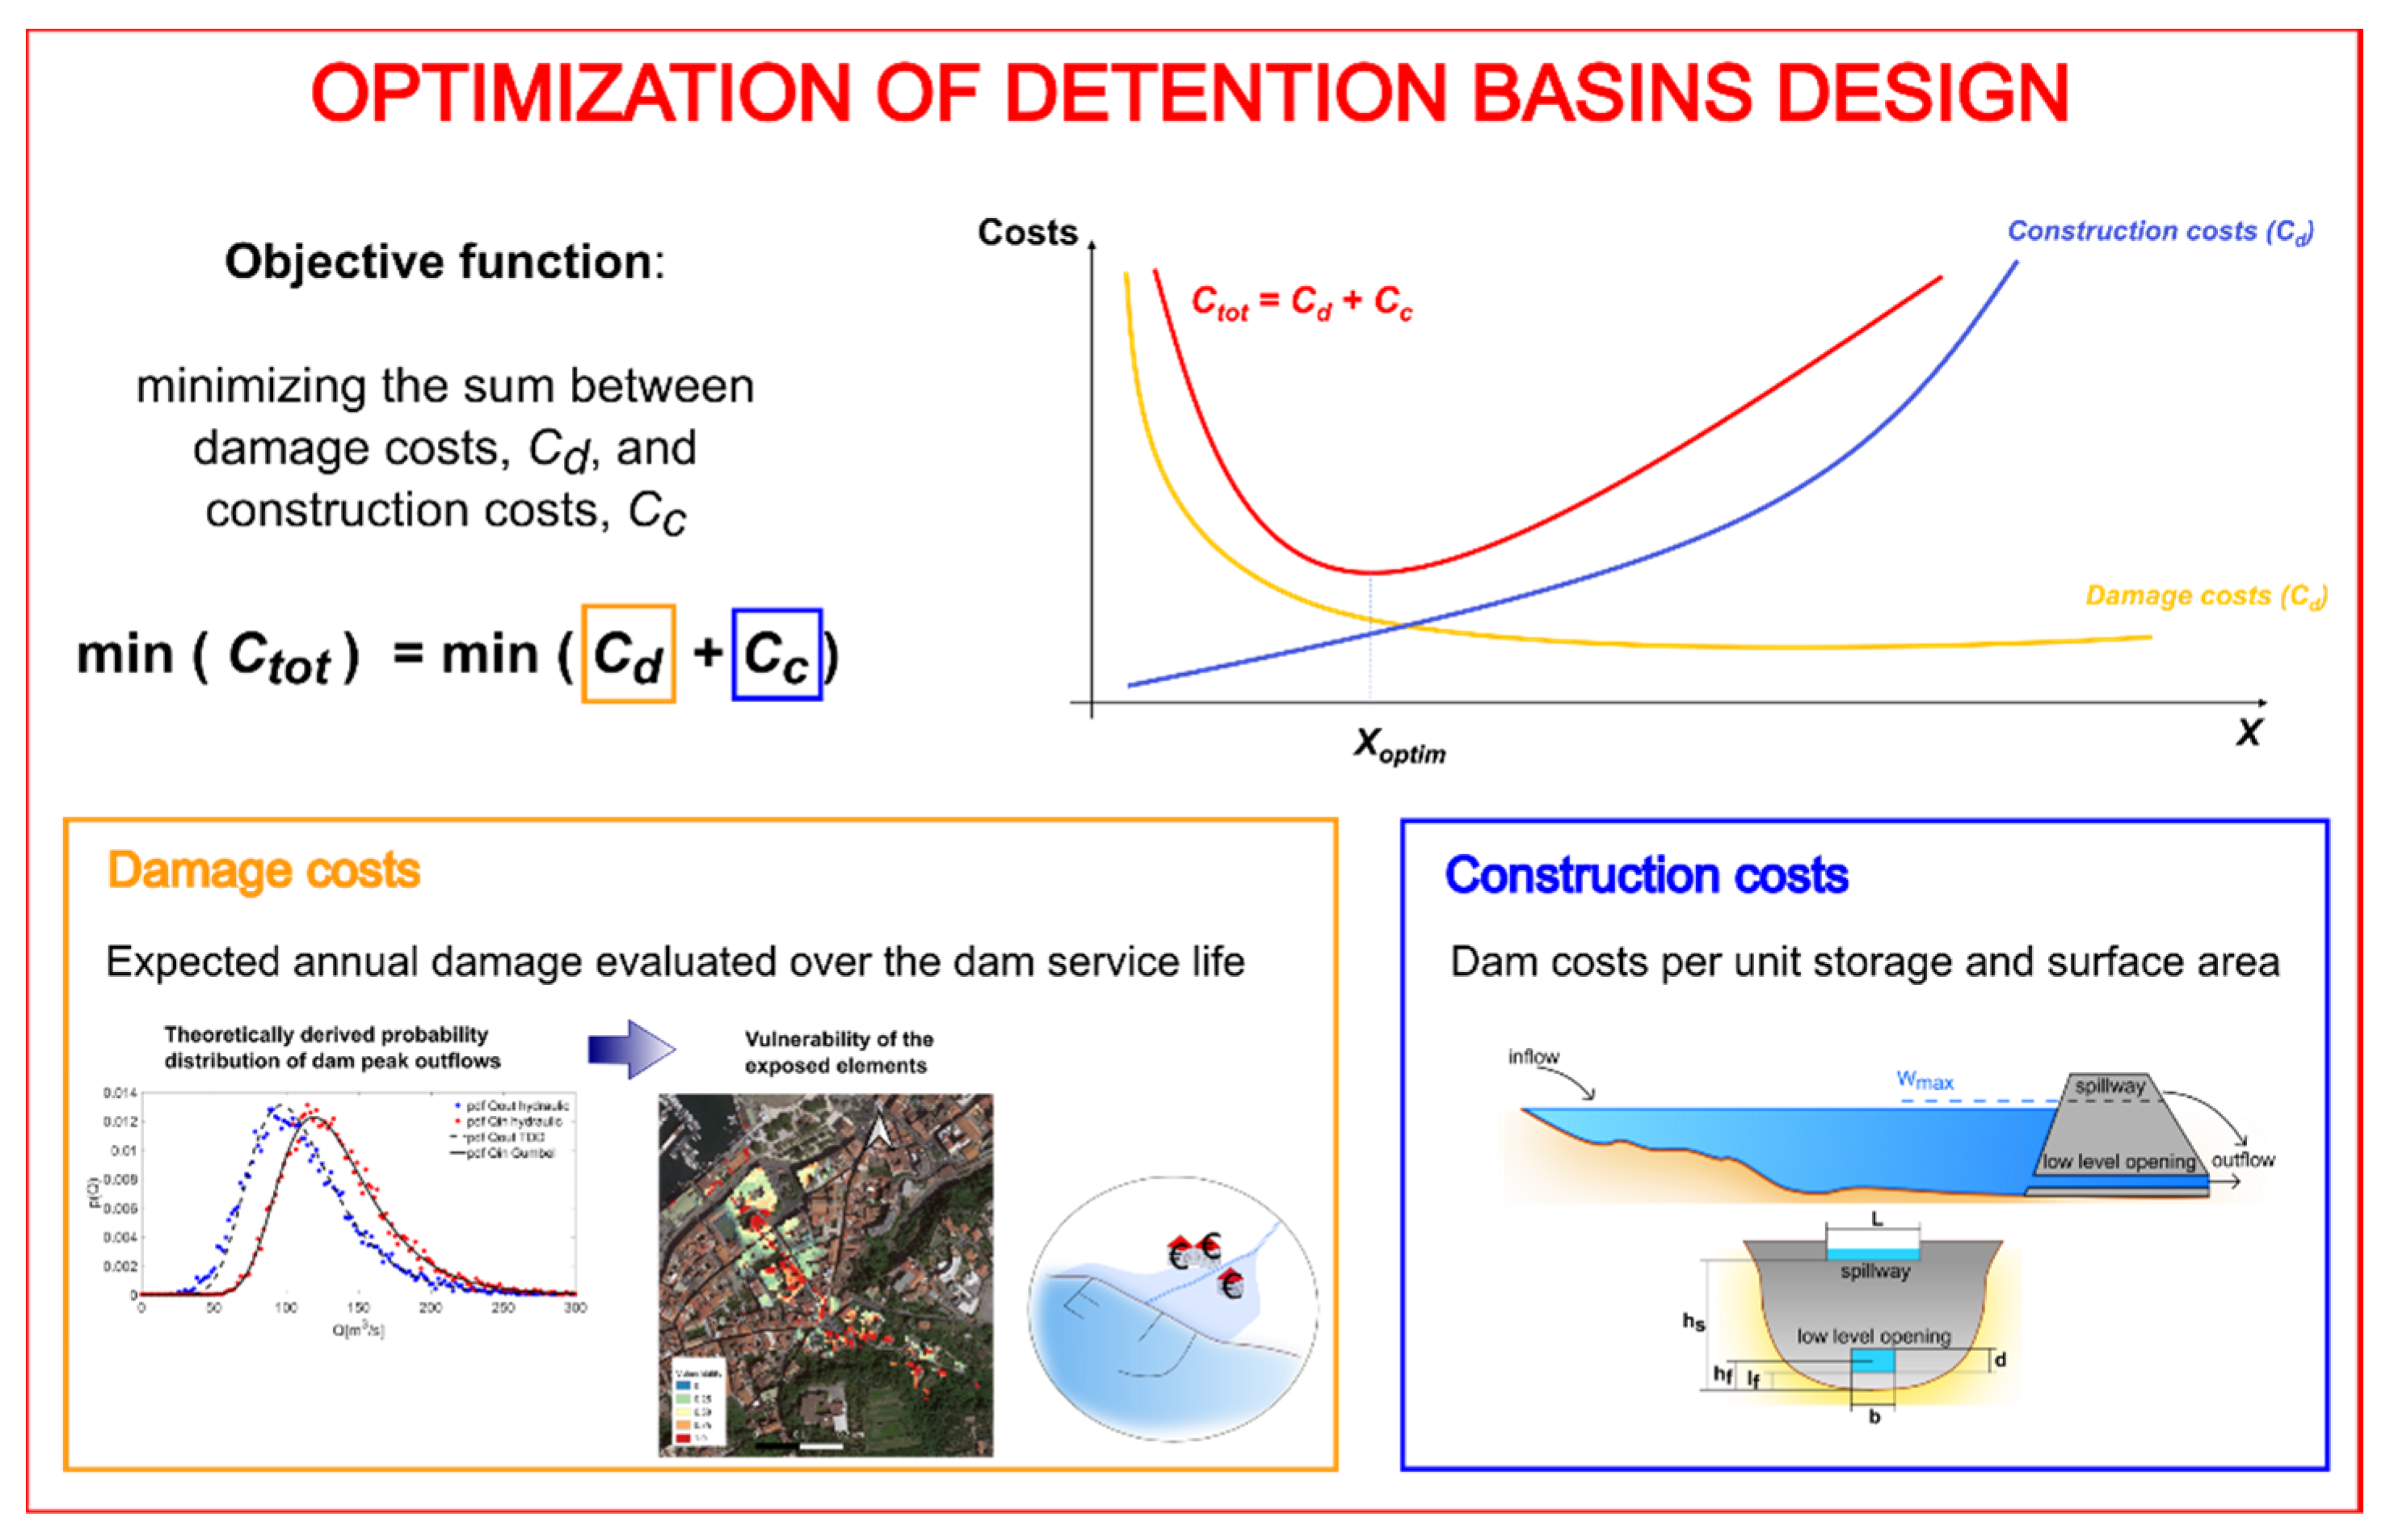
An overview of the methodological workflow and conceptualization of the procedure is shown in Figure 3. The methodology was developed following the economic optimization formulation used in pumping systems for selecting the optimal pipe diameter and according to which is represented by a curve that shows a minimum point identifying the most economic value of the pipe diameter. While for pumping systems this is the primary design parameter, when designing a detention basin, many parameters can influence its flood mitigation capacity, including hydraulic parameters [11].
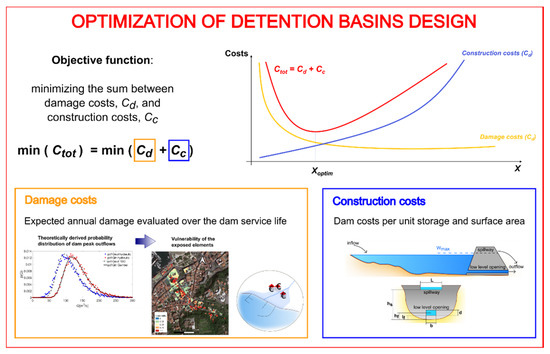
Figure 3.
Methodological workflow and conceptualization of the optimum design procedure for an in-line detention dam. Total costs, Ctot, are expressed as a function of expected flood damage costs, Cd, and dam construction costs, Cc.
3.1.1. The Conceptual Scheme
In our conceptualization, we assumed that the detention dam body has two flow-controlling elements: a low-level opening at the basement, with length [m] and height [m], and a crest spillway, with length [m] and height [m]. Overall, the dam body is assumed to have a maximum height, [m], equal to , where [m] is a safety factor set to 2 m. After an in-depth analysis of the influence of these parameters on the effectiveness of the dam in reducing flood peaks, the height of the spillway crest was found to have a relevant role in regulating flow discharge and, thus, assumed as the primary design parameter. For this reason, the low-level opening was sized to handle the maximum discharge value at the bankfull capacity (). Regarding the length of the spillway crest, an increase in the flood control capacity was observed for decreasing values; therefore, it was set to an optimal value of 5 m.
3.1.2. Construction Costs
Construction costs, , were quantified according to the study proposed by Petheram and Mcmahon [12]. The authors developed a linear regression (Equation (2)) for Australian dams to model the relationship between dam costs per unit storage [$103 m3] and the reservoir surface area, [103 m2]. We used this relationship to evaluate in a rapid and all-inclusive fashion the implementation costs, without entering the details about maintenance, excavation or materials costs.
Construction costs were, thus, computed considering the reservoir stage-surface area curve:
where [m3−n] is the parameter of the stage-storage capacity curve, is the maximum dam height as described in the previous subsection and [-] is the exponent of the stage-storage capacity curve:
where [m3] is the water storage of the detention dam.
3.1.3. Average Annual Damages
Potential flood damages depend on the flood mitigation capacity of the detention dam. The quantification of damage costs, , is formulated in probabilistic terms by computing the expected value of the average annual damage, E(D(Q)) [€/year], over residential buildings in the study area, evaluated over the dam service life, . Considering a series of flood scenarios characterized by peak values with a probability distribution function and assuming flood damages as a continuous random variable, the expected value of the average annual damage can be computed as:
where [€] is the damage value for the specific flood scenario and is the probability density function (pdf) of the peak outflows from the in-line detention dam theoretically derived from the probability density function of inflow peak values. This function is computed following the model proposed by Manfreda et al. [6], assuming as pdf the well-known Generalized Extreme Value (GEV) distribution. The GEV distribution was calibrated considering the maxima of synthetic hydrographs generated by the hydrological simulation according to Grimaldi et al. [13], briefly described below (Section 3.1.4).
Damage values were computed through a geomorphic approach based on a Digital Elevation Model (DEM) with a 5-m cell size and considering residential buildings as exposed elements. To this aim, a raster surface was built wherein a positive value was assigned to each pixel if it identifies a building or part of it. Damage values are estimated as:
where [€m−2] is the substitution cost of the damaged elements exposed to flood inundation per unit area, [-] is a vulnerability function for the elements at risk and [m2] is the raster cell size.
The substitution cost was quantified referring to the study proposed by Naso [14]. The authors quantified replacement costs of damaged elements for varying water depths, referring to a standard room of 20 m2 for three types of building finishes (poor, medium and rich). By using the economic data reported in this study, we developed a relationship between the substitution cost per unit area and the water depth, [m], considering the richly finished building category as the worst-case scenario:
As far as the vulnerability function is concerned, we decided to use the one proposed in the socio-hydrological study by Di Baldassarre et al. [15], properly modified for our scope. The authors express flood damage as a function of water depths, distance of the center of mass of the settlement to the river and a parameter describing the topographic characteristics of the floodplain (e.g., the slope). Hence, the water depth, , distance to the river computed following the flow direction, , and the local slope, , are the parameters selected for the present study and applied in the modified version of the vulnerability function, which appears in the form:
Equation (8) allows deriving vulnerability maps for each flood scenario and in which each pixel corresponding to the built environment (residential buildings) is classified with a value ranging from 0 (no damage) to 1 (maximum damage).
In both Equations (7) and (8), water depth is expressed as a function of the peak discharge . In this work, it was computed on a geomorphic base, starting from flood inundation maps derived through the Geomorphic Flood Index (GFI) method [16]. It is worth noting that the DEM-based flood maps do not take into consideration hydraulic structures in the study area. For this reason, we assumed that the bypass was fully obstructed. This is not a limitation of the methodology, since it can be considered as a safety factor. The GFI and its use in a threshold binary classification allowed delineating flooded areas based on the DEM (please refer to Samela et al. [7,12] for a more detailed description of the GFI method and the linear binary classification). Usually, the threshold parameter, , used in the binary classification, needs to be calibrated on reference flood hazard maps (e.g., detailed hydraulic hazard maps) for the assigned return period. In this study, we applied an empirical relationship [17], linking to peak discharge values with assigned return periods to derive flood hazard maps. Starting from these maps, we extrapolated the elevation value in each flooded area border cell to derive water depth maps. In particular, we considered a horizontal surface perpendicular to flow direction values and assigned a water depth value to each flooded pixel. In this way, each pixel corresponding to the built environment affected by the flood is assigned a water level to assess its exposure.
Finally, assuming a dam service life , damage costs, , are quantified using the following equation:
3.1.4. Hydrologic and Hydraulic Simulations
Hydrologic simulations were carried out to get a synthetic rainfall and discharge time series to be used as input for both the detention dam design optimization and validation purposes through two-dimensional hydraulic simulations. Specifically, the hydrological simulations were carried out by implementing two types of software for continuous modeling. The first one consists of a synthetic high-resolution rainfall generator (called STORAGE), while the second one (called COSMO4SUB) consists of a program for the rainfall-runoff continuous modeling. For further details about this software, the reader is referred to Grimaldi et al. [13] and De Luca et al. [18], as the description of these models are out of the scope of this manuscript. The output of these simulations, i.e., synthetic flood hydrographs, were implemented in two-dimensional hydraulic simulations using the FLO-2D software, to identify flooded areas in both pre- and post-realization of the detention dam. In the hydraulic simulations, we considered that the bypass located immediately upstream the urban area of Castellammare di Stabia was partially obstructed. The simulations performed considering the presence of the dam were carried out to verify the effectiveness of the optimal-designed structure in reducing flood hazard and damage downstream.
4. Results
4.1. Optimization of the Detention Dam Parameters
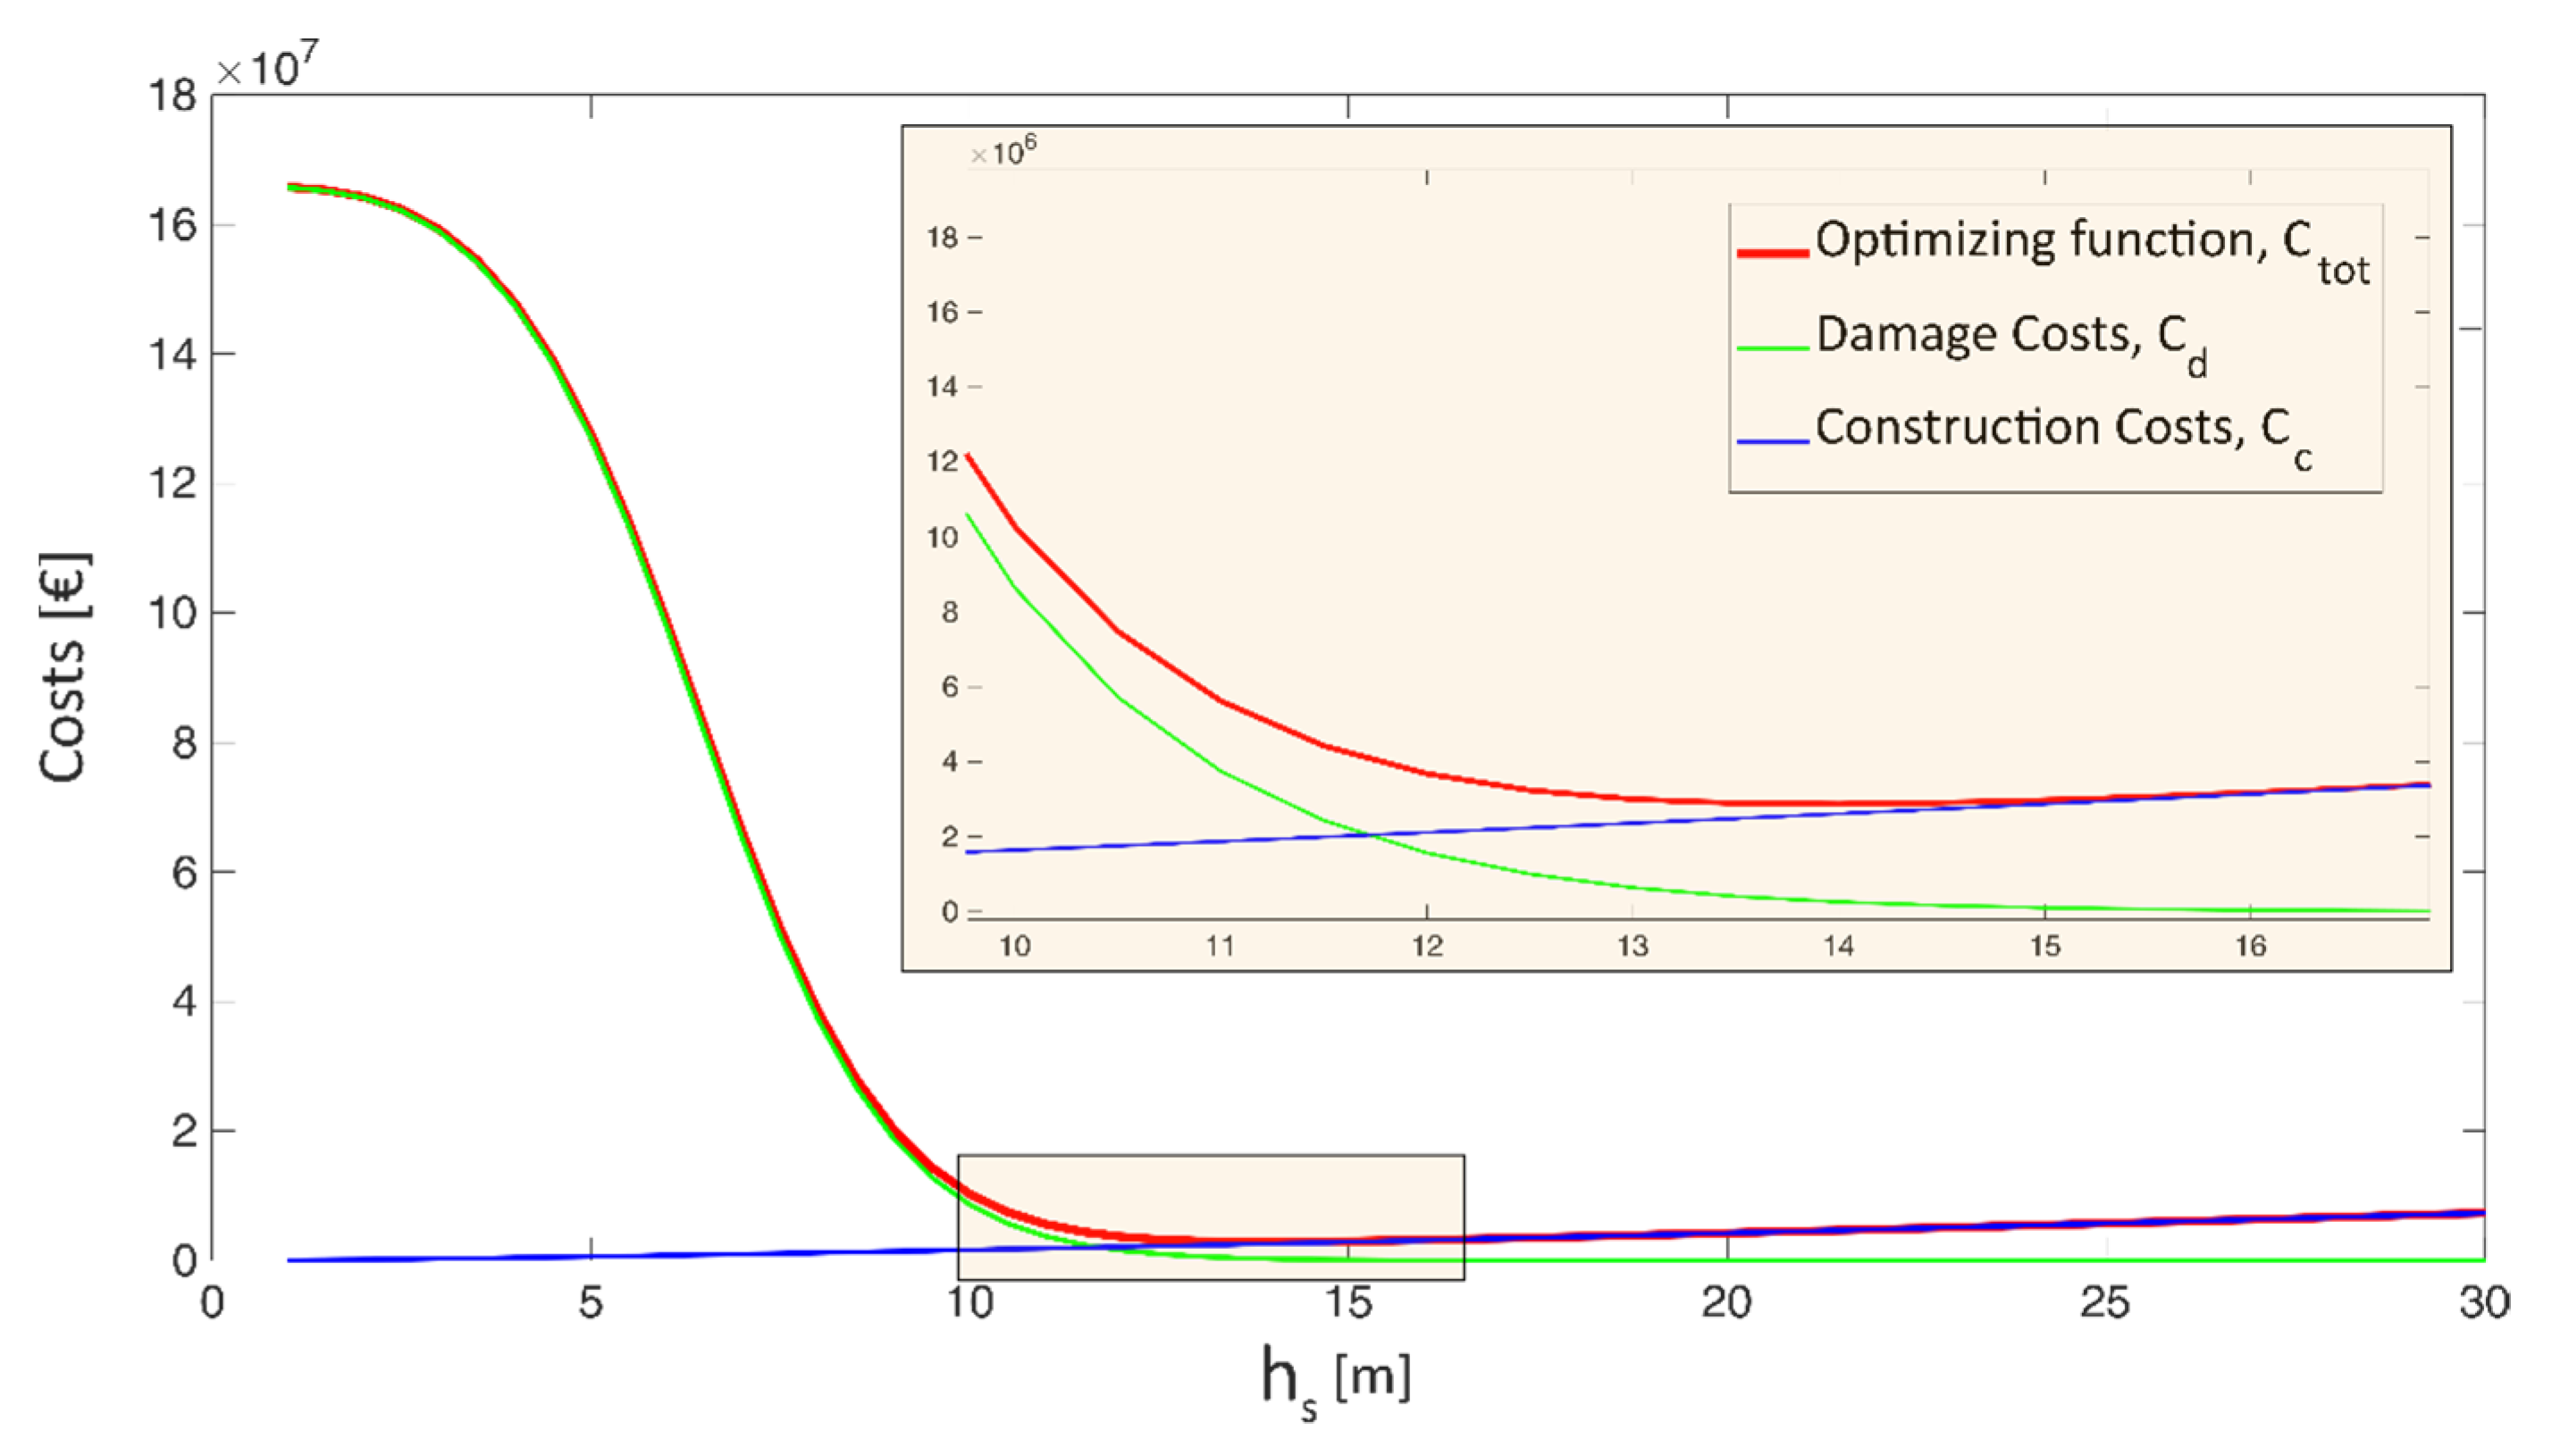
The optimization of the detention dam parameters allowed searching for the value of the height of the spillway crest that ensures the maximum benefit (i.e., the flood risk reduction downstream the dam) at the minimum construction costs. Figure 4 shows the results of the optimization problem in terms of variation of , and at varying spillway crest height. The optimum value identified is 14 m, for a total cost of less than 3.0 M€. The obtained results were also validated through two-dimensional hydraulic simulations using the FLO-2D software, to assess the structure impacts in terms of flood mitigation effects in the flood-prone area downstream.
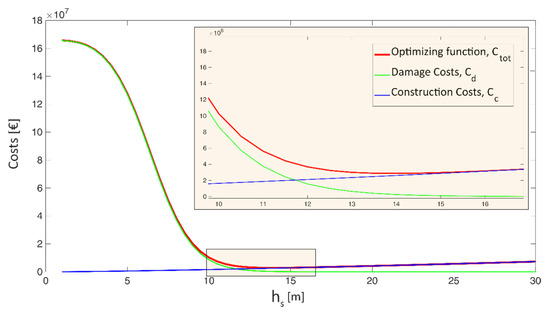
Figure 4.
Results of the optimization procedure for the dimensioning of the Castellammare di Stabia in-line detention dam and focus on the optimum solution.
4.2. Validation of the Optimum Detention Dam Design
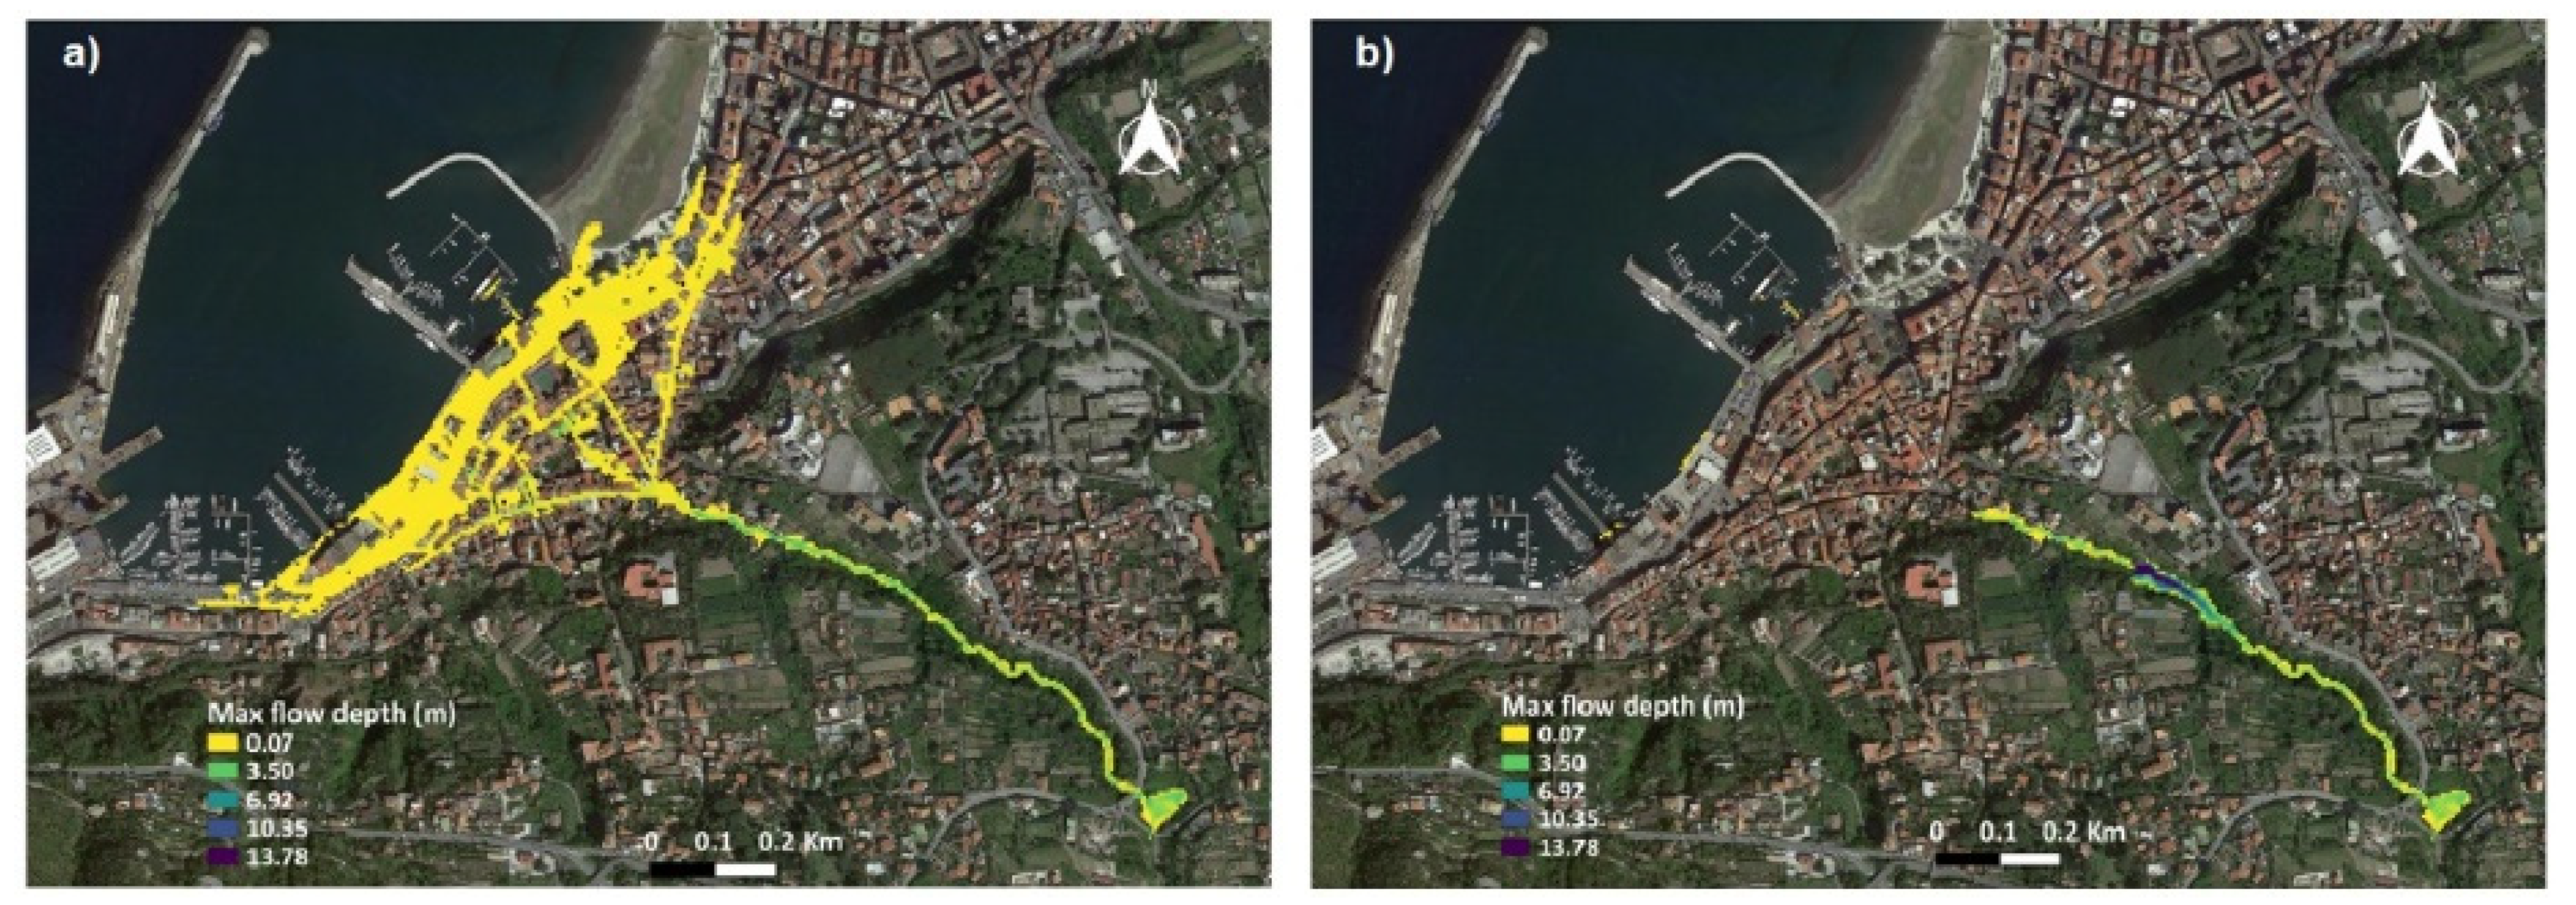
The validation of the optimized detention dam in terms of flood risk reduction for the urban area of Castellammare di Stabia was carried out considering the worst flood scenario as obtained by the FLO-2D hydraulic propagation. Figure 5 shows the results of the validation procedure, and the effectiveness of the optimum detention dam design is highlighted. In fact, urban areas are either completely prevented from flooding or the number of areas affected is significantly reduced thanks to the presence of the in-line detention dam.
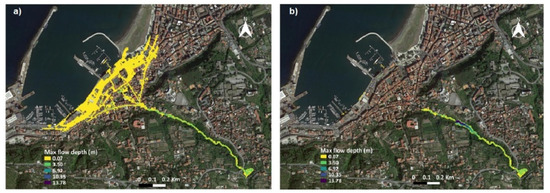
Figure 5.
Validation results in terms of comparison between (a) ante operam and (b) post operam flooded areas and water depth values obtained from the FLO-2D hydraulic simulations.
5. Discussion and Conclusions
In this work, we proposed a novel methodology for the design of an in-line detention dam. In particular, by integrating economic, probabilistic and geomorphic methods, we obtained the optimum parameterization of the detention dam. Considering the specific features of the river basin where the methodology was tested and the particular localization of the dam, i.e., the narrow and deep gorge, the value obtained for the height of the spillway crest represents a satisfactory result. Moreover, the impacts of the designed hydraulic structure and the effectiveness in reducing the flood risk downstream was successfully verified through two-dimensional hydraulic simulations.
Our model represents a preliminary but effective multidisciplinary approach, which allows for considering the stochastic nature of flood processes, the specific geomorphology of the territory and economic aspects related to both the construction per se and the expected flood damages. Despite some assumptions and simplifications being necessary, our methodology offers the possibility to get a reliable dimensioning of in-line detention dams even in small and ungauged basins, such as the one considered in this study.
Author Contributions
Conceptualization, C.A., D.M. and S.M.; methodology, C.A., D.M., G.B., M.D.F., F.D.P., A.M.D., A.P., F.P, C.S., A.S., G.S., S.M. and A.G.; software, G.S., A.P., G.B. and F.P.; validation, C.A., D.M., G.S. and A.P.; investigation, M.D.F. and A.S.; writing—original draft preparation, C.A., D.M., A.G., F.D.P. and S.M.; writing—review and editing, C.A., D.M., G.B., M.D.F., F.D.P., A.M.D., A.P., F.P, C.S., A.S., G.S., S.M. and A.G. All authors have read and agreed to the published version of the manuscript.
Funding
This work was part of a project entitled “Hydraulic risk mitigation in coastal basins with in-line expansion tanks: an integrated sizing approach (MATCAS)” supported by the Italian Ministry of Environment, Land and Sea.
Conflicts of Interest
The authors declare no conflict of interest.
References
- Rasekh, A.; Afshar, A.; Afshar, M.H. Risk-cost optimization of hydraulic structures: Methodology and case study. Water Resour. Manag. 2010, 24, 2833–2851. [Google Scholar] [CrossRef]
- Ganoulis, J. Risk-based floodplain management: A case study from Greece. Int. J. River Basin Manag. 2003, 1, 41–47. [Google Scholar] [CrossRef]
- Tung, Y.; Mays, L.W. Optimal risk-based design of flood levee systems. Water Resour. Res. 1981, 17, 843–852. [Google Scholar] [CrossRef]
- Travis, Q.B.; Mays, L.W. Optimizing retention basin networks. J. Water Resour. Plan. Manag. 2008, 134, 432–439. [Google Scholar] [CrossRef]
- Yazdi, J.; Neyshabouri, S.A.A.S. Optimal design of flood-control multi-reservoir system on a watershed scale. Nat. hazards 2012, 63, 629–646. [Google Scholar] [CrossRef]
- Manfreda, S.; Miglino, D.; Albertini, C. Impact of Flood Control Systems on the Probability Distribution of Floods. Hydrol. Earth Syst. Sci. Discuss. 2021, 2021, 1–20. [Google Scholar]
- Samela, C.; Troy, T.J.; Manfreda, S. Geomorphic classifiers for flood-prone areas delineation for data-scarce environments. Adv. Water Resour. 2017, 102, 13–28. [Google Scholar] [CrossRef]
- Santo, A.; Santangelo, N.; Beneduce, A.; Iovane, F. Pericolosità connessa a processi alluvionali in aree pedemontane: Il caso di Castellamare di Stabia in Penisola Sorrentina. Il Quaternario 2002, 15, 23–37. [Google Scholar]
- Vennari, C.; Parise, M.; Santangelo, N.; Santo, A. A database on flash flood events in Campania, southern Italy, with an evaluation of their spatial and temporal distribution. Nat. Hazards Earth Syst. Sci. 2016, 16, 2485–2500. [Google Scholar] [CrossRef]
- Santo, A.; Santangelo, N.; Di Crescenzo, G.; Scorpio, V.; Falco, M.; Chirico, G.B. Flash flood occurrence and magnitude assessment in an alluvial fan context: The October 2011 event in the Southern Apennines. Nat. Hazards 2015, 78, 417–442. [Google Scholar] [CrossRef]
- Kim, S.; Yoon, B.; Kim, S.; Kim, D. Design procedure for determining optimal length of side-weir in flood control detention basin considering bed roughness coefficient. J. Irrig. Drain. Eng. 2016, 142, 6016011. [Google Scholar] [CrossRef]
- Petheram, C.; Mcmahon, T. Dams, dam costs and damnable cost overruns. J. Hydrol. X 2019, 3, 100026. [Google Scholar] [CrossRef]
- Grimaldi, S.; Nardi, F.; Piscopia, R.; Petroselli, A.; Apollonio, C. Continuous hydrologic modelling for design simulation in small and ungauged basins: A step forward and some tests for its practical use. J. Hydrol. 2021, 595, 125664. [Google Scholar] [CrossRef]
- Naso, S. Novel Approaches for Flood Risk Assessment Using Exposure-Vulnerability Matrices. Ph.D Thesis, Università degli Studi di Palermo, Palermo, Italy, February 2016. [Google Scholar]
- Di Baldassarre, G.; Viglione, A.; Carr, G.; Kuil, L.; Salinas, J.L.; Blöschl, G. Socio-hydrology: Conceptualising human-flood interactions. Hydrol. Earth Syst. Sci. 2013, 17, 3295. [Google Scholar] [CrossRef]
- Samela, C.; Manfreda, S.; De Paola, F.; Maurizio, G.; Sole, A.; Fiorentino, M. DEM-Based Approaches for the Delineation of Flood-Prone Areas in an Ungauged Basin in Africa. J. Hydrol. Eng. 2016, 21, 6015010. [Google Scholar] [CrossRef]
- Albertini, C.; Miglino, D.; Iacobellis, V.; De Paola, F.; Manfreda, S. Delineation of flood-prone areas in cliffed coastal regions through a procedure based on the geomorphic flood index. J. Flood Risk Manag. 2021, 15, e12766. [Google Scholar] [CrossRef]
- De Luca, D.L.; Petroselli, A. STORAGE (STOchastic RAinfall GEnerator): A user-friendly software for generating long and high-resolution rainfall time series. Hydrology 2021, 8, 76. [Google Scholar] [CrossRef]
Publisher’s Note: MDPI stays neutral with regard to jurisdictional claims in published maps and institutional affiliations. |
© 2022 by the authors. Licensee MDPI, Basel, Switzerland. This article is an open access article distributed under the terms and conditions of the Creative Commons Attribution (CC BY) license (https://creativecommons.org/licenses/by/4.0/).

