
Pau Case Study: From a Wastewater Treatment Plant to a Biofactory †

Abstract
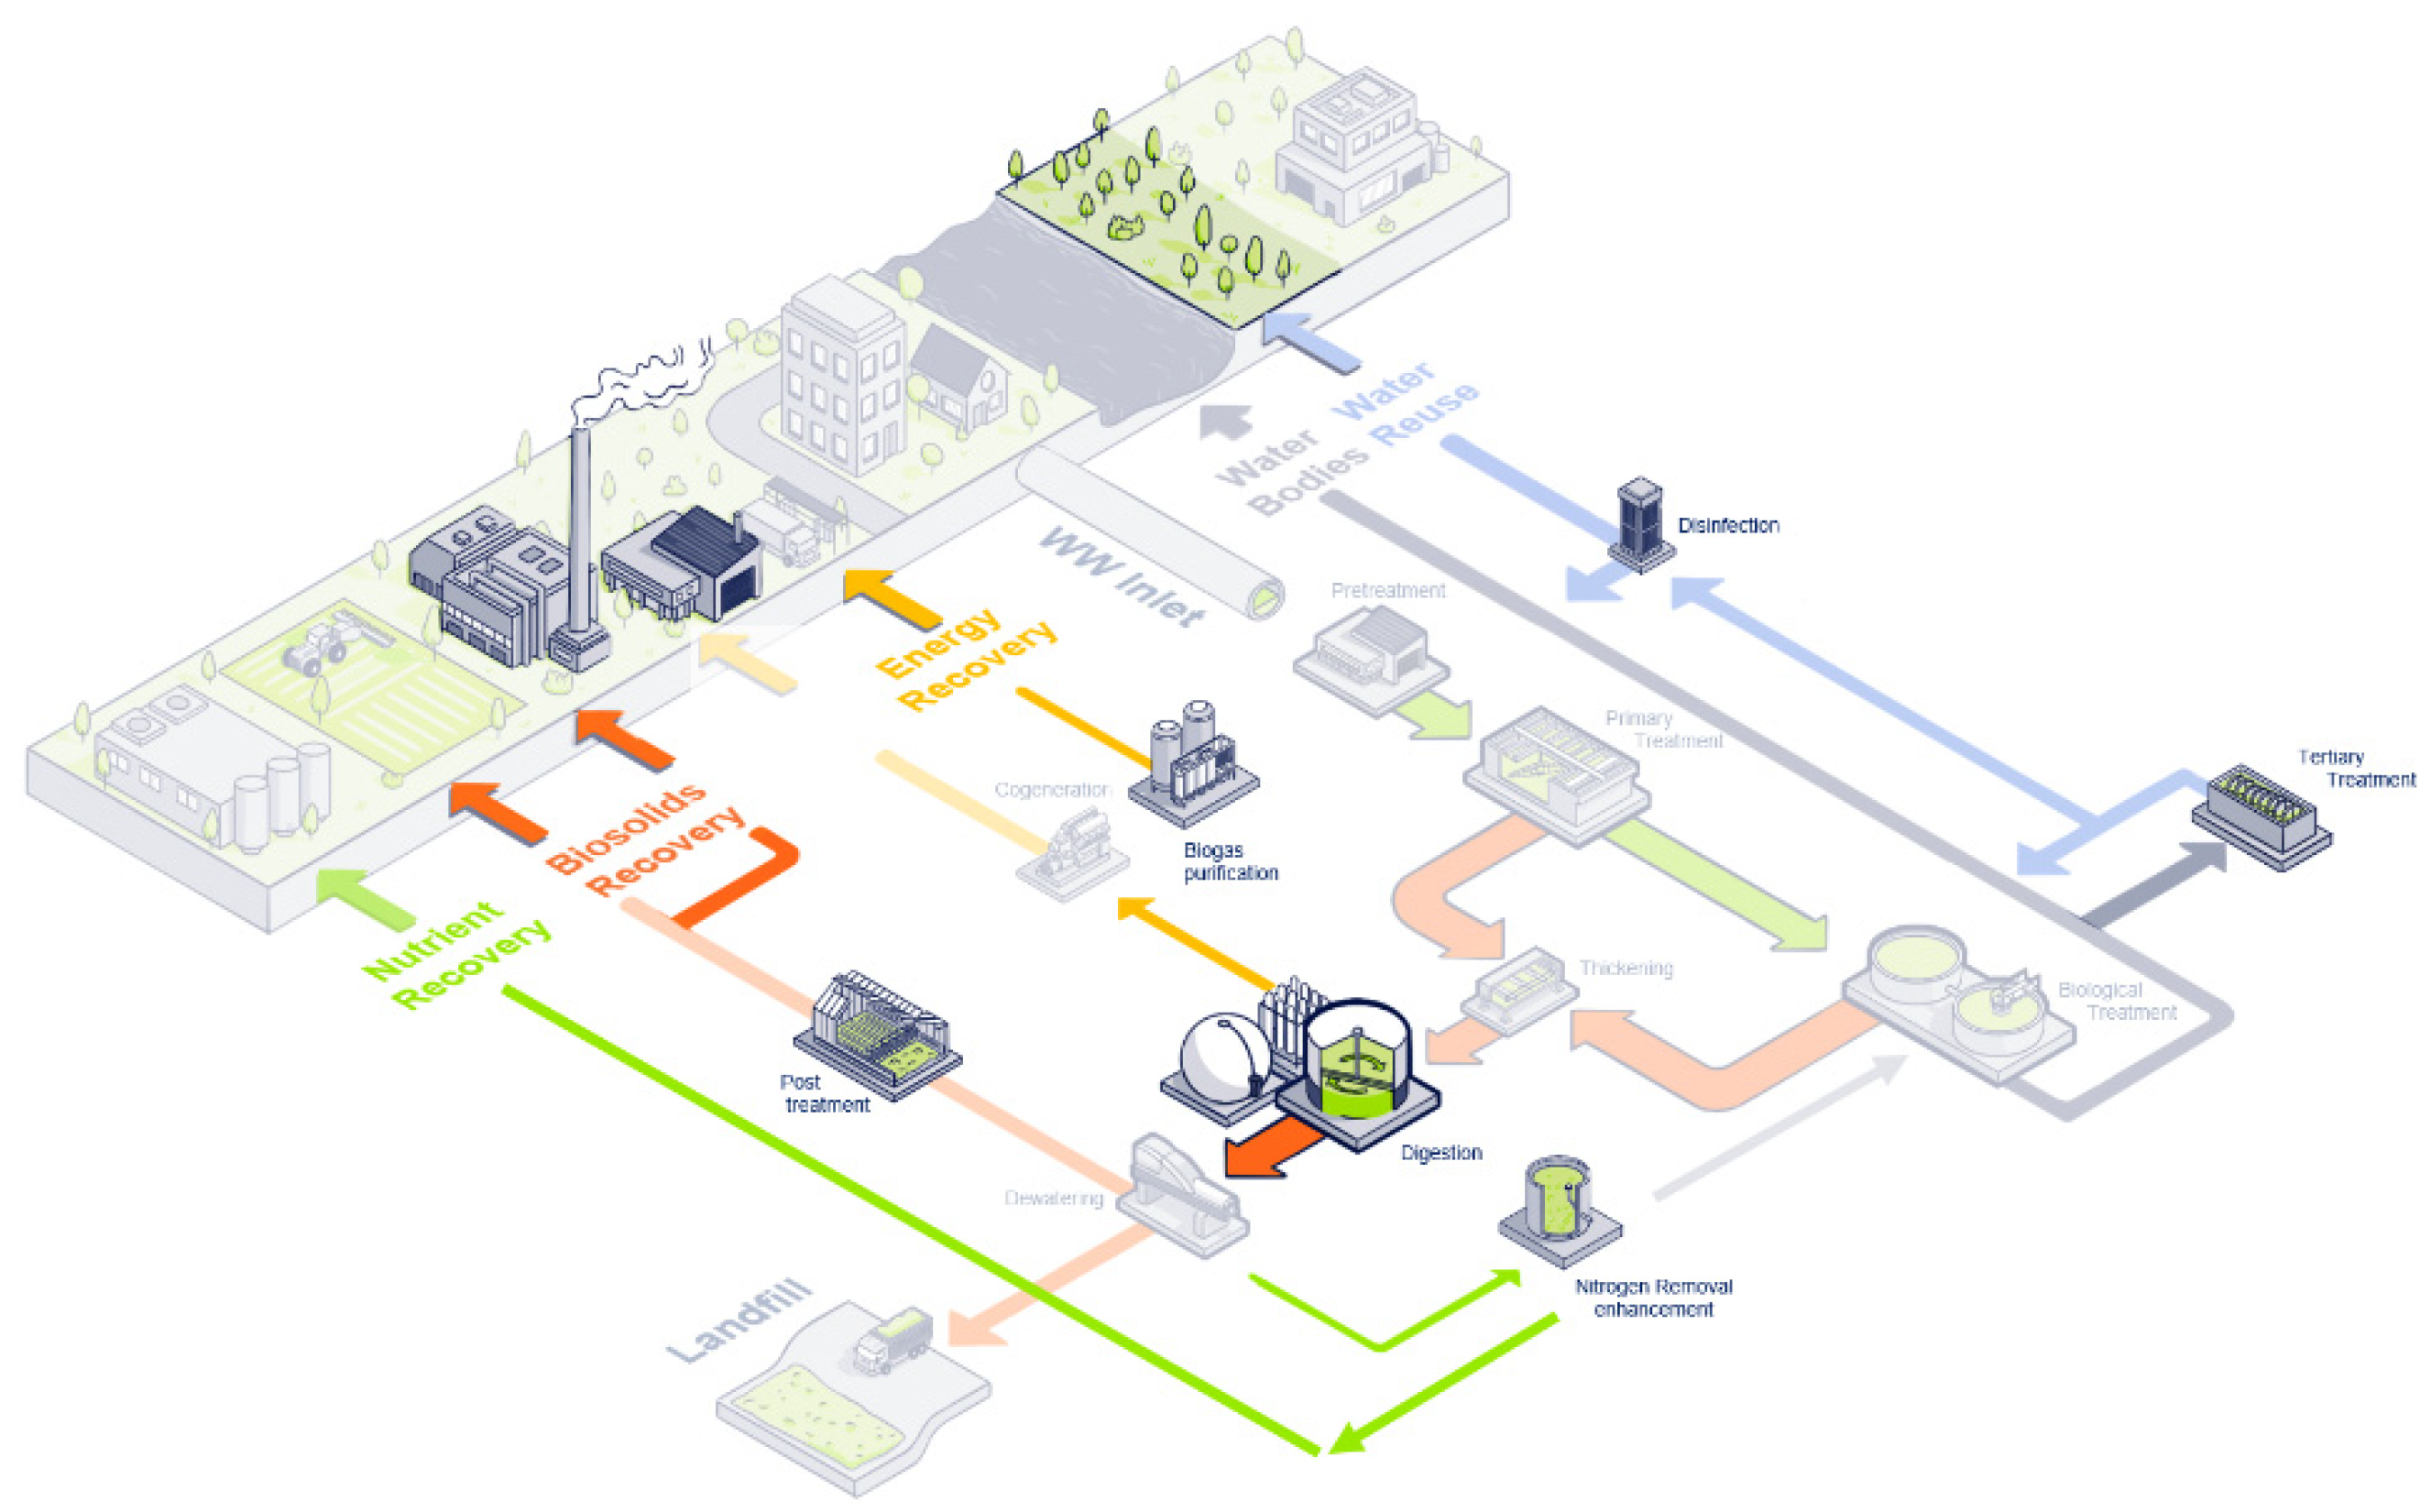
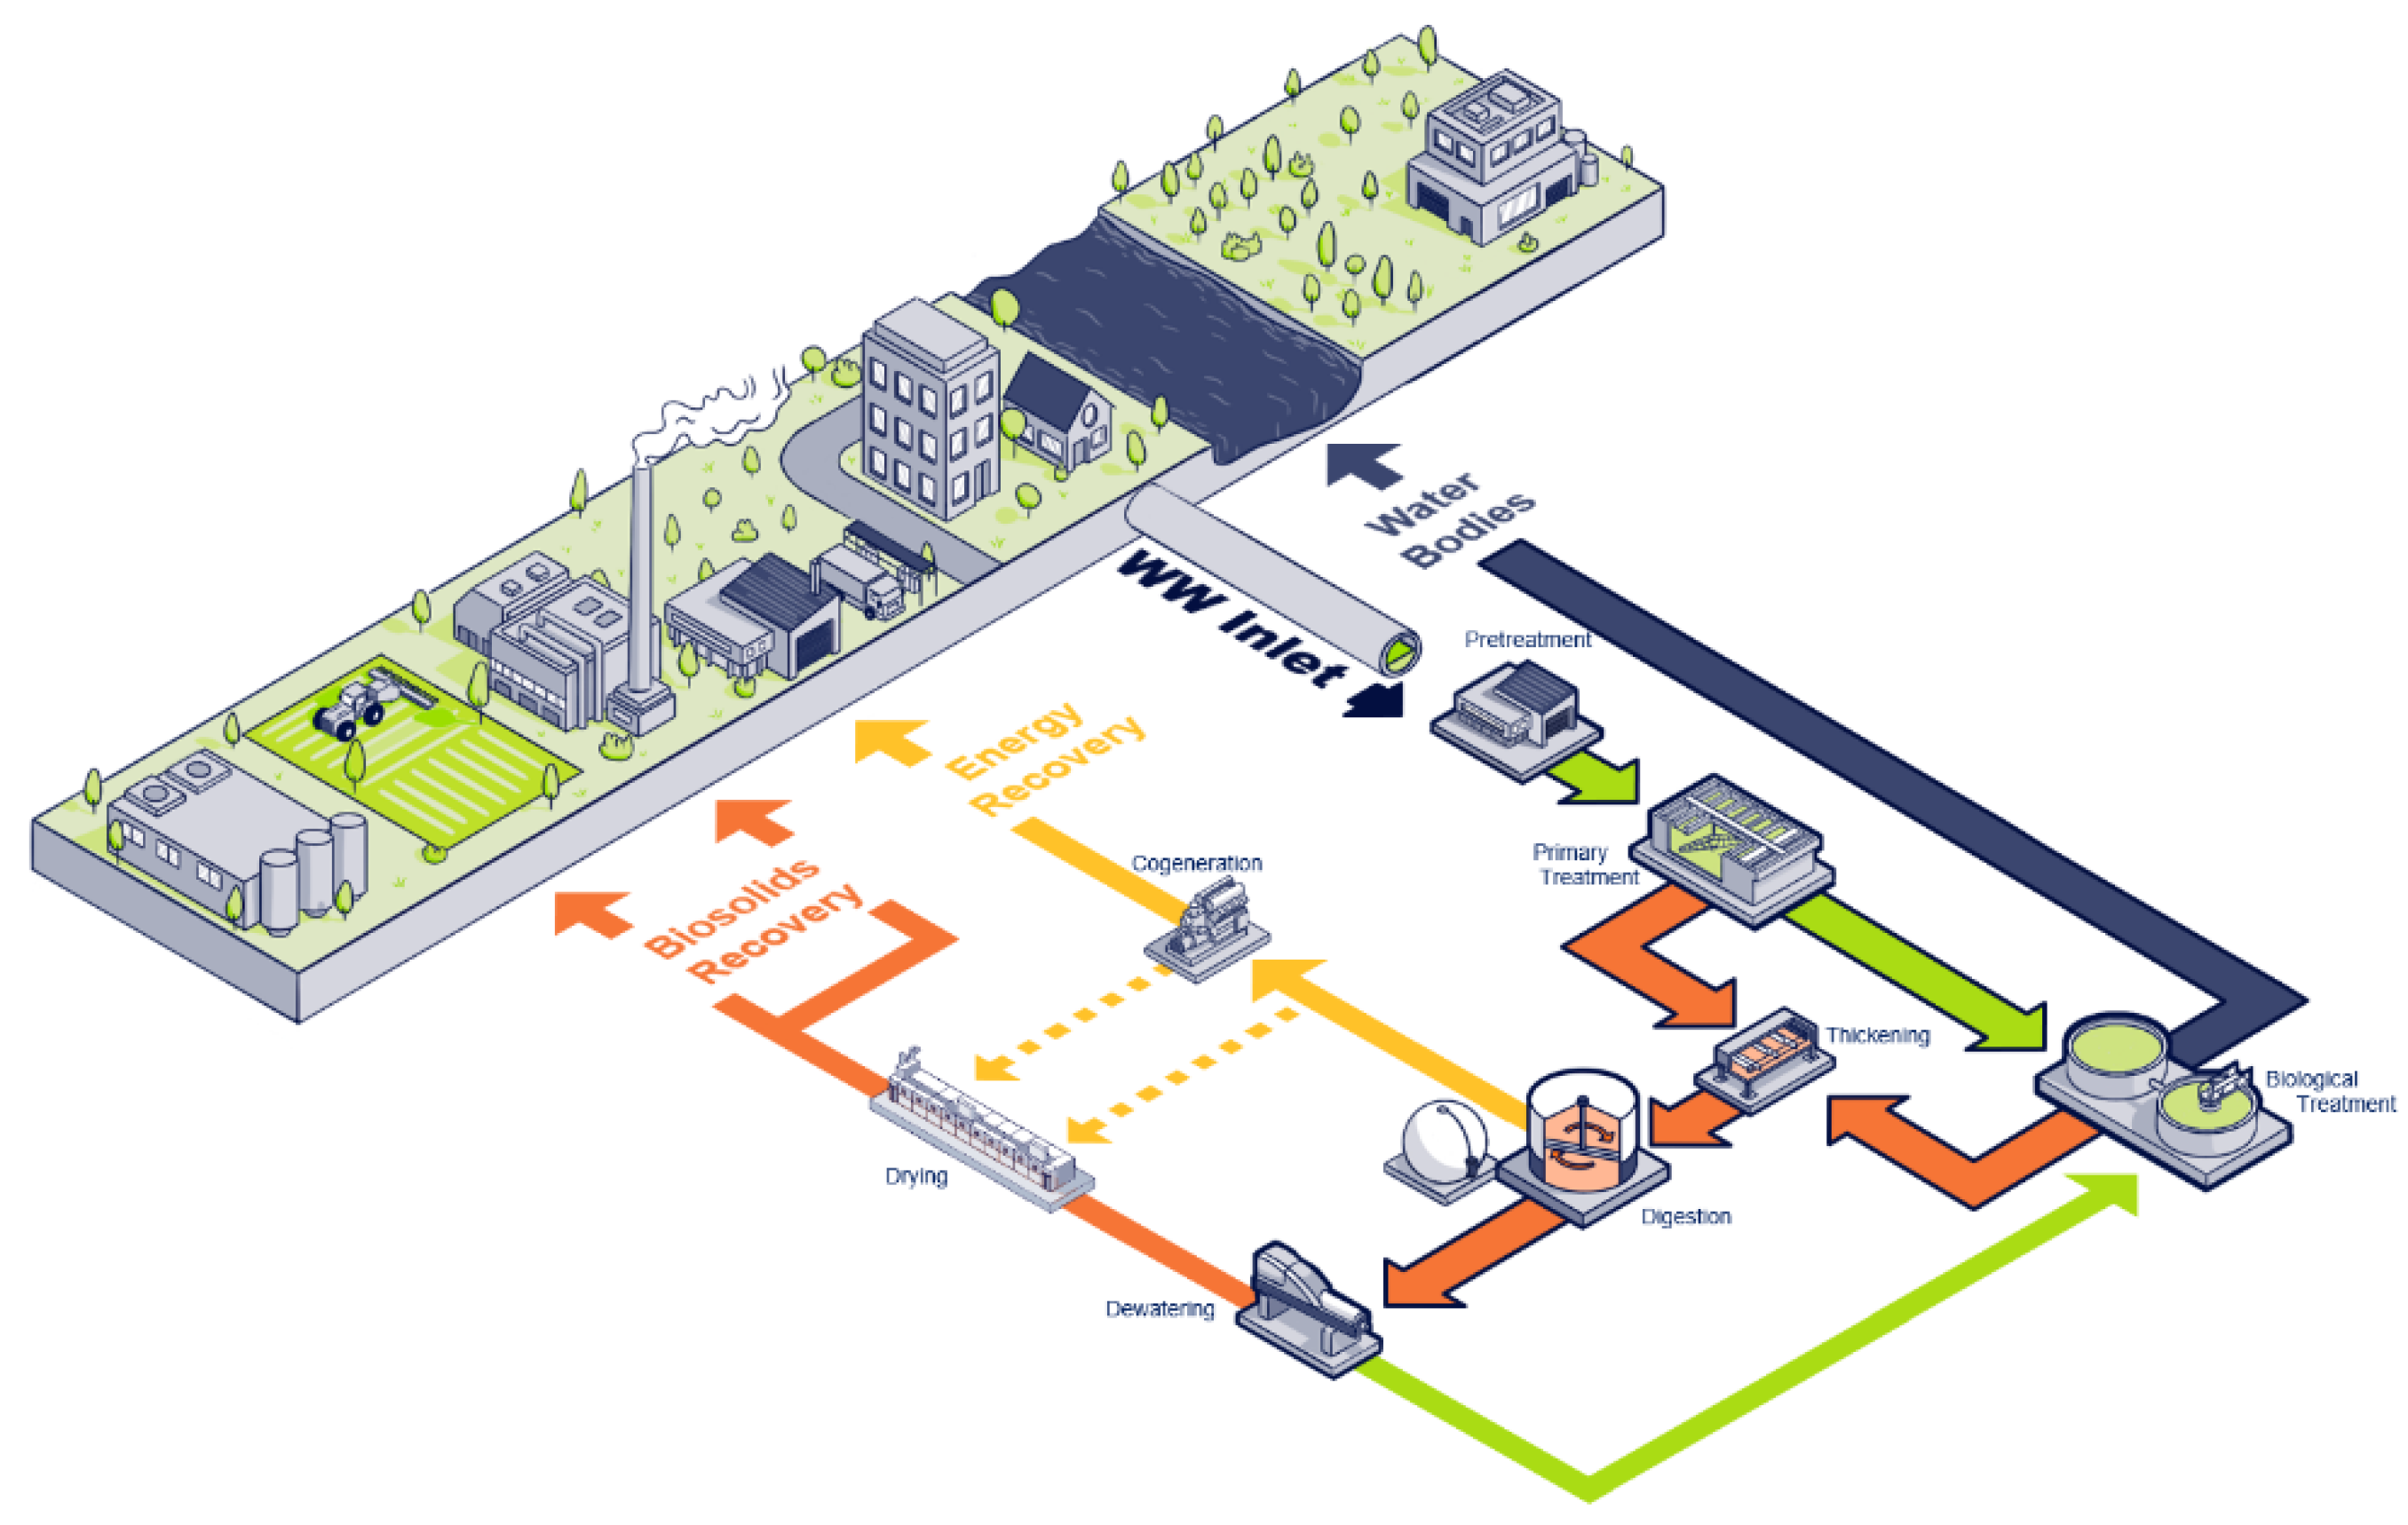
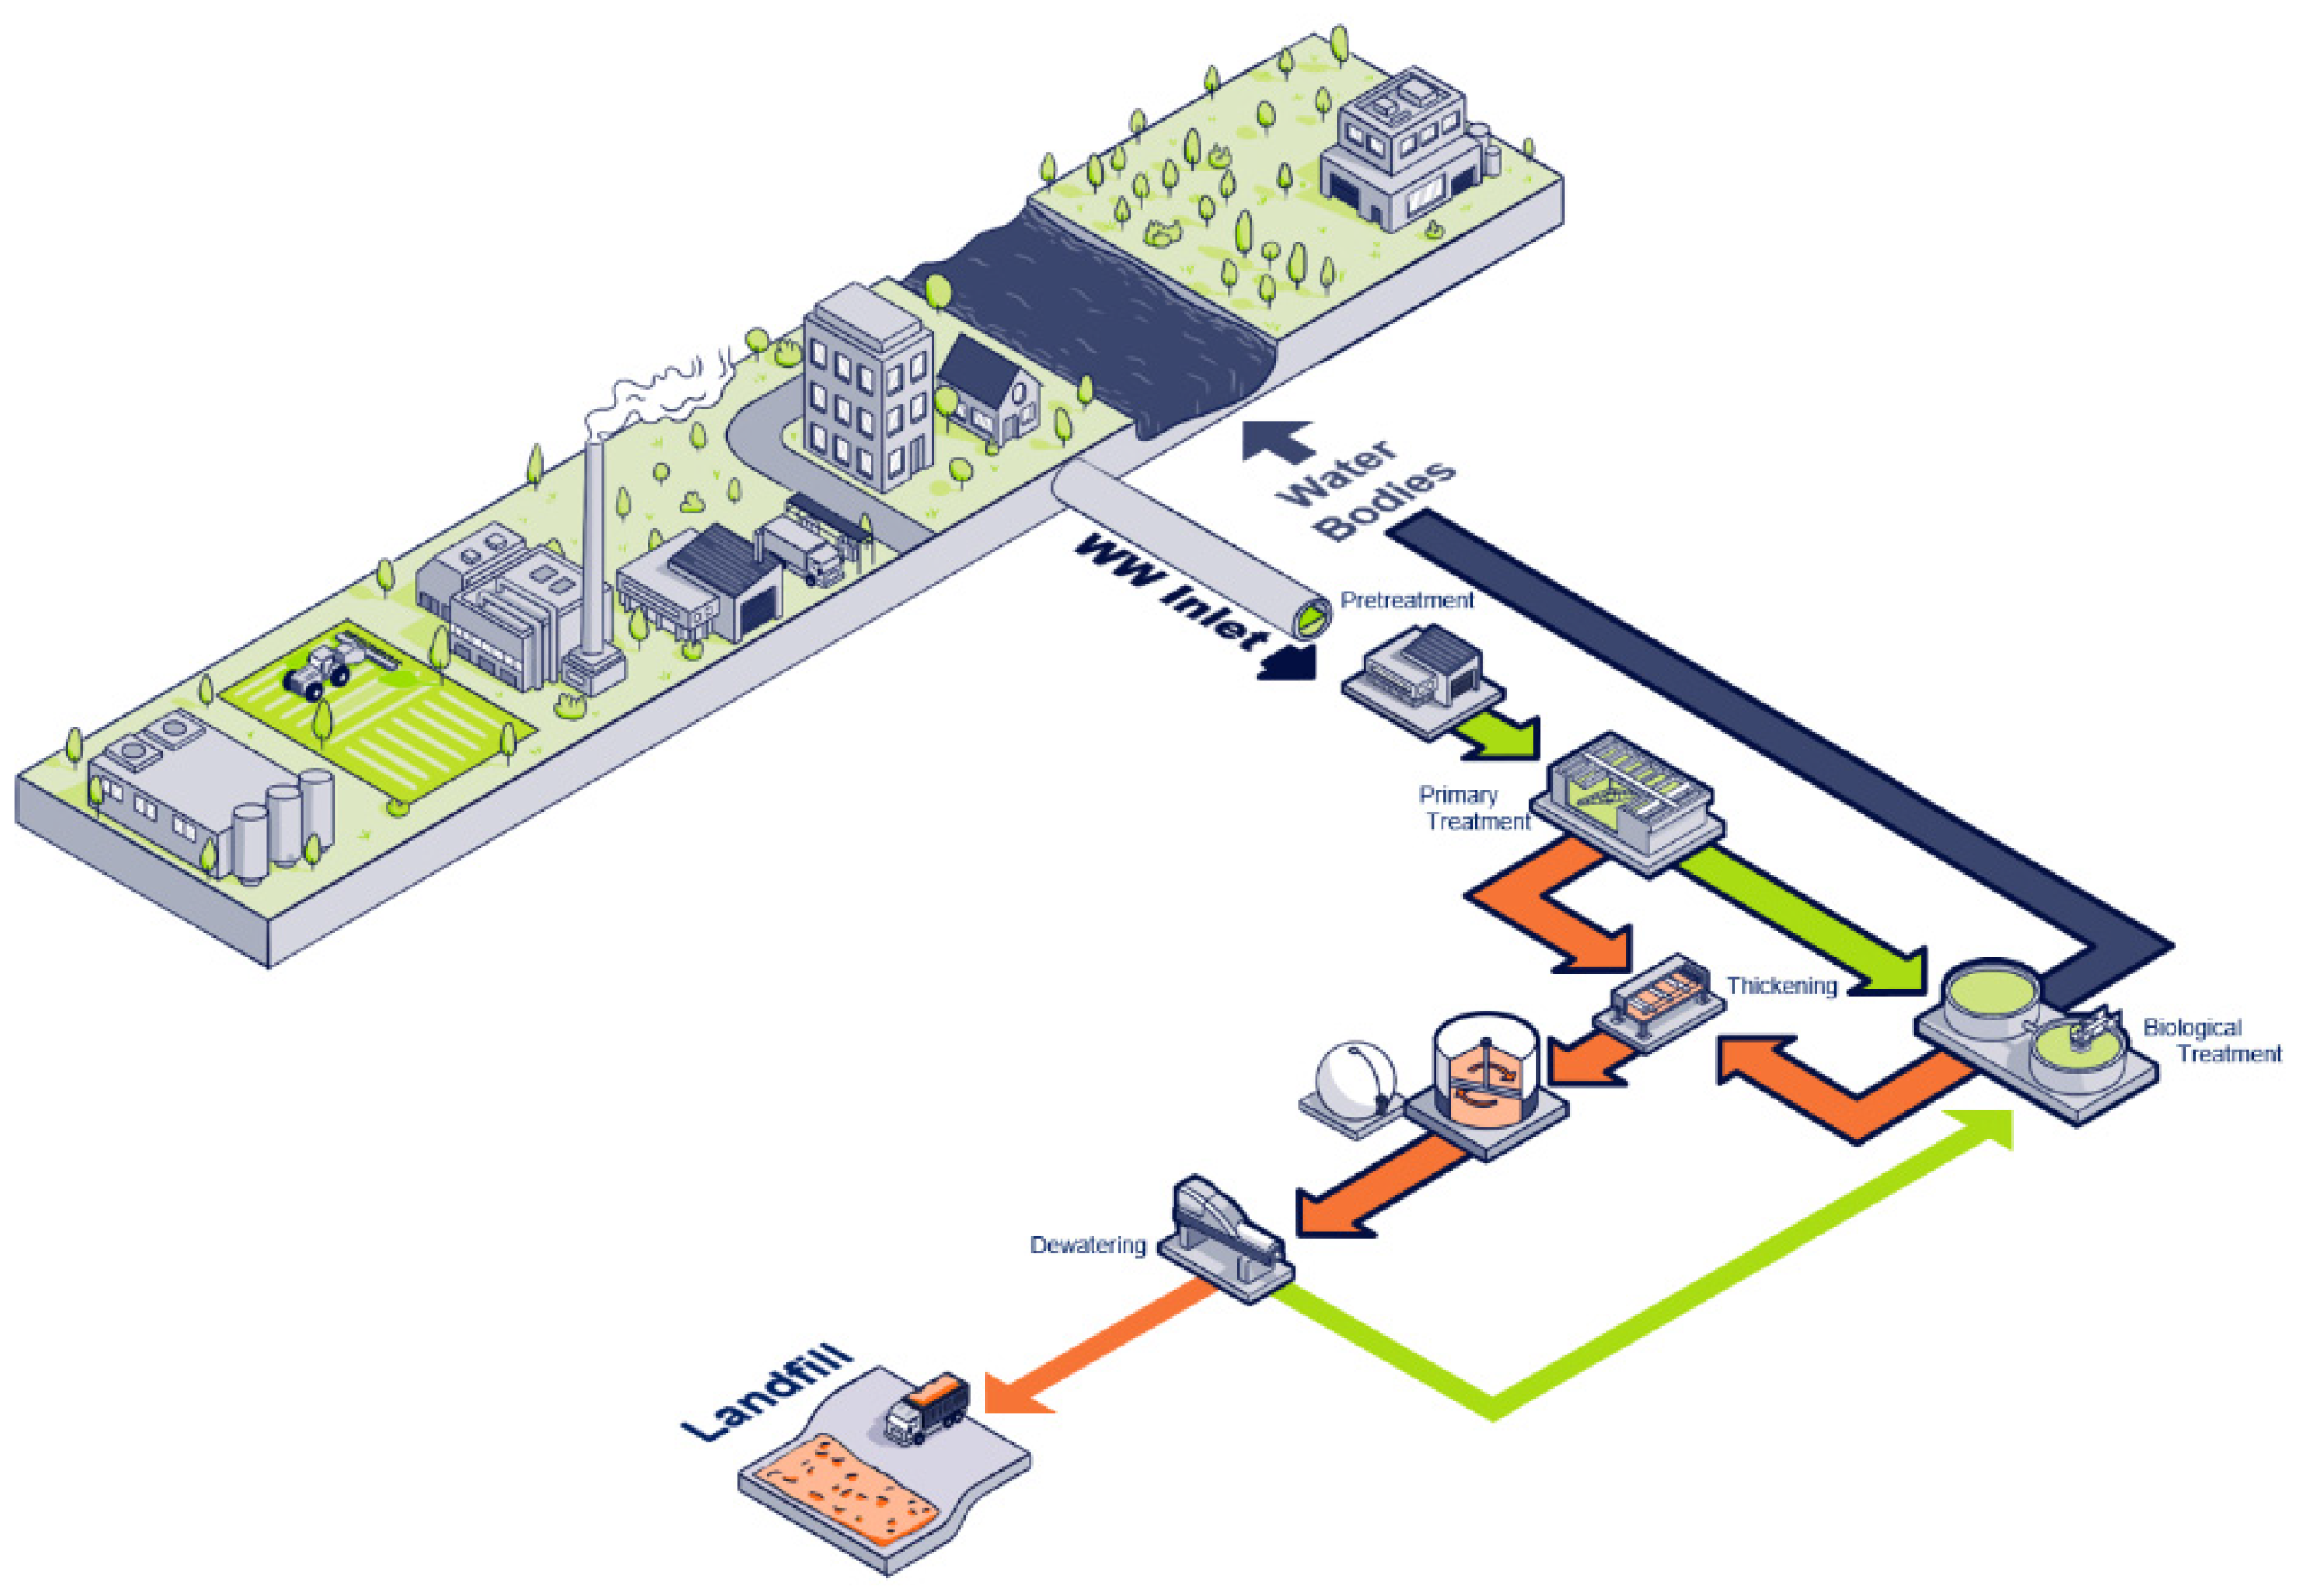
:1. Introduction and Biofactory Concept
- Wastewater treatment
- Water reuse
- Energy recovery
- Biosolid recovery
- Nutrient recovery
2. The Pau Biofactory
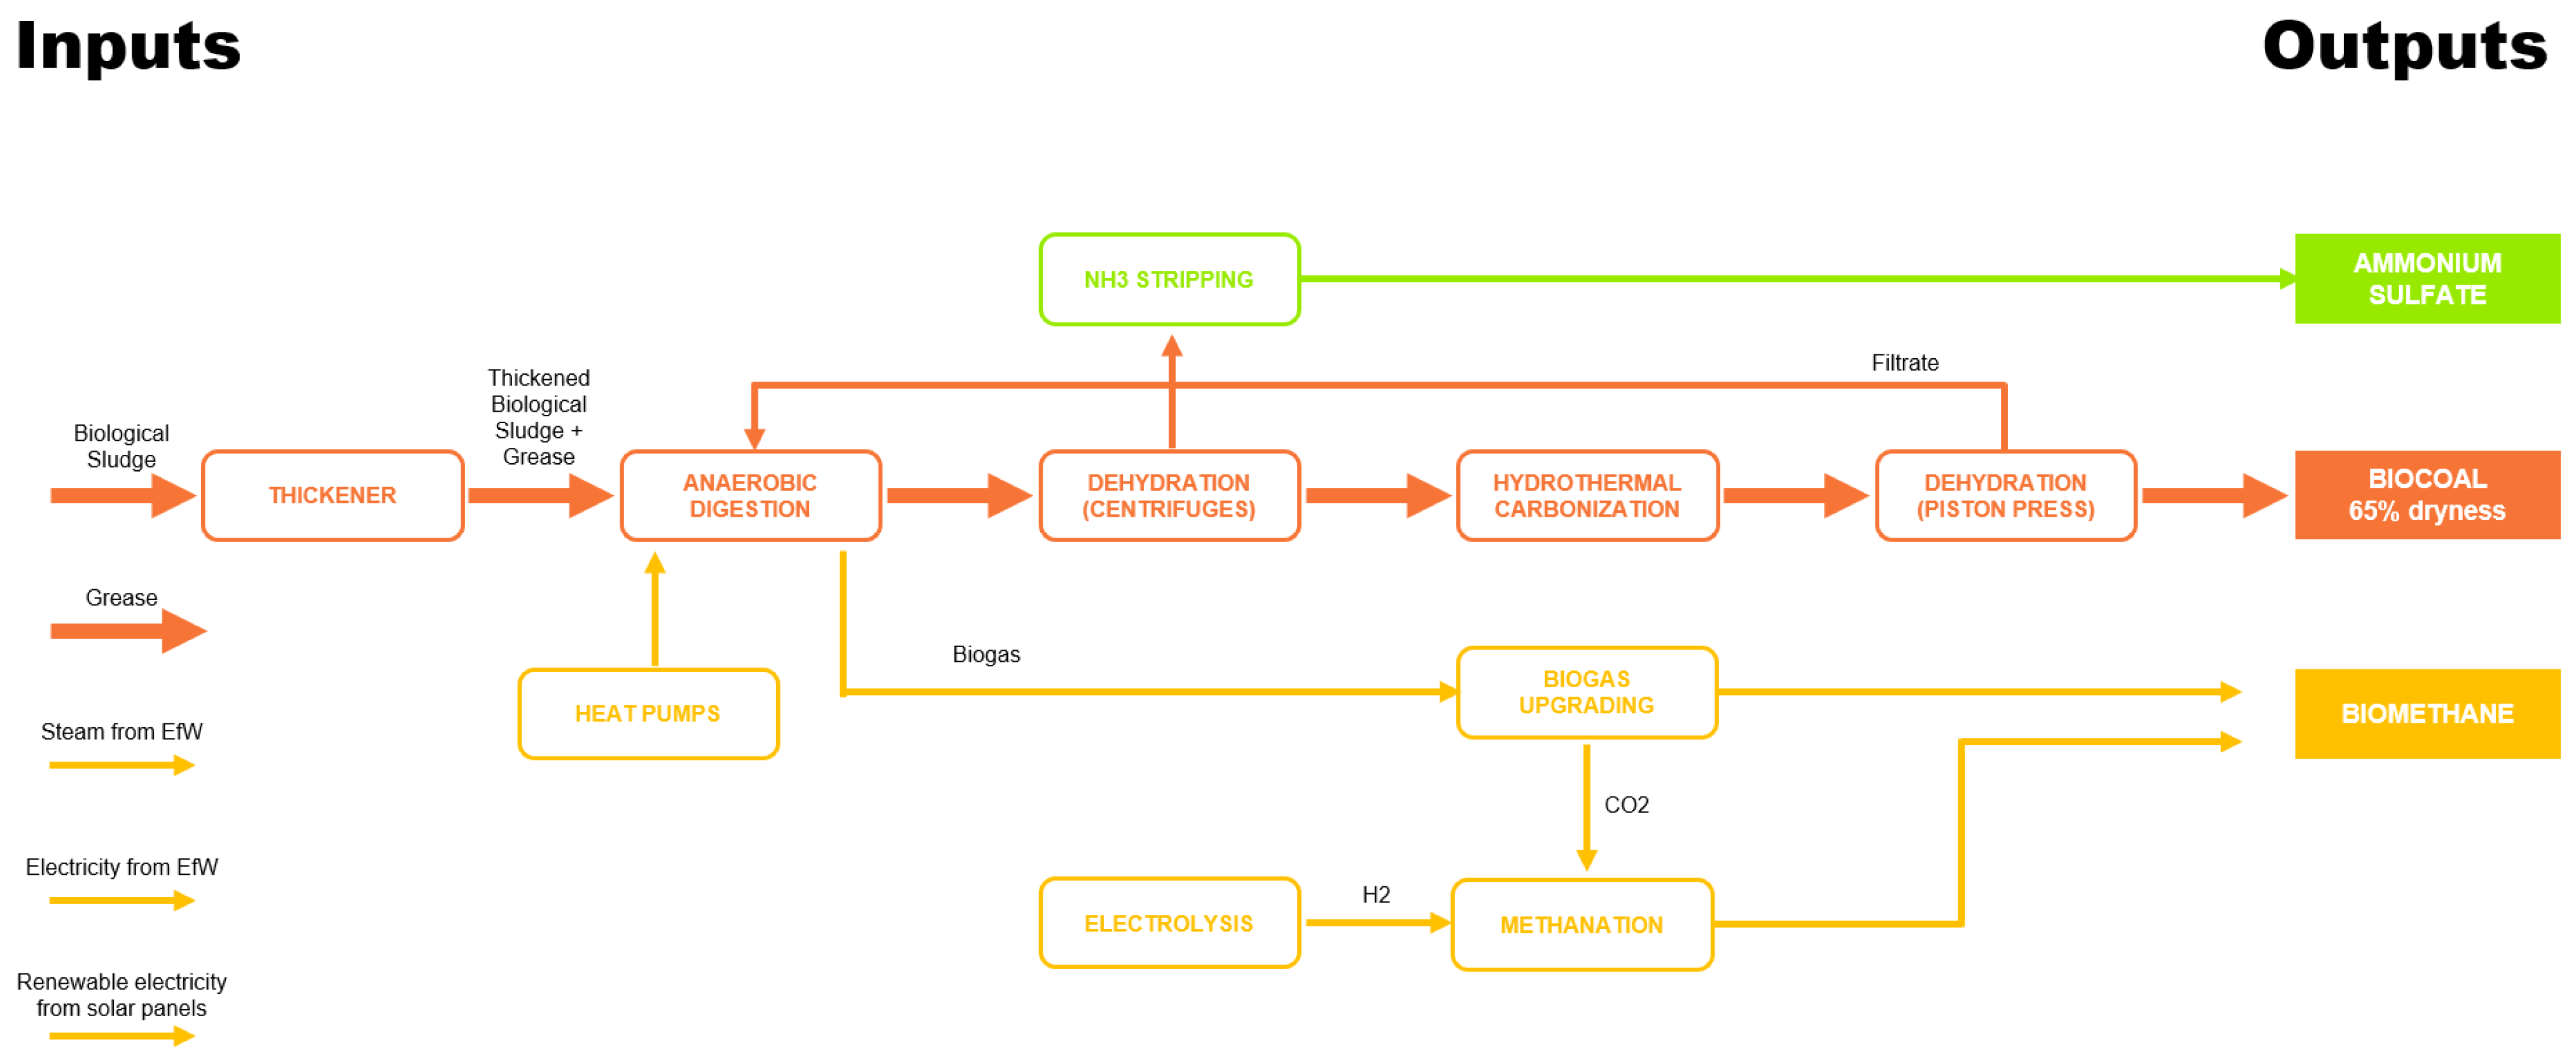
2.1. Energy Recovery
- Anaerobic digestion (mesophilic) of greases and sludge to convert part of the sludge into biogas;
- This biogas is then cleaned (removal of H2S, water, siloxanes, etc.) and CO2 is removed (thanks to membranes) to produce a biomethane with a CH4 content above 98% suitable for grid injection;
- A heat pump is used to supply heat to the digester.
- Solar panels are installed just on the neighboring land plot;
- Electricity and heat (steam) arrive from the nearby energy-from-waste facility to supply heat to the sludge conditioning system and nutrient recovery system.
2.2. Biosolid Prodution and Recovery
- Solubilisation of part of the sludge volatile matter. This solubilized organic matter is then sent to the anaerobic digester to produce additional biogas, improving even further the plant energy recovery.
- The remaining sludge (non-solubilized volatile matter and mineral matter) is dehydrated in a piston press to reach a final dryness above 65%.
- Agriculture (through composting): no pathogens, and no remaining polymers.
- Energy recovery: given its low moisture content, the sludge has a physical shape (behaviour similar to a soil) and a lower heating value (above 7 MJ/kg) close to the LHV of residual municipal waste (usually between 9 and 10 MJ/kg in Europe (like in [4]), which eases its use in an energy-from-waste facility.
2.3. Nutrient Recovery
3. Expected Performance
3.1. Energy Recovery
3.2. Biosolid Prodution and Recovery
- Anaerobic digestion, which converts part of the volatile matter into biogas;
- Hydrothermal carbonization, which will further impact the volatile matter by converting part of it into off-gas (minor part) and by solubilizing part of it in the liquid phase. This solubilized volatile matter will then be partially converted to biogas in the digester.
- Thanks to the piston press, the final dryness of the sludge is about 65%.
3.3. Nutrient Recovery
4. Conclusions
Author Contributions
Funding
Institutional Review Board Statement
Informed Consent Statement
Acknowledgments
Conflicts of Interest
References
- Zhang, X.; Liu, Y.u. Circular economy is game-changing municipal wastewater treatment technology towards energy and carbon neutrality. Chem. Eng. J. 2022, 429, 132114. [Google Scholar] [CrossRef]
- Gao, H.; Scherson, Y.D.; Wells, G.F. Towards energy neutral wastewater treatment: Methodology and state of the art. Environ. Sci. Processes Impacts 2014, 16, 1223–1246. [Google Scholar]
- Neczaj, E.; Grosser, A. Circular economy in wastewater treatment plant–challenges and barriers. Multidiscip. Digit. Publ. Inst. Proc. 2018, 2, 614. [Google Scholar]
- Burnley, S.; Phillips, R.; Coleman, T.; Rampling, T. Energy Implications of the Thermal Recovery of Biodegradable Municipal Waste Materials in the United Kingdom. Waste Manag. 2011, 31, 1949–1959. [Google Scholar] [CrossRef] [PubMed]
- ADEME. Séchage Thermique Des Boues Urbaines et Industrielles—Etat de l’art; ADEME: Paris, France, 2004. [Google Scholar]
- Swedish Gas Centre. Basic Data on Biogas; Swedish Gas Centre: Stockholm, Sweden, 2012. [Google Scholar]
- ADEME. Documentation Des Facteurs d’émissions de La Base Carbone ®; ADEME: Paris, France, 2020. [Google Scholar]
- Kool, A.; Marinussen, M.; Blonk, H. LCI Data for the Calculation Tool Feedprint for Greenhouse Gas Emissions of Feed Production and Utilization; Blonk Consultants: Gouda, The Netherlands, 2012. [Google Scholar]


| Key Performance Indicator | Pau WWTP (Expected) | Standard AD | Standard AD with Sludge Drying | |
|---|---|---|---|---|
| Raw biogas production without grease | Nm3/h/1000 PE | 1 | 0.8 | 0.8 |
| Biomethane injection without methanation | Nm3/h/1000 PE | 0.7 | 0.45 | 0 |
| Biomethane injection with methanation | Nm3/h/1000 PE | 1.2 | ||
| Avoided Greenhouse Gas emissions thanks to biomethane * | kgCO2/yr/PE | 23 | 9 | 0 |
| tCO2/yr for 150,000 PE | 3500 | 1300 | 0 |
| Key Performance Indicator | Pau WWTP (Expected) | No AD, No Drying | Standard AD with Sludge Drying | |
|---|---|---|---|---|
| Dehydrated sludge production | t/yr/1000 PE | 52 | 98 | 54 |
| Final sludge/residue production | t/yr/1000 PE | 16 | 98 | 15.5 |
| t/yr for 150,000 PE | 2400 | 14,700 | 2300 | |
| Final sludge dryness | % (as received) | 65% | 23% | 90% |
| Key Performance Indicator | Pau WWTP (Expected) | Standard Plant without N Recovery | |
|---|---|---|---|
| Recovered nitrogen | kgN/yr/1000 PE | 276 | 0 |
| Avoided GHG emissions thanks to nitrogen recovery | kgCO2/yr/PE | 1.5 | 0 |
| tCO2/yr for 150,000 PE | 234 | 0 |
Disclaimer/Publisher’s Note: The statements, opinions and data contained in all publications are solely those of the individual author(s) and contributor(s) and not of MDPI and/or the editor(s). MDPI and/or the editor(s) disclaim responsibility for any injury to people or property resulting from any ideas, methods, instructions or products referred to in the content. |
© 2023 by the authors. Licensee MDPI, Basel, Switzerland. This article is an open access article distributed under the terms and conditions of the Creative Commons Attribution (CC BY) license (https://creativecommons.org/licenses/by/4.0/).
Share and Cite
Lebonnois, D.; Judenne, E.; Perroy, L.; Vanden Bossche, H.; Grau, G. Pau Case Study: From a Wastewater Treatment Plant to a Biofactory. Environ. Sci. Proc. 2022, 21, 89. https://doi.org/10.3390/environsciproc2022021089
Lebonnois D, Judenne E, Perroy L, Vanden Bossche H, Grau G. Pau Case Study: From a Wastewater Treatment Plant to a Biofactory. Environmental Sciences Proceedings. 2022; 21(1):89. https://doi.org/10.3390/environsciproc2022021089
Chicago/Turabian StyleLebonnois, Damien, Eric Judenne, Loïc Perroy, Hugues Vanden Bossche, and Guillem Grau. 2022. "Pau Case Study: From a Wastewater Treatment Plant to a Biofactory" Environmental Sciences Proceedings 21, no. 1: 89. https://doi.org/10.3390/environsciproc2022021089
APA StyleLebonnois, D., Judenne, E., Perroy, L., Vanden Bossche, H., & Grau, G. (2022). Pau Case Study: From a Wastewater Treatment Plant to a Biofactory. Environmental Sciences Proceedings, 21(1), 89. https://doi.org/10.3390/environsciproc2022021089