Abstract
The phenomenon of wave breaking dominates the hydrodynamics of the surf zone. Therefore, numerical modelling of shallow water phenomena requires a proper reproduction of the wave breaking mechanism. In this study, we analyze the ability of two open-source Boussinesq-type models, Celeris and FUNWAVE-TVD (Total Variation Diminishing version), to correctly reproduce wave breaking. The main aim is to obtain aware tools for numerical modelling of surf zone hydrodynamics. The results are compared with physical model tests and Computational Fluid Dynamics (CFD) numerical modelling.
1. Introduction
In the last decades, the coastal engineering community has shown an increasing interest in Boussinesq-type models (BTMs). These numerical models represent an optimal trade-off between the ability to reproduce the main wave phenomena and a moderate computational cost [1].
However, most coastal engineering applications relate strictly to the wave breaking mechanism, which has always been a challenging aspect for BTMs. The early Boussinesq models did not directly reproduce the breaking phenomenon since they were derived assuming irrotational flow; thus, the breaking was externally added by means of the surface roller model [2] and the eddy viscosity model [3]. Subsequently, the “vorticity model”, which does not require an additional breaking closure, was derived by [4]. A further technique to deal with wave breaking has been developed by [5], namely, the hybrid approach, which combines Boussinesq equations and Non-Linear Shallow Water equations (NLSW) to model the breaking mechanism via shock capturing.
This study analyses the application of BTMs in shallow water phenomena comparing two open-source numerical suites, Celeris and FUNWAVE-TVD. These models reproduce wave breaking by means of different approaches: FUNWAVE-TVD adopts either the eddy viscosity model or the shock capturing technique, whereas Celeris relies on numerical dissipation to reproduce the physical dissipation associated with the breaking mechanism.
This work aims to investigate the ability of BTMs to correctly reproduce the wave breaking mechanism and wave phenomena related to it by analyzing the evolution of regular and irregular waves within the surf zone. Numerical results have been compared with numerical outcomes carried out via CFD modelling and empirical data from a series of physical model tests.
2. Boussinesq-Type Models
This study compares the performances of two different Boussinesq-type models: Celeris [6] and FUNWAVE-TVD [7]. They differ in the treatment of frequency dispersion properties, of non-linear properties and in the handling of the wave breaking mechanism. Celeris, based on the extended Boussinesq equations of [8], enhances the frequency dispersion properties by adding a linear operator to the momentum equation generating extra dispersive contribution terms. On the other hand, FUNWAVE-TVD follows the work of [9], which improved dispersive properties using a reference velocity (i.e., the velocity at a reference level) to derive the Boussinesq equations instead of the depth-averaged velocity used by [10].
The governing equations of [8] and [9] differ in the non-linear properties as well; thus, Celeris is a weakly non-linear model and FUNWAVE-TVD is fully non-linear. A further fundamental difference between these models lies in the modelling of wave breaking, which has always been a critical question for BTMs. Among the different breaking models for BTMs, FUNWAVE-TVD adopts two different modules: the hybrid approach [5] and the eddy viscosity scheme [3]. The former approach takes advantage of the shock-capturing scheme in TVD (Total Variation Diminishing), switching the fully non-linear Boussinesq equations to NSWE where the Froude number exceeds a certain threshold (i.e., 0.8) and successfully uses the ability of NSWE with a TVD scheme to reproduce moving hydraulic jumps. The eddy viscosity model, adapted for a TVD scheme, requires a criterion that establishes the onset and cessation of breaking. The criterion of [3] is adopted. On the other hand, Celeris does not use an explicit method, but handles the energy dissipation due to breaking via numerical dissipation.
3. Numerical Experiments
To compare the performance of Celeris and FUNWAVE-TVD, numerical experimentation consists of two phases: (i) analysis of the incipient breaking of regular waves on a planar bottom; (ii) investigation of the evolution of irregular waves on a complex bottom.
3.1. Incipient Breaking on a Plane Beach
The first phase of this study analyses the ability of the two BTMs to accurately reproduce the incipient breaking of periodic waves on a plane beach. Various empirical equations in the literature (e.g. [11,12,13]) describe a relationship between the incipient breaking, γb, and the wave steepness, as well as the beach slope. Specifically, the incipient breaking decreases as the beach slope becomes milder, and it increases as the wave steepness decreases. The main objective of this phase is to test the ability of Celeris and FUNWAVE–TVD to reproduce this behavior. Six different beach slopes, m, and three different wave steepness, s0, are tested, as reported in Table 1. The wave period is kept constant, equal to 8 s.

Table 1.
Beach slopes and wave steepness investigated, along with the grid size adopted for each beach slope.
The numerical experiments are conducted in a 2D condition; namely, a numerical flume has been modelled. The grid sizes of each type of beach are summarized in Table 1; the number of grid points for wave length increases from 50 to 200 as the steepness of the beach increases. The numerical flume reproduces a flat bottom of one wave length to ensure the proper development of periodic waves. The plane beach rises up to the shoreline and continues up to +3.0 m above the still water level, thus the onshore boundary condition does not influence the result. Periodic waves are generated at a relative water depth of 0.3. The lateral boundaries are solid walls. With regard to Celeris, a time step Δt = 0.1 s is used. Among the two breaking closures in FUNWAVE-TVD, only the eddy viscosity model is investigated in this first phase; the value of the coefficients used for the criterion of [3] are consistent with [14].
The incipient breaking index is obtained by the intersection of the shoaling and breaking curve trends. The numerical outcomes are shown in Figure 1, and are compared with the breaking index of [15]. As can be observed, both BTMs reproduce the decreasing trend of the breaking index as beach slope decreases. However, for milder slopes, the numerical breaking index is lower than that of [15]. Furthermore, Figure 1b shows that Celeris provides unrealistic results for steeper slope; the breaking index exceeds the expected value of the order of O(1) by a great deal. As concerns the relationship with the wave steepness, the BTMs do not correctly reproduce the expected behavior, with the exception of FUNWAVE-TVD’s results for m = 0.1.
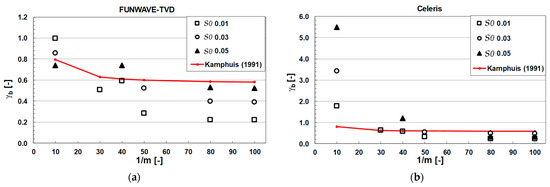
Figure 1.
Numerical incipient breaking index, for different beach slopes and wave steepness investigated compared with the incipient breaking index of [15]: (a) results produced via FUNWAVE-TVD; (b) results produced via Celeris.
The unrealistic results of Celeris suggest that the model needs close analysis. As mentioned in Section 2, Celeris adopts a numerical dissipation to reproduce the energy dissipation due to wave breaking; thus, it is highly grid sensitive. However, to the best of the authors’ knowledge, there are no studies that address this issue. The strong dependence on the grid can be seen in Figure 2a, which illustrates that as the grid size increases and as the breaking point moves seaward, the breaking wave height decreases. Thus, for each beach slope and wave steepness, the optimal grid size has been determined so that the numerical incipient breaking index matches the mean value of the breaking indexes provided by [11,12,13,15]. The analysis is carried out for three different wave periods, namely 5 s, 8 s and 12 s. The analyzed beach slopes and wave steepness are listed in Table 1. A relationship has been established between the grid size Δx to wave height in deep water H0 ratio and the beach slope to the wave steepness ratio (which is similar to the surf similarity parameter), Figure 2b, that reads:
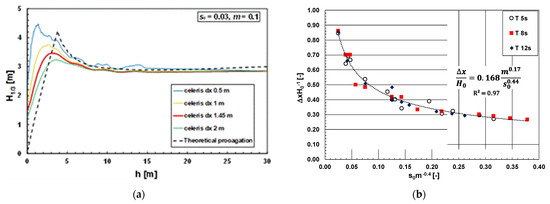
Figure 2.
(a) Comparison between theoretical and numerical wave propagation with different grid sizes; (b) correlation between the grid size to deep water height and wave steepness and beach slope to obtain the optimal index breaking.
3.2. Wave Breaking of Irregular Waves
The second phase deals with the wave breaking of irregular waves. The numerical results are compared with experimental data produced at the University of Naples Federico II. In addition, a comparison has also been made with CFD numerical results. The CFD experiments were carried out via multi-physics solver FLOW-3D [16], a nu-merical model based on Reynolds Averaged Navier-Stokes (RANS) equations com-bined with the Volume of Fluid (VOF) method to track the location of the fluid surfaces. It is also recently employed, with satisfactory results, in several wave propagation e and wave-structure interaction problems [17,18,19].
This phase analyzes the evolution of irregular waves on a complex bottom, the foreshore of the Malecon de l’Havana, Cuba, investigated during the experimental work of [18]. Specifically, the evolution of wave spectra is examined in order to investigate both the wave breaking mechanism and wave phenomena related to it, such as the generation of infragravity waves (IG waves).
The numerical experiments are performed in a 2D numerical flume. It reproduces a flat bottom that allows the proper development of waves, followed by the foreshore, characterized by stretches with different slopes. Further information is given in [20] and omitted here for brevity. The grid dimension is Δx = 1 m. The lateral boundaries are solid walls, and on the onshore boundary, a sponge layer is applied at the end of the beach. Mean JONSWAP spectra have been run. With regard to Celeris, a time step t = 0.008 s is used. In FUNWAVE-TVD, both the eddy viscosity model and the hybrid approach are investigated; the value of the coefficients used for the criterion of [3] are consistent with [14]. Among the wave characteristics investigated, this study shows a peculiar result.
Figure 3 compares the wave spectra within the surf zone. The wave spectrum of Celeris (Figure 3c) is characterized by a high amount of energy at the peak and higher frequencies, suggesting a missed breaking event, as confirmed by the error of spectral moment m0 that is higher than 100% (Figure 4). According to the authors, Celeris did not reproduce the breaking due to the steep slope of the bathymetry (see Figure 2b, where the steeper slope provides unrealistic results). As for FUNWAVE-TVD, there is no appreciable difference between the two breaking closures adopted by the model. Finally, neither BTM is able to reproduce the generation of low frequency components. On the other hand, the wave spectrum produced with the CFD model is quite close to that measured in the laboratory, as well as for the low frequencies of the spectrum (Figure 4). It is worth noting that no grid sensitivity analysis has been carried out in this phase. Therefore, further investigations are required.
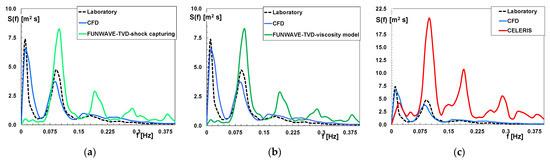
Figure 3.
Numerical wave spectra produced via BTMs and CFD modelling compared to those of the laboratory [20] after the wave propagation. Specifically, panel (a) compares CFD, laboratory and the hybrid approach of FUNWAVE-TVD; panel (b) compares CFD, laboratory and the viscosity model of FUNWAVE-TVD; and panel (c) compares CFD, laboratory and Celeris.The wave characteristics of the generated spectra are Hm0 5.4 m and Tp 10 s.
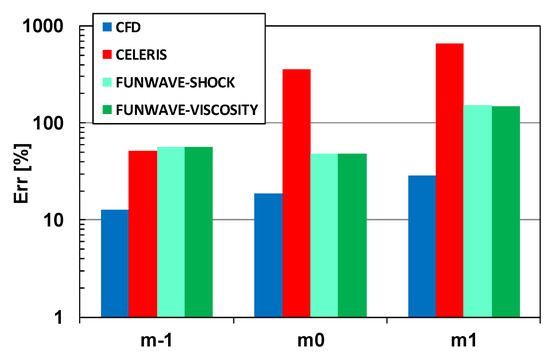
Figure 4.
Percentage error of numerical spectral moments relative to those of the laboratory.
4. Conclusions
This study compares the performance of two open-source BTMs, Celeris and FUNWAVE-TVD in the reproduction of wave breaking. The analysis reveals some critical aspects that need to be further investigated in future works. Celeris requires careful calibration of the computational grid since it reproduces the breaking via numerical dissipation. This study provides a first indication of this. On the other hand, FUNWAVE-TVD is more reliable but may not give the expected results, as shown during the first phase of the numerical experimentation. Finally, both BTMs do not reproduce the temporal variation of the breaking point that generates the IG waves, as shown by the absence of low frequency components in the spectra. Nevertheless, a deeper analysis of the influence of the grid on the generation of IG waves is required. The findings of this study demonstrate the need to further investigate the BTM modelling of wave breaking as it plays a key role in shallow water phenomena.
Author Contributions
Conceptualization, S.T.; methodology, S.T. and M.B.; software, S.T. and A.D.L.; data curation, S.T. and M.B. and M.C.; writing—original draft preparation, S.T.; writing—review and editing, M.B. and M.C.; supervision, M.B. and M.C. All authors have read and agreed to the published version of the manuscript.
Funding
This research received no external funding.
Data Availability Statement
Experimental data are available from the corresponding author upon request.
Conflicts of Interest
The authors declare no conflict of interest.
References
- Brocchini, M. A reasoned overview on Boussinesq-type models: The interplay between physics, mathematics and numerics. Proc. R. Soc. A 2013, 469, 20130496. [Google Scholar] [CrossRef] [PubMed]
- Svendsen, I.A. Mass flux and undertow in a surf zone. Coast. Eng. 1984, 8, 347–365. [Google Scholar] [CrossRef]
- Kennedy, A.B.; Chen, Q.; Kirby, J.T.; Dalrymple, R.A. Boussinesq modeling of wave transformation, breaking, end runup. I: 1D. J. Waterw. Port Coast. Ocean Eng. 2000, 126, 39–47. [Google Scholar] [CrossRef]
- Veeramony, J.; Svendsen, I.A. The flow in surf-zone waves. Coast. Eng. 2000, 39, 93–122. [Google Scholar] [CrossRef]
- Tonelli, M.; Petti, M. Hybrid finite volume: Finite difference scheme for 2DH improved Boussinesq equations. Coast. Eng. 2009, 56, 609–622. [Google Scholar] [CrossRef]
- Tavakkol, S.; Lynett, P. Celeris: A GPU-accelerated open source software with a Boussinesq-type wave solver for real-time interactive simulation and visualization. Comput. Phys. Commun 2017, 217, 117–127. [Google Scholar] [CrossRef]
- Shi, F.; Kirby, J.T.; Harris, J.C.; Geiman, J.D.; Grilli, S.T. A high-order adaptive time-stepping TVD solver for Boussinesq modeling of breaking waves and coastal inundation. Ocean. Model. 2012, 43–44, 36–51. [Google Scholar] [CrossRef]
- Madsen, P.A.; Sørensen, O.R. A new form of the Boussinesq equations with improved linear dispersion characteristics. Part 2: A slowly varying bathymetry. Coast. Eng. 1992, 18, 183–204. [Google Scholar] [CrossRef]
- Chen, Q. Fully nonlinear Boussinesq-type equations for waves and currents over porous beds. J. Eng. Mech. 2006, 132, 220–230. [Google Scholar] [CrossRef]
- Peregrine, D.H. Long waves on a beach. J. Fluid Mech. 1967, 27, 815–827. [Google Scholar] [CrossRef]
- Weggel, J.R. Maximum breaker height. J. Waterw. Harb. Coast. Eng. Div. 1972, 98, 529–548. [Google Scholar] [CrossRef]
- Goda, Y. Irregular wave deformation in the surf zone. Coast. Eng. Jpn. 1975, 18, 13–26. [Google Scholar] [CrossRef]
- Moore, B.D. Beach Profile Evolution in Response to Changes in Water Level and Wave Height. Master’s Thesis, University of Delaware, Newark, NJ, USA, 1982. [Google Scholar]
- Choi, Y.K.; Shi, F.; Malej, M.; Smith, J.M. Performance of various shock-capturing-type reconstruction schemes in the Boussinesq wave model, FUNWAVE-TVD. Ocean. Model. 2018, 131, 86–100. [Google Scholar] [CrossRef]
- Kamphuis, J.W. Incipient wave breaking. Coast. Eng. 1991, 15, 185–203. [Google Scholar] [CrossRef]
- FLOW-3D®; Version 12.0; Flow Science, Inc.: Santa Fe, NM, USA, 2019.
- Buccino, M.; Daliri, M.; Dentale, F.; Di Leo, A.; Calabrese, M. CFD experiments on a low crested sloping top caisson breakwater. Part 1. nature of loadings and global stability. Ocean. Eng. 2019, 182, 259–282. [Google Scholar] [CrossRef]
- Buccino, M.; Daliri, M.; Dentale, F.; Calabrese, M. CFD experiments on a low crested sloping top caisson breakwater. Part 2. Analysis of plume impact. Ocean. Eng. 2019, 173, 345–357. [Google Scholar] [CrossRef]
- Di Leo, A.; Buccino, M.; Dentale, F.; Pugliese Carratelli, E. CFD Analysis of Wind Effect on Wave Overtopping. In Proceedings of the 32nd International Ocean and Polar Engineering Conference, Shanghai, China, 5–10 June 2022. [Google Scholar]
- Cordova Lopez, L.F.; Salerno, D.; Dentale, F.; Capobianco, A.; Buccino, M. Wave overtopping at Malecòn tradicional, La Habana, Cuba. Coast. Eng. Proc. 2016, 35, 24–39. [Google Scholar]


Publisher’s Note: MDPI stays neutral with regard to jurisdictional claims in published maps and institutional affiliations. |
© 2022 by the authors. Licensee MDPI, Basel, Switzerland. This article is an open access article distributed under the terms and conditions of the Creative Commons Attribution (CC BY) license (https://creativecommons.org/licenses/by/4.0/).