Next Article in Journal
Direct Simulation of Micro-Component Water Consumption for the Evaluation of Potential Water Reuse in Households
Previous Article in Journal
Optimal Deployment of the Water Quality Sensors in Urban Drainage Systems
 
 
Please note that, as of 4 December 2024, Environmental Sciences Proceedings has been renamed to Environmental and Earth Sciences Proceedings and is now published here.
Proceeding Paper

Simulation Framework for Pipe Failure Detection and Replacement Scheduling Optimization †

by
Panagiotis Dimas
*,
Dionysios Nikolopoulos
and
Christos Makropoulos
Department of Water Resources and Environmental Engineering, School of Civil Engineering, National Technical University of Athens, 15780 Athens, Greece
*
Author to whom correspondence should be addressed.
Presented at the International Conference EWaS5, Naples, Italy, 12–15 July 2022.
Environ. Sci. Proc. 2022, 21(1), 37; https://doi.org/10.3390/environsciproc2022021037
Published: 23 October 2022

Abstract

:
Identification of water network pipes susceptible to failure is a demanding task, which requires a coherent and extensive dataset that contains both their physical characteristics (i.e., pipe inner diameter, construction material, length, etc.) and a snapshot of their current state, including their age and failure history. As water networks are critical for human prosperity, the need to adequately forecast failure is immediate. A huge number of Machine Learning (ML) and AI models have been applied; furthermore, only a few of them have been coupled with algorithms that translate the failure probability into asset management decision support strategies. The latter should include pipe rehabilitation planning and/or replacement scheduling under monetary/time unit constraints. Additionally, the assessment of each decision is seldomly performed by developing performance indices stemming from simulation. Hence, in this work, the outline of a framework able to incorporate pipe failure detection techniques utilizing statistical, ML and AI models with pipe replacement scheduling optimization and assessment of state-of-the-art resilience indices via simulation scenarios is presented. The framework is demonstrated in a real-world-based case study.

1. Introduction

Managing the benefits of water systems in terms of optimal replacement strategies is a complex and challenging task. Upon replacement, it must be ensured that certain technical and socioeconomic specifications will not be impaired during future system performance. We must also guarantee that the overall resilience of the urban water system does not deteriorate over time and that the associated costs remain as low as possible [1]. Therefore, the most common practice in the pipeline replacement schedule is based on proper pipeline forecasting with respect to the identification of water leaks and actual pipeline ruptures. In this manner, the ability of pipe break prediction models to reduce leakage has been demonstrated on various occasions by utilizing inexpensive approaches such as statistical models and genetic programming [2], data-driven techniques [3], and data mining prediction systems [4]. The models are easy to operate and do not require any knowledge of the physical fracture mechanisms of the underlying pipes. On the contrary, this aspect depends on specific characteristics of the case studied area. Specifically, their internal components are hard to identify and often remain unknown to the stakeholders (since they require meticulous work in observing the pipe break process) [3].
With the recent developments in Machine Learning (ML) and Artificial Intelligence (AI) techniques, setting up extremely cost-effective and fast models that predict the failure probability of water pipes has become less intricate. Therefore, the obtained information helps to outline pathways for the prioritization of pipe renewals. Such ML methods include, among others, integrating ML imputation methods with survival analysis [5] and developing an ML system to ‘foretell’ which water mains have an increased breaking likelihood [6].
In recent years, the number of ML techniques utilized in pipe failure detection and, hence, their prioritized replacement has significantly increased. Nevertheless, only a limited number of studies has analyzed the performance of the resulting replacement strategy in accordance with data generated from Water Distribution Networks (WDN) simulation scenarios operating under complex water usage conditions [7].
In order to address this issue, this work explored two data-driven ML models for predicting the pipe failure probability, trained for a real WDN in Piraeus, Greece, where the pipe failures related characteristics of each pipe (features in the ML notation) have been recorded, along with their break history. The trained ML model is subsequently used to detect and sort pipes with high failure probability in the real-world-based case study of C-Town. The pipe characteristics database of the C-Town model has been artificially expanded to include information on pipe construction material by assuming the same feeder pipe material distribution as the real network. The ML model is then deployed to predict the failure probability of the C-Town pipes. The performance of various replacement strategies under varying construction contract budgets is then validated under multiple simulation scenarios. Finally, the conclusions are provided to abridge the findings of this work effectively.

2. Materials and Methods

2.1. Case Studies: Mourati Zone and C-Town

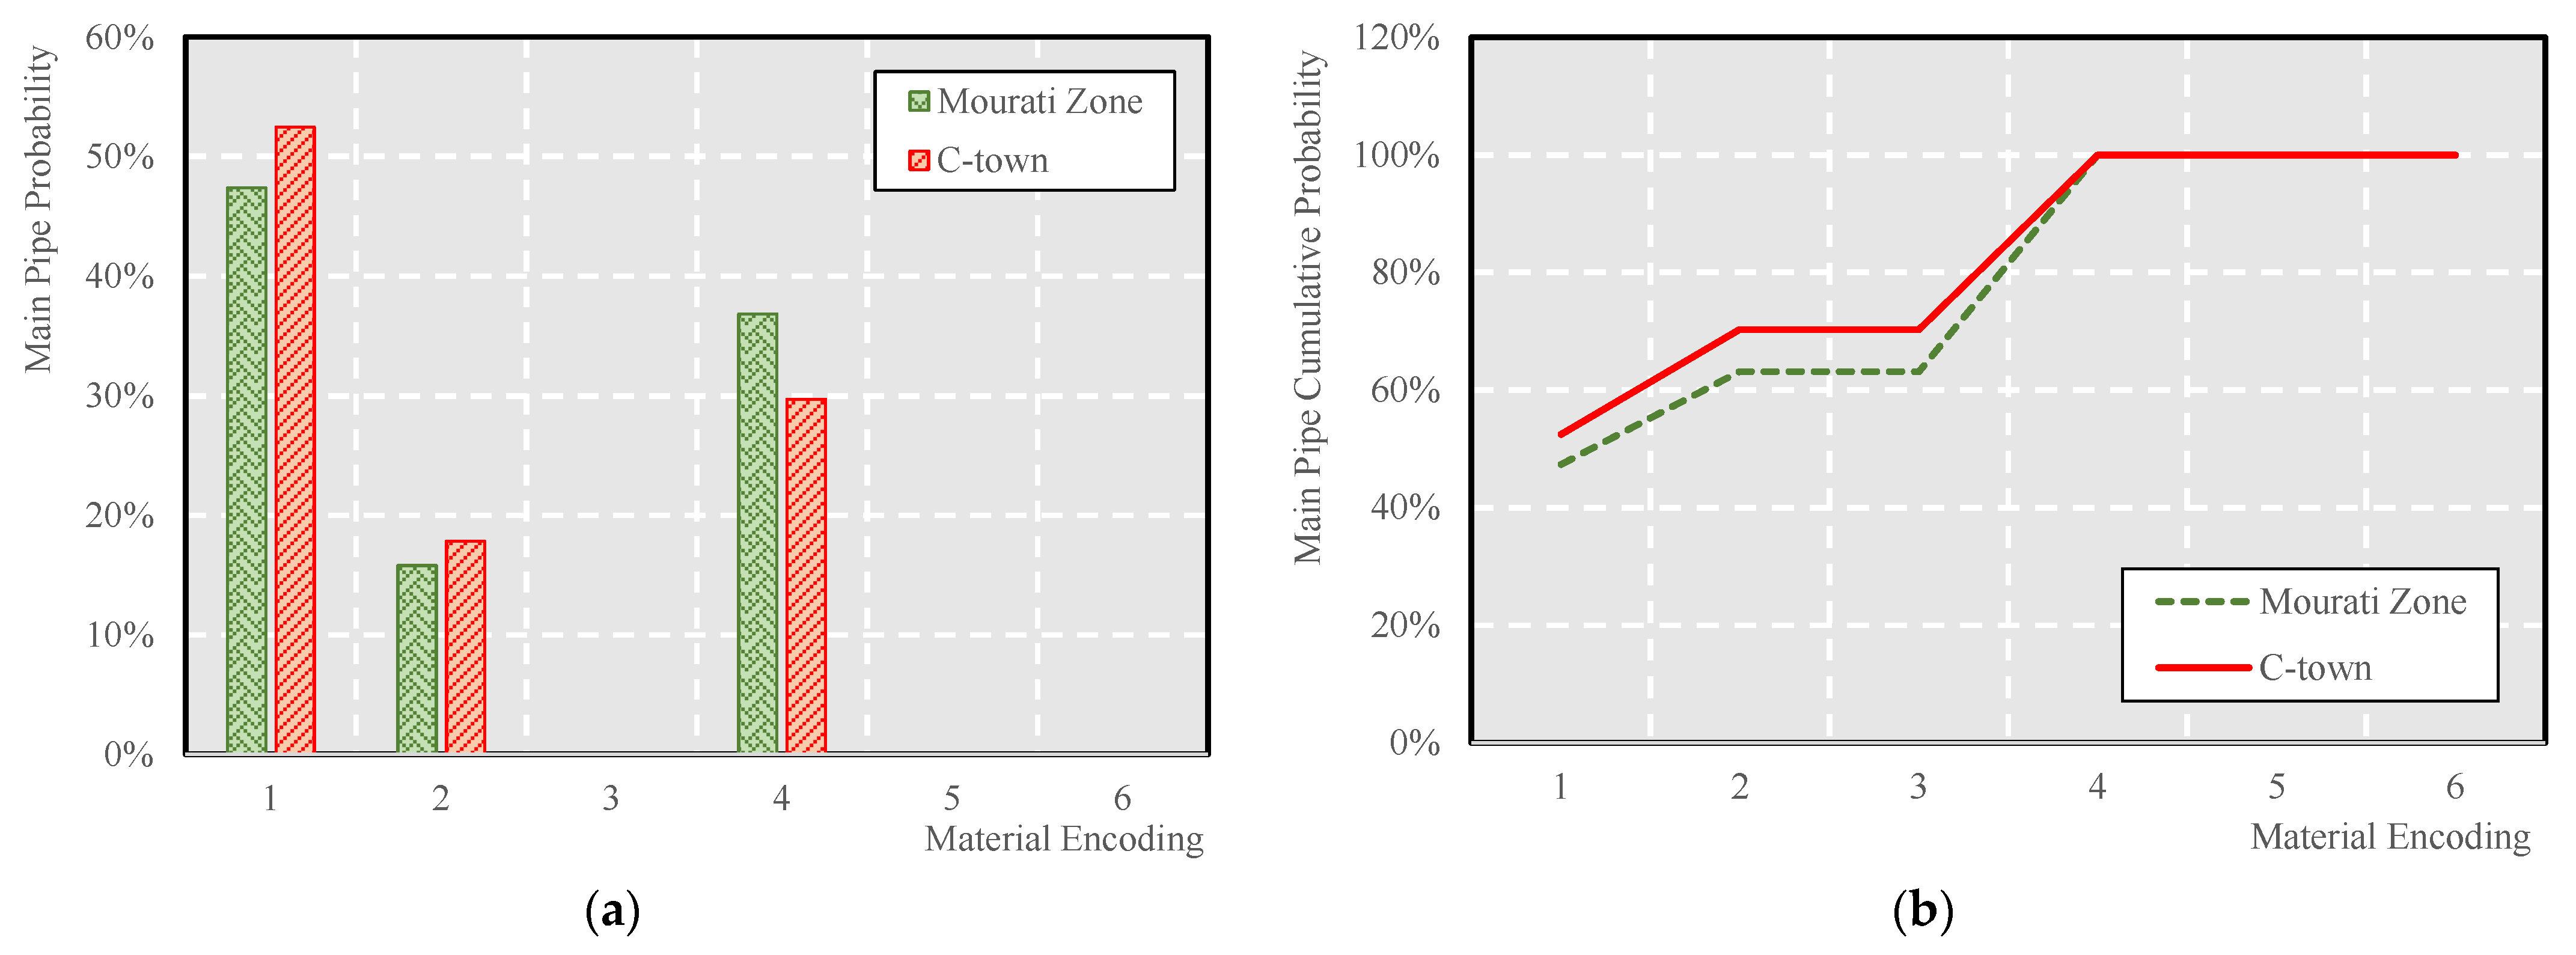
The Mourati zone is located in Piraeus, a port city within the greater Athens urban area in the Attica region of Greece. It is essentially a District Metered Area (DMA), serving an area of 3.01 km2. It comprises household consumers, sports facilities of important size (i.e., a football stadium, a municipal natatorium and an indoor basketball stadium), and many recreational facilities. Its pipe database, as provided by the Athens Water Supply and Sewerage Company, includes 1640 pipes of external diameters ranging from Ø50 to Ø900, manufactured from (i) gray cast iron, (ii) asbestos cement, (iii) galvanized steel, (iv) straight seam steel, (v) PVC and (vi) polyethylene MRS100 (encoded arithmetically in the range [1, 6]), with lengths ranging from 0.11 m to 2.06 km. The main pipes are mainly manufactured from i, iv and ii, with percentages of 47%, 37% and 16%, respectively.
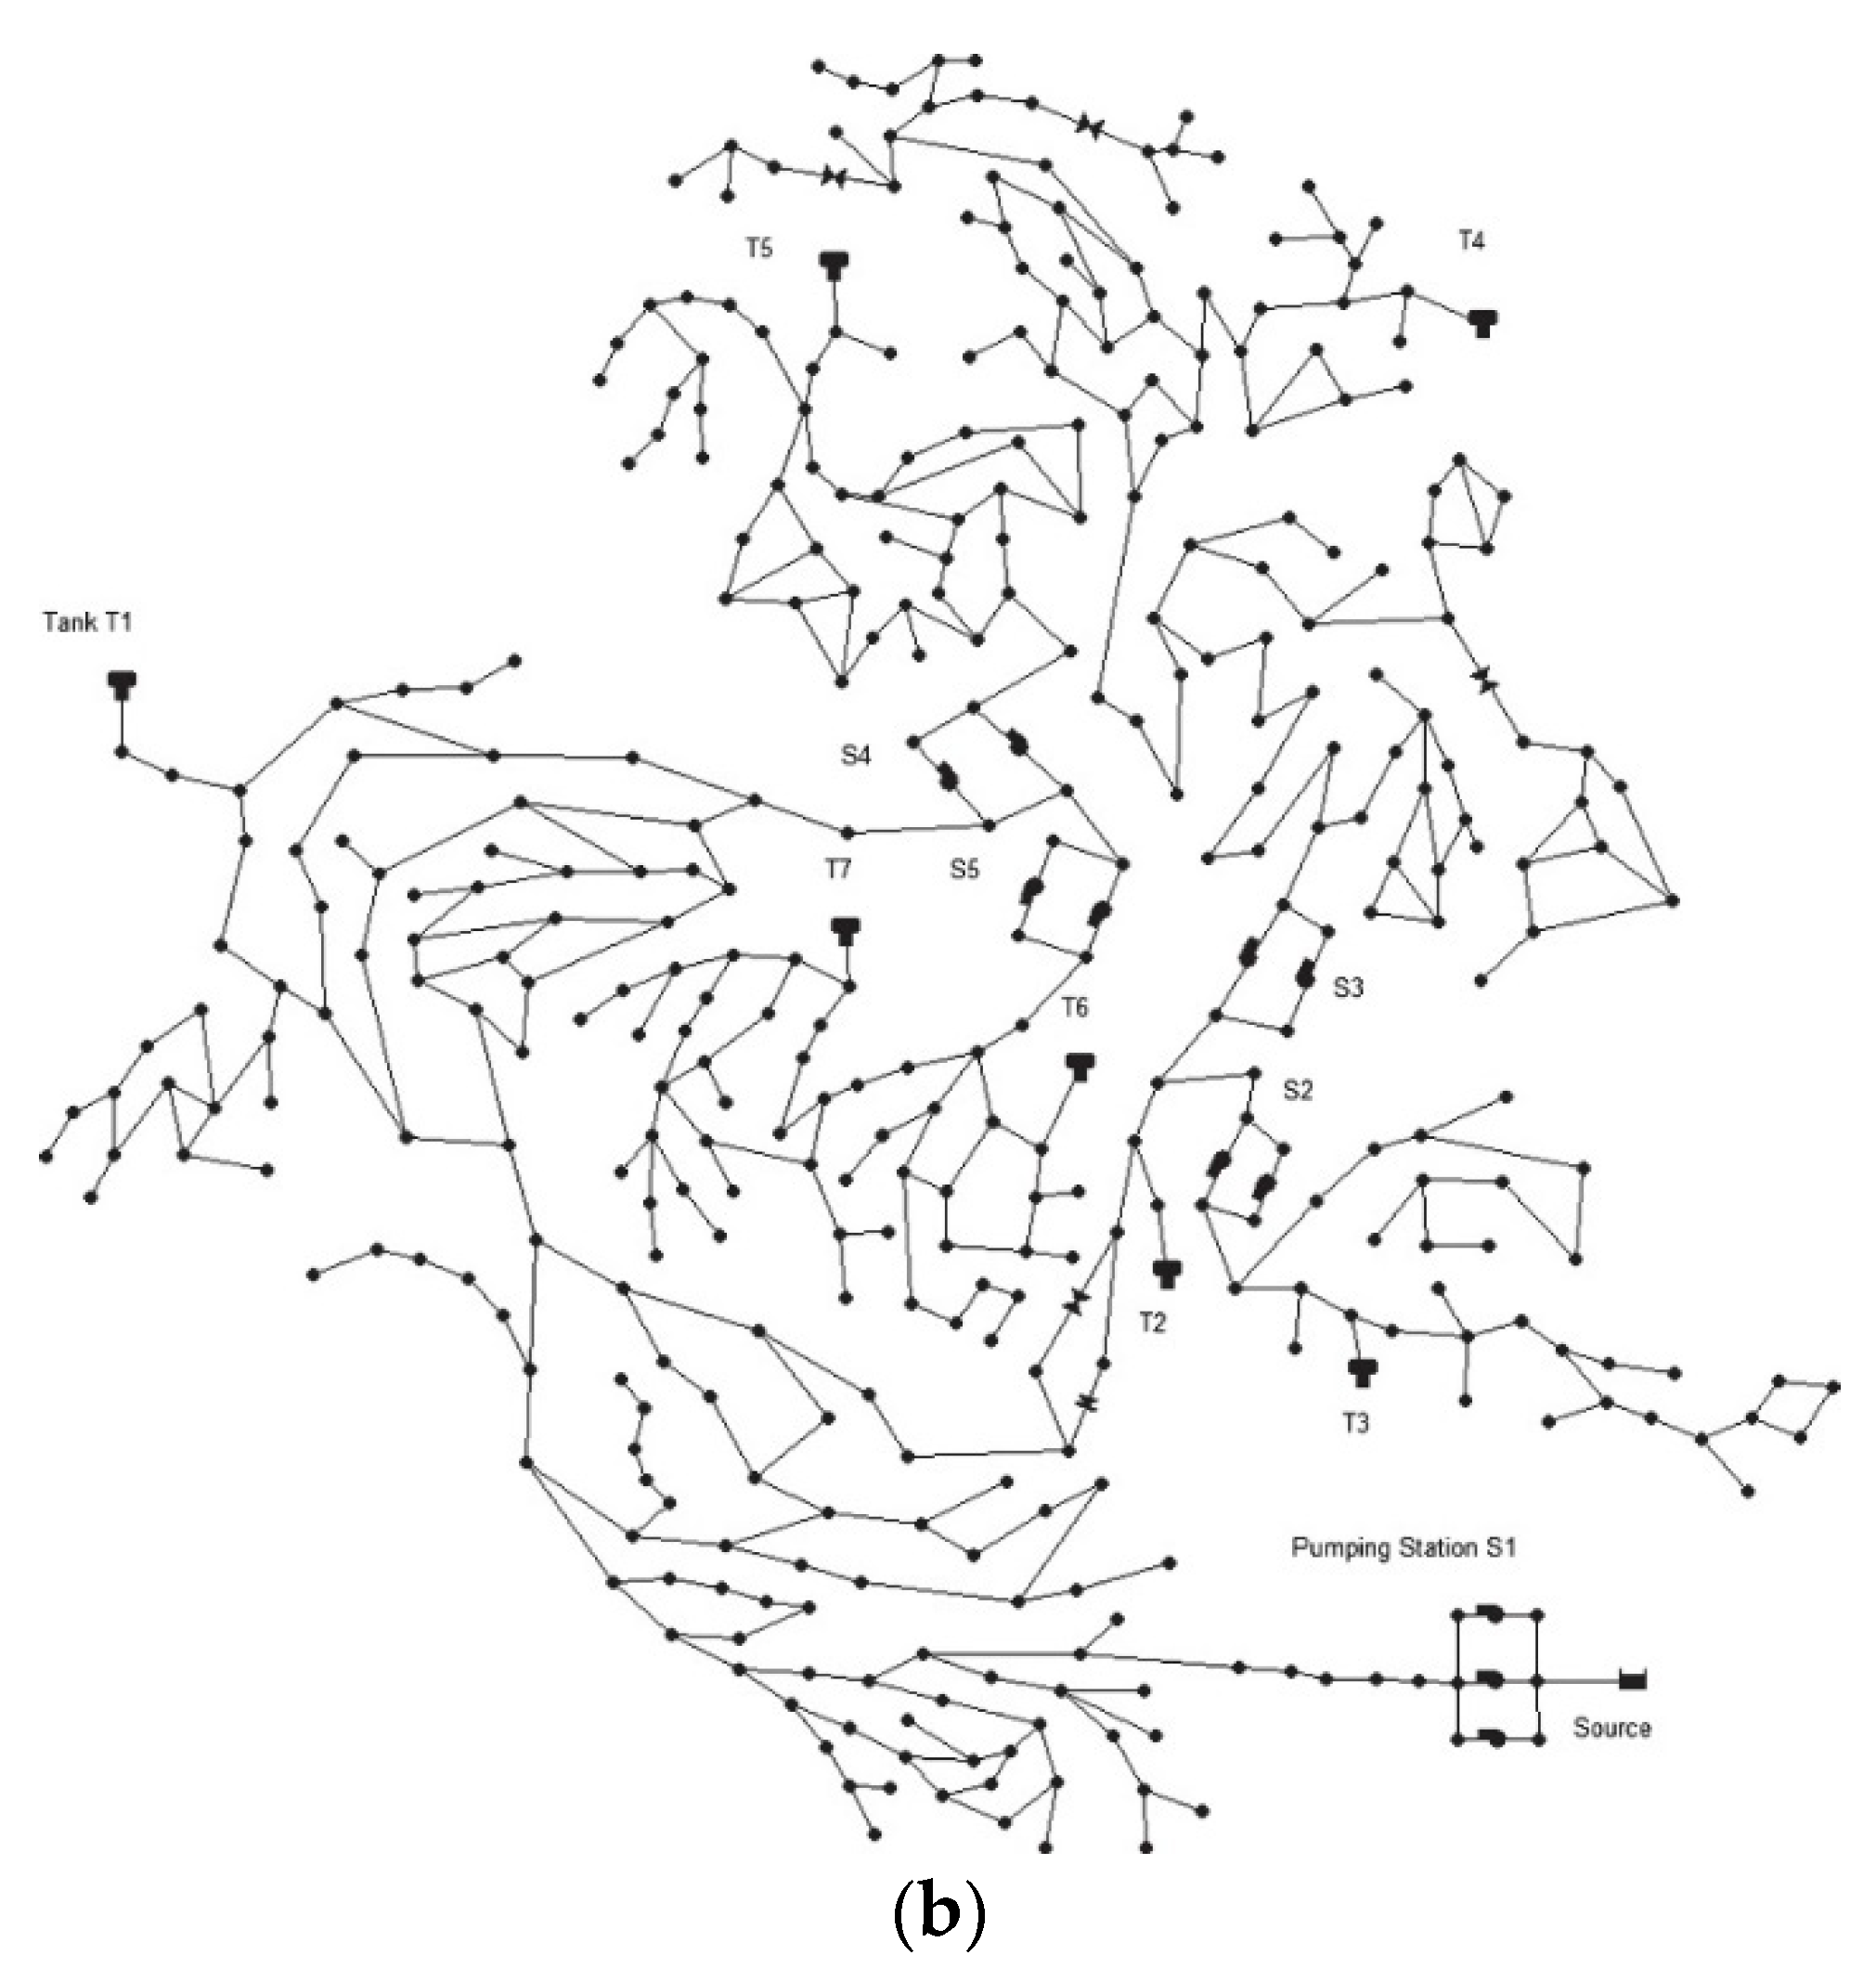
C-town [8] is based on a real-world medium-sized network and consists of one reservoir, seven tanks, 388 demand junctions, 429 pipes, eleven head pumps and four valves (three pressure relief valves (PRV), one flow control valve (FCV)). The EPANET network topology is displayed in Figure 1. A detailed description of the network functioning is included in the work of Nikolopoulos et al. [9].
Since the C-town model does not include any pipe material information, it is assumed that the main pipes follow the same materials distribution as the ones of the Mourati zone. The remaining pipes (secondary, tertiary) are assigned to material by a random choice of uniform selection. The main pipe probability per material and the resulting cumulative probability are depicted in Figure 2.

2.2. Training the Pipe Failure Probability Prediction Models in Mourati Zone

The Mourati zone dataset is used to train two different ML models, namely (i) the Regression model based on k-nearest neighbors (kNN-R) and (ii) the Decision Tree regression model (DTR). The models are developed in Scikit-learn [10], a free software machine-learning library for the Python programming language, which provides simple and efficient tools for predictive data analysis.
The features of the dataset include: (i) the pipe material encoding; (ii) the main flagging (assigned a value of 1 if the pipe is a main one, or 0 if the pipe is secondary or tertiary); (iii) the pipe external diameter; and (iv) the pipe length. The label indicates if the corresponding pipe is faulty (broken) or not, with values of 1 and 0, respectively. Since the percentage of pipes that failed is only a small subset of the dataset (~6%), this results in an unbalanced dataset. Hence, most of the ML models could ignore such results or exhibit poor performance in the minority class. A widely accepted method of addressing these issues is to oversample the minority class to create a balanced dataset. The most popular oversampling technique is called Synthetic Minority Oversampling Technique (SMOTE) and is a method utilizing a k-nearest neighbor algorithm to create a synthetic data population [11]. The main advantage of SMOTE approach is that new synthetic examples from the minority class are created that are plausible, i.e., relatively close to real examples from the minority class. A major drawback is that synthetic examples are created without considering the majority class, resulting in ambiguous examples if there is a strong overlap between the classes [12].
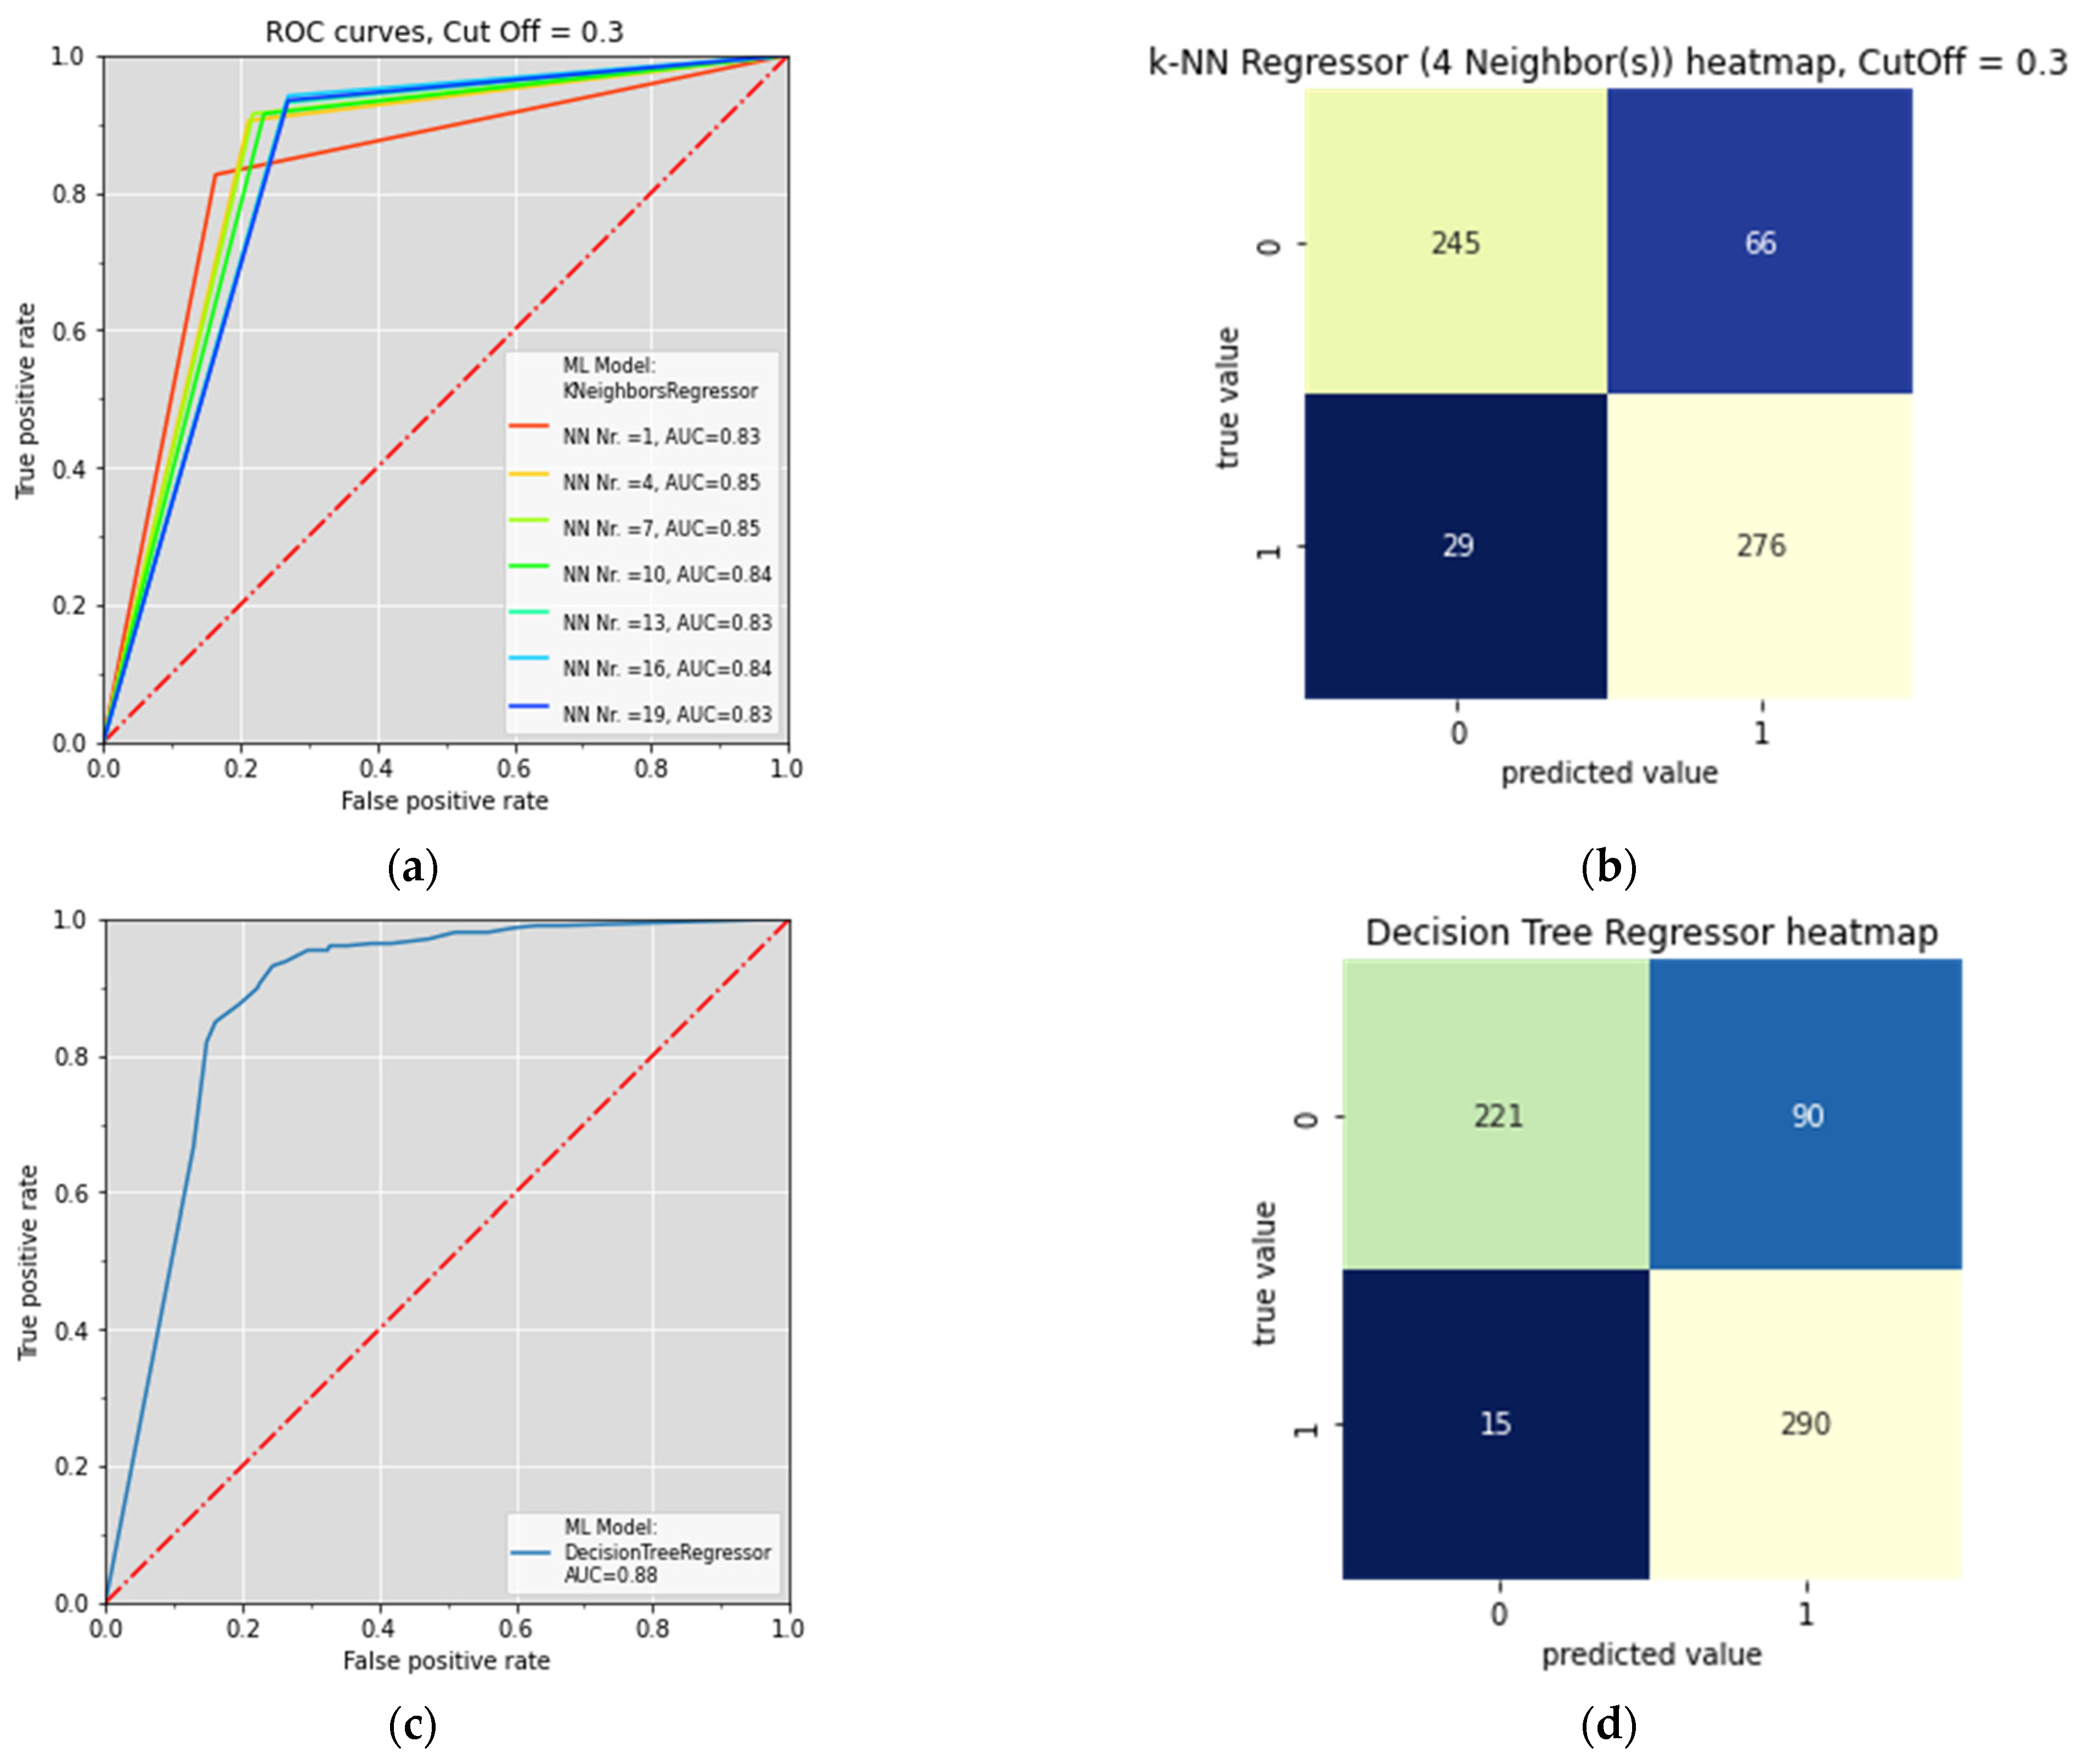
The SMOTE approach has been utilized in the present work, with the two ML models (kNN-R, DTR) being trained in the oversampled dataset. Since the two models are regressive ones, they produce real numbers (i.e., failure probabilities), which are subsequently converted to binary ones through a threshold value of choice (cut-off value equal to 0.3), treated as a hyperparameter. The final training evaluation metrics are summarized in Figure 3 in terms of the respective ROC curves and heatmaps.

2.3. Pipe Replacement Methodology and Performance Assessment

To conceptualize a strategy for pipe replacements in the network that employs the aforementioned failure prediction models, we formulated a scheme as follows:
  • The available budget for pipe replacements is distributed among a 5-year construction contract. The contract is allocated to annual sub-contracts. The pipe attributes of length ( L ) and diameter ( D ) are used as a proxy metric ( C ) in place of the actual monetary cost to replace pipe i , using the equation:
    C i = L i D i 2
    The available budget for the contract is assumed to be a proportion, i.e., 10%, 15% or 20%, of the total replacement cost ( C ) for all WDN’s pipes, producing three contract cost levels.
  • The pipes of the network are sorted by their respective failure probability, as predicted by each ML model, so two different sets of strategies are examined. Combined with the three contract cost levels, there are six discrete sets of annual schedules for pipe replacement.
  • The annual schedule is formed at the start of the year from the set of pipes that accumulate the annual construction budget. This set is replaced with new pipes, which are assumed to be failure-proof until the end of the 5-year contract. Construction time is assumed to be negligible (i.e., does not affect the WDN hydraulic operation).
The WDN operation is simulated using EPANET 2.2 [13], which facilitates pressure-driven analysis equations (PDA) to support the simulation of pressure deficient conditions, which could result from pipe failures [14]. As this is a probabilistic approach, a Monte Carlo scheme regarding pipe failures is employed. Specifically:
  • A global daily pipe failure probability is assigned to the WDN, assumed to be 0.0005 / d a y . For each pipe, this probability ( F ) is modified by the properties of length ( L ) and diameter ( D ) normalized by dividing with the minimum pipe diameter in the WDN ( D m i n ), using the following equation where both quantities are expressed in meters:
    F = 0.0005 L 1000 D D m i n
  • An ensemble of 100 realizations of the WDN hydraulic simulation, with a duration of 1825 days, is formed. For each day and each pipe, a random probability of non-exceedance from the uniform distribution is generated. If it is smaller than the probability of rupture of the pipe, the pipe breaks. The same 100 realizations were used for all alternative strategies and budgets.
  • For bursts in a specific daily step of the simulation period, we modify the network using the WNTR [15] WDN Python package to split the pipe in two parts of equal length and introduce an emitter (a device that simulates flow that discharges to the atmosphere, able to also simulate leakages) between them. The emitter’s flowrate (q) is calculated from the node’s pressure ( p ) and a burst coefficient ( b ) as follows:
    q = b p
The burst coefficient is calculated from the Equation (4), where A is the area of the pipe’s cross-section in m 2 and ρ denotes water density:
b = 0.75 A 2 ρ
  • This pipe burst is assumed to be fixed within the same day of the simulation, possibly affecting the rest of the WDN due to pressure-deficient conditions. For the whole simulation period (i.e., all instances of bursts), this tallies to a total unmet demand metric. If pipes that burst are in the replacement schedule and the replacement has already been applied at the specific timestep of the burst, the unmet demand that occurs from this burst is tallied to another variable, i.e., unmet demand reduction. Another metric is formed, i.e., the unmet demand with the scheduling of pipe replacements, calculated from unmet demand minus the unmet demand reduction.
  • The performance of each realization is the ratio of unmet demand with the scheduling of pipe replacements versus unmet demand, i.e., the reduction ratio of unmet demand.
  • Finally, after assessing the performance of the whole ensemble of realizations for each of the six discrete sets of annual schedules, we compare results.

3. Results and Discussion

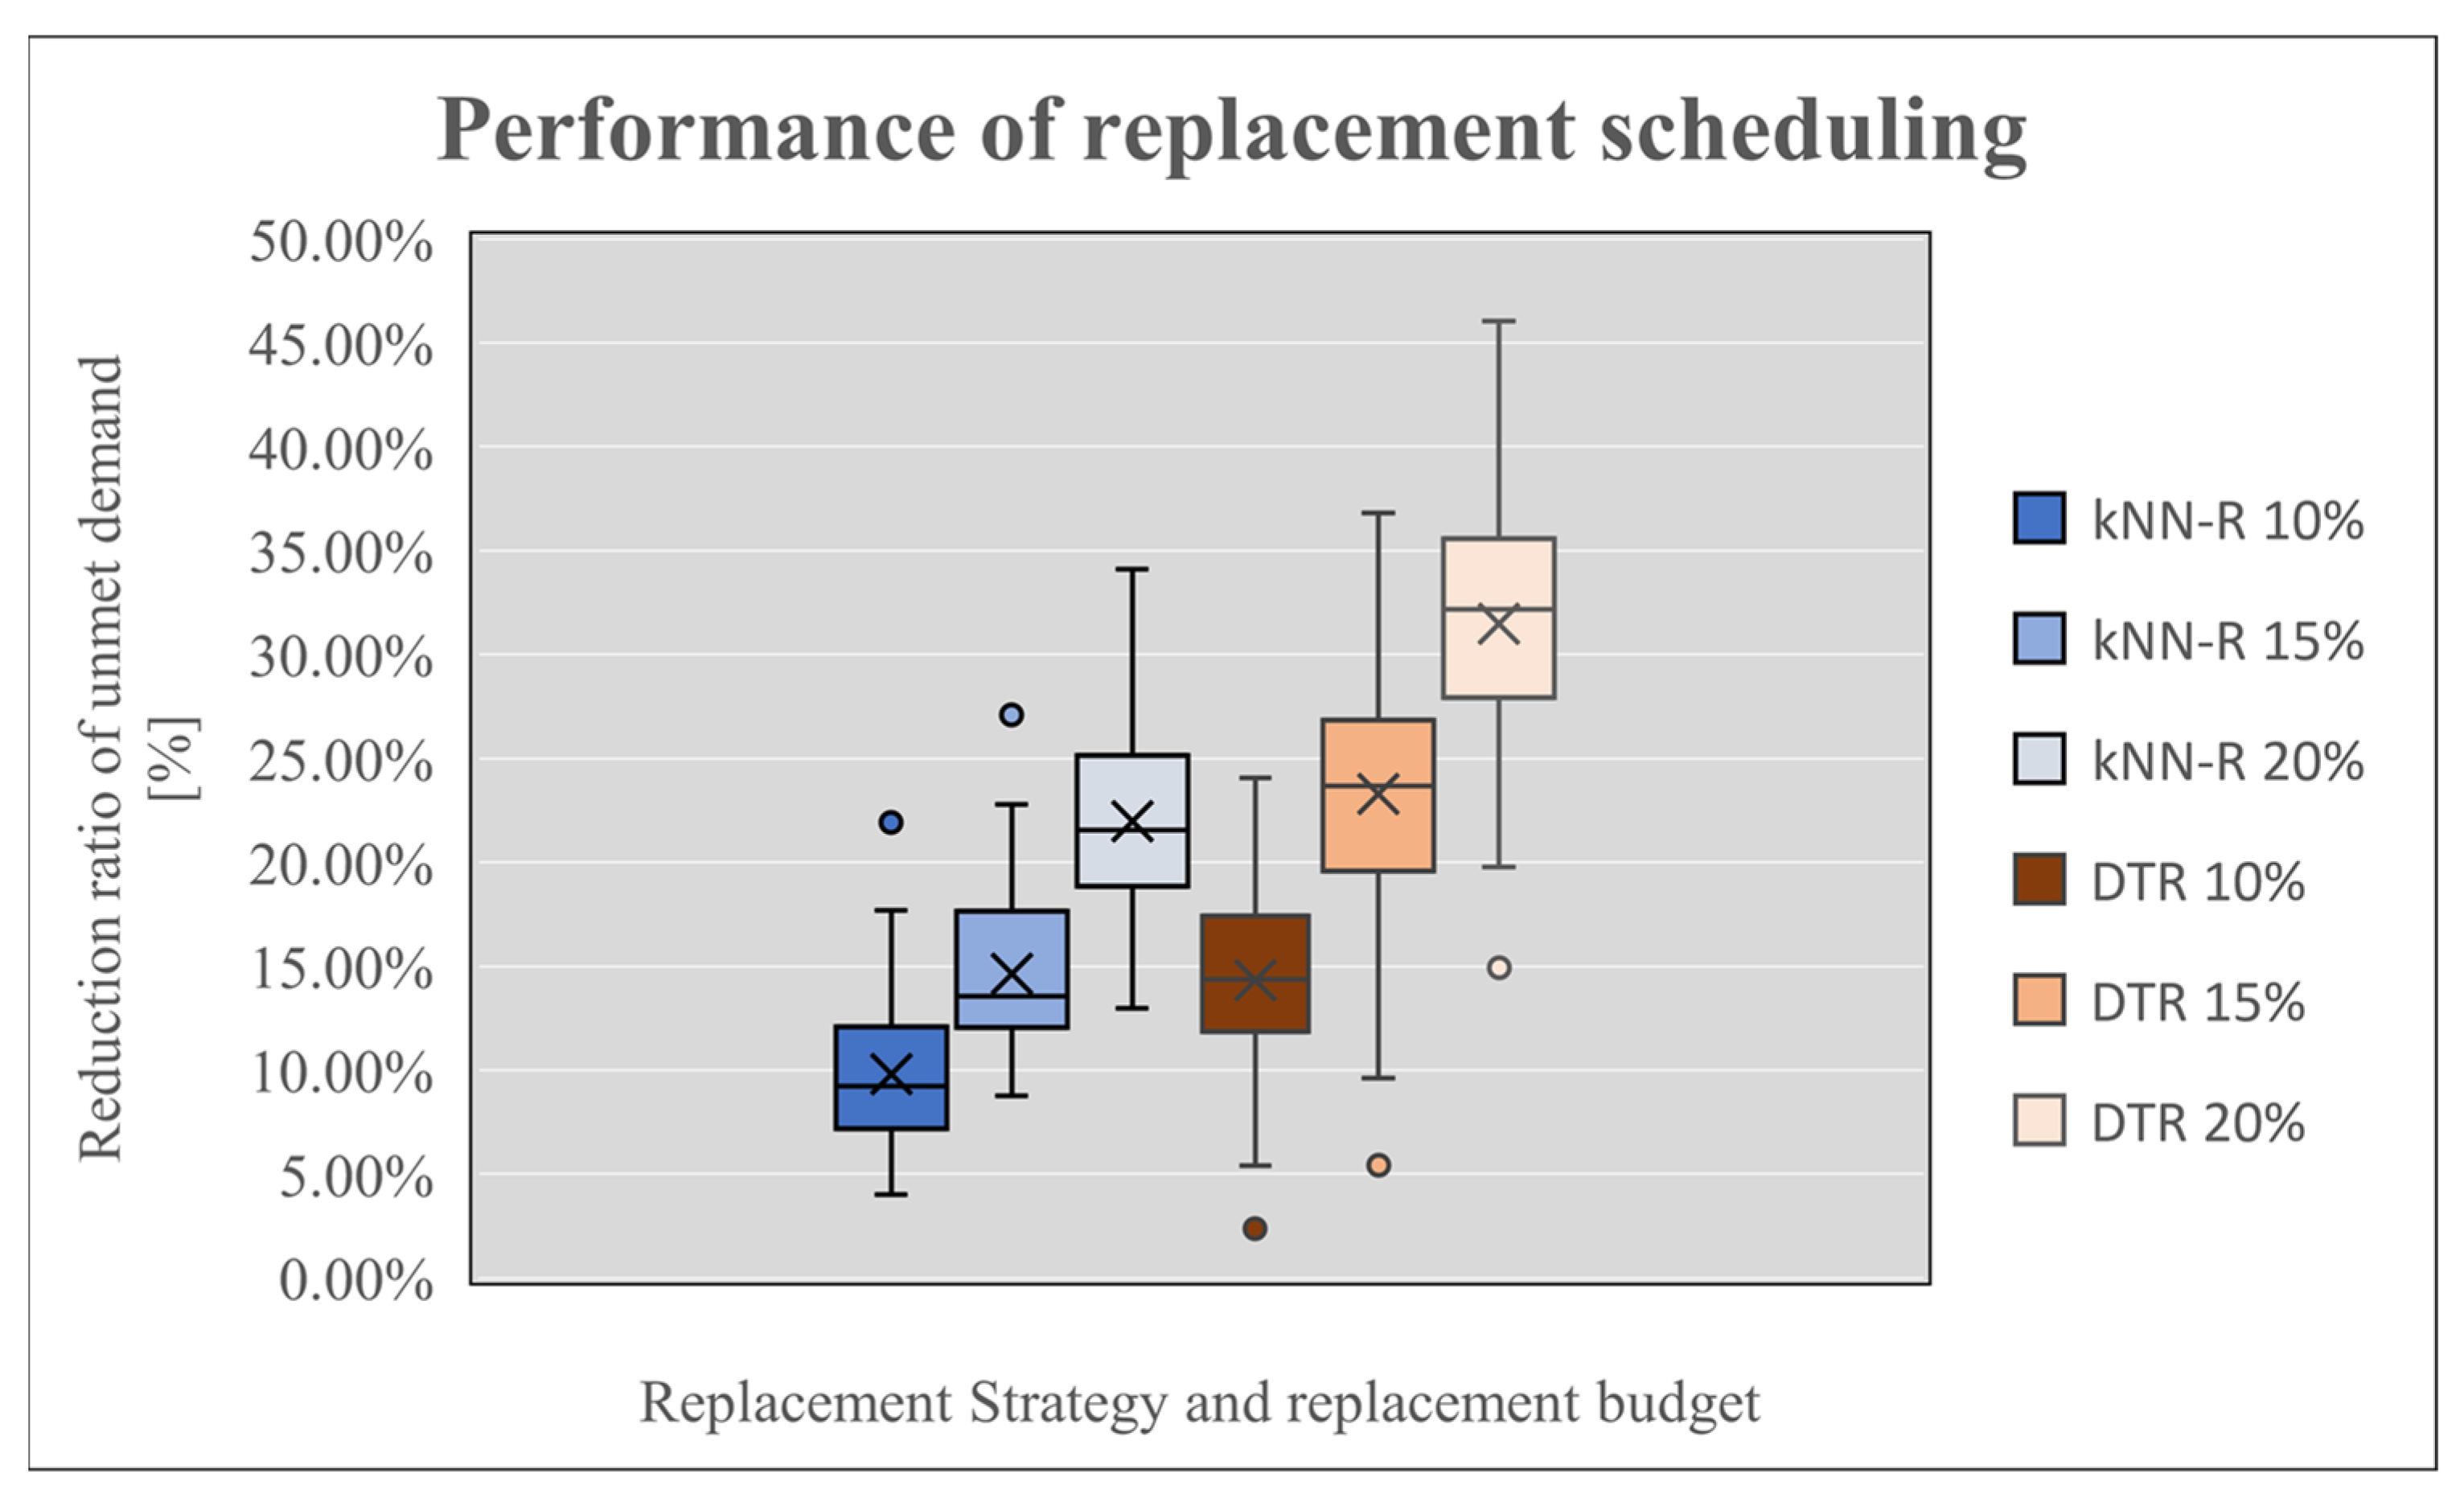
Results of the annual schedules are presented with box and whisker plots in Figure 4 and Table 1. The replacement strategy that utilizes the kNN-R ML model for identification is underperforming by mean and median statistics for all budget levels compared to the strategies that utilize the DTR ML model. However, the DTR-related strategies have greater uncertainty, as indicated by the increased bounds and standard deviation. We can compare their performance with the truly random replacement of pipes in the network: in that case, with a Monte Carlo scheme and many realizations, the expected outcome would follow the budget level; replacing the 10% of pipes would, more or less, result in 10% reduction of bursts, and thus 10% unmet demand reduction ratio compared to no replacements. The kNN-R strategy (albeit in the limited pool of 100 realizations) seems to offer no benefit compared to a random replacement schedule. On the contrary, there is an added value in using the DTR strategy, as it systematically offers better than randomly expected performance. This advantage may be a product of the better feature engineering of the DTR ML method.

4. Conclusions

In this work, we present a novel coupling of ML prediction models for pipe bursts in WDNs, with strategies of replacement, assessing their performance with Monte Carlo hydraulic simulations to address uncertainty. We demonstrate the methodology by training the ML models with data from a real-world system that lacks demand, supply and control data (thus making a hydraulic simulation infeasible) and assessing the replacement strategies in a synthetic WDN. This example case may not be representative of the actual replacement scheduling in the real-world case. Nonetheless, it acts as an early schematic prototype of a promising methodology that aids water utilities to be proactive and resilient regarding their asset management practices and enhances their toolbox for long-term strategic planning and risk awareness.

Author Contributions

Conceptualization, P.D. and D.N.; methodology, P.D., D.N. and C.M.; writing—original draft preparation, P.D. and D.N.; writing—review and editing, P.D., D.N. and C.M. All authors have read and agreed to the published version of the manuscript.

Funding

The current research is funded by the Service Contract of the Project entitled Provision of services for the Investigation, Assessment, and Management of Water Losses in the Internal Water Distribution Network of EYDAP S.A., contract nr. 21210427-3.

Institutional Review Board Statement

Not applicable.

Informed Consent Statement

Not applicable.

Data Availability Statement

Not applicable.

Conflicts of Interest

The authors declare no conflict of interest.

Abbreviations

AIArtificial intelligence
CIConfidence Intervals
DMADistrict Metered Area
DTRDecission Tree Regression
FCVFlow Control Valve
kNN-Rk-Nearest Neighbors Regression
MLMachine Learning
PDAPressure Driven Analysis
PRVPressure Relief Valve
SMOTESynthetic Minority Oversampling Technique
WDNWater Distribution Network

References

  1. Alegre, H.; Coelho, S.T. Infrastructure Asset Management of Urban Water Systems; IntechOpen Limited: London, UK, 2012; ISBN 978-953-51-0889-4. [Google Scholar]
  2. Xu, Q.; Chen, Q.; Li, W. Application of Genetic Programming to Modeling Pipe Failures in Water Distribution Systems. J. Hydroinform. 2010, 13, 419–428. [Google Scholar] [CrossRef] [Green Version]
  3. Xu, Q.; Chen, Q.; Li, W.; Ma, J. Pipe Break Prediction Based on Evolutionary Data-Driven Methods with Brief Recorded Data. Reliab. Eng. Syst. Saf. 2011, 96, 942–948. [Google Scholar] [CrossRef]
  4. Wang, R.; Dong, W.; Wang, Y.; Tang, K.; Yao, X. Pipe Failure Prediction: A Data Mining Method. In Proceedings of the 2013 IEEE 29th International Conference on Data Engineering (ICDE), Brisbane, Australia, 8–12 April 2013; pp. 1208–1218. [Google Scholar]
  5. Xu, H.; Sinha, S.K. Modeling Pipe Break Data Using Survival Analysis with Machine Learning Imputation Methods. J. Perform. Constr. Facil. 2021, 35, 04021071. [Google Scholar] [CrossRef]
  6. Weeraddana, D.; Liang, B.; Li, Z.; Wang, Y.; Chen, F.; Bonazzi, L.; Phillips, D.; Saxena, N. Utilizing Machine Learning to Prevent Water Main Breaks by Understanding Pipeline Failure Drivers. arXiv 2020, arXiv:2006.03385. [Google Scholar] [CrossRef]
  7. Fan, X.; Zhang, X.; Yu, X. Machine Learning Model and Strategy for Fast and Accurate Detection of Leaks in Water Supply Network. J. Infrastruct. Preserv. Resil. 2021, 2, 10. [Google Scholar] [CrossRef]
  8. Ostfeld, A.; Salomons, E.; Ormsbee, L.; Uber, J.G.; Bros, C.M.; Kalungi, P.; Burd, R.; Zazula-Coetzee, B.; Belrain, T.; Kang, D.; et al. Battle of the Water Calibration Networks. J. Water Resour. Plan. Manag. 2012, 138, 523–532. [Google Scholar] [CrossRef] [Green Version]
  9. Nikolopoulos, D.; Moraitis, G.; Bouziotas, D.; Lykou, A.; Karavokiros, G.; Makropoulos, C. Cyber-Physical Stress-Testing Platform for Water Distribution Networks. J. Environ. Eng. 2020, 146, 04020061. [Google Scholar] [CrossRef]
  10. Pedregosa, F.; Varoquaux, G.; Gramfort, A.; Michel, V.; Thirion, B.; Grisel, O.; Blondel, M.; Prettenhofer, P.; Weiss, R.; Dubourg, V.; et al. Scikit-Learn: Machine Learning in Python. J. Mach. Learn. Res. 2012, 12. [Google Scholar] [CrossRef]
  11. Chawla, N.V.; Bowyer, K.W.; Hall, L.O.; Kegelmeyer, W.P. SMOTE: Synthetic Minority Over-Sampling Technique. J. Artif. Intell. Res. 2002, 16, 321–357. [Google Scholar] [CrossRef]
  12. Brownlee, J. SMOTE for Imbalanced Classification with Python. Mach. Learn. Mastery 2020. Available online: https://machinelearningmastery.com/smote-oversampling-for-imbalanced-classification/ (accessed on 1 November 2021).
  13. Rossman, L.; Woo, H.; Tryby, M.; Shang, F.; Janke, R.; Haxton, T. EPANET 2.2 User Manual; U.S. Environmental Protection Agency: Washington, DC, USA, 2020; EPA/600/R-20/133. [Google Scholar]
  14. Ciaponi, C.; Creaco, E. Comparison of Pressure-Driven Formulations for WDN Simulation. Water 2018, 10, 523. [Google Scholar] [CrossRef]
  15. Klise, K.A.; Bynum, M.; Moriarty, D.; Murray, R. A Software Framework for Assessing the Resilience of Drinking Water Systems to Disasters with an Example Earthquake Case Study. Environ. Model. Softw. 2017, 95, 420–431. [Google Scholar] [CrossRef] [PubMed]
Figure 1. Network topologies of: (a) Mourati zone; (b) C-town benchmark EPANET model.
Environsciproc 21 00037 g001aEnvironsciproc 21 00037 g001b
Figure 2. (a) Probability of main pipes per material; (b) Cumulative probability of main pipes per material.
Environsciproc 21 00037 g002
Figure 3. (a) ROC curves and (b) heatmap of kNN-R model; (c) ROC curve and (d) heatmap of DTR model.
Environsciproc 21 00037 g003
Figure 4. Performance of pipe replacement strategies and replacement budget.
Environsciproc 21 00037 g004
Table 1. Mean values, confidence intervals (CI) and other statistics of performance for each strategy and replacement budget, from the 100 Monte Carlo realizations.
ML ModelkNN-RDTR
Budget10%15%20%10%15%20%
Mean9.81%14.62%21.98%14.33%23.27%31.47%
CI 50%9.21%13.55%21.56%14.36%23.69%32.18%
CI 95%15.48%20.52%29.68%20.58%31.58%38.53%
CI 5%5.45%9.96%15.59%7.16%15.30%22.03%
Max21.93%27.10%34.12%24.07%36.81%46.05%
Min4.03%8.78%12.97%2.36%5.43%14.92%
Range17.90%18.32%21.15%21.71%31.38%31.13%
Std3.32%3.59%4.38%4.02%5.43%5.55%
Publisher’s Note: MDPI stays neutral with regard to jurisdictional claims in published maps and institutional affiliations.