Abstract
This study suggests a rapid methodology to delineate areas prone to flood using machine learning techniques. Based on available historically flooded areas, the model employs and combines globally collectible and reproducible conditioning factors to analyze flood susceptibility. The flood inventory map includes historically flooded areas from 1920 that occurred over the study area—Southern Italy. The impact of each factor is examined using correlation attribute evaluation and information gain ratio, while the performances of the model are evaluated by using area under receiving operating characteristics. Findings demonstrate that machine learning models can help in quick flood-prone areas analysis, especially in areas where flood hazard maps are not available.
1. Introduction
Flood hazard maps influence risk reduction and appropriate land use planning. In Italy, they are traditionally obtained through hydrologic–hydraulic modelling. However, due to the complexity of natural phenomena, even the most detailed models adopt simplifications to reproduce the inundation process [1]. The lack of available economic resources does not allow the study of all the critical cases on the territory. Therefore, flood hazard studies are usually limited to main rivers or specific tributaries, leaving a significant part of the territory unclassified. The spreading of machine learning applications, together with the acquisition of data from multiple sources, has given new potential to flood risk mapping, allowing the identification of areas most susceptible to flooding based on geomorphological characterization [2,3,4,5]. To achieve flood risk assessment at a large scale, this study suggests a flood susceptibility mapping based on machine learning techniques in a GIS (Geographic Information System) environment. The procedure is applied to the homogeneous physiographic units into which the study area is divided. For each unit, the model identifies flood-prone areas by analyzing the relationships between the past flood events and their environmental conditioning factors. Thus, flood modelling is formulated as a binary pattern recognition problem in which areas are divided into prone and no-prone to flood. The proposed approach allows a first identification of critical studies, which can then be the subject of more detailed analysis, leading to a better complementary understanding of the existing flood hazard maps, which remain the official normative reference.
2. Materials and Methods
2.1. Study Area
The study area (∼84,338 km2) includes five regions in Southern Italy: Basilicata, Calabria, Campania, Puglia, and Sicilia. It coincides with the area of interest of “PON Governance e Capacità Istituzionale 2014–2020” project, developed by the Italian Civil Protection National Department (http://governancerischio.protezionecivile.gov.it/pon-governance accessed on 1 July 2022). The study area was divided into homogenous territorial units (Figure 1). Starting from the existing scientific literature on territorial subdivision (altimetric [6], idro-morphologic [7], and geomorphologic [8]) the choice fell on the classification proposed by ISPRA (Istituto Superiore per la Protezione e la Ricerca Ambientale) in the so-called «Carta dei Tipi e delle Unità Fisiografiche dei Paesaggi Italiani» [9], part of the “Nature Map” 1:250,000 scale, as one of the most complete methods to identify homogenous areas. This use in the field of flood susceptibility is a promising innovation [10].
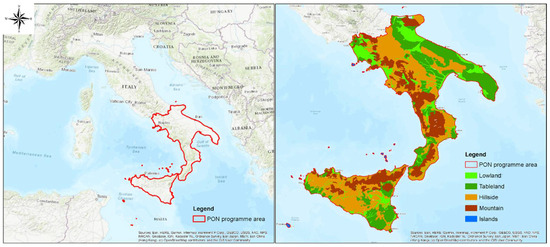
Figure 1.
Homogenous territorial units for the study area.
2.2. Flood Inventory Map and Flood Conditioning Factors
A significant effort was devoted to the construction of a database of the available records of flooding episodes over the study area to derive a map of historically flooded area. A total of over 200 flood events, corresponding to almost 1259 km2 of historically inundated areas, have been collected (PON Governance e Capacità Istituzionale 2014–2020—Attività A21 “Potenziamento dei sistemi di previsione e di allertamento: mappatura della pericolosità dei fenomeni idrogeologici e idraulici non analizzati nei PAI e/o PGRA”). The historical flooded areas were converted into a binary map, assigned code 1 for flooded areas and code 0 for potentially non-floodable areas. The latter are defined as the external part of the so-called “maximum potentially floodable areas”, which derive from the union of flooded areas, flood hazard maps, alluvial deposits, slope (<30°) and 7 out of 10 most flooded types of geomorphons [8]. An extensive review of the literature was useful to extract the 13 most influential conditioning factors on flooding, whose ranking was based on an “Analytical Hierarchy Process” (AHP), a common multi-criteria decision-making technique [11]. These are: geomorphons, land cover (CLC), hydrologic soil group (HSG), curve number (CN), physiographic types of landscape, curvature, elevation, distance to the river, relative elevation, geomorphic flood index (GFI), slope, stream power index (SPI), and topographic wetness index (TWI).
2.3. Deep Neural Network
We employed a statistical model, namely TabNet (Attentive Interpretable Tabular Learning) [12]. It is an algorithm of a deep neural network (DNN) developed by the research department of Google Cloud AI (https://cloud.google.com/blog/products/ai-machine-learning/ml-model-tabnet-is-easy-to-use-on-cloud-ai-platform accessed on 1 July 2022), with an open-source version directly implementable in Python (https://github.com/dreamquark-ai/tabnet accessed on 1 July 2022). The model employs conditioning factors to predict flood susceptibility in a certain zone, providing an index between 0 and 1, which is interpreted as a probability of the zone to be prone to flood. To avoid overfitting, the dataset was partitioned into 3 sets: training set (used to train the model), validation set (used to adjust the hyperparameters) and testing set (used to evaluate generalization ability).
2.4. Performance Criteria
The flood susceptibility analysis implemented in the study defines a hierarchy based on the predisposing factors’ relative importance in flood triggering for each physiographic unit. This importance, also called “Average Merit”, was examined using correlation attribute evaluation and information gain ratio, analyzing the relation between observations and conditioning factors [13]. Additionally, a correlation analysis (both Pearson and Spearman) between the predisposing factors was made to avoid the repetition and the redundant increase of variables, which lead to a rise of the model’s complexity and its instability. The quality of each binary classifier was evaluated using the area under the curve (AUC) of the receiver operating characteristic (ROC) curves that represent a good measure of performance, widely used in susceptibility analysis.
3. Results and Discussion
Table 1 shows the results of the testing phase, the combination of the four most important predisposing factors for each territory. The conclusion of this analysis coincided with the elaboration of a susceptibility flood index that associates an “a priori” probability based on morphological characteristics of each single territorial element, as shown in Figure 2.

Table 1.
Best predisposing factors’ combinations for each territorial unit.
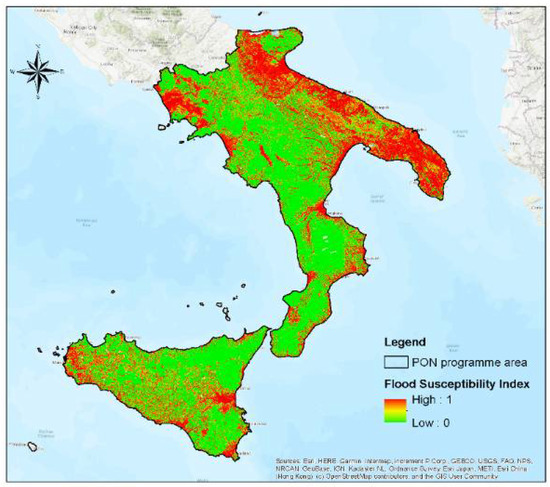
Figure 2.
Flood susceptibility index for the study area.
4. Conclusions
The results of the flood susceptibility mapping through the TabNet neural network are therefore consistent both with the inventoried inundations events and with the delimitation of hydraulic hazard maps. The method therefore constitutes an efficient way to identify the flood-prone areas, a useful tool for civil protection planning and a promising integration to evaluate the hydrogeologic risk. We suggest a deepening of this important and underestimated issue, in order to build classes concretely related to the flood susceptibility characteristics of the area. The ability to correctly classify the territory is found to be heavily related to the delineation of the potentially non-floodable areas (0), although their proper definition is often a neglected issue. Therefore, future developments may include alternative methodologies (such as marginal hazard areas) as part of the creation of the potentially non-floodable areas.
Author Contributions
Conceptualization (G.M., S.M., M.D.V. and D.F.B.); methodology (F.B.); software (F.B.); validation (G.M. and S.M.); formal analysis (F.B.); investigation (F.B., M.D.V., M.A.P., D.S. and D.P.); resources (G.M.); data curation (F.B., M.D.V., M.A.P., D.S. and D.P.); writing—original draft preparation (F.B., M.D.V. and D.P.); writing—review and editing (all the authors); visualization (F.B., M.D.V., M.A.P., D.S. and D.P.); supervision (G.M., S.M. and M.D.V.); project administration (G.M. and S.M.); funding acquisition (G.M., S.M. and D.F.B.). All authors have read and agreed to the published version of the manuscript.
Funding
This research was funded by Programme to support the improvement of governance in relation to the reduction of hydrogeological and hydraulic risk for civil protection purposes under the “PON Governance e Capacità Istituzionale 2014–2020”.
Institutional Review Board Statement
Not applicable.
Informed Consent Statement
Not applicable.
Data Availability Statement
Not applicable.
Acknowledgments
The authors would like to thank the Italian Department of Civil Protection, the “Agenzia per la Coesione Territoriale”, the five Regions involved in the Project (Basilicata, Calabria, Campania, Puglia, Sicilia, the “Commissione tecnica interistituzionale”, and “Consiglio Nazionale delle Ricerche e RTI Fondazione CIMA”.
Conflicts of Interest
The authors declare no conflict of interest.
References
- Manfreda, S.; Samela, C. A digital elevation model based method for a rapid estimation of flood inundation depth. J. Flood Risk Manag. 2019, 12, e12541. [Google Scholar] [CrossRef]
- Chen, W.; Hong, H.; Li, S.; Shahabi, H.; Wang, Y.; Wang, X.; Ahmad, B.B. Flood susceptibility modelling using novel hybrid approach of reduced-error pruning trees with bagging and random subspace ensembles. J. Hydrol. 2019, 575, 864–873. [Google Scholar] [CrossRef]
- Wang, Y.; Hong, H.; Chen, W.; Li, S.; Panahi, M.; Khosravi, K.; Shirzadi, A.; Shahabi, H.; Panahi, S.; Costache, R. Flood susceptibility mapping in Dingnan County (China) using adaptive neuro-fuzzy inference system with biogeography based optimization and imperialistic competitive algorithm. J. Environ. Manag. 2019, 247, 712–729. [Google Scholar] [CrossRef] [PubMed]
- Tehrany, M.S.; Pradhan, B.; Mustafa, N.J. Flood susceptibility mapping using a novel ensemble weights-of-evidence and support vector machine models in GIS. J. Hydrol. 2014, 512, 332–343. [Google Scholar] [CrossRef]
- Tehrany, M.S.; Pradhan, B.; Shattri, M.; Noordin, A. Flood susceptibility assessment using GIS-based support vector machine model with different kernel types. Catena 2015, 125, 91–101. [Google Scholar] [CrossRef]
- ISTAT. Circoscrizioni Statistiche (Metodi e Norme). Serie C, 1958, n. 1, agosto 1958. Available online: https://ebiblio.istat.it/SebinaOpac/resource/circoscrizioni-statistiche/IST0011217 (accessed on 1 July 2022).
- Versace, P.; Ferrari, E.; Fiorentino, M.; Gabriele, S.; Rossi, F. La valutazione delle piene in Calabria. Cosenza, 1989. Available online: http://www.idrologia.polito.it/gndci/rapportiPdf/Vapi_Nazionale.pdf (accessed on 1 July 2022).
- Jasiewicz, J.; Stepinski, T.F. Geomorphons—A pattern recognition approach to classification and mapping of landforms. Geomorphology 2013, 182, 147–156. [Google Scholar] [CrossRef]
- Amadei, M.; Bagnaia, R.; Lureti, L.; Lugeri, F.; Lugeri, N.; Feoli, E.; Dragan, M.; Fernetti, M.; Oriolo, G. Il Progetto Carta della Natura alla Scala 1:250.000: Metodologia di Realizzazione. 2003. Available online: https://www.isprambiente.gov.it/contentfiles/00003500/3552-manuali-2003-17.pdf/ (accessed on 1 July 2022).
- Balestra, F. Flood Susceptibility Mapping Using a Deep Neural Network Model: The Case Study of Southern Italy. Master’s Thesis, Politecnico di Milano, Milano, Italy, 2022. Available online: https://www.politesi.polimi.it/handle/10589/187572 (accessed on 1 July 2022).
- Souissi, D.; Zouhri, L.; Hammami, S.; Msaddek, M.H.; Zghibi, A.; Dlala, M. GIS-Based MCDM—AHP Modeling for Flood Susceptibility Mapping of Arid Areas, Southeastern Tunisia. Geocarto Int. 2020, 35, 991–1017. [Google Scholar] [CrossRef]
- Arik, S.Ö.; Pfister, T. TabNet: Attentive Interpretable Tabular Learning. In Proceedings of the Thirty-Fifth AAAI Conference on Artificial Intelligence, online, 2–9 February; pp. 6679–6687.
- Islam, A.R.M.T.; Talukdar, S.; Mahato, S.; Kundu, S.; Eibek, K.U.; Pham, Q.B.; Kuriqi, A.; Linh, N.T.T. Flood susceptibility modelling using advanced ensemble machine learning models. Geosci. Front. 2020, 12, 101075. [Google Scholar] [CrossRef]


Disclaimer/Publisher’s Note: The statements, opinions and data contained in all publications are solely those of the individual author(s) and contributor(s) and not of MDPI and/or the editor(s). MDPI and/or the editor(s) disclaim responsibility for any injury to people or property resulting from any ideas, methods, instructions or products referred to in the content. |
© 2022 by the authors. Licensee MDPI, Basel, Switzerland. This article is an open access article distributed under the terms and conditions of the Creative Commons Attribution (CC BY) license (https://creativecommons.org/licenses/by/4.0/).