Abstract
Membrane fouling still remains a drawback for membrane bioreactors; there is nevertheless a natural promising solution which is the growth of filamentous microorganisms in moderate concentrations. In this project, an innovative 25 L membrane bioreactor is used, consisting of two aerated tanks and a membrane tank. The first tank is supplied with high Food/Microorganism (F/M) loading and the second tank with very low loading. The aerated tanks were constantly provided with dissolved oxygen (DO) 2.5 ± 0.5 mg/L. Finally, it is concluded that the imposed aeration conditions contribute to the growth and control of filaments in moderate concentrations having a filamentous index = 2 and therefore reducing membrane fouling for more than 1.5 months, maintaining the trans-membrane pressure at 1.4 ± 0.11 kPa.
1. Introduction
Membrane bioreactors (MBR) constitute an advanced wastewater treatment technology over conventional activated sludge processes, however, membrane fouling remains the basic obstacle preventing their universal application [1]. Extended research has been carried out to investigate methods for membrane fouling reduction [2,3,4]. One issue that has particularly preoccupied the research community is determining the optimal range of Food/Microorganism (F/M) loading and DO values. One of the optimal solutions was found to be the regulation of F/M and dissolved oxygen (DO) values aiming to develop and control the filamentous microorganisms in moderate concentrations, which will eventually contribute to efficient membrane fouling reduction by increasing the porosity of sludge [5].
In more detail, according to the research conducted on the correlation between F/M and DO values with filamentous microorganisms’ growth and membrane fouling, the following conclusions have been drawn. Liao et al. [6] investigated filament growth in mesophilic and thermophilic sludge under different conditions and reported that an increase in the DO levels from 1–2.5 mg/L to 3.5–5.7 mg/L also led to an increase in the filament level. Guo et al. [7] found that the filamentous Phylum specific Subdivision 1 (morphotype: Type 0041) and Candidatus M. parvicella were mainly acquainted with low DO values. Moreover, according to Guo et al. [8], the sludge volume index (SVI) could remain under 250 mL/g and filament index (FI) under two when organic sludge loading rates ranged from 0.22 to 0.35 kg COD(Chemical Oxygen Demand)/kg MLSS(Mixed Liquor Suspended Solids)/d at low DO concentrations (0.5–1 mg/L). Chua et al. [9] found that the specific growth rate of filamentous Nocardia amarae was found to be much higher than that of non-filamentous bacteria when F/M was lower than 0.5 mg BOD(Biochemical Oxygen Demand)/mg MLSS/d. Based on that fact, they reported that filamentous overgrowth is able to occur in activated sludge under the usual F/M range of 0.2–0.6 mg BOD/mg MLSS/d.
According to Banti et al. [5], the filamentous bacterial population was adjusted by modifying the MBR set-up, where the aerated bioreactor was divided into two in-series aerated chambers. When a food to microorganisms (F/M) ratio of between 0.4 and 0.5 g COD/g MLSS*d and a dissolved oxygen concentration of 0.5 ± 0.3 mg/L was applied in the first chamber, the filamentous index (FI) ranged between two and three, and the activated sludge presented high porosity, thus resulting in low trans-membrane pressure (TMP) and reversible membrane fouling. In the second chamber, the dissolved oxygen concentration was adjusted to 2.5 ± 0.5 mg/L and the F/M ratio ranged between 0.01 and 0.02 g COD/g MLSS*d, resulting in an overall F/M ratio within the typical range of 0.08–0.10 g COD/g MLSS*d. Thus, further filamentous bacteria growth was inhibited. Finally, TMP was controlled within the range of 2–2.5 kPa for over three months. Therefore, reversible and irreversible membrane fouling was controlled successfully. Nevertheless, further research is needed in order to define the optimal range of F/M and DO values, aiming to achieve the growth and control of filamentous in moderate concentrations and therefore to reduce efficiently the membrane fouling.
Therefore, the aim of this work was to investigate the optimal range of F/M and DO values in order to control the filament growth in moderate concentrations.
2. Materials and Methods
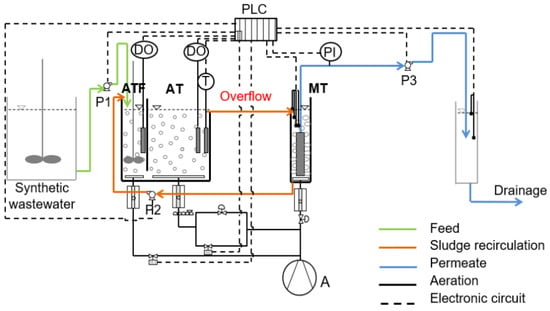
An innovative semi-pilot membrane bioreactor of 25 L was used, consisting of two in-series aerated tanks that are followed by a membrane tank, as is depicted in Figure 1. More specifically, the aeration part of the filamentous MBR (20 L) is divided into two chambers, the first aeration tank of filamentous growth (ATF) of working volume 5 L and the second aeration tank (AT) of working volume 15 L. The dissolved oxygen for both the aerated chambers was regulated at 2.5 ± 0.5 mg/L.

Figure 1.
Flowchart of the filamentous membrane bioreactor (MBR) showing the biological reactor divided into two in-series tanks, the tank of filamentous growth (ATF) (5 L) and aerated tank (AT) (15 L) and membrane tank (MT) (5 L) that follows. PLC: Programmable Logic Controller, CO: Air Compressor, DO: Dissolved Oxygen controller, PI: Pressure Indicator, P1: raw synthetic wastewater feed pump (Qin = 0.9 L/h), Ρ2: activated sludge recirculation pump (Qr = 2.2 L/h), Ρ3: effluent pump (Qeff = 1.1 L/h).
The membrane tank (MT) contains a submerged hydrophilic flat sheet A4 microfiltration (MF) membrane module (Table 1). The MBR was constantly fed with synthetic municipal wastewater. The synthetic wastewater contained the following concentrations [5,10]: 500 mg/L glucose, 500 mg/L corn starch, 200 mg/L NH4Cl, 56 mg/L peptone, 53 mg/L KH2PO4, 18 mg/L MgSO4·7H2O, 7.32 mg/L MnSO4·H2O, and 1.1 mg/L FeSO4·7H2O. In addition, NaHCO3 at a concentration of 240 mg/L was used to maintain the pH between 7.0 and 7.5 in both bioreactors. At the beginning of the experiment, the bioreactors were filled with activated sludge obtained from a full-scale municipal wastewater treatment plant in Thessaloniki and was acclimated gradually to synthetic wastewater over two weeks. The COD value of synthetic municipal wastewater was 878 ± 130 mg/L, while the MLSS concentration was 4700 ± 1300 mg/L. The first aerated tank (ATF) was supplied with high Food/Microorganisms (F/M) loading values of 0.8 ± 0.3 g COD/g MLSS*d and the second chamber with very low F/M loading of 0.004 ± 0.001 g COD/g MLSS*d.

Table 1.
Specifications of the hydrophilic membrane.
The MBR included a dissolved oxygen meter, three peristaltic pumps, an air compressor, a pressure indicator and a thermometer. A Programmable Logic Controller (PLC) system (Eutech Instruments) was used to monitor the reactor performance through Supervisory Control And Data Acquisition (SCADA) software (Simantec, Siemens). The parameters used for online control and evaluation of the system’s operation included temperature, DO concentration, TMP, influent, recirculation and effluent flow rates.
The Filamentous Index (FI) is a measure of filamentous microorganism populations within activated sludge and was measured according to the method proposed by Eikelboom [11,12]. A scale of 0–5 is used from none to infinite filaments. There is a difference of approximately a factor of 10 between the consecutive FI classes. The number of filaments is quantified visually, and it is a quick method that provides information relevant to sludge characteristics. When the FI is equal to 1 or 2, the effect of the filaments on the settling velocity of the sludge is slight. When the FI is 3, the settling properties are often significantly deteriorated. Bulking usually occurs at FI values greater than 3. A Light Sheet Microscope (LSM, Observer Z1, Zeiss, Oberkochen, Germany) is used in 50×, 100× and 200× magnification to define FI for samples taken from the AT. A ZEN imaging software is employed to process and analyze the images, creating JPEG image files of the optical microscopic images.
3. Results and Discussion
The characteristics of influent wastewater as well as the effluent characteristics are presented in Table 2. According to the results, the COD removal was particularly high, reaching 98.3%. The nitrification process via conversion of NH4-N to NO3-N was successful, reaching 99.9% removal. It should be noted that the MBR unit does not include a denitrification section, and therefore the nitrogen removal is solely attributed to biosynthesis.

Table 2.
Physicochemical characteristics of influent and effluent wastewater.
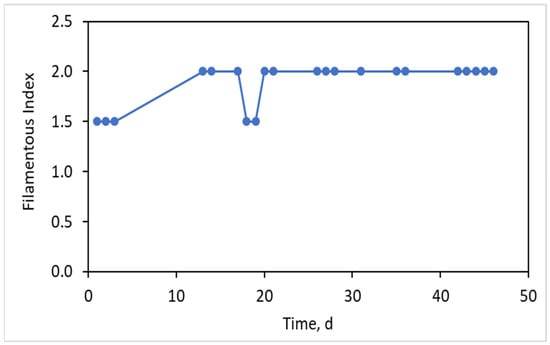
The values of filamentous index for the activated sludge as a function of the MBR operating time are presented in Figure 2. It was observed that the FI was initially equal to 1.5 and then it increased to 2, where it remained constant for about 40 days. Therefore, by dividing the single aerated tank into two individual aerated tanks (ATF and AT) with high F/M loading of 0.8 ± 0.3 g COD/g MLSS*d in the ATF and very low F/M loading of 0.004 ± 0.001 g COD/g MLSS*d in the AT and maintaining the DO at 2.5 ± 0.5 mg/L in both tanks, the maintenance of filamentous bacteria in moderate concentrations of FI = 1.5–2.0 can be achieved. Moreover, the previous research of Banti et al. [5] has been enriched with the conclusion that the filamentous population can be kept at the desired concentrations when DO in the ATF chamber is controlled in the range 0.5–2.5 mg/L.

Figure 2.
Filamentous Index (FI) as a function of time.
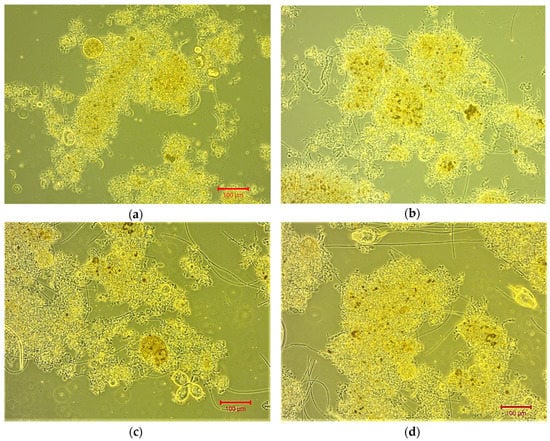
Figure 3 presents optical microscopy images where the sparse development of short filamentous microorganisms at points on the outer surface of sludge flocs is detected. According to these images, the mild increase in sludge porosity as a result of filaments presence can be further understood. The sludge porosity contributes to membrane fouling reduction, pre-filtering the sludge before it passes through the membrane.

Figure 3.
Optical microscopy of sludge flocs and filamentous bacteria as seen through a Light Sheet Microscope at 100× magnification for (a) FI = 1.5 on day 3, (b) FI = 2 on day 42, (c) and (d) FI = 2 on day 46.
Moreover, it is worth noting that in Figure 3, higher-level microorganisms such as protozoa and rotifiers are also found. Specifically, Figure 3c identifies a small colony of stalked ciliates that are unicellular microorganisms that grow on stems or myomas and have the ability to quickly retract like a spring. Figure 3d shows some protozoan swimming ciliates which are, also, unicellular microorganisms covered with lashes or capillary extensions [13]. The dark brown color inside some sludge bioflocs indicates sludge condensate.
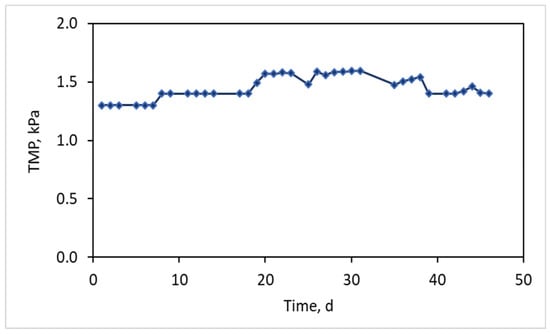
Finally, throughout the 45 days of MBR operation the trans-membrane pressure was maintained at consistently low values of 1.4 ± 0.11 kPa, as is depicted in Figure 4, verifying that the low filamentous index contributes to membrane fouling reduction. At the same time, high quality effluent was produced with COD outflow = 15 ± 6.5 mg/L.

Figure 4.
Typical trans-membrane pressure (TMP) graph as a function of MBR operation.
4. Conclusions
An innovative semi-pilot 25 L membrane bioreactor was used, consisting of two in-series aerated tanks that are followed by a membrane tank. The first aerated tank (ATF) was supplied with high Food/Microorganisms (F/M) loading values of 0.8 ± 0.3 g COD/g MLSS*d and the second one (AT) with very low F/M loading values of 0.004 ± 0.001 g COD/g MLSS*d. The membrane bioreactor was fed with synthetic wastewater that simulates domestic wastewater having a COD inflow = 878 ± 130 mg/L. The two aerated tanks were constantly provided with dissolved oxygen (DO) equal to 2.5 ± 0.5 mg/L, while the wastewater treatment process was carried out for more than 1.5 months. Finally, it was concluded that the filament population was maintained in moderate concentrations, with FI = 1.5–2.0, under the abovementioned operating conditions. Correlating this result with the previous results of the research team it is concluded that the filamentous population can be kept in the desired concentrations when DO in the ATF chamber is controlled in the range 0.5–2.5 mg/L. The increase in activated sludge porosity due to the filamentous growth contributed efficiently to the membrane fouling reduction by pre-filtering the sludge before it passes through the membrane, maintaining the TMP consistently at low values of 1.4 ± 0.11 kPa. At the same time, high quality effluent was produced with COD outflow = 15 ± 6.5 mg/L.
Author Contributions
Writing—original draft preparation, D.C.B.; writing—review and editing, D.C.B.; MBR supervision, D.C.B., A.T.; optical microscopy, D.C.B.; physicochemical analysis, A.T.; supervision, M.M., P.S.; funding acquisition, P.S. All authors have read and agree to the published version of the manuscript.
Funding
This research was funded by the European Union and Greek national funds through the Operational Program Competitiveness, Entrepreneurship and Innovation, under the call Research—Create—Innovate (project code: T1EDK-04370, Reduction of membrane fouling in membrane bioreactors by controlled growth of filamentous microorganisms, FILLAMENTMBR).
Conflicts of Interest
The authors declare no conflict of interest.
References
- Meng, F.; Zhang, S.; Oh, Y.; Zhou, Z.; Shin, H.S.; Chae, S.R. Fouling in membrane bioreactors: An updated review. Water Res. 2017, 114, 151–180. [Google Scholar] [CrossRef] [PubMed]
- Banti, D.C.; Samaras, P.; Tsioptsias, C.; Zouboulis, A.; Mitrakas, M. Mechanism of SMP aggregation within the pores of hydrophilic and hydrophobic MBR membranes and aggregates detachment. Sep. Purif. Technol. 2018, 202, 119–129. [Google Scholar] [CrossRef]
- Kampouris, I.D.; Karayannakidis, P.D.; Banti, D.C.; Sakoula, D.; Konstantinidis, D.; Yiangou, M.; Samaras, P.E. Evaluation of a novel quorum quenching strain for MBR biofouling mitigation. Water Res. 2018, 143, 56–65. [Google Scholar] [CrossRef] [PubMed]
- Gkotsis, P.; Banti, D.; Peleka, E.; Zouboulis, A.; Samaras, P. Fouling Issues in Membrane Bioreactors (MBRs) for Wastewater Treatment: Major Mechanisms, Prevention and Control Strategies. Processes 2014, 2, 795–866. [Google Scholar] [CrossRef]
- Banti, D.C.; Karayannakidis, P.D.; Samaras, P.; Mitrakas, M.G. An innovative bioreactor set-up that reduces membrane fouling by adjusting the filamentous bacterial population. J. Membr. Sci. 2017, 542, 430–438. [Google Scholar] [CrossRef]
- Liao, B.Q.; Lin, H.J.; Langevin, S.P.; Gao, W.J.; Leppard, G.G. Effects of temperature and dissolved oxygen on sludge properties and their role in bioflocculation and settling. Water Res. 2011, 45, 509–520. [Google Scholar] [CrossRef] [PubMed]
- Guo, J.; Peng, Y.; Wang, S.; Yang, X.; Wang, Z.; Zhu, A. Stable limited filamentous bulking through keeping the competition between floc-formers and filaments in balance. Bioresour. Technol. 2012, 103, 7–15. [Google Scholar] [CrossRef] [PubMed]
- Guo, J.H.; Peng, Y.Z.; Peng, C.Y.; Wang, S.Y.; Chen, Y.; Huang, H.J.; Sun, Z.R. Energy saving achieved by limited filamentous bulking sludge under low dissolved oxygen. Bioresour. Technol. 2010, 101, 1120–1126. [Google Scholar] [CrossRef] [PubMed]
- Chua, H.; Yu, P.; Sin, S.; Tan, K. Effect of Food:Microorganism Ratio in Activated Sludge Foam Control. In Twenty-First Symposium on Biotechnology for Fuels and Chemicals; Humana Press: Totowa, NJ, USA, 2000; pp. 1127–1135. [Google Scholar]
- Zhou, L.; Zhang, Z.; Meng, X.; Fan, J.; Xia, S. New insight into the effects of Ca(II) on cake layer structure in submerged membrane bioreactors. Biofouling 2014, 30, 571–578. [Google Scholar] [CrossRef] [PubMed]
- Jenkins, D.; Richard, M.; Daigger, G. Manual on the Causes and Control of Activated Sludge Bulking, Foaming and other Solids Separation Problems, 3rd ed.; CRC Press: Boca Raton, FL, USA, 2003; ISBN 9781843390466. [Google Scholar]
- Eikelboom, D.H. Process Control of Activated Sludge Plants by Microscopic Investigation, 1st ed.; IWA Publishing: London, UK, 2000; ISBN 900222 29 9. [Google Scholar]
- Davies, P.S. The Biological Basis of Wastewater Treatment, 3rd ed.; Strathkelvin Instruments Ltd.: Motherwell, UK, 2005. [Google Scholar]
Publisher’s Note: MDPI stays neutral with regard to jurisdictional claims in published maps and institutional affiliations. |
© 2020 by the authors. Licensee MDPI, Basel, Switzerland. This article is an open access article distributed under the terms and conditions of the Creative Commons Attribution (CC BY) license (https://creativecommons.org/licenses/by/4.0/).