Next Article in Journal
Temperature Impact on Drinking Water Consumption
Previous Article in Journal
Investigation and Assessment of the Management of Natural Resources in the State of California Using the Conceptual Framework of Water–Energy–Food Nexus
 
 
Please note that, as of 4 December 2024, Environmental Sciences Proceedings has been renamed to Environmental and Earth Sciences Proceedings and is now published here.
Proceeding Paper

Flow Field Research of the Reciprocating Baffled Flocculation Tank †

1
School of Energy and Architectural Engineering, Harbin University of Commerce, No.1 Xue hai Street, Harbin 150028, China
2
Key Laboratory of Cold Region Urban and Rural Human Settlement Environment Science and Technology, Ministry of Industry and Information Technology, School of Architecture, Harbin Institute of Technology, Harbin 150090, China
3
School of Civil Engineering, Institute of Artificial Environment Control and Energy Application, Northeast Forestry University, No. 26 Hexing Road Xiangfang District, Harbin 150040, Heilongjiang Province, China
*
Author to whom correspondence should be addressed.
Presented at the 4th EWaS International Conference: Valuing the Water, Carbon, Ecological Footprints of Human Activities, Online, 24–27 June 2020.
Environ. Sci. Proc. 2020, 2(1), 29; https://doi.org/10.3390/environsciproc2020002029
Published: 18 August 2020

Abstract

:
To research the reasons for the unsatisfactory hydraulic conditions of the reciprocating baffled flocculation tank, this paper investigates its flow field through PIV (Particle Image Velocimetry) laboratory experiment tests and numerical simulation. Three numerical schemes, the standard model, RNG model and realizable model, are calibrated and validated with the experimental data gained in this study. They are adopted for comparative study of their validity and accuracy for modeling the effect of the hydraulic characteristics of the flow field on flocculation. The best validated model is then applied to explain the reasons for the low flocculation efficiency and is applied to improve the structure of the reciprocating baffled flocculation tank.

1. Introduction

In the conventional surface water treatment process, flocculation is one of the very important procedures [1,2], and it has wide applications to encourage the transfer of destabilized colloidal particles into contact with one another inside a certain type of flocculating reactor, producing larger floc aggregates with certain irregular and fractal structure [3]. Reciprocating baffle flocculation tank is a flocculation process that has a long history of application and its design directly affects the effect of water treatment. Due to its many years of operating experience, the flocculation effect works well, the structure is simple, and the management is easy, so it is mostly used in large- and medium-sized water factories. However, there are also some disadvantages such as unsatisfactory hydraulic conditions and excessive proportion of ineffective energy consumption, which also leads to long flocculation time, large tank volume and high infrastructure costs. There are some important impact factors in the process of flocculation, including shear rate [4,5], hydrodynamic conditions [6,7], e.g., pH value, temperature, and addiction [8], e.g., Polyaluminum chloride (PACT) addiction and cationic polyacrylamide (PAM) addition. The shear rate is one of the most important factors in a flocculation structure and also the dominant research parameter in the flocculation process. To research the reasons for the unsatisfactory hydraulic conditions of the reciprocating partition flocculation tank, particle image velocimetry (PIV) has been widely used to explore the characteristics of the reciprocating baffled flocculation tank, such as vortex motion [9] and flocculation structure [10,11] at laboratory scale. The application of computational fluid dynamics (CFD) in simulating flocculation processes has been commonly found at water treatment works to increase understanding of floc formation and dissociation mechanisms [12] and optimize the flocculation tank structure [13]. In recent years, He et al. [14] investigated the impeller clearance and shear rate effects on aggregation and dissociation behaviors in the whole process of flocculation growth and Gao et al. [15] utilized eleven different geometry models to investigate the most effective baffling structures in secondary settling tanks by CFD.
In this paper, the flow field of the reciprocating baffle flocculation tank is taken as the research object, and the effects of the hydraulic characteristics of the flow field on the flocculation effect are thoroughly studied by means of PIV experiments and numerical simulation methods.

2. Experimental Apparatus

The laboratory model is designed according to a practical engineering project. There is a large number of corridors in the original engineering project, and the experimental model will be too large if it completely follows the original engineering design. Besides, the main function of the lab is to test the different flocculation stages. Thus, only two corridors were adopted for each flocculation stage, while the other dimensions were designed with a 1:10 ratio to the prototype. The structural dimensions of the model design are shown in Figure 1. The reciprocating partition flocculation pool is 1.5 m long, 0.81 m wide and 0.28 m high, and two corridors are set up in different flocculation sections, with corridor widths of 0.06, 0.08, 0.10 and 0.13 m, respectively.
The reciprocating baffled flocculation tank is a hydraulic flocculation device that relies on the reciprocity flow of water in the corridor to promote the colloidal particles to collide and gather. In the initial stage of flocculation, the micro-flocculation particles need intense hydraulic action to promote their rapid collision and aggregation. Therefore, the width of the corridor at the beginning is narrow, which makes the water flow velocity and turbulence more intense. As the flocculation process continues, colloidal particles will collide and aggregate into larger flocculated particles, and the strength and compactness of large flocculated particles will be relatively poor. At this time, the excessively strong water flow will make the large flocculated particles broken by the sheer force of the water flow, and the broken flocculated particles are difficult to reassemble into large flocs, which affect the treatment effect of the entire flocculation process. To avoid the above situation, the corridors are gradually widened with the process of the flocculation, which is also the basis of the experimental model corridor width change designed in this project.
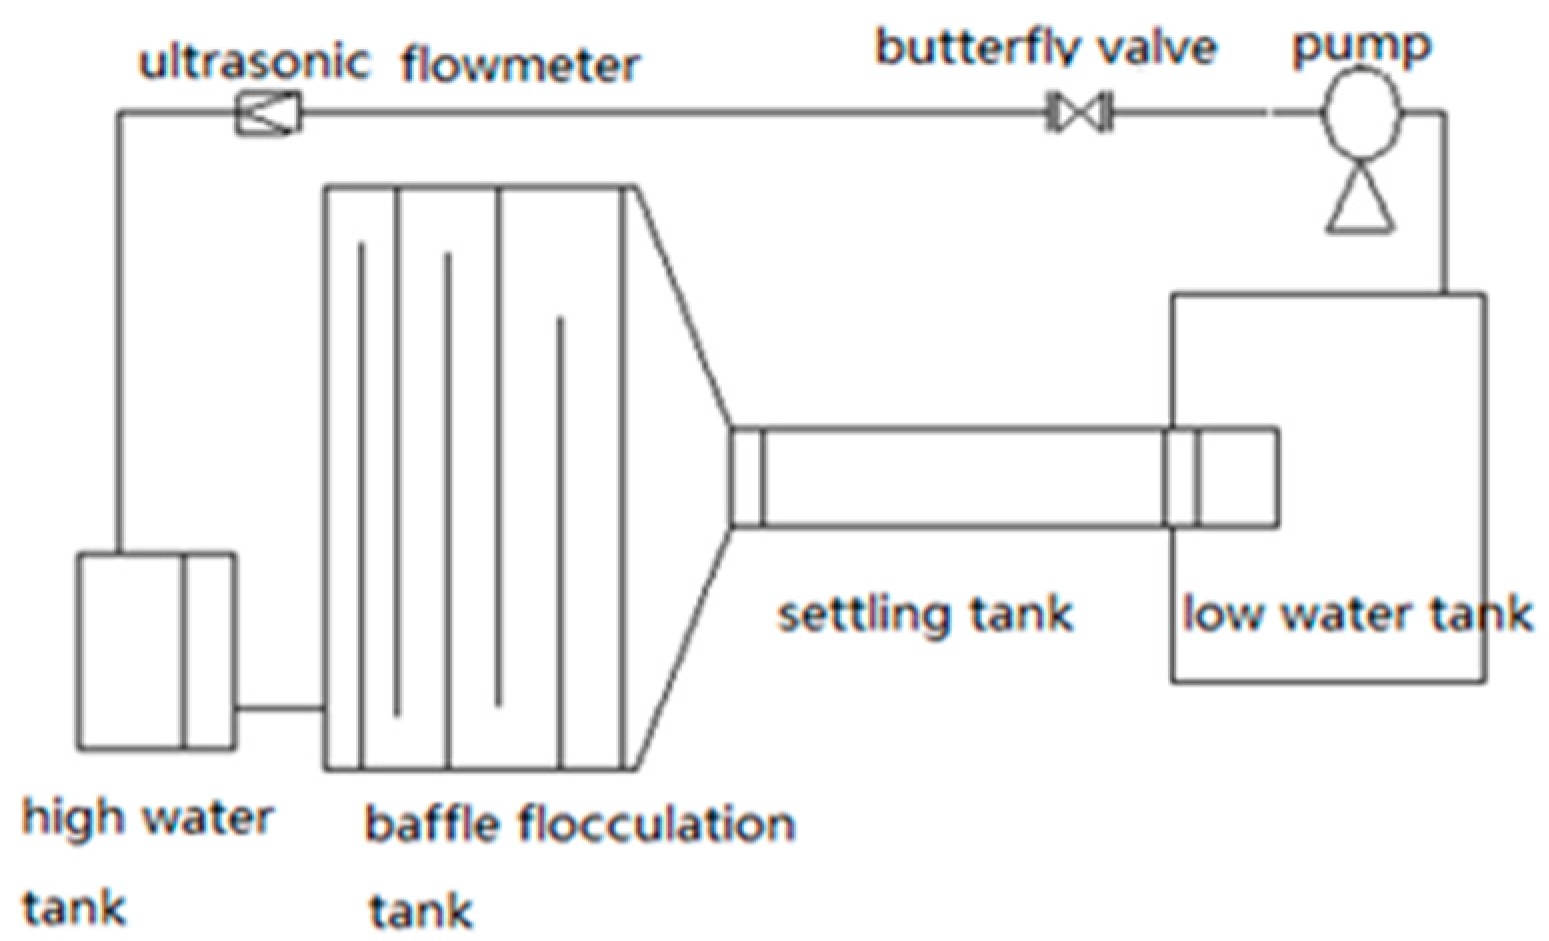
The experimental reciprocating baffle flocculation tank uses a water pump to supply water. The water in the low water tank flows into the high water tank through a pump. The water in the high water tank flows into the reciprocating baffle flocculation tank under the action of gravity. The corridor flows back and forth, enters the advection sedimentation tank after the overflow outlet and finally flows back to the low-level water tank, forming the entire water circulation system. The water is controlled by the valve installed after the pump. The entire reciprocating baffle flocculation tank and the baffle inside are made by plexiglass material, and the thickness is 0.01 m, which is as shown in Figure 2a. The structure diagram and photos of the entire experimental platform are shown in Figure 2b and Figure 3.
The experimental data in this paper were obtained by measuring the flow field using a particle image velocimetry system (PIV) developed by LaVision, Germany. The reciprocating baffle flocculation tank mainly depends on the turning of the corridor to disturb the water flow, which puts the flow field of the reciprocating baffle flocculation tank in a turbulent state. Therefore, this paper mainly measures the flow field in the turning of the corridor of the reciprocating baffle flocculation tank.
The flow field at the turning point of the model corridor of the reciprocating partition flocculation tank was measured at a flow rate of 1.7 L/s. The measurement section was selected at the position of Z = 0.13 m, where the water flow of the reciprocating baffle flocculation tank is in the center of the vertical direction. After the water pump is turned on for about 10 min, the flow of the whole experimental device is steady and the distribution of tracer particles is uniform. Then, use the CCD camera to continuously capture 200 pairs of photos on the measurement section, and use image processing software to perform batch processing to obtain the average velocity distribution of the flow field.
Figure 4 shows the velocity vector diagram of the flow field at the turning points of the fifth and sixth corridors. It can be seen from the Figure 4 that the flow direction of the flow changes 180° due to the transition of the flow field at the turn of the corridor. As the velocity of the water flow decreases toward the outside, the velocity gradient between the inside and the outside of the turn is very large. According to the velocity gradient theory, under such a large speed gradient, the flocculation is greatly promoted.
From the flow fields at the upper left and upper right corners in Figure 4, it can be seen that a “dead water zone” is formed at the right-angle turn of the corridor. It can be clearly seen that the water flow under the inertia will follow the water flow in the corner. Under the effect of shear force, the main stream on the inner side of the turn will drive the outer water flow together. The effect of this shearing force is smaller toward the outside, so the velocity of the water flowing toward the outside is smaller, which is why the gradient of the water flow velocity at the corner of the corridor gradually decreases from the inside to the outside. The water at the right-angle turn of the corridor is the farthest away from the inside, where it is hardly affected by the sheer force of the inside water flow, so the water flow is almost in a stagnant state, forming a so-called “dead water zone”.
Figure 5 shows an enlarged image of the flow field at the turning point of the corridor taken by PIV. From the figure, the visible vortices can be seen through the movement of the tracer particles. This is precisely because the water flow separation occurs when it passes through the baffles, and the drastic change in the direction of the water flow at the turn causes a wake zone where a series of vortices will be formed. According to the vortex theory of flocculation dynamics, floc particles will be affected by the vortex coiling effect, so that greatly increases the collision probability of floc particles, which is conducive to the flocculation process.

3. Numerical Simulations

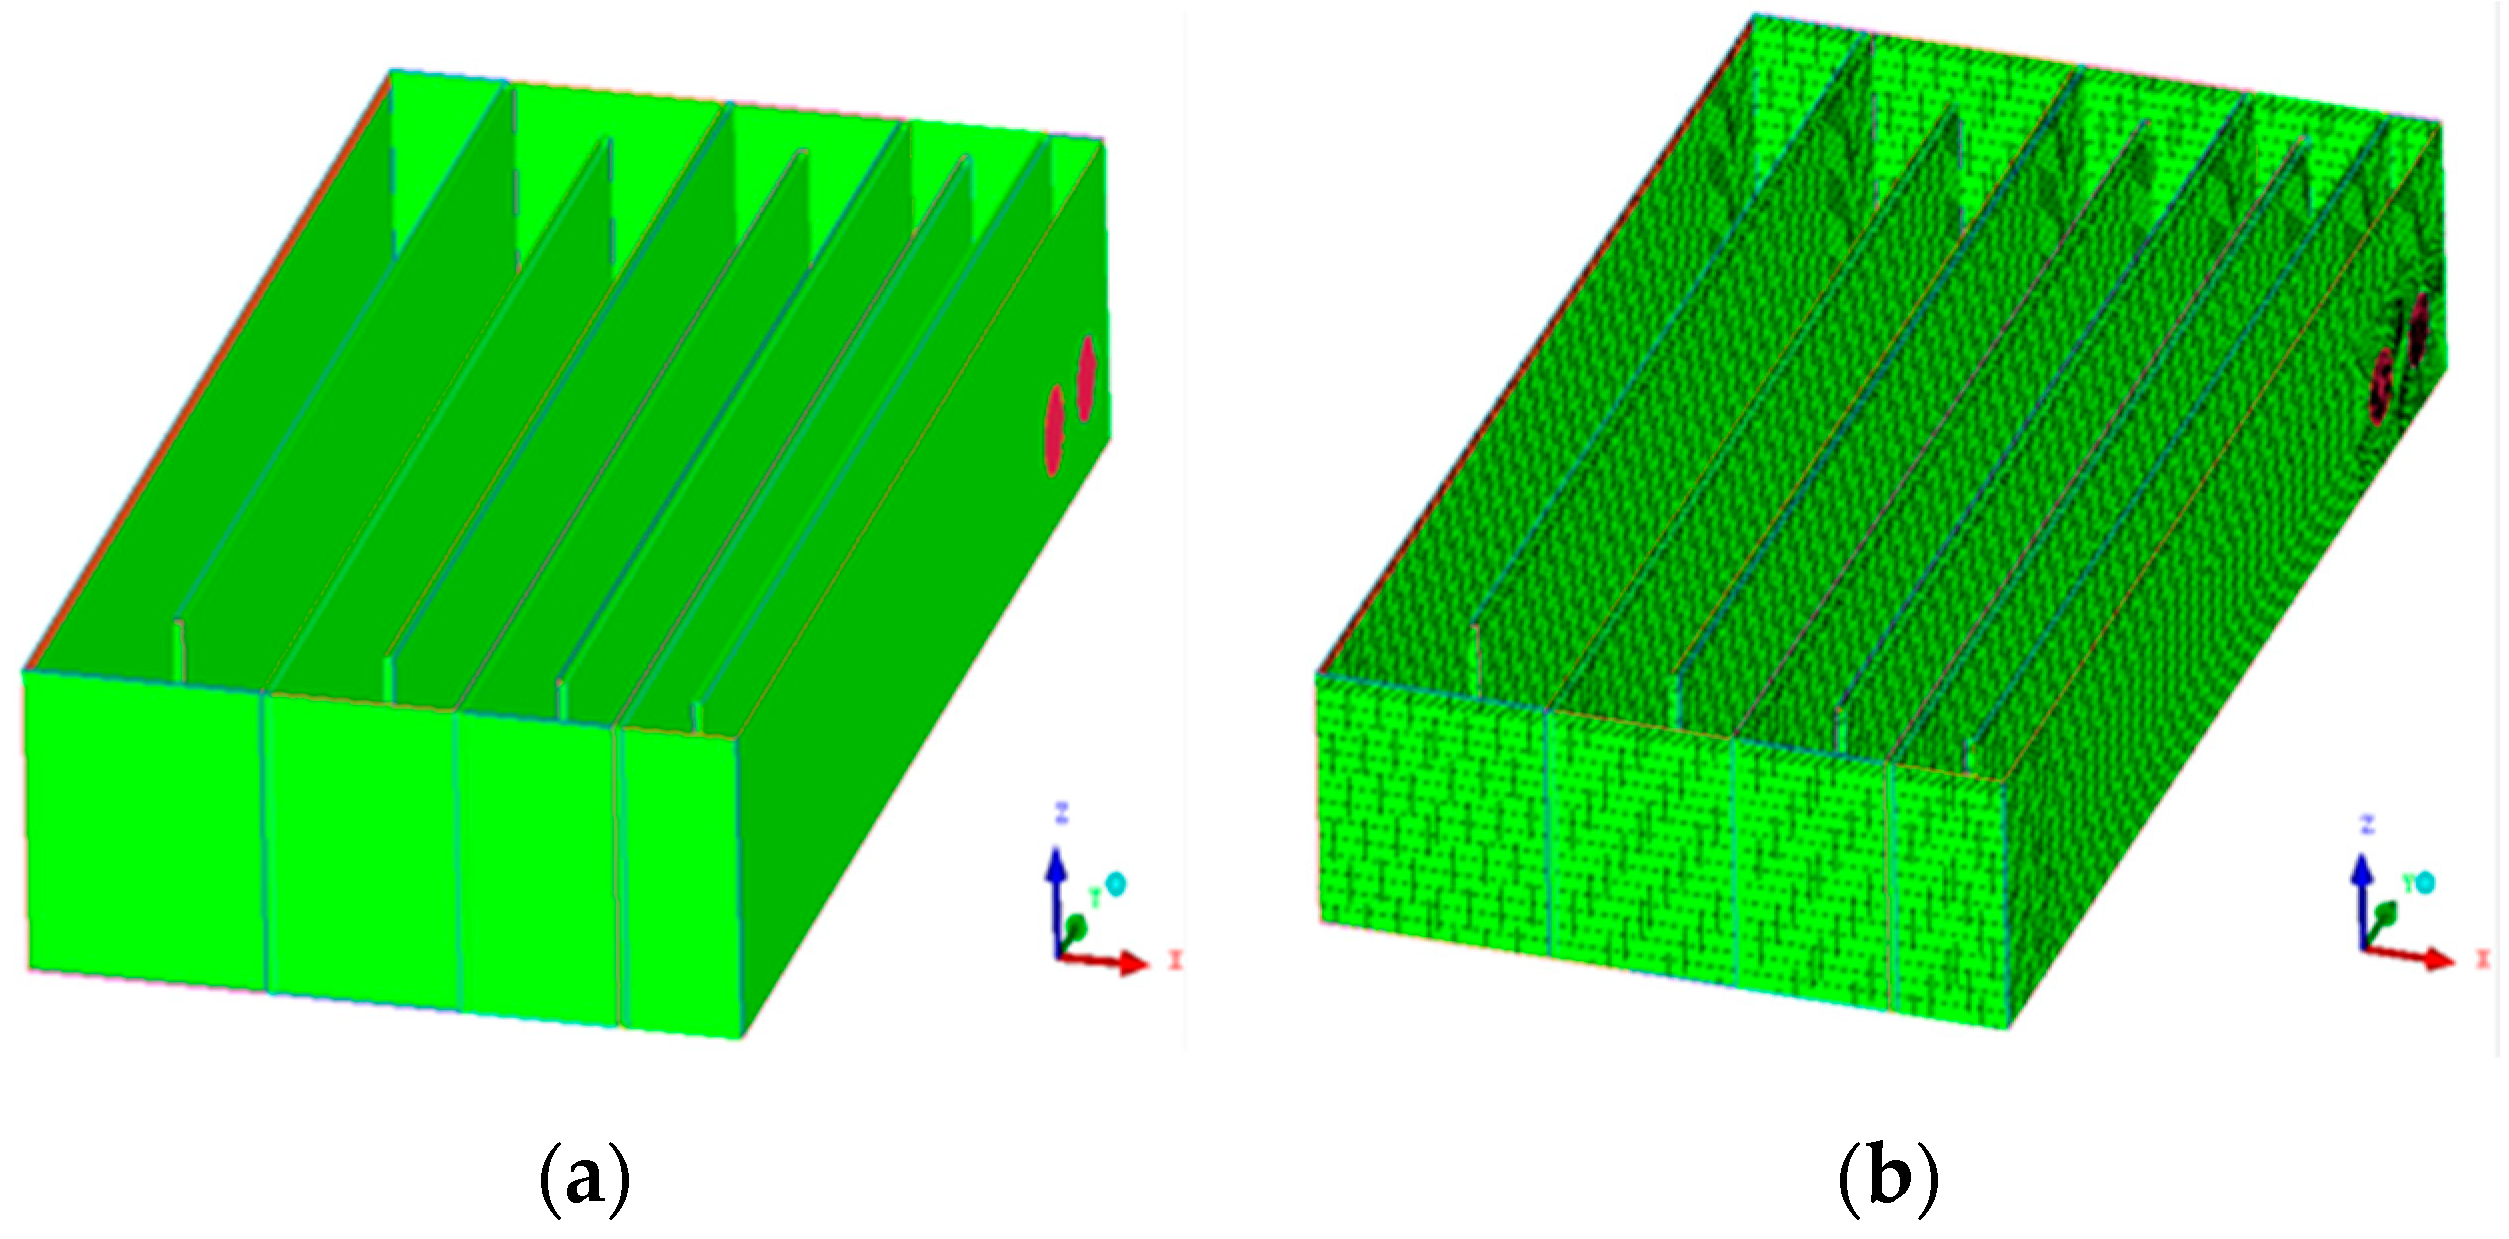
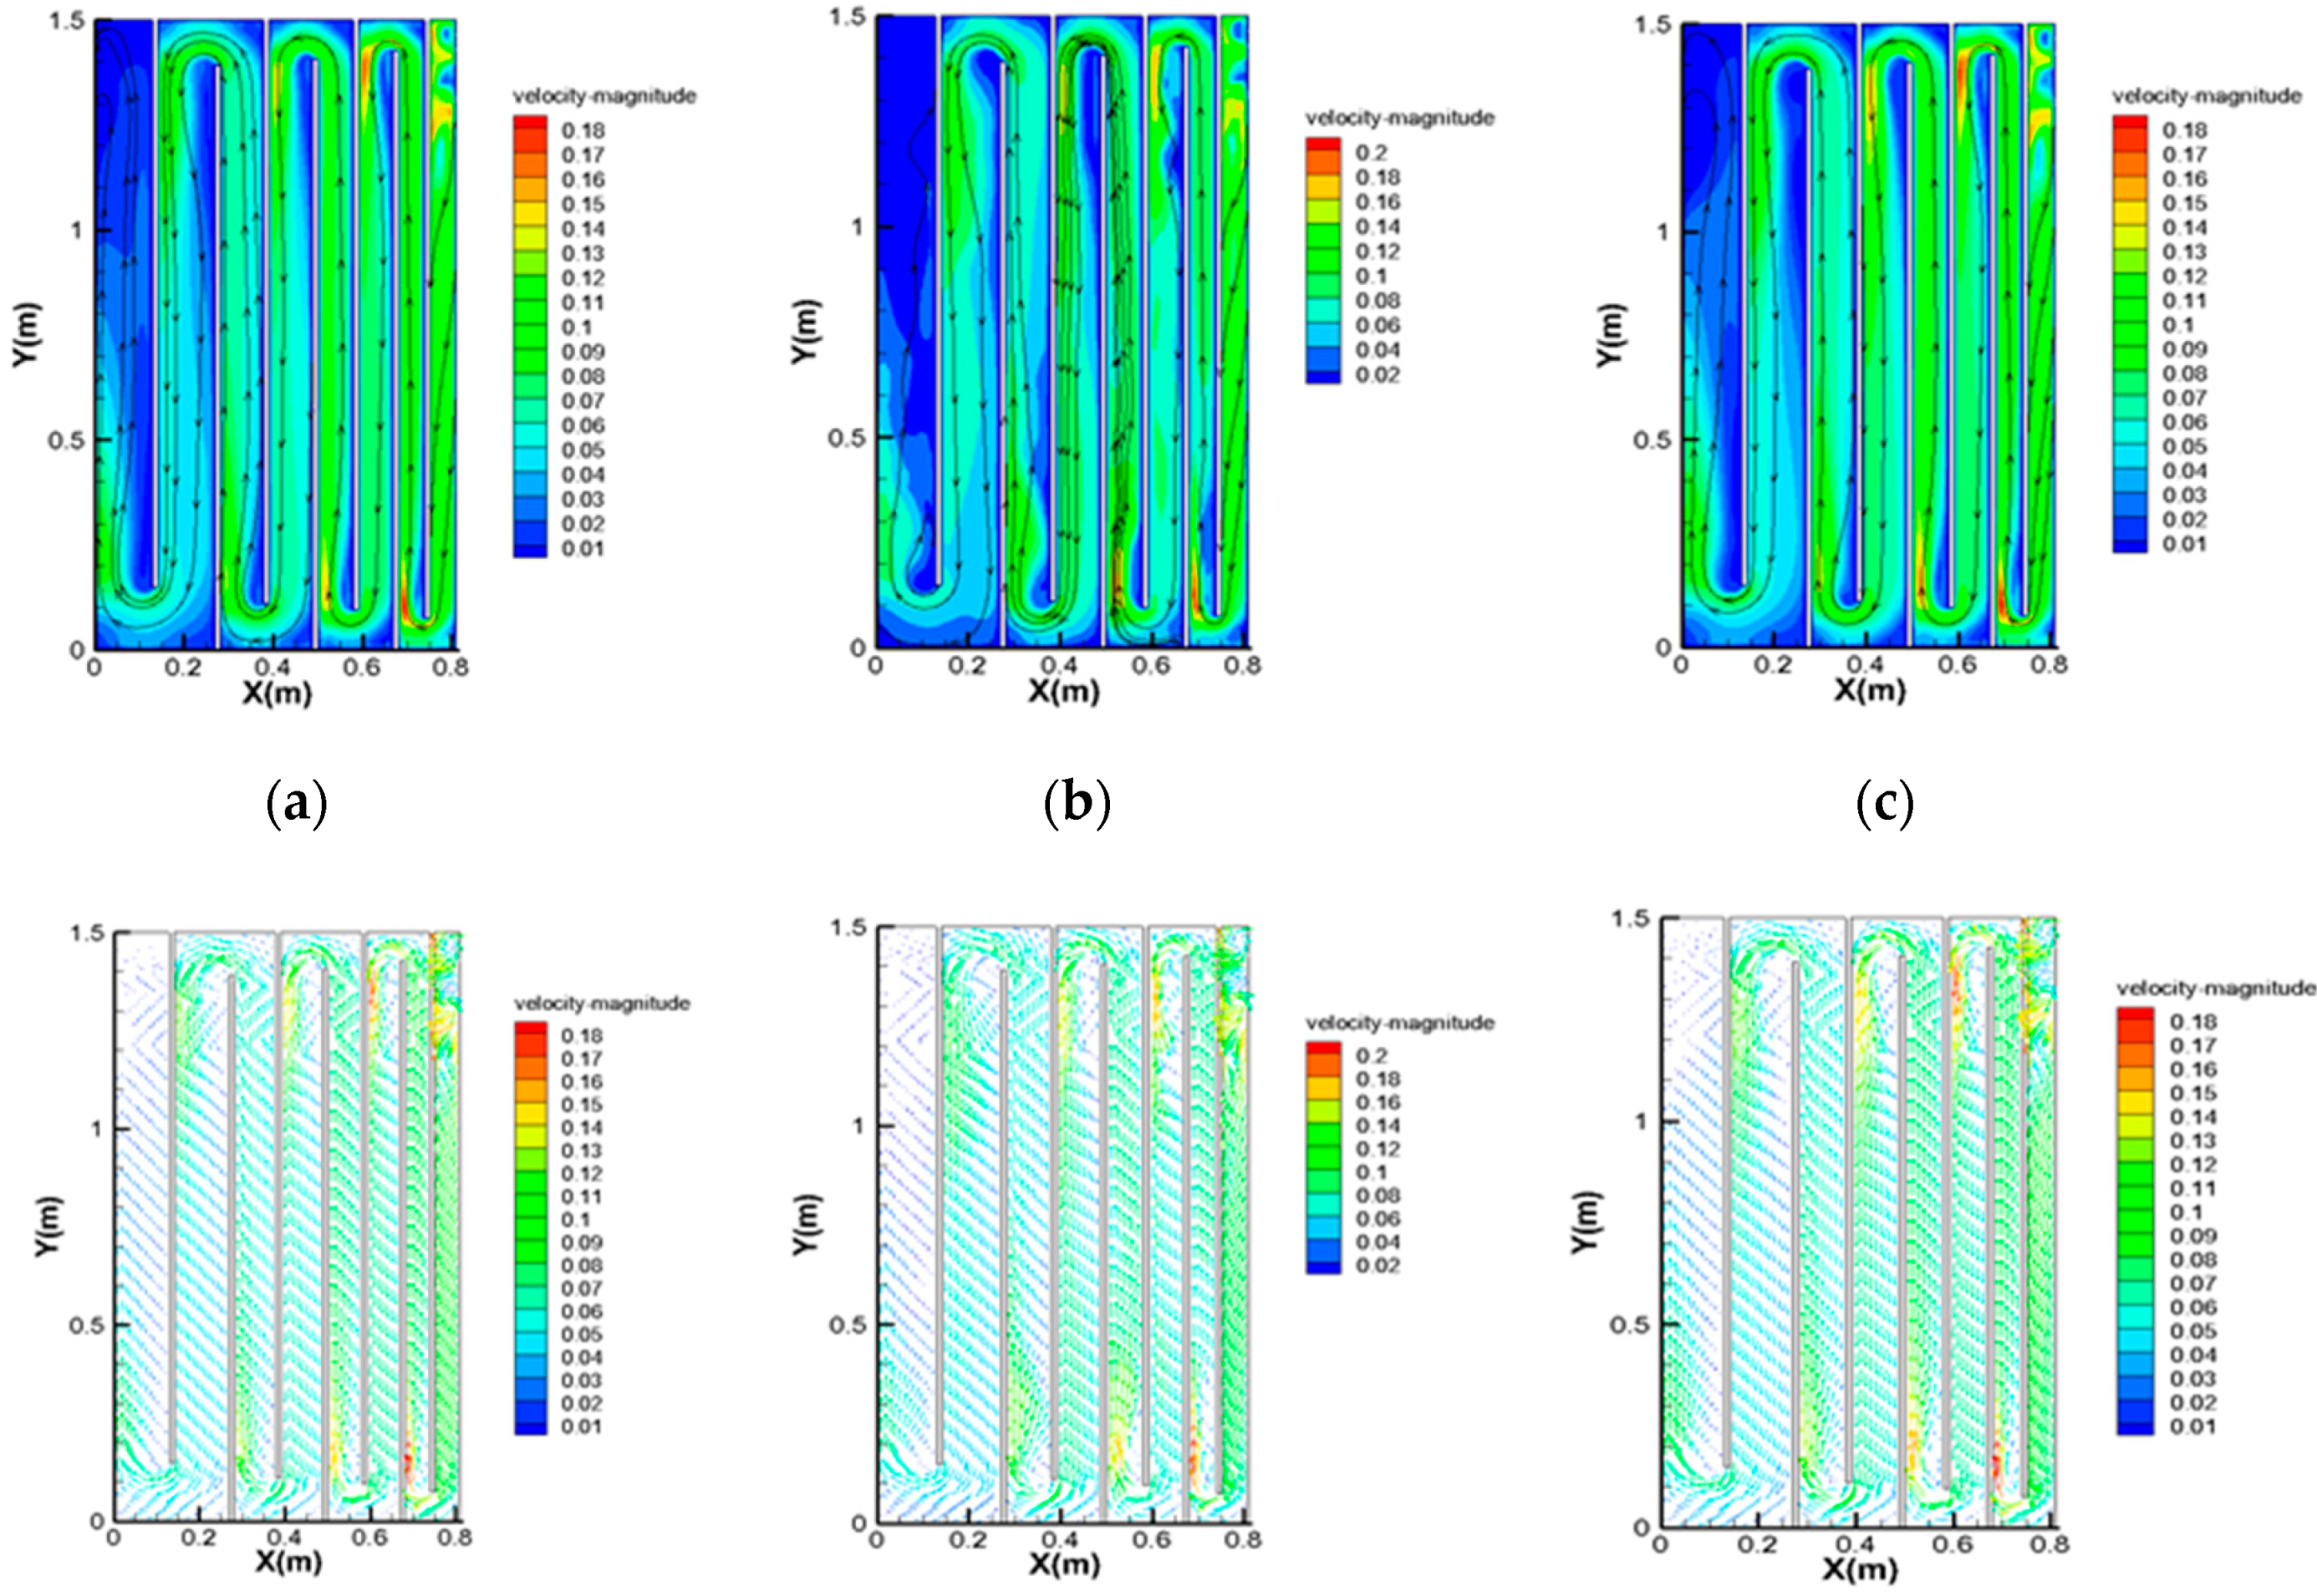
The geometry of the physical model is consistent with the size of the experimental platform, 1.5 m long, 0.81 m wide and 0.28 m high, and a geometric model of the reciprocating baffle flocculation tank shown in Figure 1. Figure 6a,b show the overall situation of the grids of the reciprocating baffle flocculation tank, which is meshed using a structured hex physical mesh, with a mesh number of close to 440,000. To simplify the process of the comparison among the different numerical calculation models, all the parameters are exactly the same except the initial conditions in the process of the numerical simulation. The simulation results of different turbulence models are shown in Figure 7.
From Figure 7 obtained from the simulation calculations, the overall flow trends of the flow fields calculated by the three turbulence models are roughly the same, and there is no big difference. From the velocity cloud diagram, the velocity distribution of the flow field is similar from the standard model and the realizable model. The velocity distribution calculated by the RNG model is significantly different from the other two models. The velocity distribution area calculated by the RNG model is not smooth enough and has some bumps and convenes at the corner. From the observation of the velocity results, it can qualitatively be concluded that the calculation results of the RNG model are relatively poor compared with the other two models.
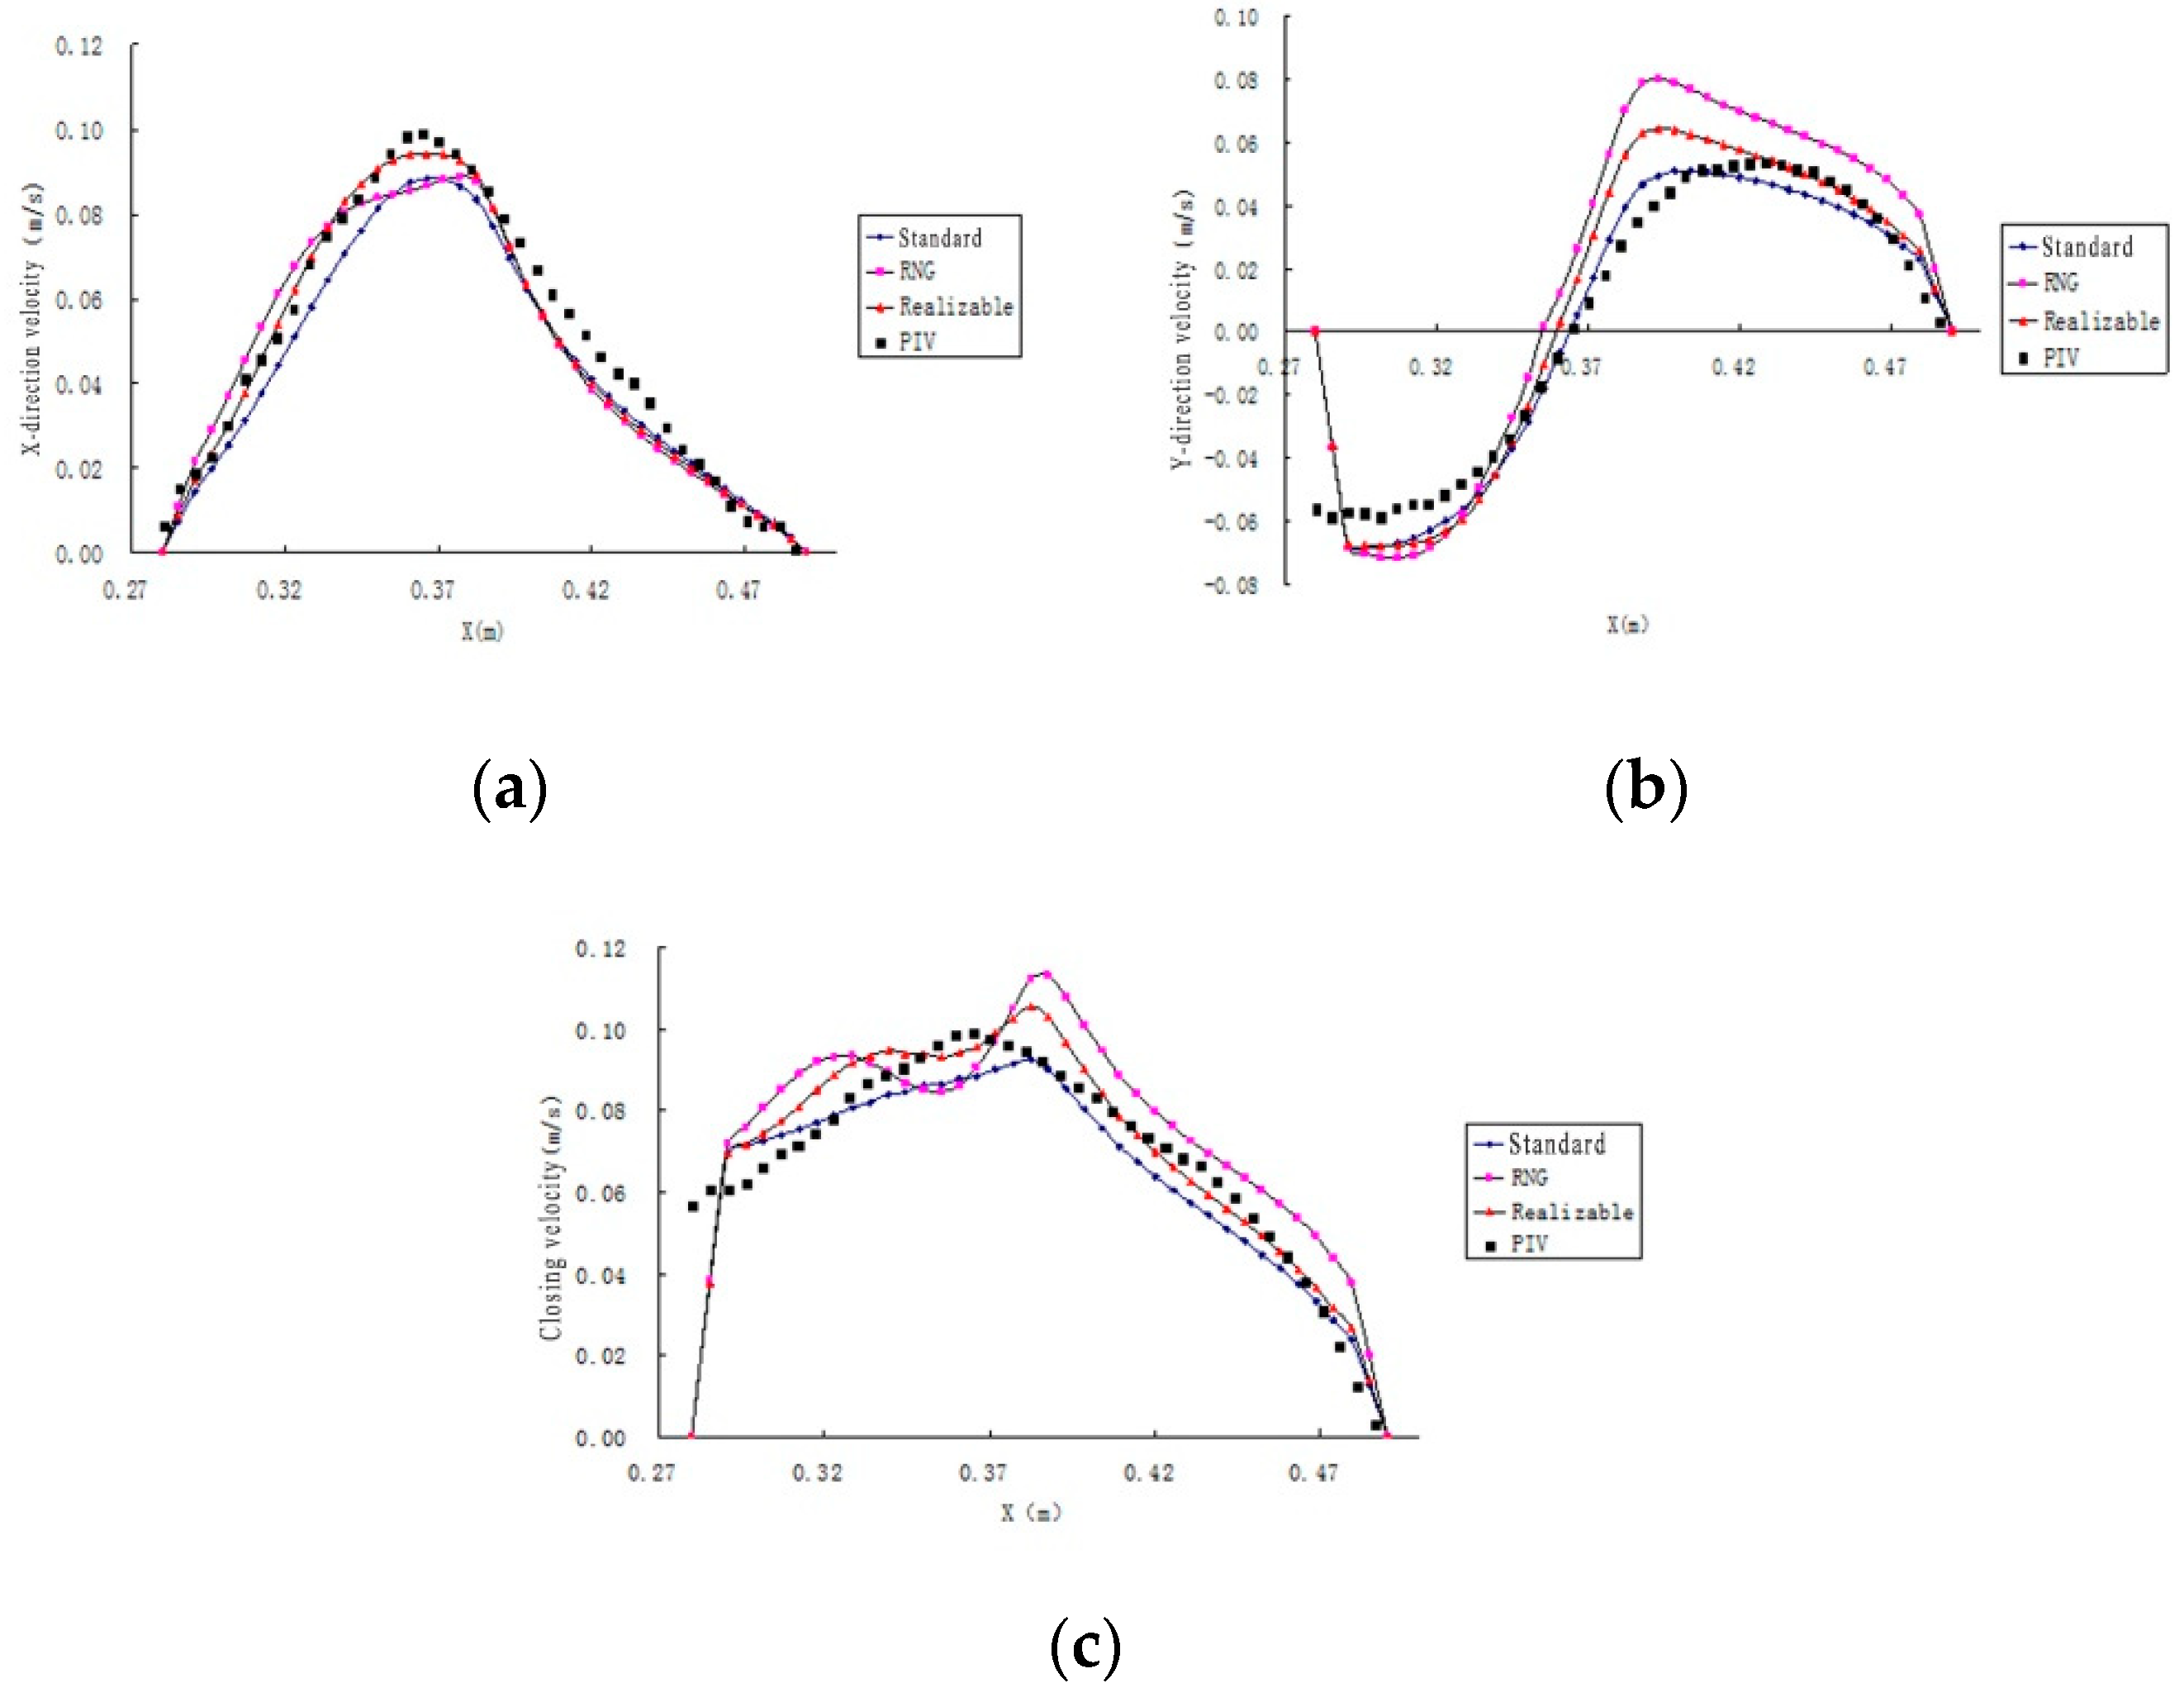
The fifth and sixth corridors are located at the turn of the corridor at Y = 0.08 m. Figure 8 shows the comparison between the simulated and experimental data in the X-direction velocity, the Y-direction velocity and the closing velocity.
From the velocity comparison between the simulation results and the experimental results in the X-direction (Figure 8a), it can be seen that the calculation results of the three models are generally the same as the experimental results. Among them, the simulation results of the standard model are generally lower than the experimental results. The calculation results of the RNG model are significantly different from other models and its maximum calculation value is located in the center. While the other models and experimental results are smooth parabolic, the vertex positions are basically the same and they are all located to the left of the center. The simulation results of the realizable model in the previous section are almost identical to the experimental results, and the velocity in the X-direction of a section after the turn is lower than the experimental results. From the comparison of the velocity in the X-direction, the simulation results of the realizable model are closer to the experimental results.
As for the velocity comparison between the simulation results and the experimental results in the Y-direction (Figure 8b), it can be seen that the overall trend of the distribution of the simulation results and the experimental results in the Y-direction is generally consistent. Compared with the simulation results, the curves of the experimental results are smoother. At the turning point of the corridor, the water flow starts in the negative direction of the Y-direction, and then turns to flow in the positive direction of the Y-direction after turning, so the calculation results are negative in the Y-direction at the beginning stage, and then become positive. It can be seen from the figure that before the turn, the calculation results of the three models are not much different, and the maximum Y-direction velocity is slightly larger than the experimental results. After the turn, the calculation results of the RNG model and the realizable model are significantly different from the experimental results. The positions and sizes of the maximum values are significantly different from the experimental results. In contrast, the calculation results of the standard model are more consistent with the experimental results.
The comparison of the closing velocity of the simulation results and experimental results (Figure 8c) shows that the closing velocity of the calculation results of the RNG model and the realizable model was first increased to the peak and then slightly decreased, and then continued to increase to the maximum and then decreased. The experimental results show the shape of a near parabola, and the maximum value is exactly at the trough position between the two peaks where the RNG model and realizable model calculation results appear. Therefore, the simulation results of the RNG model and realizable model have huge differences with respect to the experiment results. Meanwhile, the overall trend of the calculation results of the standard model is basically the same as the experimental results and the velocity at different positions is basically close to the experimental results, except that the position where the maximum value appears is slightly different from the experimental results.

4. Conclusions

By comprehensively comparing the comparison of simulation and experiment speeds in the X-axis, Y-axis, and closing velocity, it can be seen that the calculation results of the standard model agree better with the results of the PIV experiment, and the accuracy of the numerical simulation results is also verified. Therefore, based on the calculation results of the standard model, the effect of the flow field of the reciprocating partition flocculation tank on the flocculation will be further studied. On the basis of this numerical simulation model, the optimization of the flocculation tank and the best effect of flocculation will be researched further.
The “dead water zone” not only reduces the effective space of the reciprocating partition flocculation tank, greatly reducing the flocculation effect, but also prolongs the flocculation time and increases the daily maintenance and cleaning work. Therefore, eliminating the “dead water zone” of the reciprocating baffle flocculation tank is very beneficial to improve its flocculation effect, which is the focus of the following work.

Author Contributions

Conceptualization, Y.X. and Y.W.; methodology, Y.X. and Q.S.; software, H.L.; validation, Y.X., Q.S. and Y.W.; formal analysis, Y.X.; data curation, H.L.; writing—original draft preparation, Y.X. and H.L.; writing—review and editing, Y.W. and Q.S. All authors have read and agree to the published version of the manuscript.

Funding

This research was funded by the Fundamental Research Funds for the Central Universities, (Grant No 2572018BJ14), National Natural Science Foundation of China (Grant Nos 51808102, 51978202), Science Foundation of Harbin University of Commerce (18XN068) and the Natural Science Fund in Heilongjiang Province (LH2019E111).

Conflicts of Interest

The authors declare no conflict of interest. The funders had no role in the design of the study; in the collection, analyses, or interpretation of data; in the writing of the manuscript, or in the decision to publish the results.

References

  1. Wu, Y.G.; Jiang, X.C.; Ji, Q.J. Research progress of enhanced coagulation technology. Indust. Water Treat. 2005, 23, 9–14. [Google Scholar]
  2. Zhan, X.; Gao, B.Y.; Yue, Q.J.; Wang, Y.; Cao, B.C. Coagulation behavior of polyferric chloride for removing NOM from surface water with low concentration of organic matter and its effect on chlorine decay model. Sep. Purif. Technol. 2010, 75, 61–68. [Google Scholar] [CrossRef]
  3. Jarvis, P.; Jefferson, B.; Gretgory, J.; Palrsons, S. A review of floc strength and breakage. Water Res. 2005, 39, 3121–3137. [Google Scholar] [CrossRef] [PubMed]
  4. Wang, Z.; Nan, J.; Ji, X.; Yang, Y. Effect of the micro-flocculation stage on the flocculation/ sedimentation process: The role of shear rate. Sci. Total Environ. 2018, 633, 1183–1191. [Google Scholar] [CrossRef] [PubMed]
  5. Zhu, Z.F.; Yu, J.S.; Wang, H.R.; Dou, J.; Wang, C. Fractal dimension of cohesive sediment flocs at steady state under seven shear flow conditions. Water 2015, 7, 4385–4408. [Google Scholar] [CrossRef]
  6. Chakrabortia, R.K.; Gardnerb, K.H.; Atkinsona, J.F.; Van Benschoten, J.E. Changes in fractal dimension during aggregation. Water Res. 2003, 37, 873–883. [Google Scholar] [CrossRef]
  7. Gregory, J.; Yukselen, M.A. The reversibility of floc breakage. Int. Miner. Process. 2004, 73, 251–259. [Google Scholar]
  8. Wang, Z.; Nan, J.; Yao, M.; Yang, Y. Effect of additional polyaluminum chloride and polyacrylamide on the evolution of floc characteristics during floc breakage and re-growth process. Sep. Purif. Technol. 2017, 173, 144–150. [Google Scholar] [CrossRef]
  9. Zhan, Y.; An, R.Y.; Wang, J.S. Application of Particle Image Velocimetry Technique in the Flow Field of Reciprocating Baffled Flocculation Tank. In Proceedings of the 2009 International Symposium on Environmental Science and Technology, Wuhan, China, 4–5 July 2009; pp. 1327–1330. [Google Scholar]
  10. Xu, J.; Li, X.Y. Investigation of the effect of nanoparticle exposure on the flocculability of activated sludge using particle image velocimetry in combination with the extended DLVO analysis. Colloids Surf. B Biointerfaces 2016, 143, 382–389. [Google Scholar] [CrossRef] [PubMed]
  11. Xiao, F.; Lam, X.Y.; Zhong, R.S.; Zhang, X.H. PIV characterization of flocculation dynamics and floc structure in water treatment. Colloids Surf. A Physicochem. Eng. Asp. 2011, 379, 27–35. [Google Scholar] [CrossRef]
  12. Bridgeman, J.; Jefferson, B.; Parson, S.A. The development and application of CFD models for water treatment flocculators. Adv. Eng. Softw. 2010, 41, 99–109. [Google Scholar] [CrossRef]
  13. Essemiani, K.; Traversay, C. Optimum design of coagulation/ flocculation vessels. In Proceedings of the WQTC 2002 Conference, Seattle, WA, USA, 2002. [Google Scholar]
  14. He, W.P.; Xie, Z.L.; Zhao, Z.Y.; Huang, M.; Pan, M. Effect of impeller clearance on floc growth behaviors in a baffled square stirred-tank reactor: Flocculation-test and CFD-aided studies. Sep. Purif. Technol. 2019, 212, 233–244. [Google Scholar] [CrossRef]
  15. Gao, H.W.; Stenstrom, M.K. Generalizing the effects of the baffling structures on the buoyancy-induced turbulence in secondary settling tanks with eleven different geometries using CFD models. Chem. Eng. Res. Des. 2019, 143, 215–225. [Google Scholar] [CrossRef]
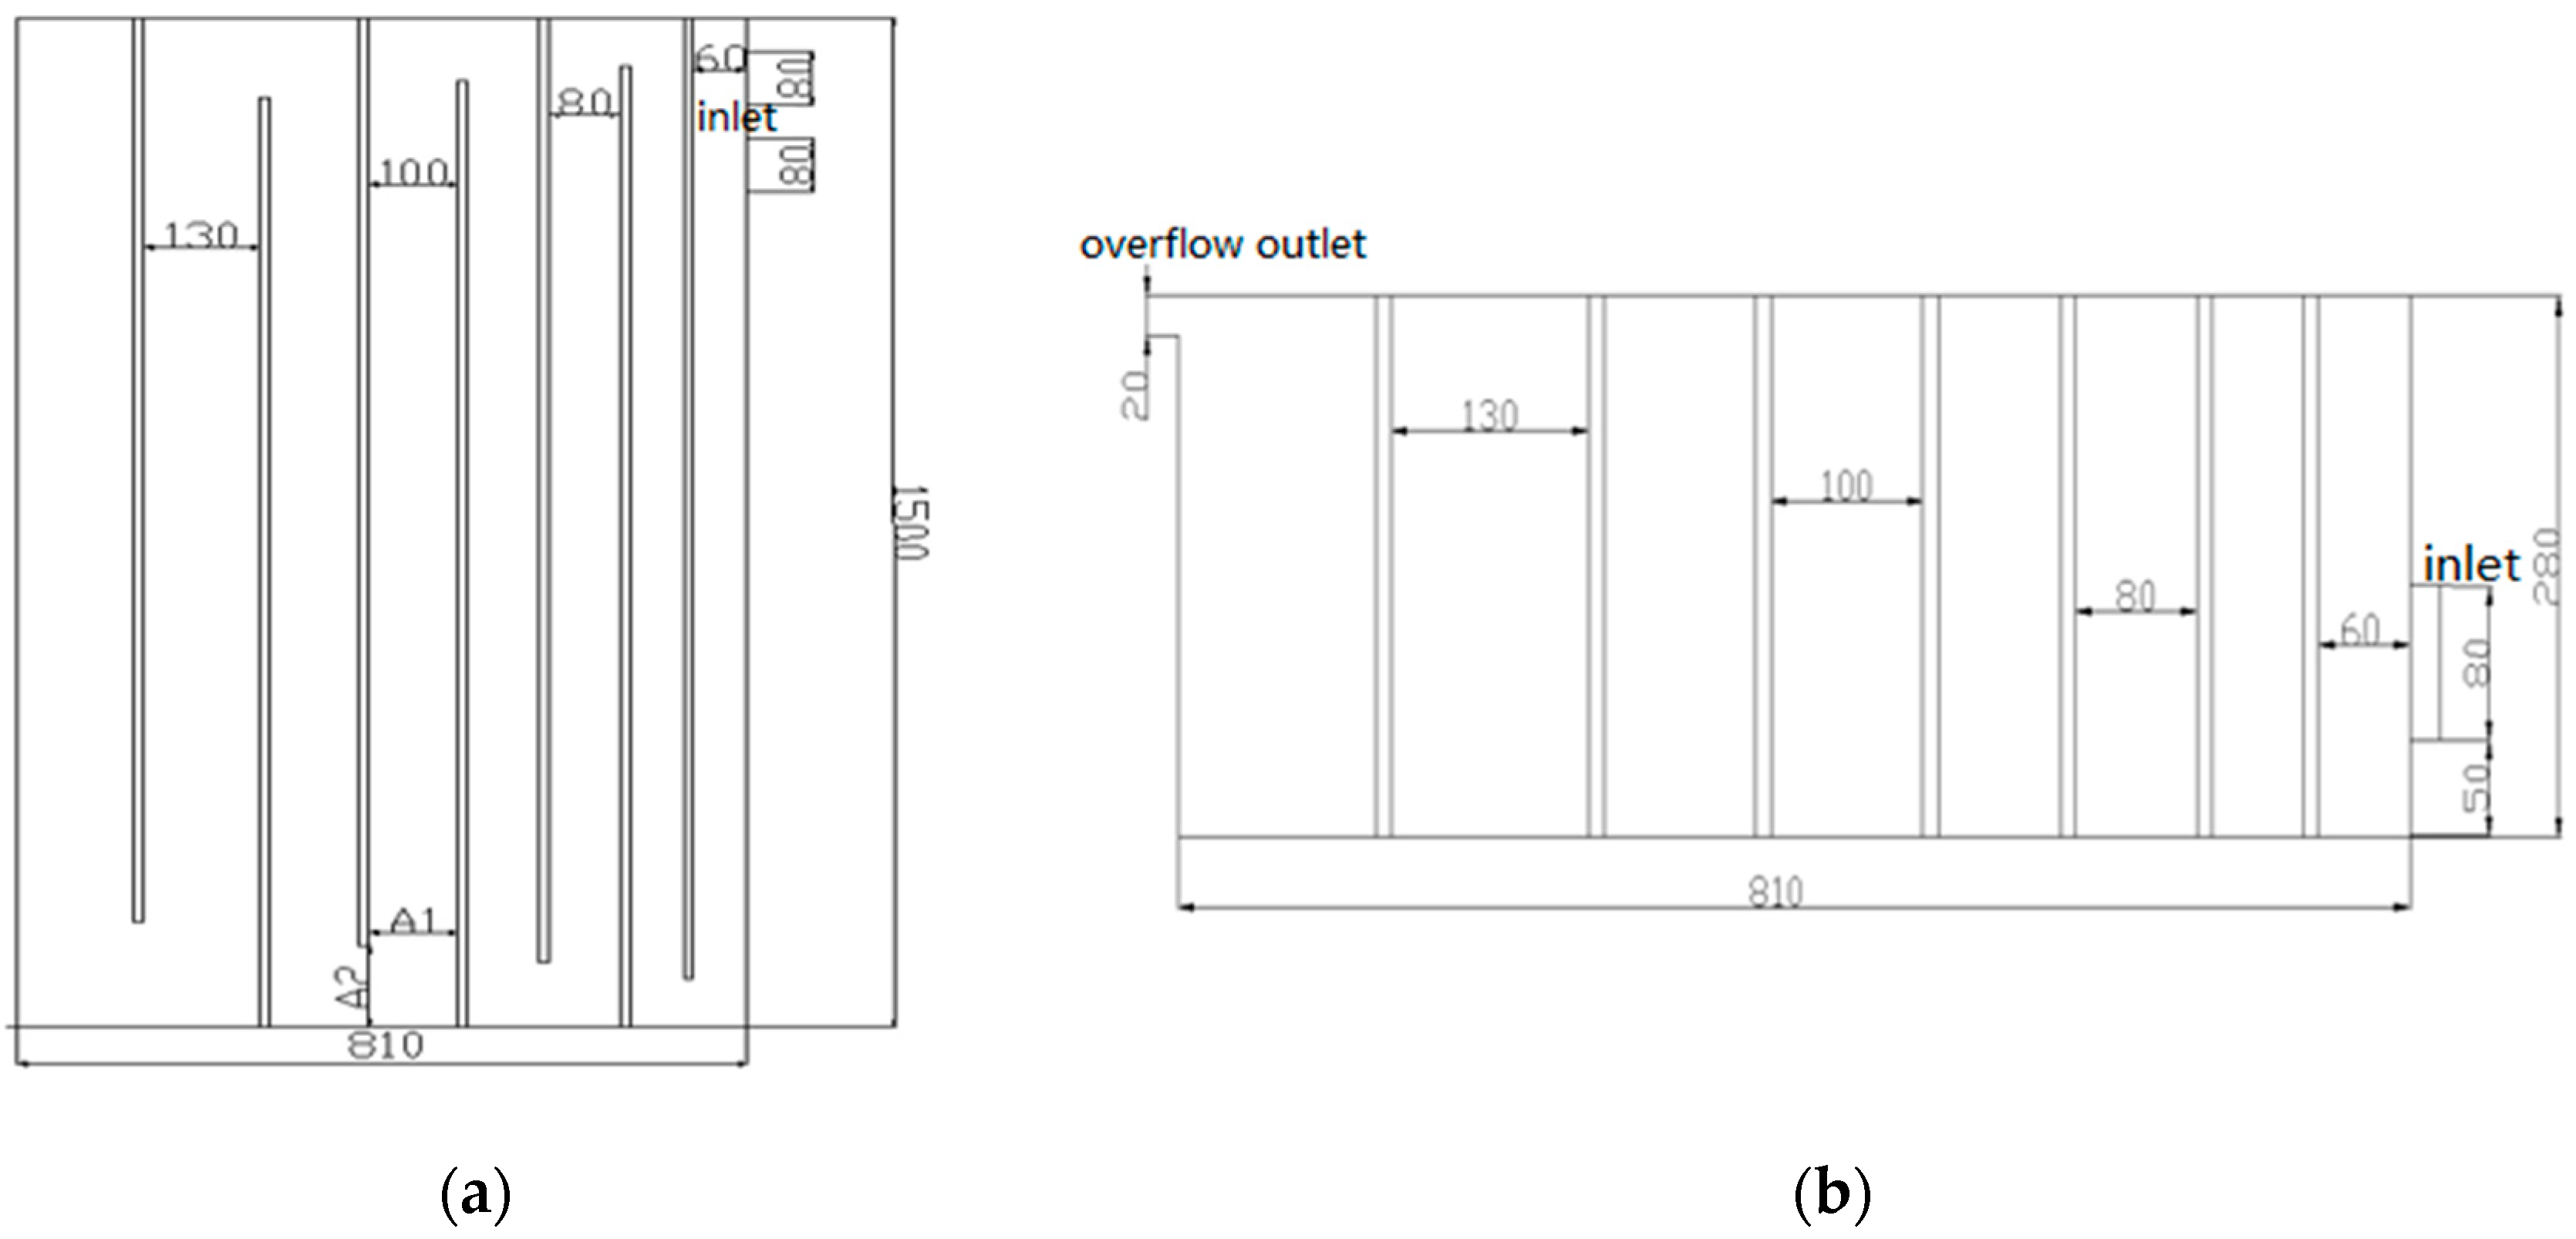
Figure 1. Reciprocating separator flocculation tank structure: (a) plane graph; (b) profile.
Environsciproc 02 00029 g001
Figure 2. Experimental model of flocculation tank with reciprocating separator: (a) plexiglass material, (b) laboratory table.
Environsciproc 02 00029 g002
Figure 3. Schematic of laboratory table.
Environsciproc 02 00029 g003
Figure 4. Flow field velocity vector at the turns.
Environsciproc 02 00029 g004
Figure 5. Partial enlarged view of the particle image velocimetry (PIV) of the fifth and sixth corridors.
Environsciproc 02 00029 g005
Figure 6. Physical model of flocculation tank with reciprocating separator: (a) geometric model; (b) mesh generation.
Environsciproc 02 00029 g006
Figure 7. Results of different turbulence models: (a) velocity cloud diagram and flow diagram of standard model; (b) velocity cloud diagram and flow diagram of RNG model; velocity vector diagram of realizable model; (c) velocity cloud diagram and flow diagram of realizable model; (d) velocity vector diagram of standard model; (e) velocity vector diagram of RNG model; (f) velocity vector diagram of realizable model.
Environsciproc 02 00029 g007
Figure 8. Velocity component (Y = 0.08 m): (a) X-direction velocity; (b) Y-direction velocity; (c) closing velocity.
Environsciproc 02 00029 g008
Publisher’s Note: MDPI stays neutral with regard to jurisdictional claims in published maps and institutional affiliations.