Proceeding Paper

Effect of Forest Restoration on Vegetation Composition and Soil Characteristics in North Wollo and Waghemira Zones, Northeastern Ethiopia †

1
Department of Forestry and Climate Science, College of Agriculture, Food and Climate Science, Injibara University, Injibara 40, Ethiopia
2
World Agroforestry Center (ICRAF), Addis Ababa 30677, Ethiopia
3
General Forestry, College of Agriculture and Environmental Science, University of Gondar, Gondar 196, Ethiopia
*
Author to whom correspondence should be addressed.
Presented at the 2nd International Electronic Conference on Forests—Sustainable Forests: Ecology, Management, Products and Trade, 1–15 September 2021, Available Online: https://iecf2021.sciforum.net/.
Environ. Sci. Proc. 2022, 13(1), 14; https://doi.org/10.3390/IECF2021-10776
Published: 31 August 2021

Abstract

:
As a countermeasure to deforestation and forest degradation, there are many forests restoration practices with area exclosures. However, there has been limited scientific investigation of the biophysical status of the restoration practice to show whether it is successful or not for further interventions. Thus, this study aims to evaluate the impacts of forest restoration with area exclosures on vegetation and soil-property-changing aspects. The method followed the concept of forest restoration based on selected indicators and comparison against best practices. For this purpose, three districts in three agro-ecologies were selected. In each district, one exclosure, adjacent church forest, and adjacent grazing land were selected. Then, vegetation data and soil data were collected and analyzed using different diversity indices. Descriptive and inferential statistics were applied for data analysis with R.Vr.3.1. The result revealed that there was a significant difference (p < 0.03) in vegetation composition, biomass, and soil attributes across land use and agro-ecology. In terms of wood density, area exclosures were recorded with the highest (1963 trees ha−1) wood density, followed by church forests (1079 trees ha−1) and grazing lands (501 trees ha−1). The highest species diversity was observed in church forests (1.53), followed by area exclosures (1.42) and grazing lands (0.64). Area exclosures show higher similarity (60%) with grazing lands than church forests (45%). Abundant woody species, herbs, and litter biomass were recorded in church forests (1320.8- and 1.8-ton ha−1), followed by exclosures (613- and 1.69-ton ha−1) and grazing lands (415- and 0.78-ton ha−1), respectively. In terms of soil property, church forests recorded the best loam sand and better AvP, Organic Matter, and total nitrogen, followed by exclosures and grazing lands. All the above vegetation and soil parameters indicate that area exclosures show intermediate values between church forests and grazing lands. Therefore, forest restoration with area exclosures is the better tool for degraded forest restoration. Further research is required to understand the ecosystem services of area exclosures and the trajectory of successional changes in vegetation composition and soil parameters of the area exclosures.

1. Introduction

In the dryland parts of Ethiopia, there is distinctive vegetation adapted to moisture stress climate. These forests are mostly tropical dry forests, which are dominated by woody plants—primarily trees. The canopy covers more than 10% of the ground surface, occurring in climates with a long dry season [1] Among nine forest types in Ethiopia, most are classified under dry forest [2]. The dry woodlands in Ethiopia are known for their valuable nontimber forest products (NTFPs). In addition, these dry forests have a very crucial role in climate regulation, fodder, and nontimber products (gum and resin), which increase the farmer’s adaptive capacity through diversified livelihoods [3]. Despite this fact, nowadays, the dry forest is under threat and heavy pressure due to clearance for firewood, expansion of cash crops, and new settlements; consequently, they are shrinking over time. According to [1], in drylands, there is high climate variability, frequent drought, and occasional floods; thus, rain-fed crop production is not sustained. As a result, the population has overexploited the dry forests for nontimber products and converted the dry forestland to agricultural land. This is mainly associated with the high population pressure and the increasing need for new agricultural land and additional sources of biomass energy.
This accelerated deforestation resulted in soil erosion, loss of biodiversity, disruption of the way of life of forest dwellers, shortage of wood (fuelwood, timber), the inadequacy of nontimber products, and affected the hydrological regime of an area and the CO2 balance in the atmosphere. Generally, deforestation has far-reaching local and global consequences such as climate change and biophysical changes that, in turn, have environmental, social, and economic impacts, with immediate effects on communities that depend on forests for part or their entire livelihood [4]. This calls for urgent intervention by different approaches such as restoration, rehabilitation, and reclamation of degraded forest with area exclosures, agroforestry practice, afforestation, and reforestation [4]. Habitually, the ecosystem that requires restoration has been degraded, fragmented, transformed, or destroyed as the direct or indirect result of human activities [5,6].
Ecological restoration presents complex and poorly understood implications for the structure and composition of future forests, landscapes, and fauna. The outcomes of a particular restoration are as follows: restoration of soil fertility for agricultural or forestry use, production of timber and nontimber forest products, or recovery of biodiversity and ecosystem services [7]. Ecological forest restoration is mostly practiced in the form of area exclosures. The investigator [8] explained that area exclosure and protecting an area of open grazing land from human use is an important practice in Ethiopia to permit natural rehabilitation, enhanced by additional vegetative and structural conservation measures. Restoration of a forest with area exclosure practices should be evaluated with selected indicators that are in line with environmental, social, and economic objectives of exclosures. This is important to realize the trajectory of vegetation change from open grazing land to the reference forest mediated by exclosure. The trajectory or the status of area exclosure evaluated by selected indicators may be a resemblance to the reference forest or open grazing land. Specific and measurable indicators are needed to help evaluate whether the restoration practices succeed or fail; this evaluation should include the outcomes (increased, decreased, maintained), the magnitude effect (plant cover, diversity, biomass, etc.), and the period (time) related to the reference site [1]. This information is important for development practitioners for further scaling up.
There are many forests restoration practices with area exclosures in the northern, degraded lands of Ethiopia. The restoration works through area exclosures in the study area are not well scientifically evaluated. The status and trajectory of area exclosures with a reference or church forest sites are not well-known. What is the status of the restoration works biophysically—successful or failed? There is no well-documented scientific evidence for further intervention. This is because there is limited synthesis and methodological research available to develop indicators and evaluation criteria. Due to this, the determinants for success and failure of forest restoration with area exclosures have not been identified in the study areas. Thus, this research was designed to evaluate the impacts of exclosures on vegetation dynamics and some soil attributes after passive restoration intervention and develop the conceptual framework for the evaluation of forest restoration practice.

2. Methodology

2.1. Description of the Study Area

The study was conducted in the Waghemira and North Wollo zones in the Amhara region on three selected districts (Lasta, Sekota, and Abergele) (Figure 1). Lasta district is one of the administrative districts in North Wollo Zone, which is geographically located at 12°35′31″ N latitude and 39°04′30″ E longitude. Sekota is one of the districts of the Waghemira Zone located at 12°0′22″ N latitude and 39°0′58″ E longitude. Abergele is one of the districts of Waghemira Zone located at 13°4′42″ N latitude and 38°53′29″ E longitude (Table 1).

2.2. Sampling and Data Collection

Three districts (Lasta, Sekota, and Abergele) of different agro-ecological zones (Highland, mid-altitude, and lowland, respectively) were selected purposively. The agro-ecological classification of the study district is based on [9].
Then, in each agro-ecology (districts), one area exclosure, one adjacent grazing land, and one adjacent church forest (reference) were selected purposively. The criteria for selection were the presence of exclosure intervention and their accessibility at the same age (10 years).
Vegetation data were collected from quadrats, which were placed in systematic random sampling. The size of the quadrats was 20 m by 20 m square for tree inventory, 10 m by 10 m for sapling inventory, and 5 m by 5 m for seedling inventory. The distance between the quadrats on the transect was 250 m and the distance between parallel transects was 200 m [10].
Soil samples were collected at the four corners and the middle of the main quadrats at three different depths (0–10 cm, 10–20 cm, and 20–40 cm) with auger technique and composited with a plastic bag. Then, soil samples were analyzed at the laboratory following appropriate laboratory procedures.
For evaluation of woody vegetation species, the local name, common name, and scientific name at each quadrat were recorded. The height of trees was measured with Hypsometer. The diameter of trees was taken at 1.3 m (DBH) and 0.6 m with caliper and diameter tape. Different tree growth stages of trees with DBH of >2.5 cm and height >2.5 m, sapling with DBH < 2.5 cm and height 1 m < h < 2 m, and seedling with DBH < 2.5 cm and height <1 m was recorded at each quadrat [10].
The soil sample was taken at four corners and the center of the main quadrate by disturbed sampling technique with an auger at different depths. Then, we composited all soil samples by different land use and different soil depth. After that, 1 kg of soil sample was taken from the composite sample after appropriate mixing for laboratory analysis of texture, pH, soil organic matter, available phosphorus, and total nitrogen.

2.3. Data Analysis

The vegetation indicators were analyzed by biodiversity indices such as the Shannon diversity index (H′), species similarity index, and species evenness index [11]. The species similarity was analyzed by Sorenson’s Coefficient [12]. The species’ evenness was analyzed with Evenness index = H′/log S. [13]. The Flora of Ethiopia and Eritrea books helped with species identification. The aboveground biomass of woody species having the DBH > −5 cm was calculated by [14]. The wood-specific density of woody species was taken from [15] guidelines.
To simplify the process for estimating below-ground biomass, it is recommended that a root-to-shoot ratio value of 1:5 is used—that is, to estimate below-ground biomass as 20% of aboveground tree biomass [16,17].
For Litterfall, Herb, and Grasses (LHG) based on [18].
The soil attributes were analyzed at Sekota agricultural research Center soil laboratory based on the procedure of soil and plant analysis [19]. Then, the soil sample laboratory result was compared with soil critical values [20,21]. Finally, all vegetation and soil attribute data were summarized and tested by SPSS for one-way ANOVA (at alpha = 0.05).

3. Results and Discussion

3.1. Vegetation Diversity and Composition

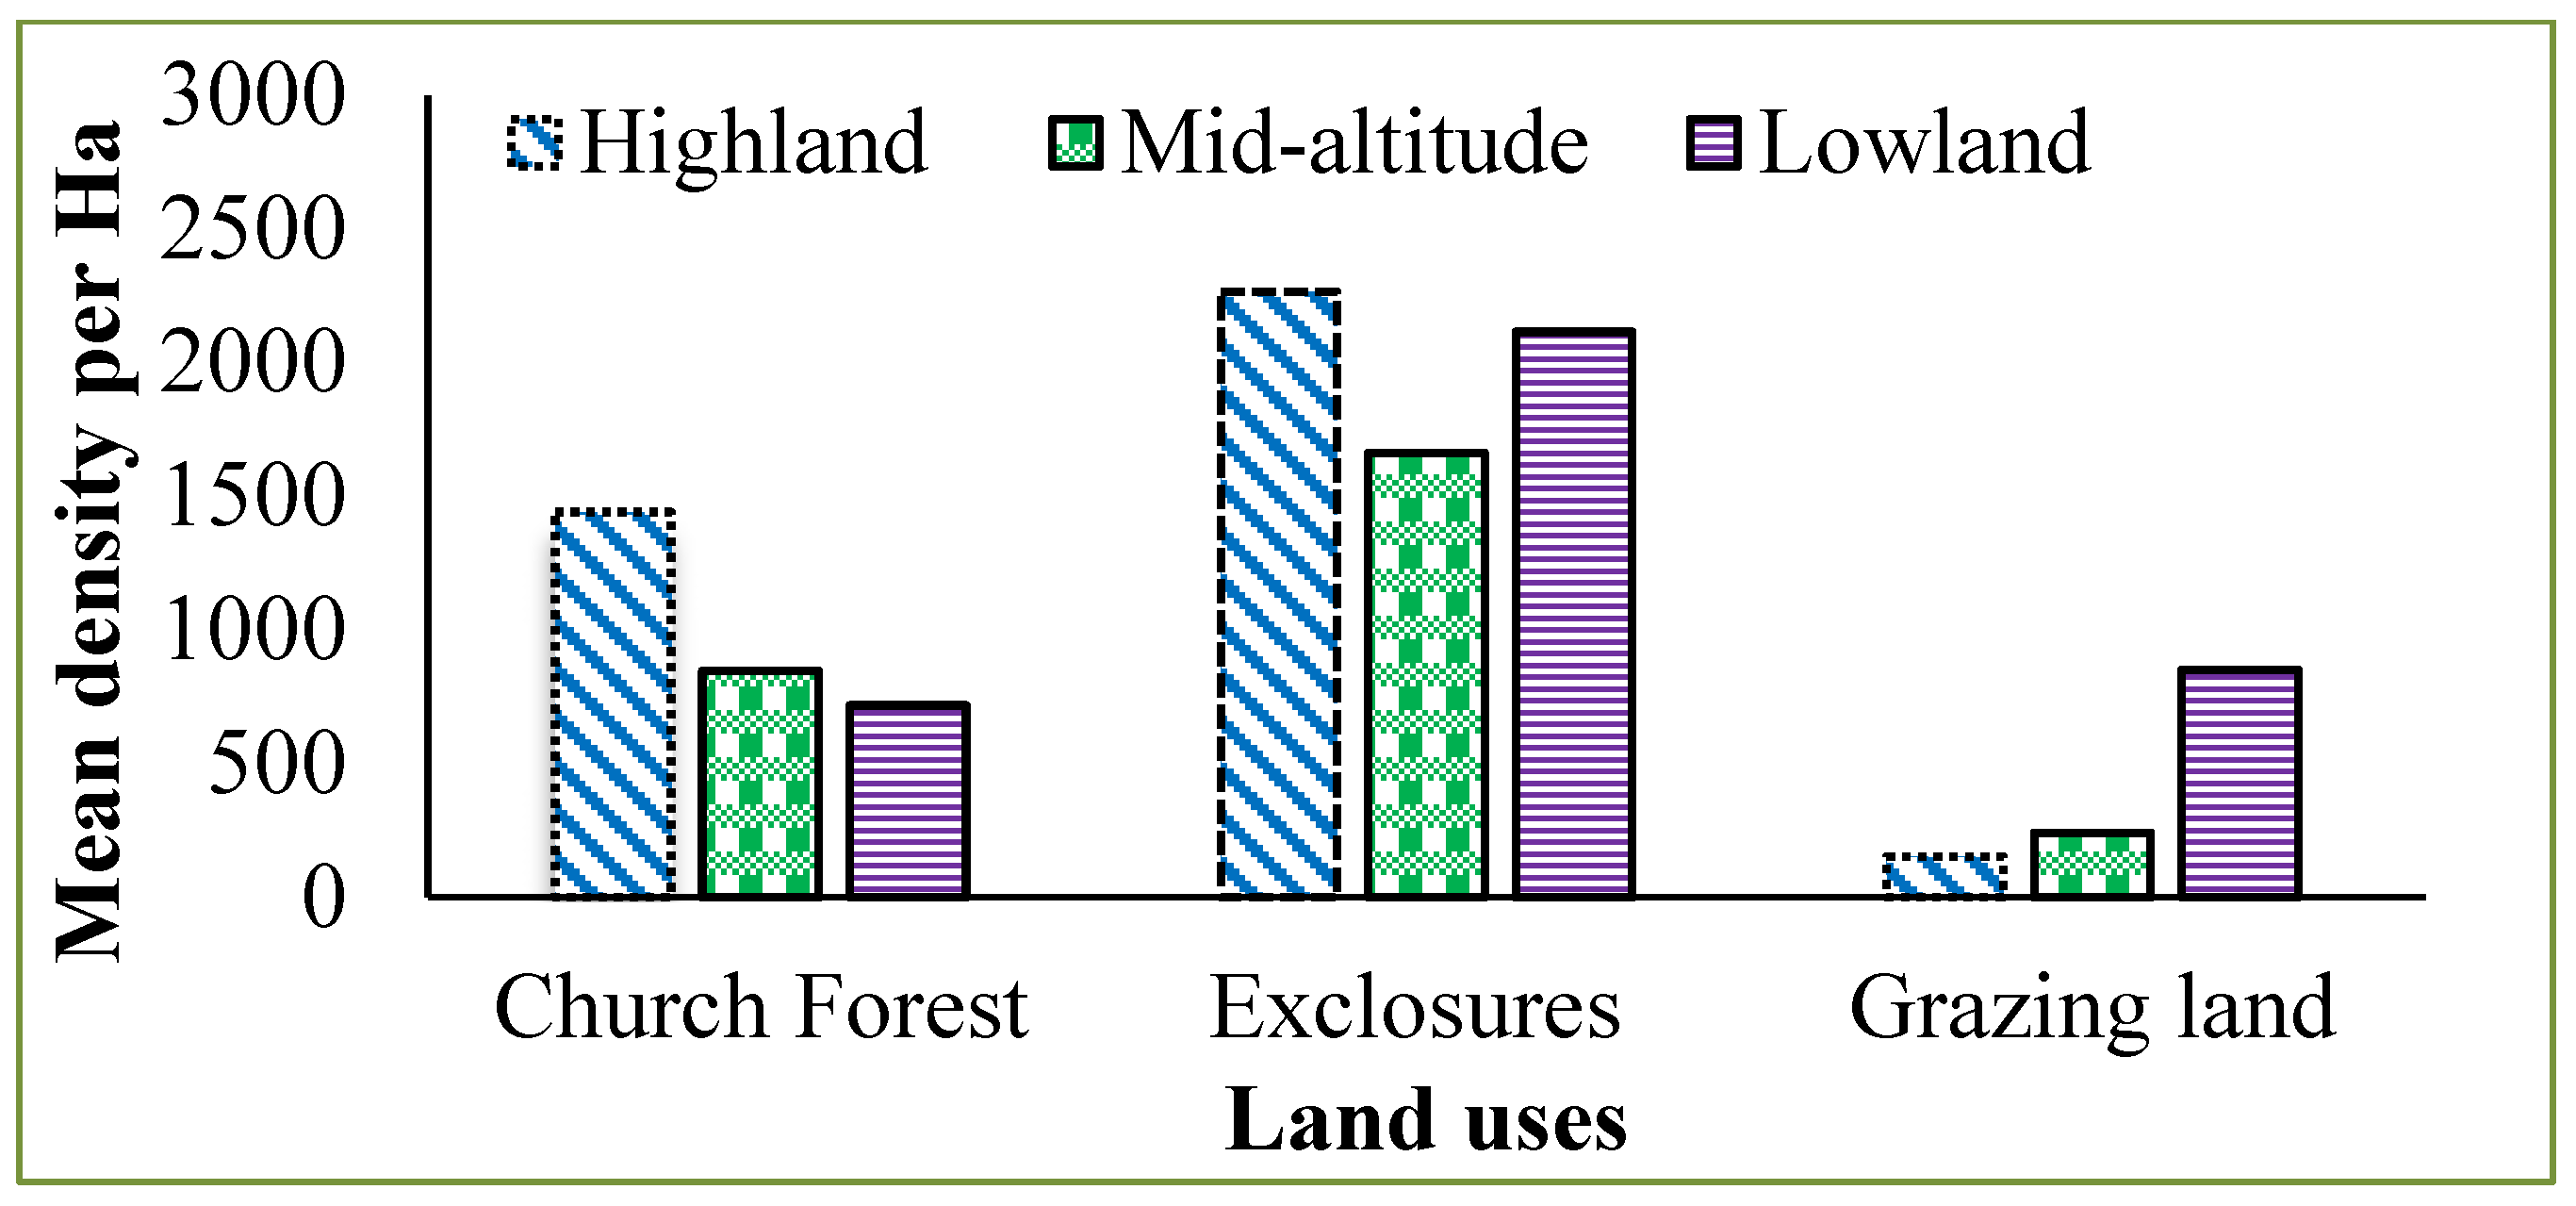
High woody species density (1660–2265 stem ha−1) in exclosures was recorded, followed by church forests (717–1440 stem ha−1) and grazing lands (152–850 stem ha−1) (Figure 2, Appendix A Table A1). The exclosure has better stem density than church forest and grazing land. This is because of the open space, which provides favorable conditions for the regeneration of light-demanding species and means there is no competition for light due to upper strata vegetation; thus, scrub vegetation starts to grow. As a result, the number of stems increases in exclosures.
Therefore, excluding open grazing land from livestock and human interference is a better strategy for natural regeneration. The better natural regeneration facilitates forest restoration. This idea is similar to that of [22] in Tigray and northern Ethiopia; [23] in northeast Ethiopia and South Wollo; and [24] in central Ethiopia and north Shoa, who found that area exclosures increase the vegetation density. All above scholars approved that excluding livestock from open grazing land in an area exclosure increases natural regeneration, leading to natural forest restoration. Overgrazing (browsing and trampling) destroys the newly emerged seedlings and saplings. There is a similar argument [25] in a review of works on effects of area exclosures in different parts of Ethiopia, in which exclosure recovers vegetation better than open grazing lands over 5 to 10 years of the exclosure. Furthermore, many studies [26,27,28] argued without reservation that wood density, diversity, and regeneration of vegetation recovered after the area was excluded from anthropogenic disturbances.
The highest number of species (7–16) was recorded in exclosure forest, followed by church forest (11–12) and open grazing land (3–5). The number of species was low at mid-altitude but similar at lowland and highland areas (Figure 3).
Species diversity was high (0.78–2.27) in church forests, followed by exclosures (1.1–1.73) and open grazing lands (0.48–0.8). The dominance and evenness index is highest in church forests, followed by exclosures and open grazing lands (Table 2).
Exclosures have the highest species richness compared with church forests and grazing lands. This is because in exclosures there is open space, and low trampling and other disturbances. Therefore, the dormant species from the soil seed bank start to regenerate. On the other hand, there is seed dispersal by wind and wild animals from near-natural forests or church forests.
According to [11] species diversity index, the church forests have a good range (2 to 2.4) and exclosures have a medium-range (1 to 1.5), but open grazing lands are below the minimum range (<1) of species diversity index (Table 2). [29] evenness index ranged from zero to one, where close to one means all species evenly distributed, while close to zero means few dominant species control the community. In exclosure and church forest species, evenness is close to one, which means the species have a chance for special distribution; however, in open grazing lands, evenness indexes are close to zero, at which few highly stress-resistant species are dominant.
In church forests, light-demanding species have no chance to germinate because of the close space of the upper canopy. In exclosures, there is enough open space; thus, light-demanders start to germinate. Therefore, exclosures have optimum species diversity, which may increase with the age of exclosures, but the upper canopy will still be closed. In open grazing lands, there are few dominant species presented that resist grazing stress. Thus, species diversity is very low. Similarly, [29] conclude that in the northern highlands of Ethiopia, species diversity increases in open grazing land from 0.5 to 1.8 after exclosures. This idea is also supported by [30] in central and northern highlands, who showed that exclosures have twice the species diversity of open grazing land. Therefore, the species at dormancy in open grazing land regenerate due to seed dispersal by wildlife after the area is enclosed. Thus, enclosed open grazing land increase the species diversity and species richness. Many studies approved [26,27,31,32,33,34,35] that species diversity and species richness increased after the degraded forest area was excluded for overexploitation.
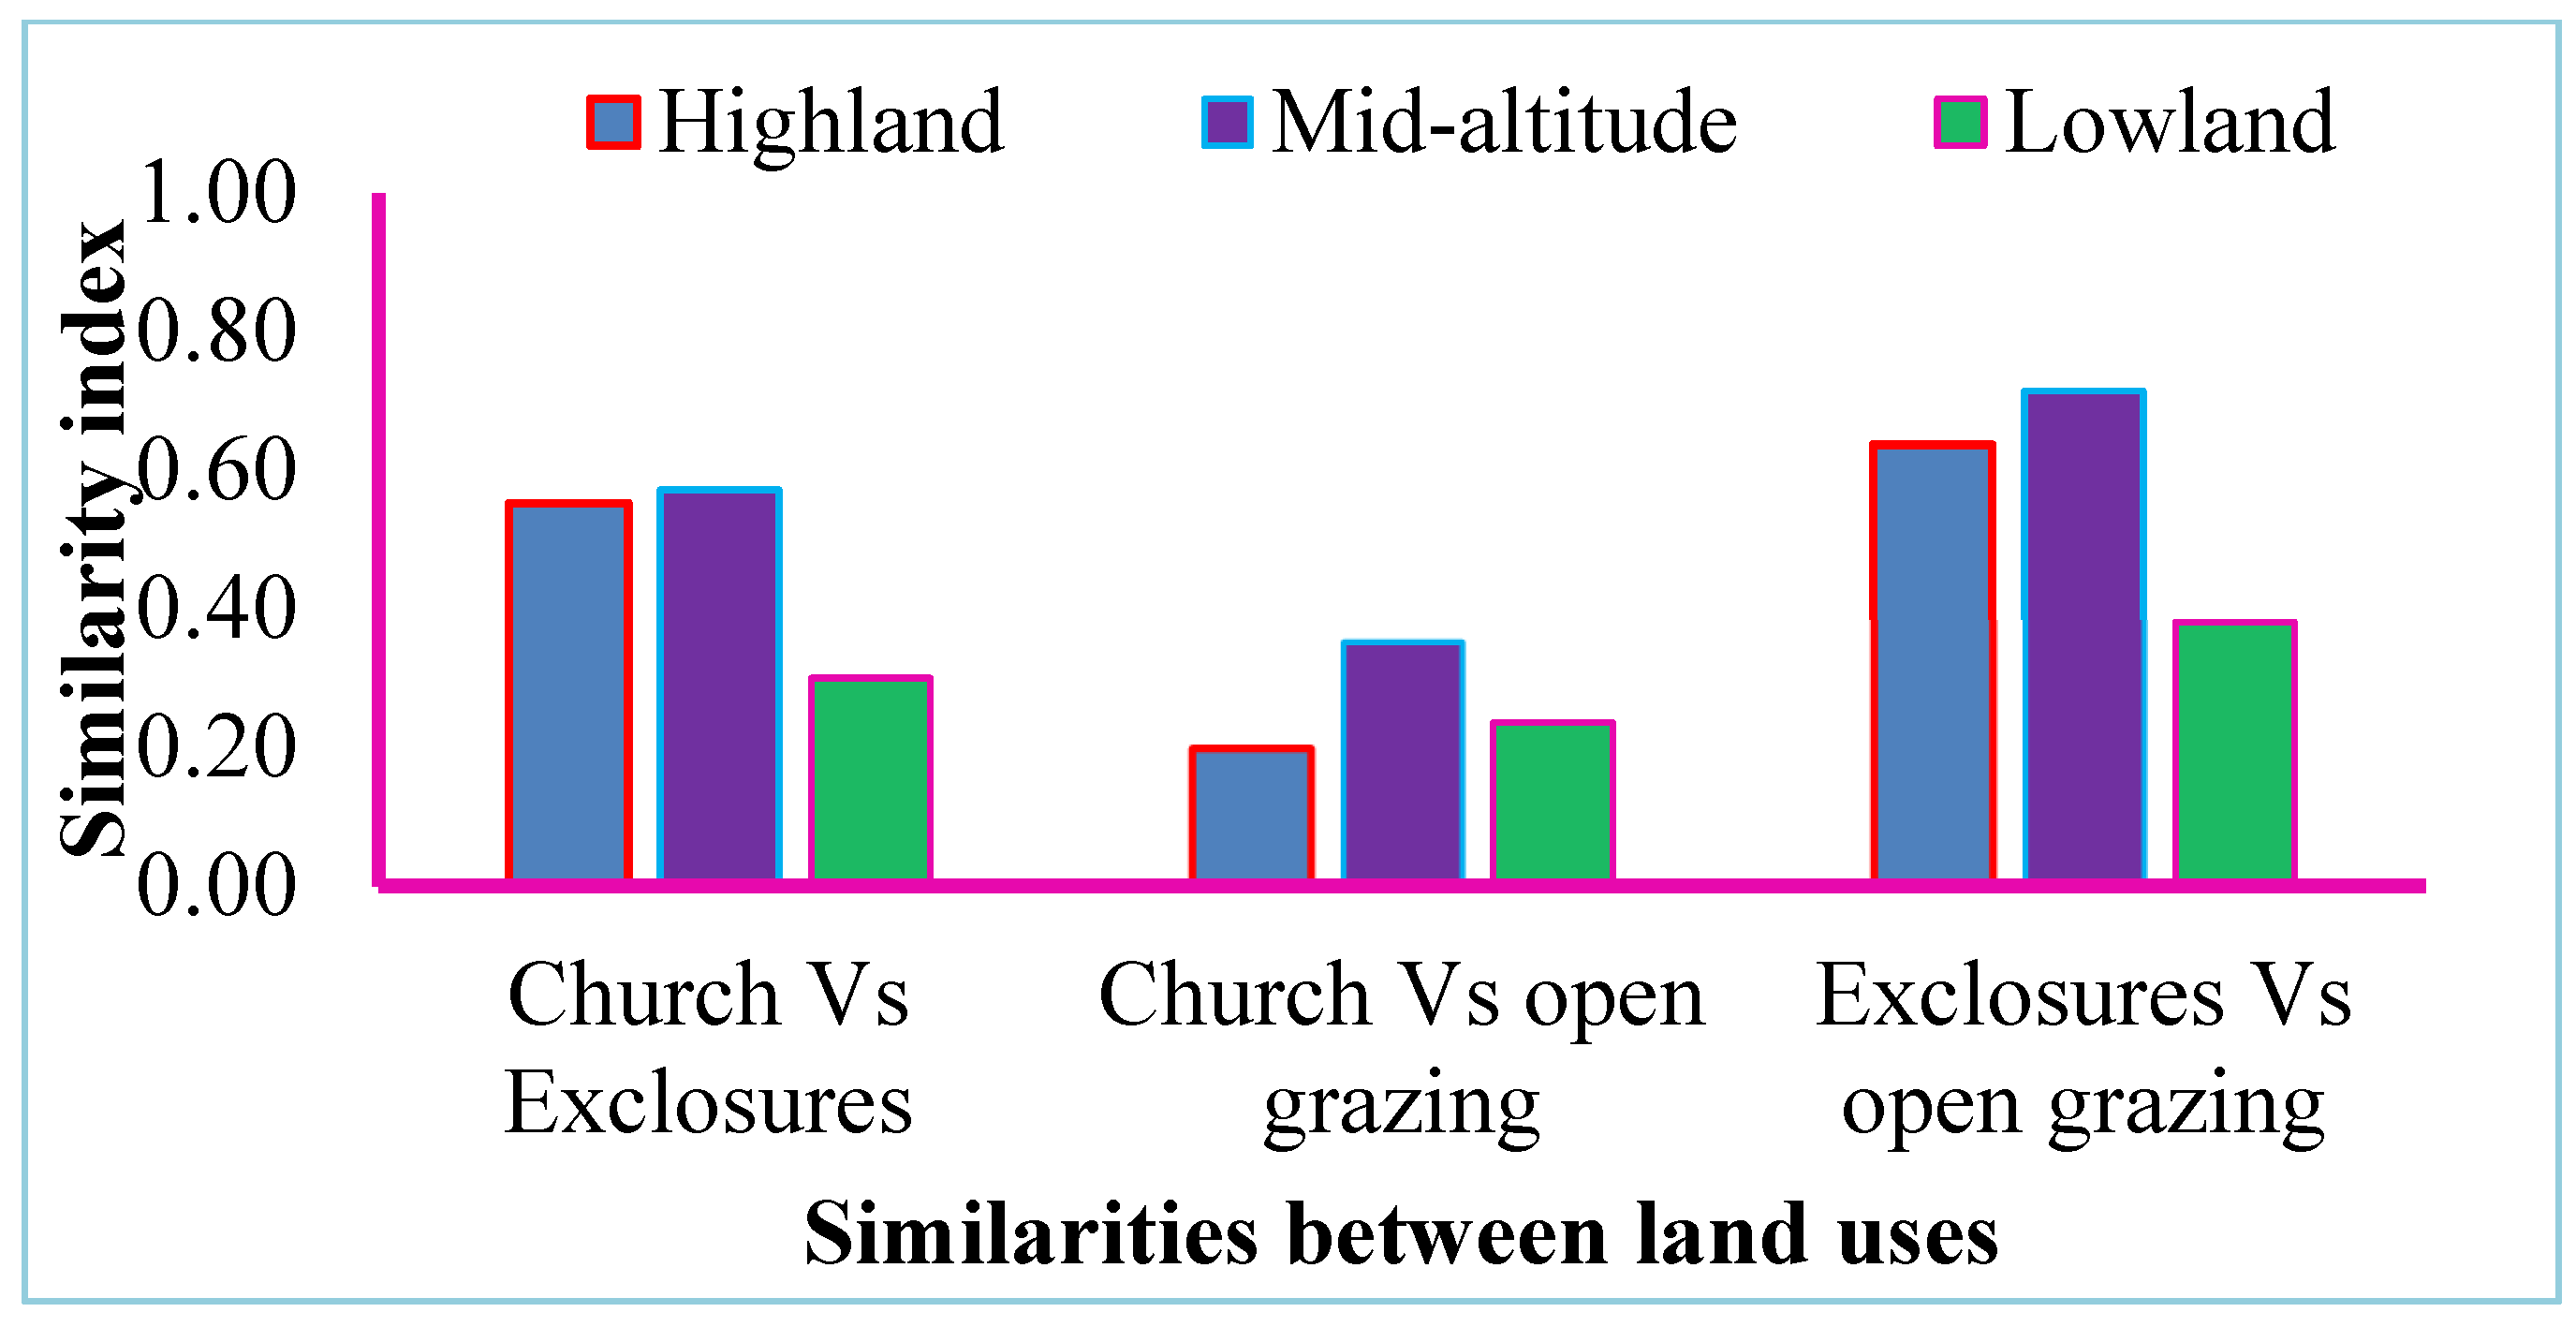
The highest species similarity is between exclosures and open grazing lands (0.4–0.8), followed by church forests and exclosures (0.3–0.6). High species similarity was also recorded at mid-altitude areas (0.6–0.8), followed by highland (0.24–0.6) and lowland areas (0.24–0.4) (Figure 4).
The similarity index ranges from 0 to 1; close to one means there is high similarity and close to zero means there is low similarity [12]. The similarity values of church forests vs. exclosures and exclosures vs. open grazing lands at mid-altitude and highland areas are close to one. However, in lowland areas, the similarity between church forests and exclosures is close to zero. The enclosed forest has species similarity midway between church and open grazing land, as the trajectory from degraded grazing land area references adjacent church forest in highland and mid-altitude areas but not in lowland areas. After exclosure, the species become regenerated and have a trajectory to the nearest protected forest from the seed bank and the composition close to the church forest, leading to dissimilarity with grazing lands. This is because, in grazing lands, the forest becomes continuously degraded and its composition is continuously lost. This idea is similarly argued in the literature [27,36,37,38], where the similarity of species composition is closely related to disturbances, management, and close latitudinal location; specifically, the similarity of species composition of area exclosures correlates with the nearest reference site.

3.2. Population Structure and Regeneration Status

In highland areas, Junipers procera and Olea europea are the dominant species in churches with inverted J-shaped population structures, while in exclosures, Dodonia angostifolia and Rhus glotinos are the dominant species having hump-shaped (unimodal) population structures. Similarly, the overall church forest in the highland area has an inverted J-shaped population structure (Table 3). There are no dominant species in grazing land. However, their overall population structure shows a J-shaped structure, having only a few big trees with no seedling and sapling population.
The lower DBH population of the species is found where there is open space, while in the dense forest inside the church forest there is low regeneration and only big trees are present. The seedlings and saplings of these species are found at the border where there is open space. These species are light-demanders; therefore, the regeneration is only at the border and open space. Rhus glutinosa and Dodonia angostifolia are dominant species in exclosures in highland areas. Dodonia angostifolia is a pioneer species that regenerates first in exclosures. This shows that the species are regenerated from soil seed bank or dispersal after the area is enclosed. All species in exclosures at the highland areas have an inverted J-shape structure, showing that most populations are at the sapling stage (Table 3). This is due to open space, conditions being favorable for light-demanders, and exclosures being young. In grazing land in the highland areas, there are few stressed trees in the DBH range of 14–20 cm. The population structure is a J-shape structure indicating low regeneration (Table 3). The regeneration may be affected by grazing disturbances.
In mid-altitude areas, Dodonia angostifolia and Olea europea were dominant species in the churches with inverted J-shape population structures. Overall, the church forest in mid-altitude areas has an inverse J-shape structure. In churches, most populations are found in DBH range 3–20 cm and there are few big trees (Table 4).
In exclosures, Dodonia angostifolia is the only dominant species having a J-shaped structure (Table 4). In exclosures, most trees are found in the 3–4 cm DBH range, which are newly regenerated after an area is enclosed. However, there are no dominant species in grazing land. Acacia etbaica and Euclea divinorum are remnants of shrubs in grazing land, which resist the grazing and other disturbance stresses (Table 4).
In lowland areas, Diospyros mesifiliformis and Oncoba spinosa were the dominant species in churches with a J-shape population structure. Most trees in the church and grazing land have DBH > 10 cm. This shows that there is low regeneration in churches and grazing land (Table 5), while in exclosures, Acacia asks and Adansonia digitata were the dominant species. Acacia ask has an inverted J-shaped structure and Adansonia digitata has a J-shape structure.
In lowland areas, there is low regeneration in exclosures. The lowland grazing has an inverted J-shape structure (Table 5). There are only a few big trees without seedling and sapling populations in grazing lands; this means there is no regeneration in open grazing land.
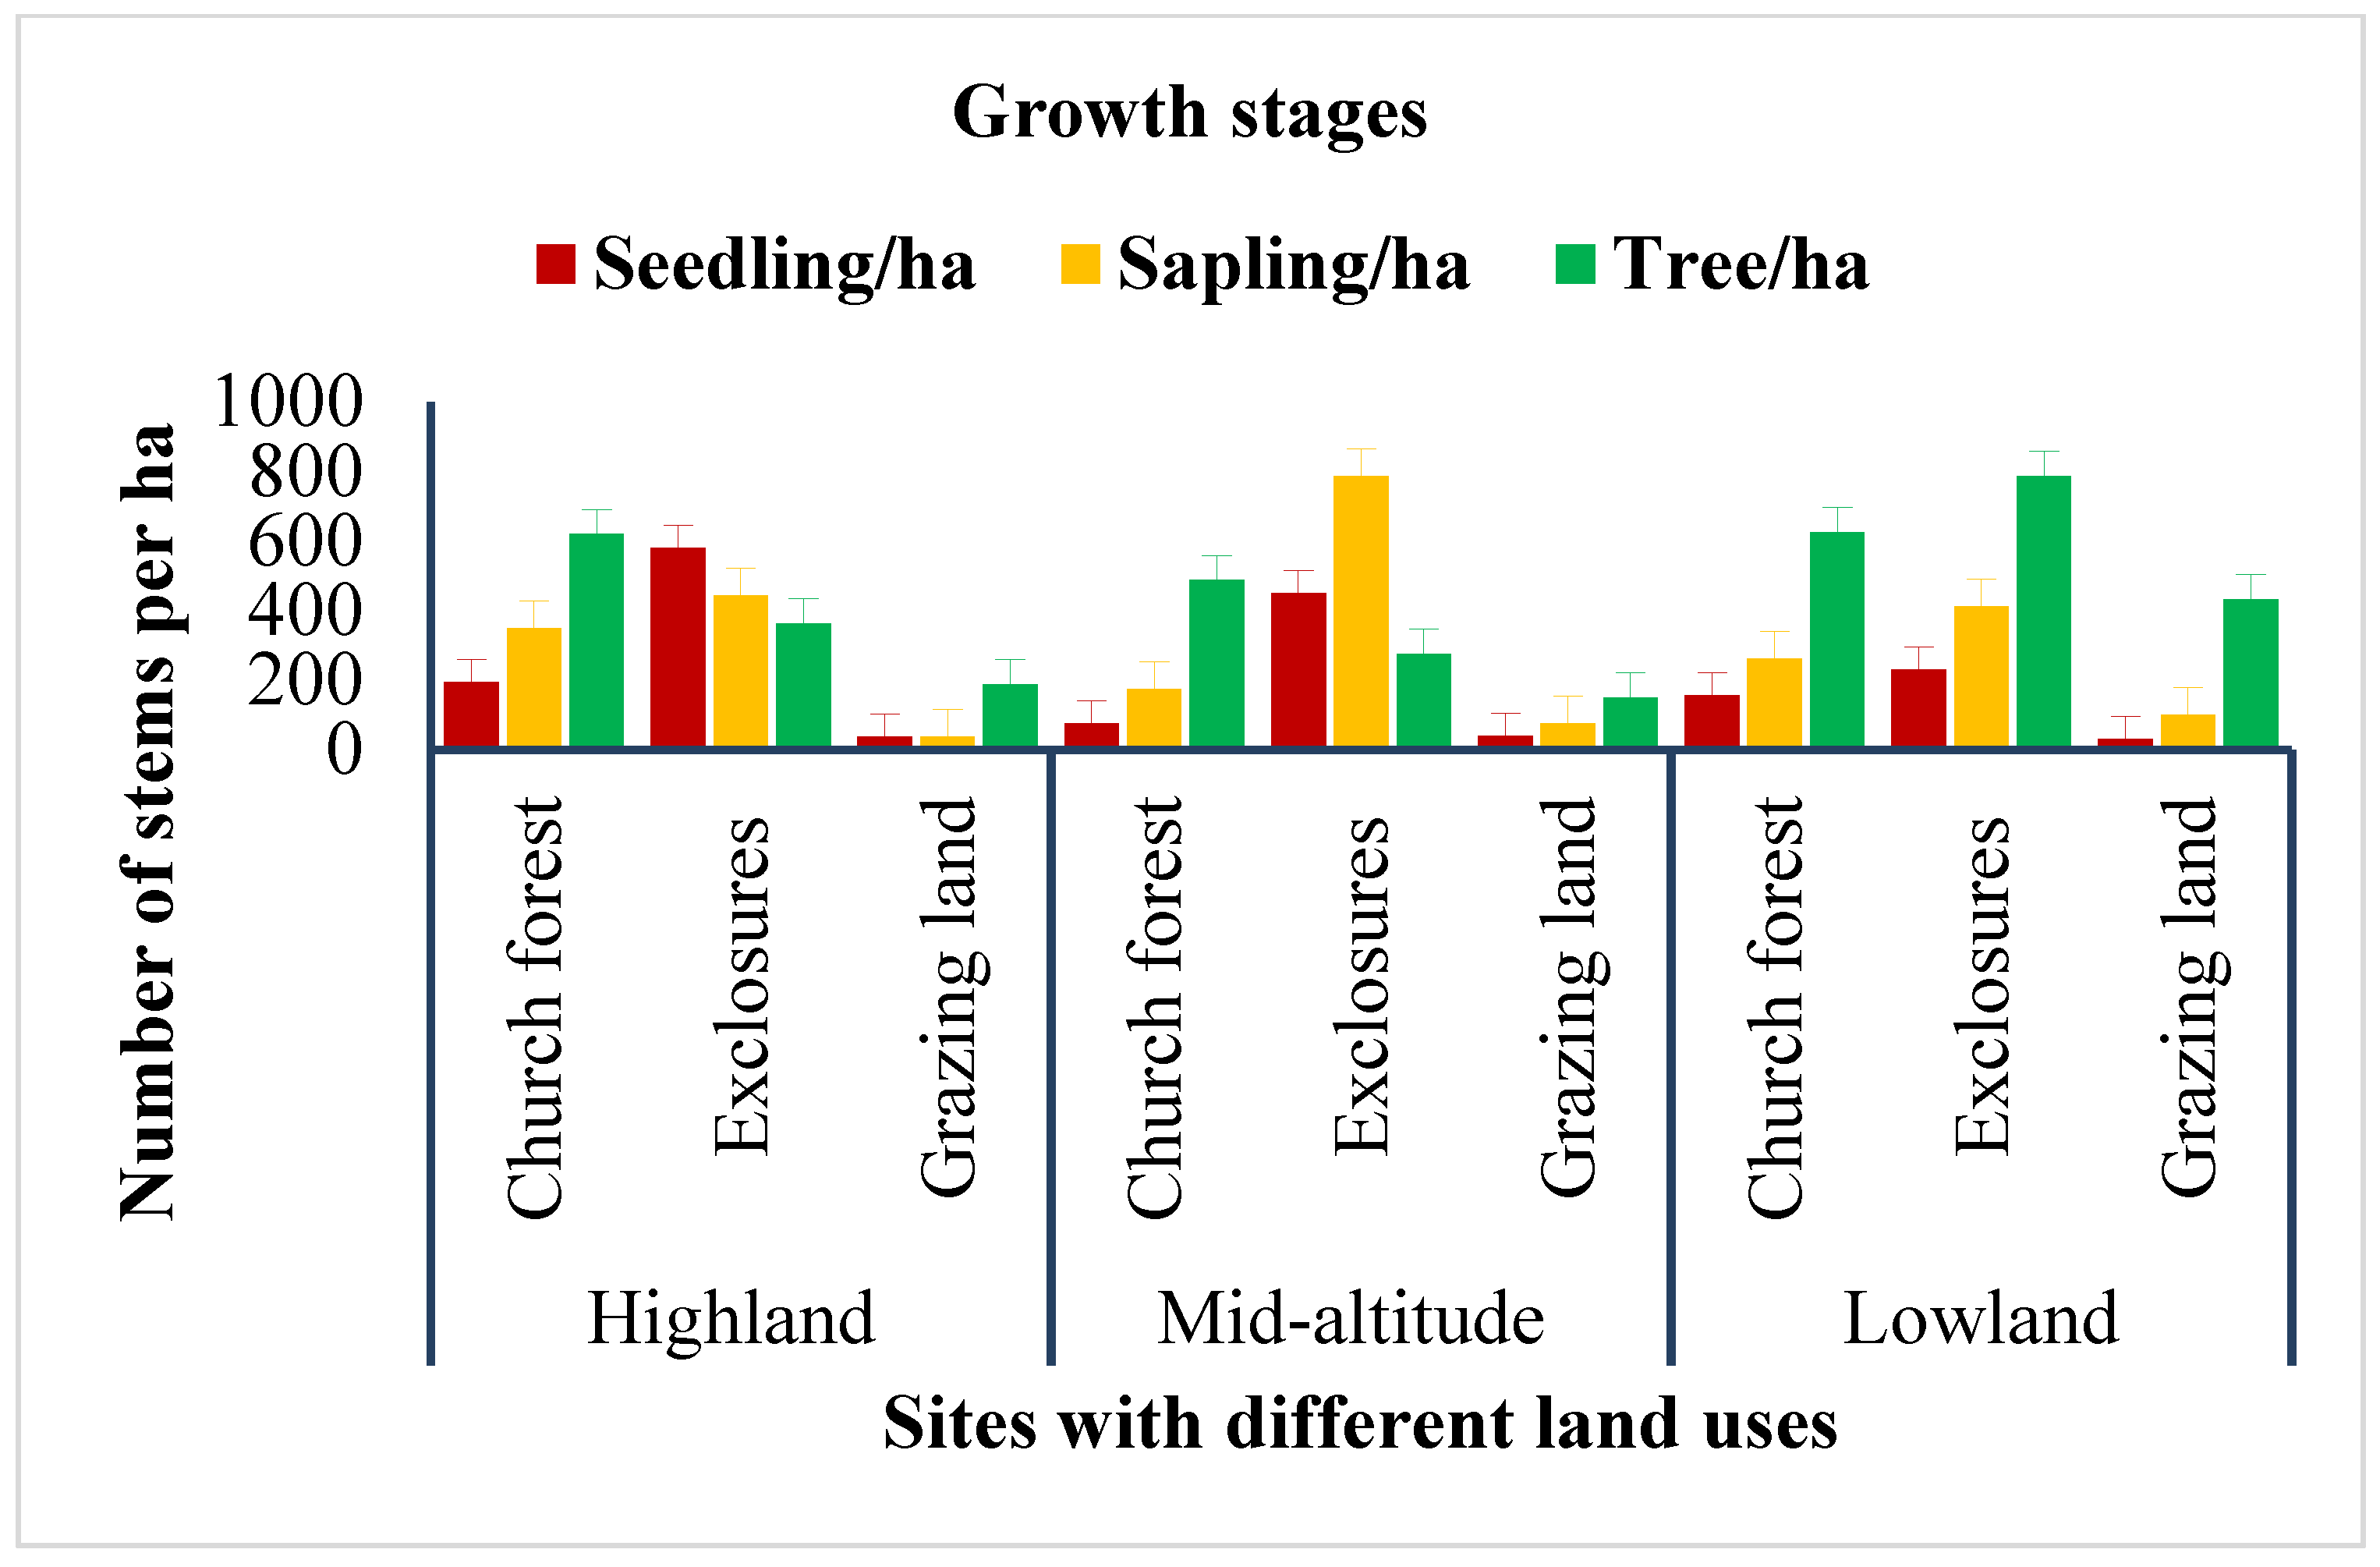
In terms of regeneration, exclosures have high seedling and sapling populations while church forests and grazing lands have low seedling and sapling populations. At highland areas, church forests have J-shaped, exclosure forests have inverted J-shaped, and open grazing lands have J-shaped population structures. At mid-altitude areas, the same trend to highland areas is followed, but at exclosures, there is a high sapling population. In lowland areas, the regeneration status is very low; this means a very low seedling population and, thus, the population structure is J-shaped (Figure 5).
At churches, the upper canopy affects the regeneration, so the population is only competent trees. It is an indicator of an unbalanced community. Junipers procera and Olea european are dominant species in most church forests in the highlands of Ethiopia. However, there is low regeneration because of the low open space and high trampling effect of livestock. This idea is similar to that of [39], who found that in highland parts of North Wollo, Junipers procera and Olea european are common dominant species having J-shaped structures. There are only big trees in dense forest, and there are low seedling and sapling populations. In exclosures, the population structure is an inverted J-shape structure, which means there is a high population of seedlings and saplings. This is an indicator of a healthy community. The exclosure was open grazing land before its establishment. After the exclosure was made, the stressed vegetation started to grow and support natural regeneration as a nurse tree. The space is open, helping to regenerate light-demanders. Thus, the population of exclosure is in the order of seedling > sapling > tree. This idea is supported by [30] in degraded hillsides of central and northern Ethiopia, [22] in northern Ethiopia, and [23] in northeast Ethiopia, showing that the population structures follow an inverted J-shape if there are no livestock interferences, meaning they have been properly protected and managed as area exclosures. Therefore, an area exclosure restores the normal and healthy community after the open common grazing land is excluded from livestock and human interference. Vegetation structure and population status are the key determinant indicators of given forest resources that indicate the health and integrity of the forest ecosystem. Many studies [25,38,40] use this indicator to evaluate the trajectory of area exclosures biophysically. Vegetation structure and population status recover after area exclosure, indicating that the conservation goal of restoration has been achieved. The idea is similar to those of previous studies [36,41], where after the degraded forest is enclosed, the vegetation structure become an inverted J-shape with ample natural regeneration.

3.3. Biomass

The highest WBM (613–2594-ton ha−1) was recorded in lowland, followed by highland (8.7–148.5-ton ha−1) and mid-altitude (9.9–47.13-ton ha−1). In terms of land use, the WBM was high in church forests (47.13–2594.5-ton ha−1), followed by exclosures (12.3–613.4-ton ha−1) and grazing lands (8.7–821.3-ton ha−1) (Table 6).
The highest biomass in lowland areas is due to big trees such as Adansonia digitata L. having a high diameter of up to 178 cm. This tree increases the basal area and biomass in grazing land and exclosures. Additionally, Acacia asak is dominantly grown in exclosures and open grazing land, where the thorn in the lowland contributes to high biomass in the lowland. The highest litter, grass, and herb biomass (1.35–2.3 t ha−1) were recorded in church forests, followed by exclosures (1.42–1.96 t ha−1) and grazing lands (0.57–0.99 t ha−1). In terms of agro-ecology, the highest LHG was recorded in highland (0.57–2.3 t ha−1), followed by mid-altitude (0.99– 2.1 t ha−1) and lowland areas (0.75–1.35 t ha−1) (Table 6 and Appendix A Table A2).
In highland and mid-altitudes, the area is much degraded and almost no big trees remain in open grazing land; after exclosures, Dodonia angostifolia as a pioneer species start to grow to have less diameter and low biomass. Even if in this condition, the woody biomass in exclosures is intermediate between churches and grazing lands. This means excluding open grazing land contributes to the restoration of biomass flow from vegetation to the soil. [31], in northern Ethiopia, stated the same findings that the aboveground biomass measured inside the exclosures was more than twice that of the adjacent grazed areas and more biomass was produced from the young than the old exclosures. [42] also stated a similar idea that woody biomass increased with exclosure age, while grass biomass carbon slightly decreased because of canopy cover after a well-developed community. [37] also stated aboveground biomass and carbon increased following the establishment of exclosures on communal grazing land. [43] explained that aboveground vegetation biomass across sites follow the order of area exclosures > open grazing land.
In exclosures, the grass and herbaceous species contribute to high LHG biomass, while in church forests, litter fall contributes to the biomass. However, in open grazing lands, the grass, litter, and herbs are browsed by livestock; thus, biomass is lower in highland and mid-altitude areas. [44] obtained similar findings that litter biomass increases with exclosure age in Northern Ethiopia, Tigray after the open grazing land was excluded from livestock and human interferences.
This confirms that vegetation biomass recovers continuously and close to the nearest reference forest better than the open grazing land after the degraded forest is closed with passive restoration. There are several similar arguments [37,41,42,45,46,47,48] in different parts of the world supporting that overall biomass and carbon pool increase with the age of the restoration and become comparable with the nearest protected natural forest.

3.4. Soil Attributes of Area Exclosures

There were highly significant differences in sand (p = 0.008), clay (p = 0.000), and loam (p = 0.000) contents between different land uses. However, there was no significant difference in sand, clay, and loam contents of soil in different agro-ecologies (Table 7). The highest mean clay content was recorded in church forests (6.8%), followed by exclosures (6%) and grazing lands (4%). The highest mean sand content was recorded in grazing lands (88.3%), followed by exclosures (87.4%); church forests had the least sand content (79.56%). The highest mean loam content was recorded in church forests (13.5%), followed by grazing lands (7.2%) and exclosures (6.5%) (Table 7 and Appendix A Table A3).
Based on clay, sand, and loam content proportions of the soil, highland areas for all land uses have loam sand textural class. Church forests have loamy sand textural class in all agro-ecologies. In mid-altitude and lowland areas, area exclosures and grazing land have a sandy textural class. Sand, clay, and loam content of the soil increase from grazing land to church forest. However, the sand content of the soil decreases from grazing land to church forest. This tells us the exclosure practices increase the soil clay and loam content from its litterfall and under vegetation decomposition. This is due to the organic matter increment in vegetation-covered church areas and area exclosures. This idea is similar to that of [49], suggesting that soil organic matter has a habit of increasing the clay and silt content of the soil under vegetation-covered areas. This is due to two mechanisms: first, unions between the surface of clay particles and organic matter delay the decomposition process; then, soils with higher clay content increase the potential for aggregate formation. Under similar climate conditions, the organic matter content in fine-textured (clayey) soils is two to four times that of course-textured (sandy) soils [49]. Based on [50] findings, in northern parts of Ethiopia, the sand content reduced after area exclosure but the clay and silt contents of soil increased slightly with the age of exclosure. [51] in northern Ethiopia concluded a similar idea that sand content of the soil reduced with area exclosure practices while silt and clay content increased after the area was enclosed.
There was a significant difference in pH across land uses and agro-ecologies (p > 0.05) (Appendix A Table A2); however, there was no significant difference between soil depths. The highest pH was recorded in lowland areas (6.9–8.4), followed by highland (6.6–7.6) and mid-altitude areas (5.6–7.6) (Table 8).
Exclosure forests have higher pH than others in highland areas. This is supported by [52], where after 7 years of exclosures, soil pH increased from 6 to 7.3. This idea was disproved by [53], who found that closed areas have lower pH than open grazing land; this is because of vegetation cover. Vegetation cover allows litter decomposition, which leads to high infiltration because of improved soil organic matter and physical characteristics. These leached bases percolate down deep into the soil; the topsoil remains acidic and the pH becomes lower. However, high pH of up to 8.4 was recorded in churches with good vegetation cover in lowland areas due to the presence of buffering compounds such as carbonates. This is based on [54], who reported that carbonate compounds increase the soil pH to 8.5. This is why in high vegetation cover areas, there is high organic carbon with negative charges. These negative charges attract the positive cations (basic compounds) such as calcium and make carbonate compounds.
Based on [21] soil critical value, the soil pH of church forest, exclosure, and open grazing land are almost neutral, with pH ranging from 6.8 to 7.3. Therefore, there is no soil pH change with area exclosures in all agro-ecologies. This may be due to the age of exclosures or their need for more time to moderate soil pH. [55] have proven three soil pH ranges as follows: a pH < 4 indicates the presence of free acids, generally from oxidation of sulfides; a pH < 5.5 suggests the likely occurrence of exchangeable Al; and a pH from 7.8 to 8.2 indicates the presence of CaCO3. Based on this, our results fall in the third (7.8 to 8.2) range, i.e., the soil of the study areas ranged from neutral to slightly alkaline.
Church forests show a significant difference (p = 0.02) in soil organic carbon and soil organic matter across depths in all agro-ecologies. There was a significant difference in SOC between land uses (p = 0.003) in all agro-ecologies (Appendix A Table A2). The highest SOC was recorded in church forests (0.58–2.9%), followed by exclosures (0.13–2.27%) and open grazing lands (0.5–1.1%) (Figure 6).
Based on [20,21] soil critical values, our SOC and SOM at church forest have medium organic carbon (2.1–4.2%) at highland and mid-altitude areas but high at lowland areas (4.3 to 5). Exclosures have low SOC and SOM in all agro-ecologies. Open grazing land has very low SOC and SOM in all agro-ecologies. This shows that exclosures have SOM and SOC contents, which are transitional between church forest and open grazing land. Therefore, exclosure contributes to the development of soil organic matter, which is important for soil fertility and soil biology. This idea is alike to [53] in the West Hararghe Zone of Oromia that there is high soil organic carbon in exclosures. Thus, exclosure practice substitutes the loss of soil by erosion, overexploitation, and aboveground biomass deduction by consequent grazing.
In [56], soil organic matter increased with the age of exclosures after exclosures were developed in northern Ethiopia. This means vegetation restoration leads to biomass production increases and, subsequently, soil productivity increases. This idea is shown by [55], where many soils—specifically those under the forest—have good organic soil materials at the surface (defined as containing >20% organic carbon), also called forest floor or litterfall. This is why the most recently deposited, relatively undecomposed foliage, twigs, etc. are present on the surface. In general, SOM is a large and active component of the global carbon cycle, containing three times the amount of carbon contained in the earth and twice the carbon contained in the atmosphere.
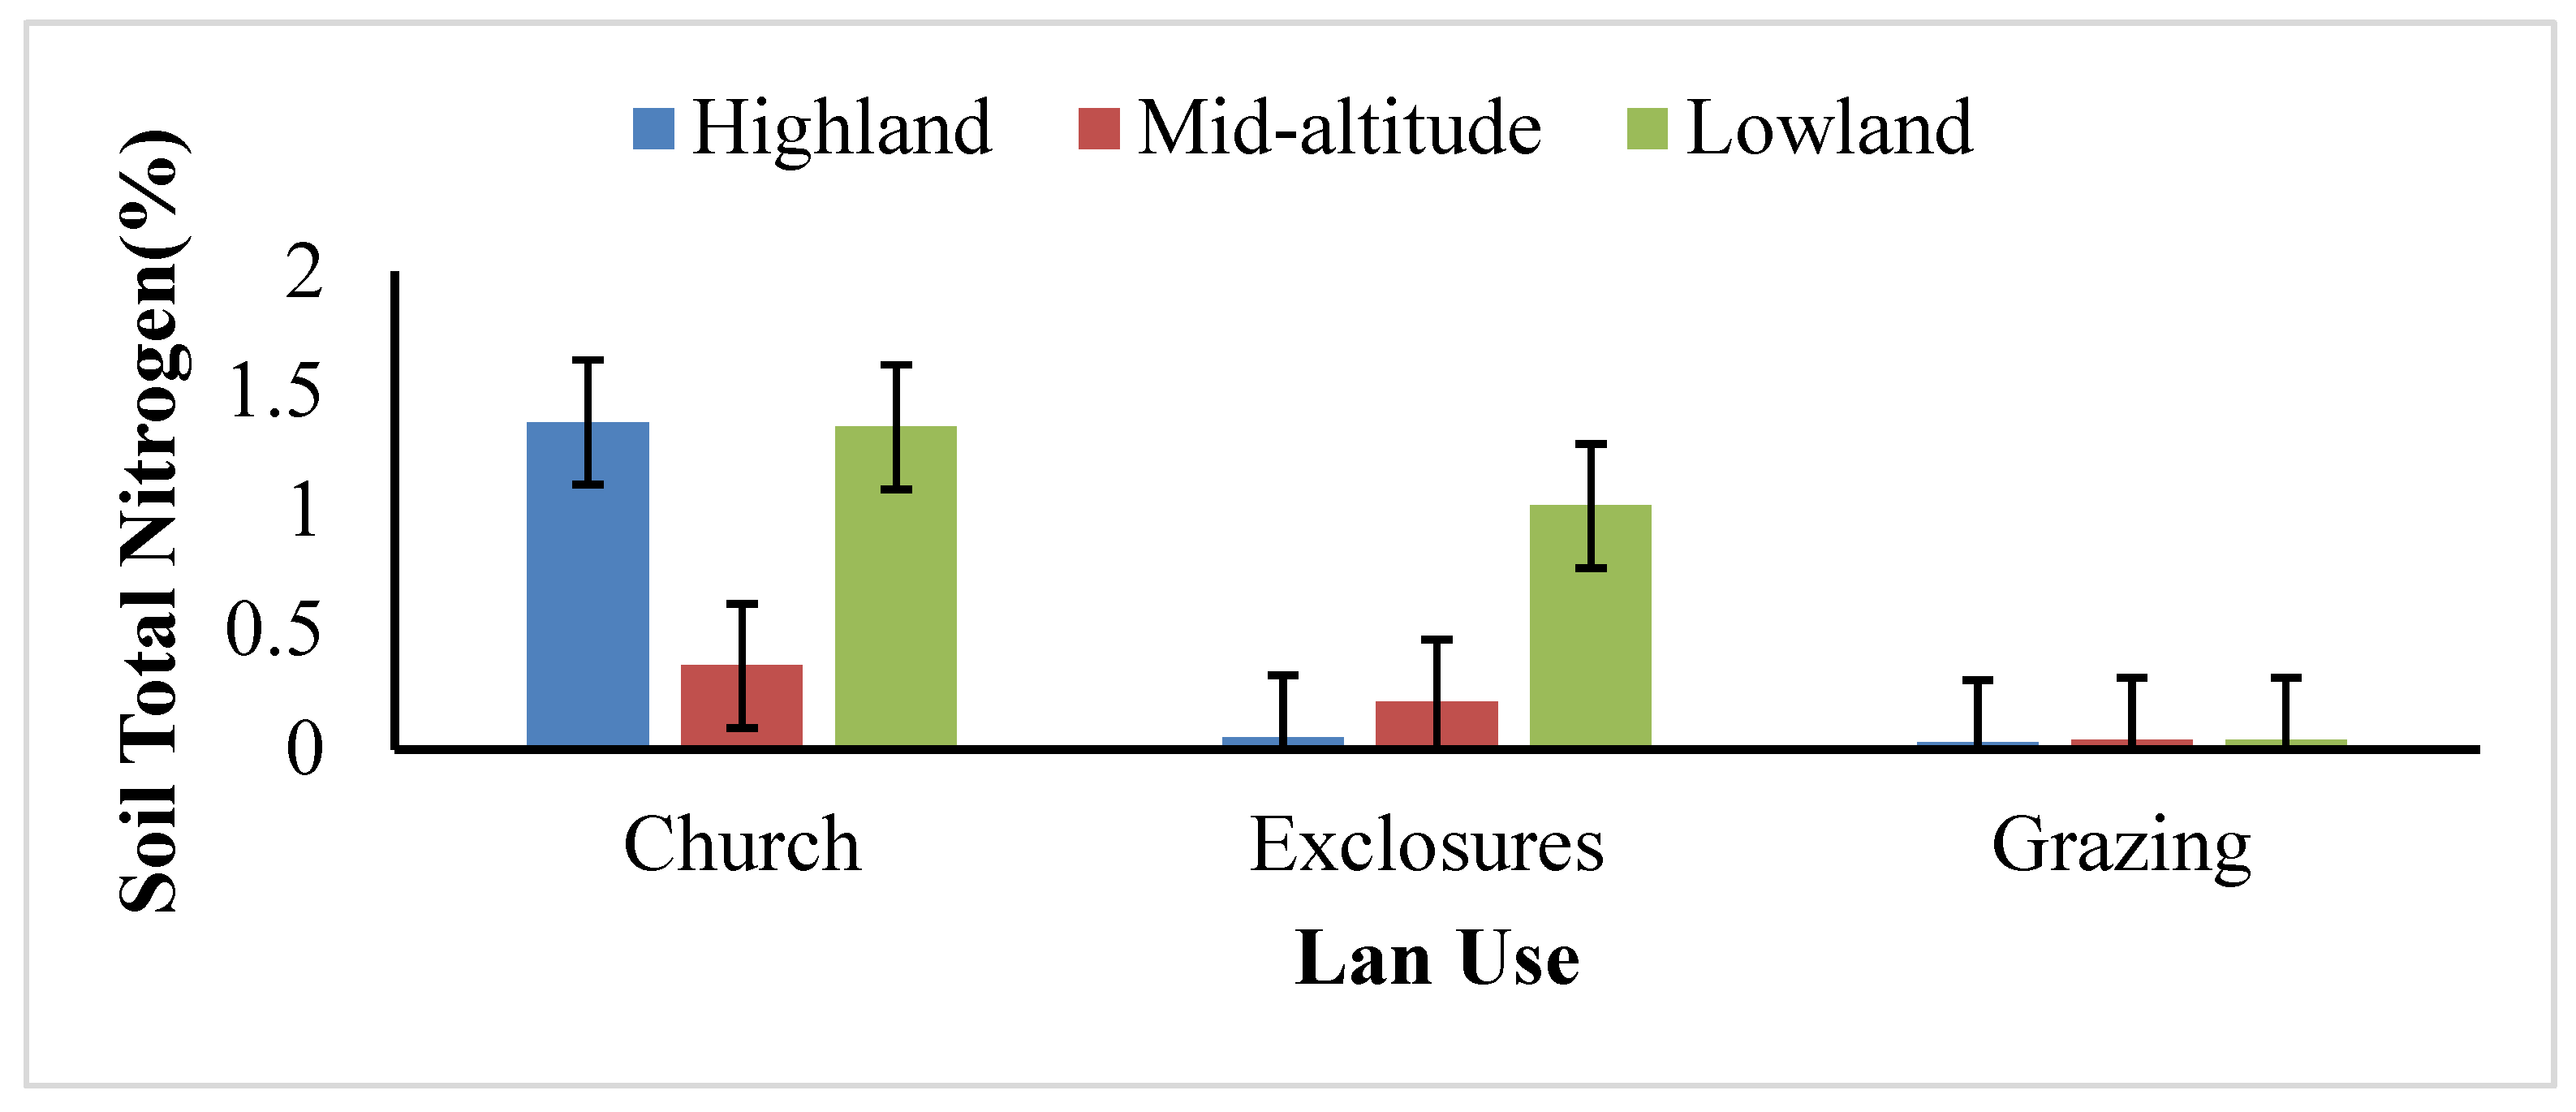
There was a highly significant difference (p = 0.000) in Total Nitrogen (TN) between land uses and agro-ecology (Appendix A Table A2). Nevertheless, there was no significant difference in TN between soil depths in all agro-ecologies. The highest TN was recorded in highland, followed by lowland and mid-altitude. In terms of land uses, church forests have the highest TN, followed by exclosures and open grazing lands (Figure 7).
Based on [21] soil critical value, church forests have very high TN in highland and mid-altitude areas but very low TN in lowland areas. On the other hand, exclosures have low TN in all agro-ecologies. Compared with church forests and exclosures, open grazing lands have very low TN in all agro-ecologies. This shows that, after exclosures, there was nitrogen fixation in the soil. This idea is similar to [53], who reported that TN is increased slightly after exclosures. Thus, the enclosed forest has TN in the intermediate of open grazing lands and church forests.
Ref. [52] discussed the fact that TN and SOC in the exclosures forest have no difference with open grazing land in 7-year exclosures in northern Ethiopia. This is why regaining this type of element in the soil needs more time after area exclosure.
There was no significant difference in available phosphorus (AvaP) across land uses and soil depth in all agro-ecologies. Nevertheless, there was a significant difference in AvaP across different agro-ecologies (p < 0.05) (Table 2). The highest values were recorded in church forests (6.3–38.81 ppm), followed by exclosures (2.46–14.9 ppm) and open grazing lands (3.1–14.6 ppm). In terms of ago-ecology, highland areas had the highest values (4.36–38.81 ppm), followed by mid-altitude (3.22–24.6 ppm) and lowland areas (2.46–21.8 ppm) (Table 8).
Based on [21] soil critical value, AvaP (ppm) in church forest is low at highland, optimum at mid-altitude, and very low in lowland areas. In exclosures, AvaP (ppm) is low in highland areas and very low in mid-altitude and lowland areas. Exclosures exhibited a trajectory of nutrient build from open grazing to church (reference) in soil restoration. This is similar to the findings of [44] in the northern highlands of Tigray, where the AvaP in the enclosed forest (2.95 ppm) increased from open grazing lands (1.28 ppm) to church forests (10 ppm). However, according to [52], when the area exclosures age increases, there is high nutrient cycling; then, AvaP decreases with soil and accumulates in the wood growing system.
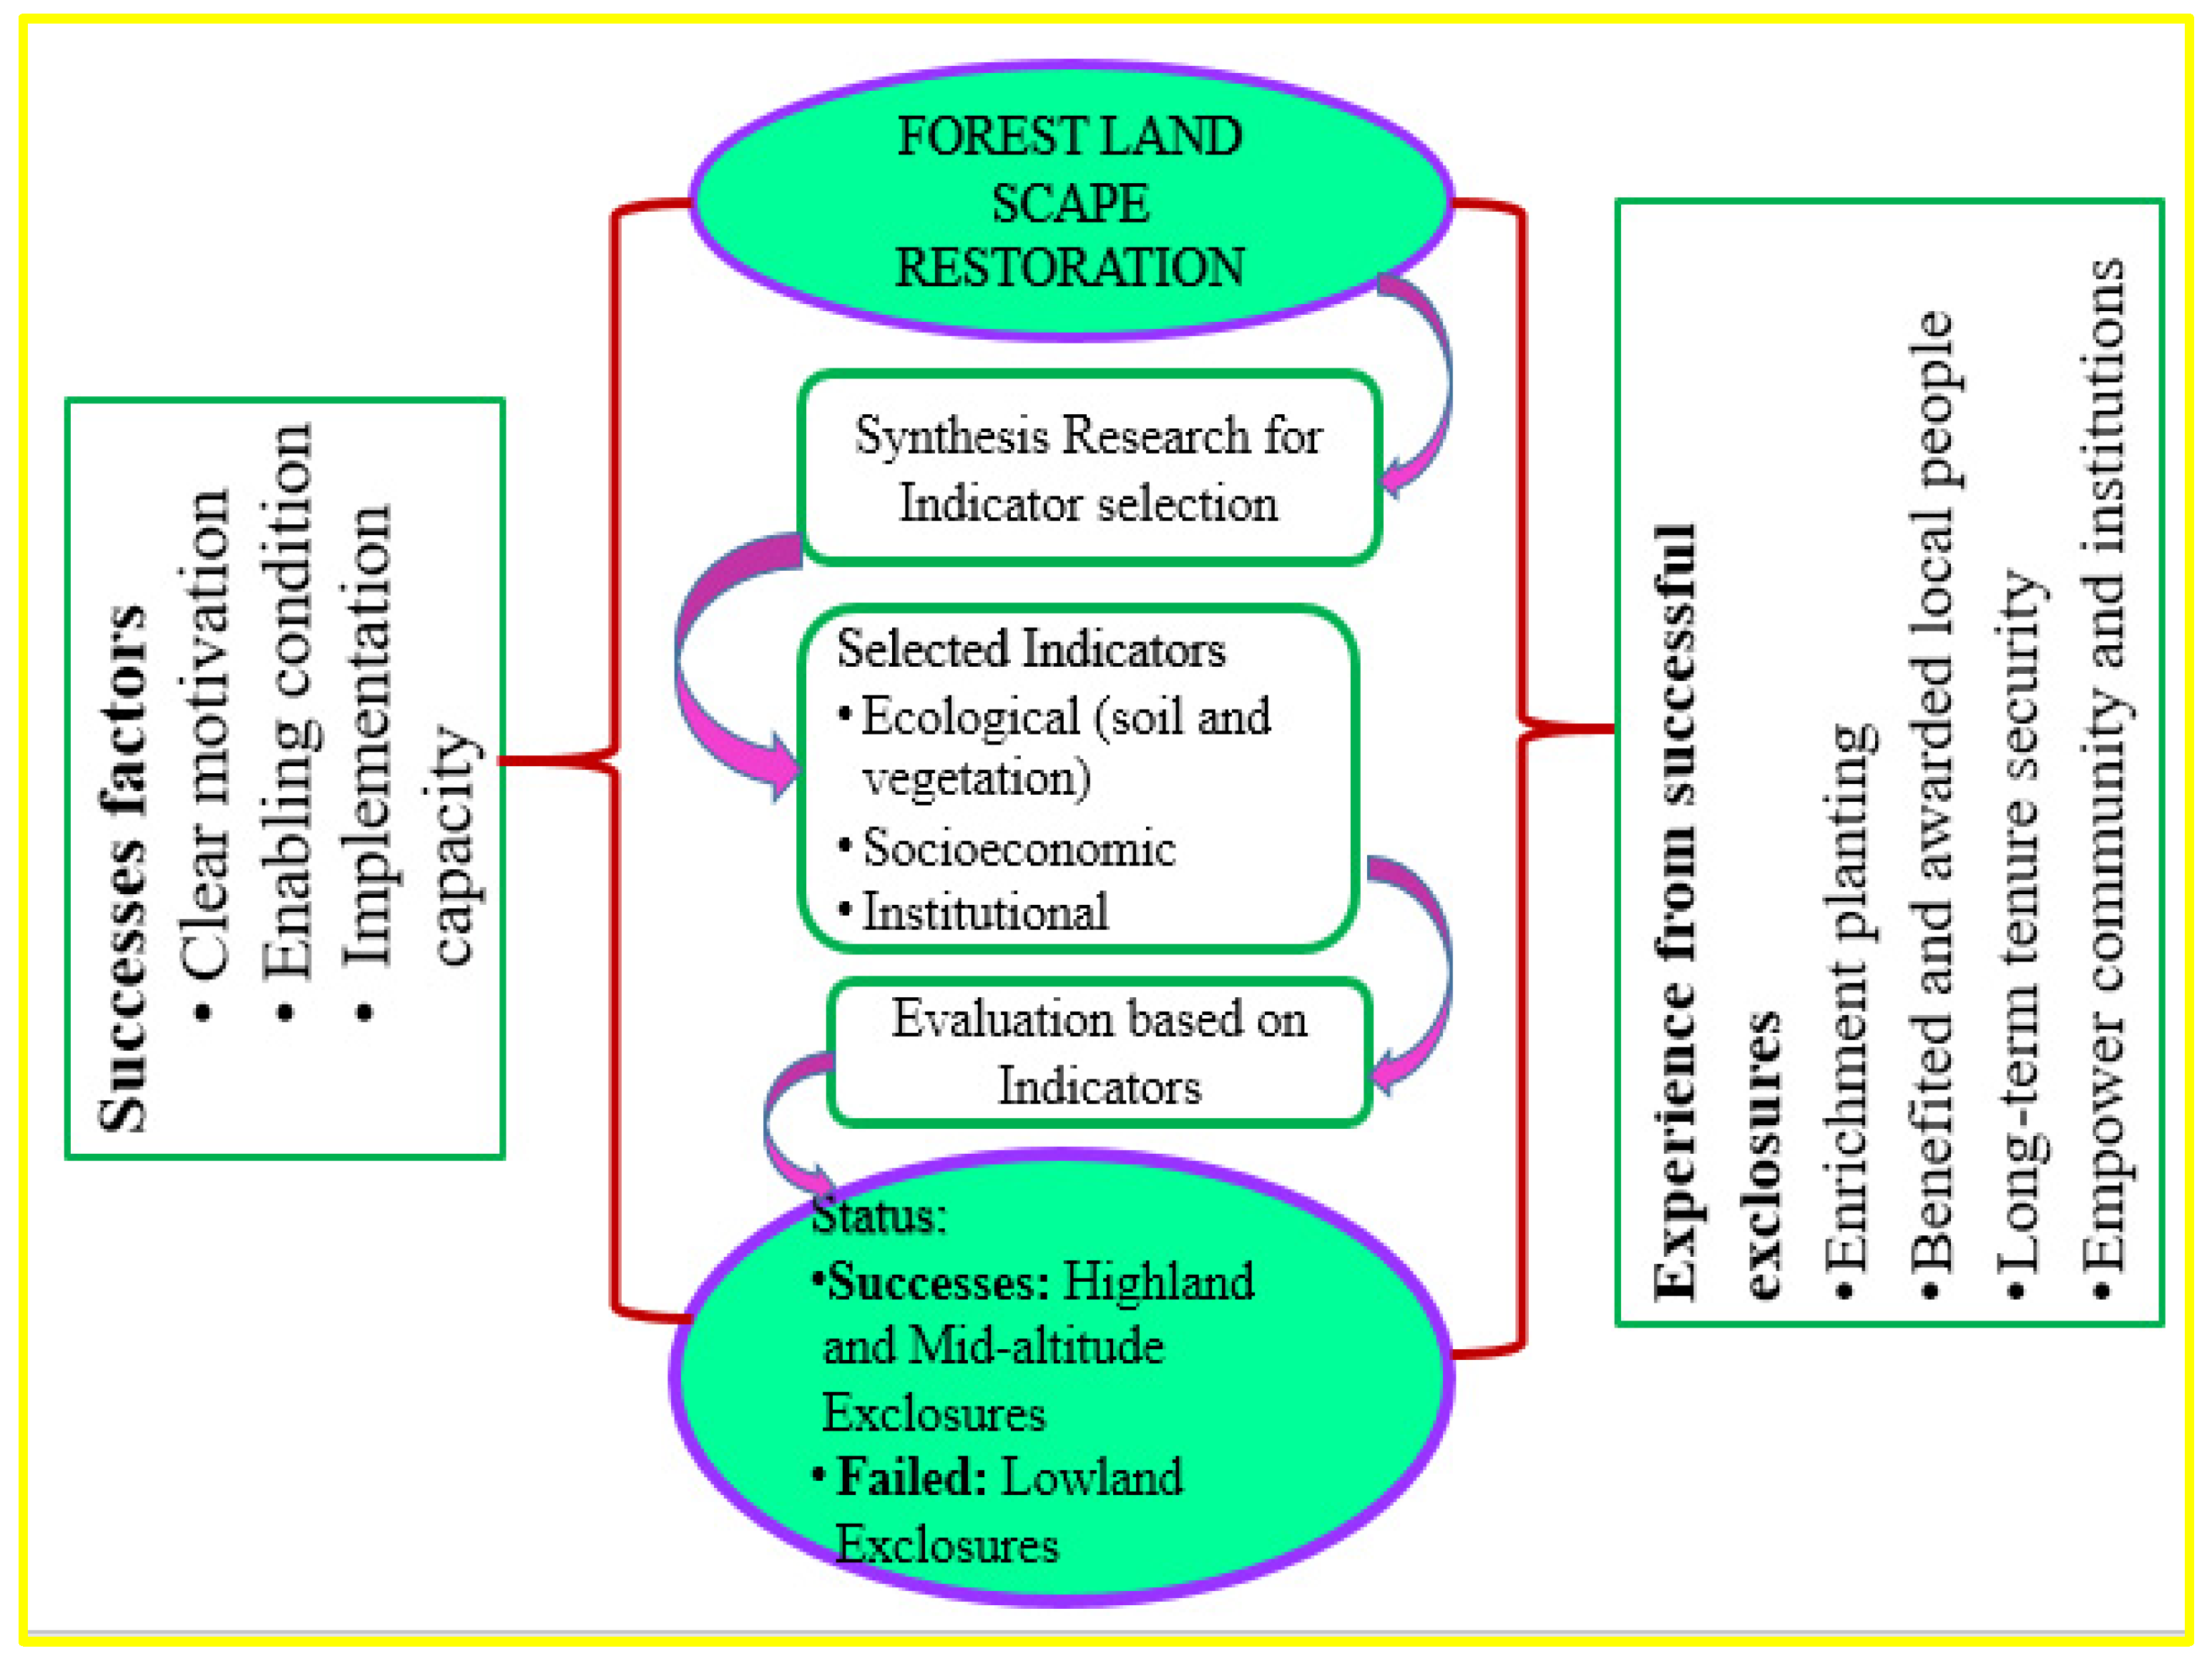
Finally, the conceptual framework for the evaluation of forest landscape restoration was developed (Figure 8).

4. Conclusions and Recommendation

Exclosure is the best strategy for increasing the species diversity, wood density, regeneration, and biomass of a given degraded forest. The exclosure also has species similarities with church forest and open grazing land, as a trajectory from degraded grazing lands to reference adjacent church forests. Thus, the degraded and cleared forest starts a succession whereby it develops to its climax community, then proceeds to get-up-and-go to its former state after exclosures. This leads to sustainable ecosystem goods and services for the community whose livelihood depends on the forest.
Exclosure improves soil nutrients after the area is excluded from livestock and human interferences. The soil nutrient improvement is because of litterfall, grass residue, and herbaceous vegetation decomposition. This is why, in exclosures, livestock and fuelwood collectors do not collect and browse litter, grass residue, and herbaceous vegetation. The soil nutrients facilitate the trajectory of degraded and cleared forest to their former state as close as possible. Thus, exclosure practices substitute the loss of soil by erosion, overexploitation, and aboveground biomass deduction by consequent grazing.
In the lowland study area, natural regeneration was very low. Therefore, enrichment plantations with indigenous tree and shrub species are required. In all study areas, there was extreme disturbance during harvesting of grass for cut-and-carry grass in the regeneration period. Thus, awareness should be given to user groups to care for regenerated seedlings. In mid-altitude study areas, a local bylaw has allowed seasonal cropping. There is high regeneration loss resulting from trampling of livestock entering the exclosures for farming practices. Therefore, the local bylaw should be revised to limit the number of livestock, and awareness should be given to user groups during farming periods. Further research is required for the evaluation of restoration trajectory by establishing permanent plots for greater understanding of forest succession after restoration intervention.

Author Contributions

M.K.: Data collection, analysis, interpretation, writing; A.A. (Abrham Abiyu): Advisor and editor; A.A. (Asmamaw Alemu): Advisor and editor. All authors have read and agreed to the published version of the manuscript.

Funding

There is no funding organization for this research. It is self-sponsored.

Institutional Review Board Statement

For this type of manuscript, formal IRB approval is not required.

Informed Consent Statement

I understand that the information will be published without a name attached, but that full secrecy cannot be guaranteed. I understand that the text and any pictures published in the article will be freely available on the internet and may be seen by the general public. The pictures and text may also appear on other websites or in print, may be translated into other languages, or used for commercial purposes. I have been offered the opportunity to read the article.

Data Availability Statement

The datasets generated during and/or analyzed during the current study are available from the corresponding author on reasonable request.

Conflicts of Interest

There is no conflict of interest in this article and all the contributors are listed as an author.

Appendix A

Table A1. Vegetation compotation.
Land UsesSitesDensity
(ha)
RichnessWoody Biomass
(ton/ha)
LHG Biomass (t/ha)Diversity
(H′)
EvennessDominance
Church forestHighland 144011184.52.32.040.30.8
Mid-altitude 8451247.132.12.270.90.87
Lowland717112594.8 *1.352.30.90.87
Mean100111942.141.92.20.70.84
ExclosuresHighland 22651431.71.961.20.20.43
Mid-altitude 1660712.31.421.730.80.78
Lowland211416613.41.961.10.50.46
Mean201312219.11.761.340.50.55
Open grazing landHighland 15258.70.570.80.20.45
Mid-altitude 24039.90.990.780.50.38
Lowland8505821.60.750.480.30.2
Mean 4144280.070.770.680.330.34
Total Mean11439637.71.481.480.50.58
CV32.33013.827.92632.841.37
LSD694.45.0811240.770.490.190.29
Significance (0.05)**********
NB: * Significant difference between land uses (p < 0.05); ** Significant difference between land uses (p < 0.01).
Table A2. Soil chemical properties across different agro-ecologies, land uses, and soil depths.
Agro-Ecologies Land Use Type Depth pHOC (%)OM (%)TN (%)AvaP (ppm)
HighlandChurch0–10 cm6.11.282.21.5522.4
10–20 cm6.61.783.011.3919.39
20–40 cm6.71.923.311.1721.81
Exclosures 0–10 cm6.60.841.440.0614.9
10–20 cm7.10.661.30.0514.55
20–40 cm7.60.691.20.0410.23
Grazing 0–10 cm6.50.941.610.0512.7
10–20 cm6.50.611320.0311.65
20–40 cm6.50.61.030.0210.32
Mid-altitude Church0–10 cm6.62.033.50.1838.81
10–20 cm5.62.073.460.4124.6
20–40 cm7.10.783.230.459.39
Exclosures 0–10 cm6.70.440.750.045.04
10–20 cm6.90.500.560.474.55
20–40 cm6.30.130.230.102.46
Grazing0–10 cm5.60.500.860.054.36
10–20 cm6.80.510.870.043.22
20–40 cm7.60.950.830.043.43
Lowland Church0–10 cm8.22.063.551.0115.48
10–20 cm8.32.905.001.507.54
20–40 cm8.42.834.881.546.33
Exclosures 0–10 cm6.92.273.911.4411.53
10–20 cm7.21.532.640.8310.44
20–40 cm7.31.732.980.7810.92
Grazing 0–10 cm6.90.851.470.0414.59
10–20 cm7.21.11.480.055.2
20–40 cm7.10.751.460.033.1
Mean6.921.236.990.4911.813
CV8.626.213.1532.831.7
LSD1.040.921.60.5216.2
Significance (0.05)******
NB: * Significant difference between land uses (p < 0.05); ** Significant difference between land uses (p < 0.01).
Table A3. Soil texture across different agro-ecologies, land uses, and soil depths.
Agro-Ecology Land Use Depth (cm)Sand (%)Clay (%)Silt (%)Texture Classes
Highland church0–1080614loamy sand
10–20 cm84412loamy sand
20–4084610loamy sand
exclosures0–108668loamy sand
10–20 cm84610loamy sand
20–4084610loamy sand
grazing land0–108749loamy sand
10–20 cm86410loamy sand
20–4086410loamy sand
Mid-altitudechurch0–1076618Sandy loam
10–20 cm76618Sandy loam
20–40721018Sandy loam
exclosures0–109064sandy
10–20 cm9244sand
20–409244sandy
grazing land0–108947Sandy
10–20 cm87211sandy
20–408947loamy sand
Lowlandchurch0–1082612loamy sand
10–20 cm82810loamy sand
20–40801010Sandy loam
exclosures0–109082sand
10–20 cm82810loamy sand
20–408767loamy sand
grazing land0–109361sandy
10–20 cm9055sandy
20–408865sandy

References

  1. Gumbo, E.; Chidumayo, N.; Davison, J. The Dry Forests and Woodlands of Africa: Managing for Products and Services; Center for International Forestry Research: London, UK; Washington, DC, USA, 2010. [Google Scholar]
  2. EBC. Forest Ecosystem of Ethiopia; Ethiopian Institute of Biodiversity Conservation: Addis Ababa, Ethiopia, 2007. [Google Scholar]
  3. Binyam, A.; Eshetu, Z.; Garedew, E.; Kassa, H. Assessment of Vegetation Characteristics and Production of Boswellia Papyrifera Woodlands in North-Western Lowlands of Ethiopia. Sky J. Agric. Res. 2015, 4, 8–13. [Google Scholar]
  4. Yirdew, E. Deforestation in Tropical Africa. In Sustainable Forestry Challenges for Developing Countries; Palo, M., Mery, G., Eds.; Kluwer Academic Publishers: Helsinki, Finland, 1996; 375p. [Google Scholar]
  5. Alemayehu, W. Ethiopian Church Forests: Opportunities and Challenges for Restoration. Ph.D. Thesis, Wageningen University, Wageningen, The Netherlands, 2007. [Google Scholar]
  6. SER. The SER International Primer on Ecological Restoration; SER: Washington, DC, USA, 2004; Volume 2. [Google Scholar]
  7. Chazdon, R.L. Beyond Deforestation: Restoring Forests and Ecosystem Services on Degraded Lands. Science 2008, 320, 1458–1460. [Google Scholar] [CrossRef] [Green Version]
  8. Danano, D. Area Closure for Rehabilitation Ethiopia—Meret Mekelel Enclosing; WOCAT: 2003. Available online: https://qcat.wocat.net/en/wocat/technologies/view/technologies_1048/ (accessed on 1 March 2022).
  9. Azene, B.T. Useful Trees and Shrubs of Ethiopia: Identification, Propagation, and Management for 17 Agroclimatic Zones, 1st ed.; RELMA in ICRAF Project World Agroforestry Centre, East Africa Region: Nairobi, Kenya, 2007. [Google Scholar]
  10. Kent, M. Vegetation Description and Analysis: A Practical Approach, 2nd ed.; John Wiley & Sons, Ltd.: Chichester, UK, 2012; Volume 159. [Google Scholar]
  11. Shannon, C.E. A Mathematical Theory of Communication. Bell Syst. Tech. J. 1948, 27, 379–423. [Google Scholar] [CrossRef] [Green Version]
  12. Gotelli, N.J.; Chao, A. Measuring and Estimating Species Richness, Species Diversity, and Biotic Similarity from Sampling Data, 2nd ed.; Elsevier Ltd.: Waltham, MA, USA, 2013; Volume 5. [Google Scholar]
  13. Pielou, E.C. The Measurement of Diversity in Different Types of Biological Collections. J. Theory Biol. 1966, 13, 131–144. [Google Scholar] [CrossRef]
  14. Chave, J.; Réjou-Méchain, M.; Búrquez, A.; Chidumayo, E.; Colgan, M.S.; Delitti, W.B.; Duque, A.; Eid, T.; Fearnside, P.M.; Goodman, R.C.; et al. Improved Allometric Models to Estimate the Aboveground Biomass of Tropical Trees. Glob. Chang. Biol. 2014, 20, 3177–3190. [Google Scholar] [CrossRef] [PubMed]
  15. Anonymous. Ethiopia’s Forest Reference Level Submission to the UNFCCC; REDD+ Ethiopia: Addis Ababa, Ethiopia, 2016. [Google Scholar]
  16. Subedi, B.P.; Pandey, S.S.; Pandey, A.; Rana, E.B.; Bhattarai, S.; Banskota, T.R.; Charmakar, S.; Tamrakar, R. Forest Carbon Stock Measurement Guidelines for Measuring Carbon Stocks in Community Management Forest; ANSAB: Kathmandu, Nepal; FECOFUN: Kathmandu, Nepal; ICIMOD: Kathmandu, Nepal, 2010. [Google Scholar]
  17. Bazezew, M.N.; Soromessa, T.; Bayable, E. Above- and Below-Ground Reserved Carbon in Danaba Community Forest of Oromia Region, Ethiopia: Implications for CO2 Emission Balance. Am. J. Environ. Prot. 2015, 4, 75–82. [Google Scholar] [CrossRef]
  18. IPCC. Guidelines for National Greenhouse Gas Inventories; Eggleston, H.S., Miwa, K., Srivastava, N., Tanabe, K., Eds.; IGES: Kanagawa, Japan, 2008. [Google Scholar]
  19. Sahlemedhin Sertsu, T.B. Procedures for Soil and Plant Analysis; No. 74; Technical Paper: Addis Ababa, Ethiopia, 2000. [Google Scholar]
  20. Tsetargew, A. Area Closure as a Strategy for Land Management: A Case Study at Kelala Dalcha Enclosures in the Central Rift Valley of Southern Ethiopia. Ph.D. Thesis, Addiss Ababa University, Addis Ababa, Ethiopia, 2008. [Google Scholar]
  21. Lelago, A.; Mamo, T.; Haile, W.; Shiferaw, H. Assessment and Mapping of Status and Spatial Distribution of Soil Macronutrients in Kambata Tembaro. Adv. Plants Agric. Res. Assess. 2016, 4, 305–317. [Google Scholar] [CrossRef]
  22. Birhane, E.; Teketay, D.; Barklund, P. Enclosures to Enhance Woody Species Diversity in the Dry Lands of Eastern Tigray, Ethiopia. East Afr. J. Sci. 2007, 1, 136–147. [Google Scholar] [CrossRef]
  23. Kibret, M. Enclosure is a Viable Option for Rehabilitation of Degraded Lands and Biodiversity Conservation: The Case of Kallu Woreda, Southern Wollo. Master’s Thesis, Addis Ababa University, Adis Abeba, Ethiopia, 2008. [Google Scholar]
  24. Asmamaw, M. The Role of Area Closures for Soil and Woody Vegetation the Role of Area Closures for Soil and Woody Vegetation Rehabilitation in Kewot District, North Shewa. Master’s Thesis, Addis Ababa University, Adis Ababa, Ethiopia, 2011. [Google Scholar]
  25. Manaye, A. Review on Contribution of Exclosures for Restoration of Woody Species Diversity and Regulating Ecosystem Services in Ethiopia. Adv. Life Sci. Technol. 2017, 58, 10–17. [Google Scholar]
  26. Mengistu, T.; Teketay, D.; Hulten, H.; Yemshaw, Y. The role of enclosures in the recovery of woody vegetation in degraded dryland hillsides of central and northern Ethiopia. J. Arid Environ. 2005, 60, 259–281. [Google Scholar] [CrossRef]
  27. Neelo, J.; Teketay, D.; Kashe, K.; Masamba, W. Stand Structure, Diversity and Regeneration Status of Woody Species in Open and Exclosed Dry Woodland Sites around Molapo Farming Areas of the Okavango Delta, Northeastern Botswana. Open J. For. 2015, 05, 313–328. [Google Scholar] [CrossRef] [Green Version]
  28. Berhanu, A.; Demissew, S.; Woldu, Z.; Didita, M. Woody Species Composition and Structure of Kuandisha Afromontane Forest Fragment in Northwestern Ethiopia. J. For. Res. 2017, 28, 343–355. [Google Scholar] [CrossRef]
  29. Simpson, E.H. Measurement of Diversity. Nature 1949, 163, 688. [Google Scholar] [CrossRef]
  30. Abebe, M.H.; Oba, G.; Angassa, A.; Weladji, R.B. The Role of Area Enclosures and Fallow Age in the Restoration of Plant Diversity in Northern Ethiopia. Afr. J. Ecol. 2006, 44, 507–514. [Google Scholar] [CrossRef]
  31. Yaynshet, T. The Effects of Exclosures in Restoring Degraded Semi-Arid Vegetation in Communal Grazing Lands in Northern Ethiopia. J. Arid Environ. 2009, 73, 542–549. [Google Scholar] [CrossRef]
  32. Tsegaw, A.; Temesgen, A. Area Exclosure as a Government Strategy to Restore Woody Plant Species Diversity: Case Study in Southern Ethiopia. Int. J. Agric. Biosyst. Eng. 2015, 2, 16949. [Google Scholar]
  33. Ombega, N.J.; Mureithi, S.M.; Koech, O.; Karuma, A.N.; Gachene, C.K.K. Effect of rangeland rehabilitation on the herbaceous species composition and diversity in Suswa catchment, Narok County, Kenya. Ecol. Process. 2017, 6, 41. [Google Scholar] [CrossRef] [Green Version]
  34. Teketay, D.; Kashe, K.; Madome, J.; Kabelo, M.; Neelo, J.; Mmusi, M.; Masamba, W. Enhancement of diversity, stand structure and regeneration of woody species through area exclosure: The case of a mopane woodland in northern Botswana. Ecol. Process. 2018, 7, 5. [Google Scholar] [CrossRef]
  35. Yayneshet, T. Restoration of Degraded Semi-Arid Communal Grazing Land Vegetation Using the Exclosure Model. Int. J. Water Resour. Arid. Environ. 2011, 1, 382–386. [Google Scholar]
  36. Asefa, D.T.; Oba, G.; Weladji, R.B.; Colman, J.E. An Assessment of Restoration of Biodiversity in Degraded High Mountain Grazing Lands in Northern Ethiopia. Land Degrad. Dev. 2003, 14, 25–38. [Google Scholar] [CrossRef]
  37. Mekuria, W.; Langan, S.; Johnston, R.; Belay, B.; Amare, D.; Gashaw, T.; Desta, G.; Noble, A.; Wale, A. Restoring Aboveground Carbon and Biodiversity: A Case Study from the Nile Basin, Ethiopia. For. Sci. Technol. 2015, 11, 86–96. [Google Scholar] [CrossRef]
  38. Angassa, A.; Oba, G. Effects of Grazing Pressure, Age of Enclosures and Seasonality on Bush Cover Dynamics and Vegetation Composition in Southern Ethiopia. J. Arid Environ. 2010, 74, 111–120. [Google Scholar] [CrossRef]
  39. Adamu, H. Study on Indigenous Tree and Shrub Species of Churches, and Monasteries of Wag-Lasta District. In Proceedings of the 1st Annual Regional Conference on Completed Research on Natural Resources Management, ARARI, Bahir Dar Ethiopia, 14–17 August 2006; Amhara Agricultural Research Institute: Bahir Dar, Ethiopia, 2006; pp. 1–6. [Google Scholar]
  40. Stanturf, J.A.; Palik, B.; Williams, M.I.; Dumroese, R.K.; Madsen, P. Forest Restoration Paradigms. J. Sustain. For. 2014, 33, S161–S194. [Google Scholar] [CrossRef] [Green Version]
  41. Rong, Y.; Yuan, F.; Ma, L. Effectiveness of exclosures for restoring soils and vegetation degraded by overgrazing in the Junggar Basin, China. Grassl. Sci. 2014, 60, 118–124. [Google Scholar] [CrossRef]
  42. Mekuria, W. Changes in Regulating Ecosystem Services Following Establishing Exclosures on Communal Grazing Lands in Ethiopia: A Synthesis. J. Ecosyst. 2013, 2013, 860736. [Google Scholar] [CrossRef] [Green Version]
  43. Qasim, S.; Gul, S.; Shah, M.H.; Hussain, F.; Ahmad, S.; Islam, M.; Rehman, G.; Yaqoob, M.; Shah, S.Q. Influence of grazing exclosure on vegetation biomass and soil quality. Int. Soil Water Conserv. Res. 2017, 5, 62–68. [Google Scholar] [CrossRef]
  44. Descheemaeker, K.; Nyssen, J.; Poesen, J.; Haile, M.; Muys, B.; Raes, D.; Moeyersons, J.; Deckers, J. Soil and Water Conservation Through Forest Restoration in Exclosures of the Tigray Highlands. J. Drylands 2006, 1, 118–133. [Google Scholar]
  45. Mekuria, W.; Veldkamp, E.; Haile, M. Carbon Stock Changes with Relation to Land Use Conversion in the Lowlands of Tigray, Ethiopia. In Conference on International Research on Food Security, Natural Resource Management and Rural Development; University of Hamburg: Hamburg, Germany, 2009. [Google Scholar]
  46. Mokria, M.; Mekuria, W.; Gebrekirstos, A.; Aynekulu, E.; Belay, B.; Gashaw, T.; Bräuning, A. Mixed-species allometric equations and estimation of aboveground biomass and carbon stocks in restoring degraded landscape in northern Ethiopia. Environ. Res. Lett. 2018, 13, 024022. [Google Scholar] [CrossRef]
  47. Shimamoto, C.Y.; Botosso, P.C.; Marques, M.C. How much carbon is sequestered during the restoration of tropical forests? Estimates from tree species in the Brazilian Atlantic Forest. For. Ecol. Manag. 2014, 329, 1–9. [Google Scholar] [CrossRef]
  48. Verdoodt, A.; Mureithi, S.M.; Van Ranst, E. Impacts of management and enclosure age on recovery of the herbaceous rangeland vegetation in semi-arid Kenya. J. Arid Environ. 2010, 74, 1066–1073. [Google Scholar] [CrossRef]
  49. Prasad, R.; Power, J.F. Soil Fertility Management for Sustainable Agriculture; CRC Press LLC: Boca Raton, FL, USA, 1997. [Google Scholar]
  50. Mekuria, W.; Aynekulu, E. Exclosure Land Management for Restoration of the Soils in Degraded Communal Grazing Lands in Northern Ethiopia. Land Degrad. Dev. 2011, 24, 528–538. [Google Scholar] [CrossRef]
  51. Temesgen, A.; Feyssa, D.H.; Kissi, E. Area Exclosure as a Strategy to Restore Soil Fertility Status in Degraded Land in Area Exclosure as a Strategy to Restore Soil Fertility Status in Degraded Land In. Int. J. Life Sci. Chem. 2014, 31, 538–545. [Google Scholar]
  52. Mekuria, W.; Langan, S.; Noble, A.; Johnston, R. Soil Restoration after seven Years of Exclosure Management in Northwestern Ethiopia. Land Degrad. Dev. 2016, 28, 1287–1297. [Google Scholar] [CrossRef]
  53. Endale, T. Dynamics of Soil Physico-Chemical Properties in Area Closures at Hirna Watershed of West Hararghe Zone of Oromia Region, Ethiopia. Int. J. Soil Sci. 2016, 11, 1–8. [Google Scholar] [CrossRef] [Green Version]
  54. Gomez, J.A.; Delgado, A. The Soil. Physical, Chemical, and Biological Properties, 1st ed.; Springer International Publishing: Svilla, Spain, 2016. [Google Scholar]
  55. Vogt, D.J.; Tilley, J.P.; Edmonds, R.L. Soil and Plant Analysis for Forest Ecosystem Characterization. In Ecosystem Science and Applications; Higher Education Press: Berlin, Germany; Walter de Gruyter GmbH: Berlin, Germany, 2015. [Google Scholar]
  56. Mekuria, W.; Veldkamp, E.; Haile, M.; Nyssen, J.; Muys, B.; Gebrehiwot, K. Effectiveness of exclosures to restore degraded soils as a result of overgrazing in Tigray, Ethiopia. J. Arid Environ. 2007, 69, 270–284. [Google Scholar] [CrossRef]
Figure 1. Map of the study area.
Environsciproc 13 00014 g001
Figure 2. Woody species density.
Environsciproc 13 00014 g002
Figure 3. Species richness of different land uses at different sites.
Environsciproc 13 00014 g003
Figure 4. Species similarity index.
Environsciproc 13 00014 g004
Figure 5. Regeneration status of woody species across different land uses.
Environsciproc 13 00014 g005
Figure 6. Soil organic carbon in different soil depth and land uses.
Environsciproc 13 00014 g006
Figure 7. Soil total nitrogen in different soil depths and land use.
Environsciproc 13 00014 g007
Figure 8. Conceptual framework for Forest Landscape Restoration.
Environsciproc 13 00014 g008
Table 1. Characteristics of the study area.
AttributesHighland (Lasta)Mid-Altitude (Sekota)Lowland (Abergele)
Altitude (m.a.sl.)2129 to 36001340 to 2200500 to 1300
Rainfall (mm)500 to 1000350 to 700250 to 750
Temperature (°C)24.516 to 2723 to 43
SoilEutric Cambisols (51%)Umbric Leptosols (52%)Eutric Leptosols (29%)
Agro-ecologyDega (52.7%)Woyena-Dega (65%)Dry Kolla (55%)
TopographyChain of mountains, hills ad cliffs
Vegetationbushy woodlands and forest only at churches
Area of Selected Exclosure9.8 ha3 ha3.268 ha
Area of Selected Church forest54 ha8.87 ha11.35 ha
Area of Selected Grazing8.5 ha2 ha6.7 ha
Age of Exclosures10 years10 years10 years
Table 2. Species diversity and evenness in different land use and agro-ecology.
Agro-EcologyLand UseSpecies Diversity (H′)Evenness (E)
HighlandChurch forest2.040.3
Exclosure area1.20.16
grazing land0.80.15
Mid-altitudeChurch forest2.270.9
Exclosure area1.730.79
grazing land0.780.48
Low landChurch forest2.30.95
Exclosure area1.10.5
grazing land0.480.3
Table 3. Population status in different DBH-classes in highland study areas.
DBH Classes (cm)Number of Individuals in Church ForestsNumber of Individuals in Area ExclosuresNumber of Individuals in Grazing Lands
1–14765131338
15–292602550
30–44905088
45–597560
60–7420130
>757000
Table 4. Population status in different DBH classes in mid-altitude study areas.
DBH Classes (cm)Number of Individuals in Church ForestsNumber of Individuals in Area ExclosuresNumber of Individuals in Grazing Lands
1–51251138175
5.1–15200850675
15.1–3025016350
30.1–451300
>45.15000
Table 5. Population status in different DBH-classes in the lowland study areas.
DBH Classes (cm)Number of Individuals in Church ForestsNumber of Individuals in Area ExclosuresNumber of Individuals in Grazing Lands
<1025013132500
10.1–20100344275
21.1–301138845
30.140383820
>412385010
Table 6. Mean woody, litter, grasses, and herbaceous biomass.
Agro-EcologyLand UsesWoody Biomass (Ton ha−1)Litter, Grass, and Herb Biomass (Ton ha−1)
Highland Church forests184.52.3
Area exclosures 31.71.96
Grazing lands 8.70.57
Mid-altitude Church forests47.132.1
Area exclosures 12.31.42
Grazing lands 9.90.99
Lowland Church forests2594.51.35
Area exclosures 613.41.96
Grazing lands 821.30.75
Mean480.381.49
p-value0.0450.016
Significance (0.05)**
(* shows there is significant difference at 0.05 alpha level).
Table 7. Soil particle content of the study site ± Standard error of the mean (n = 9). (Values with different letter have significant difference and values with similar letter have no significant difference).
Agro-EcologyLand UseSand (%)Clay (%)Silt (%)Texture Classes
Highland church82.6 ± 1.2 A5.4 ± 0.74 A12.3 ± 1.1 Aloamy sand
exclosure84.6 ± 1.2 B6 ± 0.74 AB9.4 ± 1.1 Bloamy sand
grazing land86.3 ± 1.2 B4 ± 0.74 BC9.6 ± 1.1 Bloamy sand
Mid-altitudechurch74.6 ± 1.2 A7.4 ± 0.74 A18 ± 1.1 ASandy loam
exclosure91.3 ± 1.2 B4.6 ± 0.74 AB4 ± 1.1 BSandy
grazing land88.3 ± 1.2 B3.3 ± 0.74 BC8.4 ± 1.1 BSandy
Lowlandchurch81.3 ± 1.2 A8 ± 0.74 A10.7 ± 1.1 Aloamy sand
exclosure86.4 ± 1.2 B7.3 ± 0.74 AB6.3 ± 1.1 Bsand
grazing land90.4 ± 1.2 B5.6 ± 0.74 BC4 ± 1.1 BSandy
Table 8. Soil pH and available phosphorus in different soil depths and land uses.
Agro-EcologyLand UsesSoil pHAvaP (ppm)
Highland Church forests6.525.56
Area exclosures 7.110.49
Grazing lands 6.510.55
Mid-altitude Church forests6.417.2
Area exclosures 6.69.8
Grazing lands 6.76.69
Lowland Church forests8.312.5
Area exclosures 7.17.87
Grazing lands 7.15.6
Mean 6.911.80
p-value0.0490.048
Significance (0.05)**
(* shows there is significant difference at 0.05 alpha level).
Publisher’s Note: MDPI stays neutral with regard to jurisdictional claims in published maps and institutional affiliations.

