1. Introduction
In just a decade, the EU needs to double its renewable share up to 40% by 2030 [
1]. The current Commission’s vision for the integrated energy system of the future is to increase renewables in sectors such as transport, buildings and industry [
2]. PEDs might be a solution to boost this transition, as they are designed following a holistic approach, combining Renewable Energy Sources (RES), energy efficiency measures and mixed-use buildings (which could even include industrial buildings). PEDs can be understood as “a district with annual net zero energy import and net zero CO
2 emissions, working towards an annual local surplus production of renewable energy” [
3]. However, and despite all the scientific efforts, no common standard definition of PED has been achieved. Nevertheless, it is mostly agreed, and according to EERA JPSC and JPI UE [
4], that the main two aspects that categorize PEDs are the boundaries (geographical, virtual, or functional) and the energy exchanges (import/export) to reach a net positive annual energy balance (PEB). The evaluation of the energy balance is not trivial, as it requires assumptions, limitations regarding the boundary and critical elements to be considered. As stated in some research [
5,
6], different assumptions and approaches need to be followed while evaluating the energy balance of a district if compared to a single building assessment. The latter one usually follows the ISO 52000-1:2017 standard, in which the general framework of the Energy Performance of Buildings (EPB) assessment is explained. This standard is based on primary energy as the main indicator. Within the H2020 MAKING CITY project [
7], a methodology for calculating the energy balance of PEDs has been developed to support the design of the PED itself [
6]. The methodology consists of eight steps, and it will be illustrated by each case.
This paper aims to validate the MAKING-CITY methodology for calculating the energy balance of PEDs with two case studies. The first one evaluates the achievement of energy surplus in a PED in Groningen, a geographically bounded district that is at implementation stage. The second one, Torrelago, tests whether it is possible to transform an existing Nearly Zero Energy District (NZED) into a PED, investigating different options within the city limits. Therefore, here, the methodology is validated and illustrated with case studies that can help other PEDs and districts in the evaluation of its energy exchanges. Moreover, the two cases show the applicability of the methodology as well in the design phase as in the implementation phase of a smart city project.
2. Case Study 1: Groningen PED Case
Groningen has performed the MAKING-CITY methodology for calculating the energy balance of PEDs during the implementation phase of the interventions at district level.
Step 1: Definition of PED. Groningen has the ambition of becoming energy neutral by 2035 [
8]. For this reason, the choice of the PED areas was strictly dependent on the upscaling and replicability potential of the building stock and solutions to be implemented. The following factors were determining: (1) combination of new built and existing building stock; (2) variety of the building portfolio in the areas based on their typology, dimension, age and degree of replicability; (3) possibilities of RES in the potential PED areas; (4) choice of solutions and interventions that could be implemented in other districts and that should be incorporated into the district energy approach. The selected area consists of a new and energy positive sport centre, a new and not-energy-positive office and apartments building, and an existing and energy intensive office building. RES in the surroundings are solar parks, solar roads, solar pontoons and photovoltaic (PV).
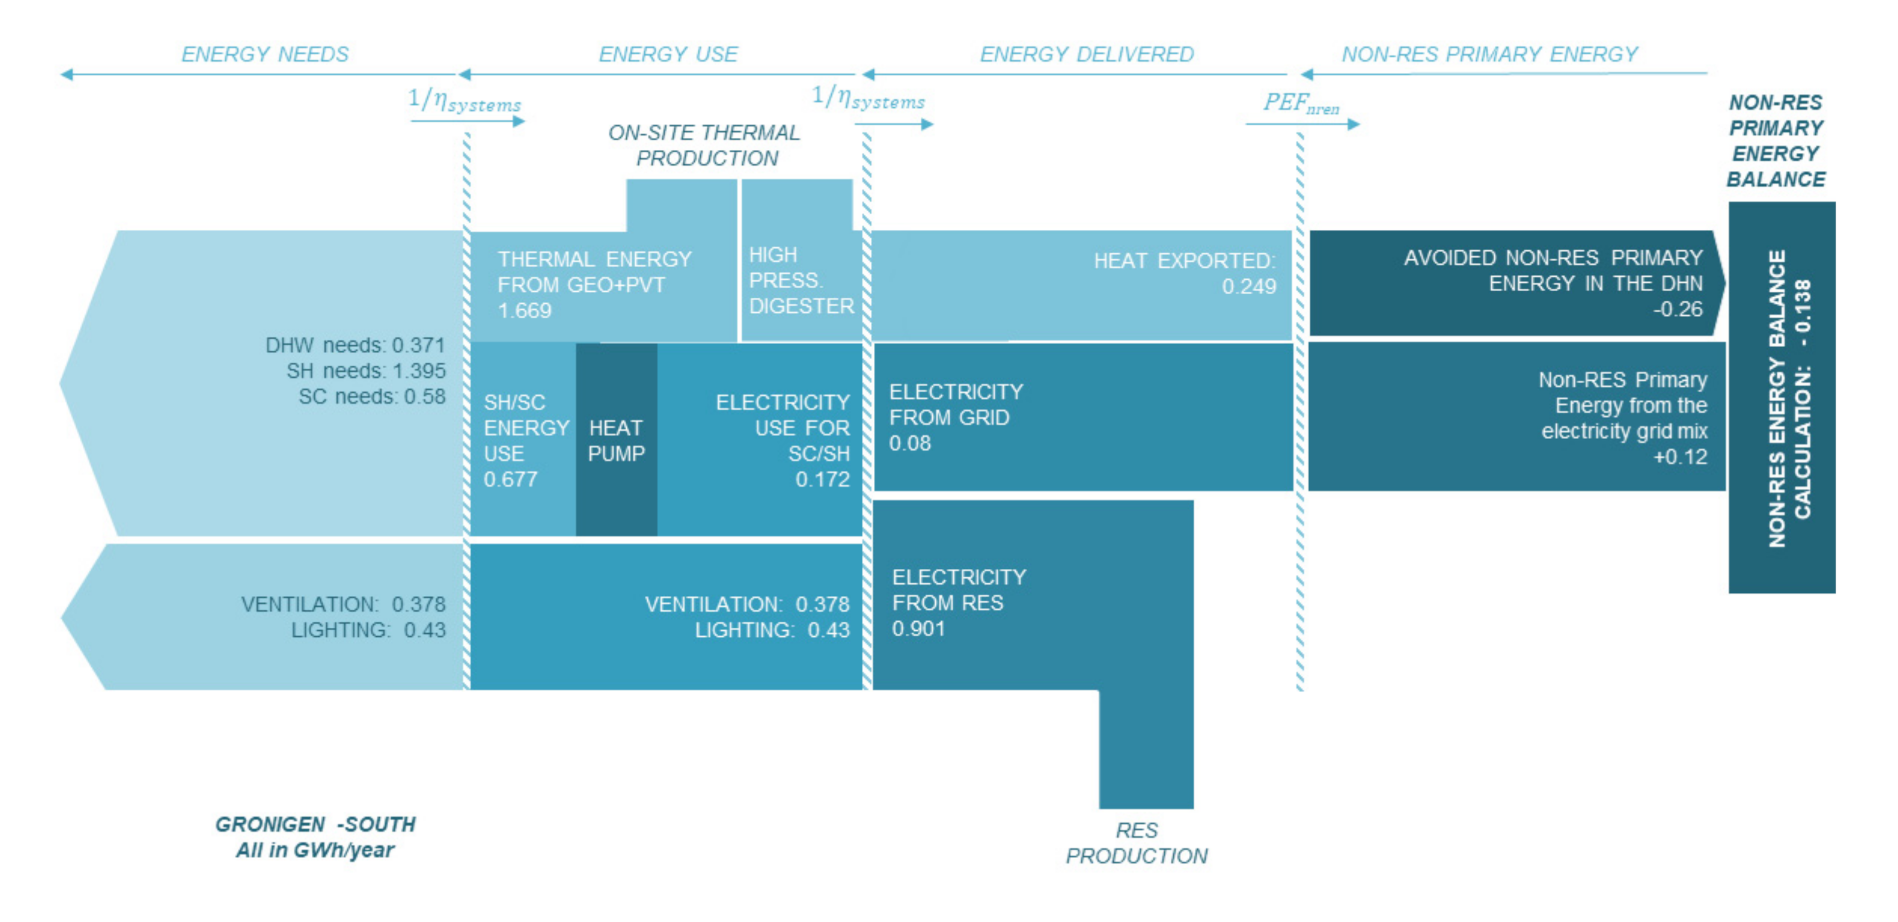
Step 2: Energy needs inside the PED. The data to evaluate the energy needs are based on the related Energy Performance Certificates (EPC) calculations and on the measured values provided by the District System Operator (DSO). The area has a thermal energy need of 2.35 GWh/year and an electric energy need of 0.8 GWh/year. The buildings where the interventions take place represent only a small portion of the district. Therefore, only a fraction of the RES production is considered, equal to the relative floor area of the buildings that undergo PED interventions compared to the entire PED.
Step 3: Energy use inside the PED. Thermal and electric energy uses are calculated dividing the energy needs by the efficiency of the emitters and the distribution losses, which is considered as 1 as no distribution losses were considered. This results in 1.67 GWh/year as thermal energy use and 0.98 GWh/year as electric energy use.
Step 4: RES production inside the PED. RES electric solar generation in the PED produces 0.9 GWh/year. RES thermal energy generation in the PED is derived from geothermal district heating network (DHN), PVT-H panels and a high-pressure digestion (total thermal energy from RES = 1.92 GWh/year). Considering the difference between the energy use and the RES energy generation, it appears that for heating there is a surplus that can be exported outside the PED boundaries (−0.25 GWh/year), while for electricity, there is a gap that has to be covered by external sources (0.08 GWh/year).
Step 5: Estimation of the energy delivered to/from the PED. The PED delivers a surplus of thermal energy that can be exported to the district heating network (−0.25 GWh/year), while part of the electric energy (0.08 GWh/year) is delivered to the PED by the national power grid.
Step 6 and 7: Calculation of the primary energy and primary energy balance. The primary energy is calculated considering the delivered energy multiplied by the PEFnren (non-renewable primary energy factor): PEFnren for electric national grid = 1.46; PEFnren for national district heating = 1.03. The PEB is calculated as the difference between the primary energy imported to the PED and the primary energy exported outside the PED. In Groningen, this is equal to −0.14 GWh/year. Therefore, the PED is achieved.
Step 8: Sankey Diagram.Figure 1 shows the energy diagram flows for the PED in Groningen.
3. Case Study 2: Torrelago NZED Case
Torrelago is one of the demo cities of the CITyFiED project, where the energy efficiency of the city districts was enhanced to achieve NZED [
9]. The MAKING-CITY methodology for calculating the energy balance of PEDs has been tested to perform a feasibility study to assess whether it is possible to transform the NZED into a PED at the design phase of the district.
Step 1: Definition of PED. The area considered consists of 31 buildings and a school interconnected through a DHN. As stated at the CITyFiED project, the roof space at the buildings is very small; thus, empty slots nearby the district (less than 1 km) are considered for the installation of solar technologies.
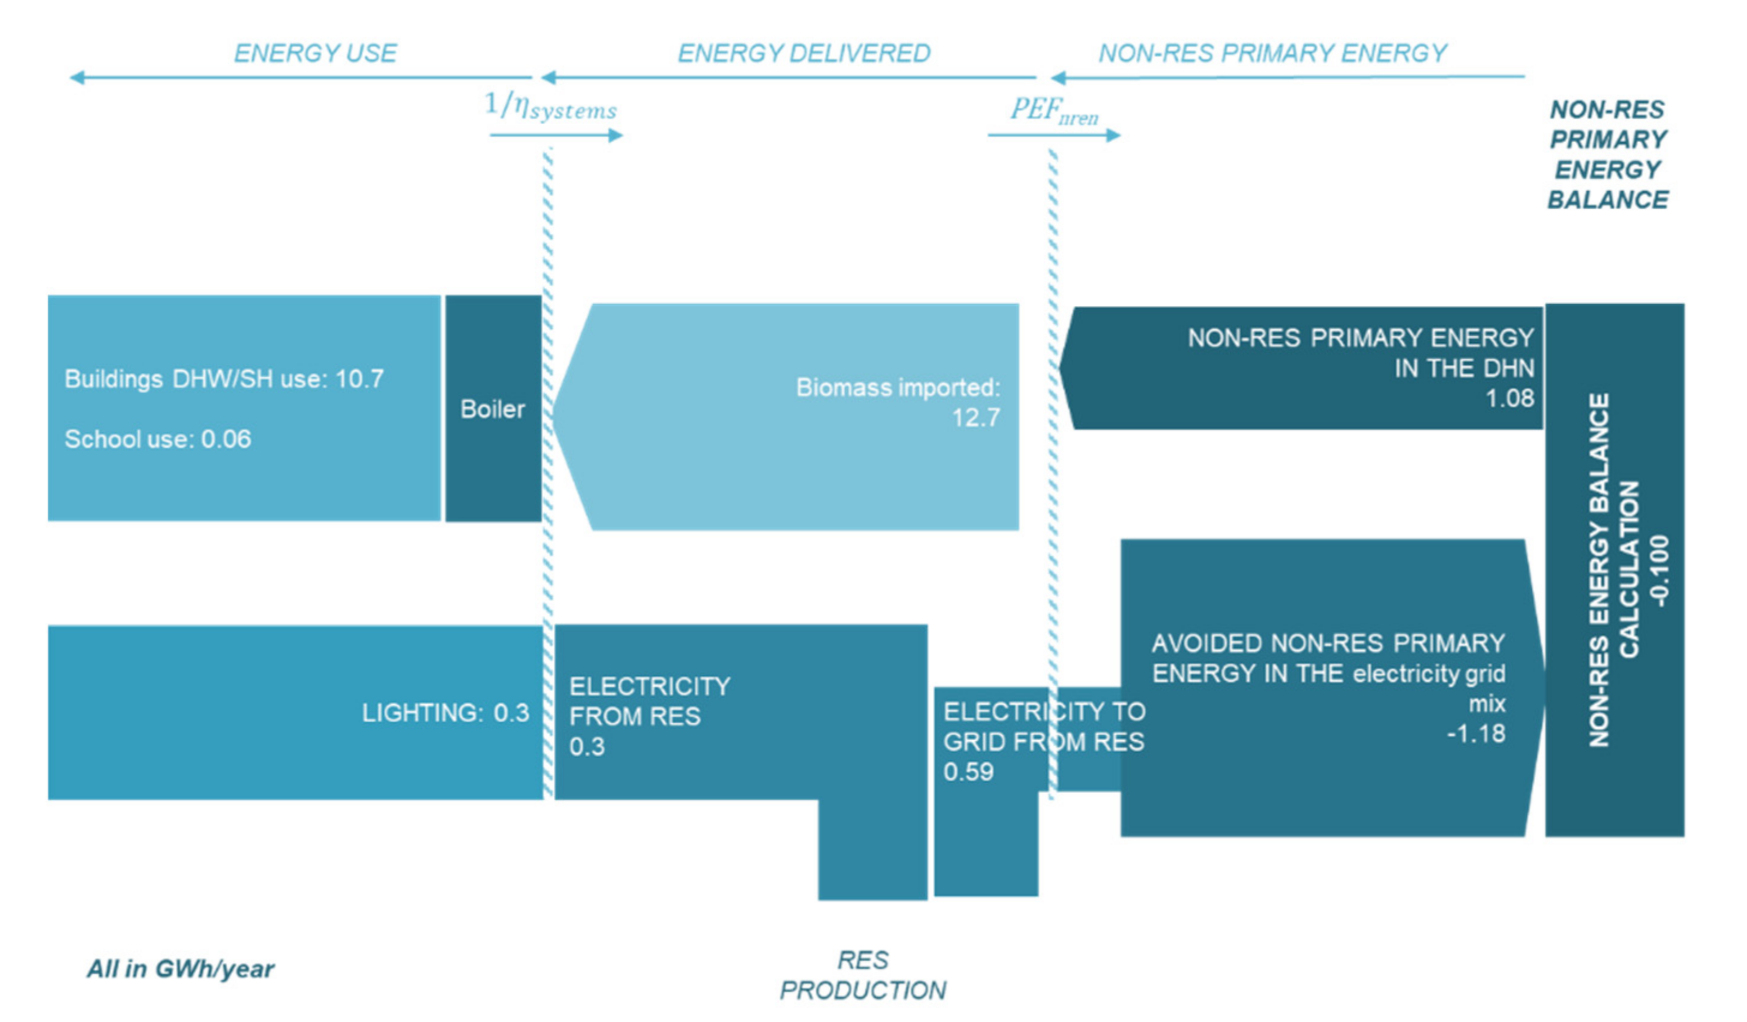
Step 2 and 3: Energy needs and energy use inside the PED. As the CITyFiED project measured the energy consumption of the building and the energy use (heat produced by the DHN), step 2 is not used in the methodology. The heat produced by the DHN to cover domestic hot water and space heating of the buildings is used as the “thermal energy used”, which is 10.7 GWh/year [
10]. Furthermore, the school demand was estimated to be 60 MWh/year [
11]. No cooling demand is foreseen. The electricity consumed by the buildings was not monitored, so it is estimated to be 0.31 GWh/year by using national statistics indicators from Spahousec Project [
12].
Step 4: RES production inside the PED. As RES generation alternatives, the following scenarios are studied: (1) PV + solar thermal; (2) PV + 100% biomass supply in the DHN; (3) PV + replacement of the current DHN boiler to a biomass-fired CHP. The method followed is to go back and forth from the estimation of local RES production (step 4) to the calculation of the positive energy balance (step 7), until the energy surplus is reached. The solver of excel is used to achieve the positive balance of -100 MW/year and a payback period less than 3 years (assuming specific costs per unit of kW installed). As a result, scenario 2 is the most feasible in terms of costs and space needed. The total electricity production from PV is 0.9 GWh/year and the total thermal production is 10.76 GWh/year.
Step 5: Estimation of the energy delivered to/from the PED. The PED delivers a surplus of electric energy that can be exported to the power grid (−0.59 GWh/year), while to cover the thermal energy use of the district, biomass is imported (12.7 GWh/year).
Step 6 and 7: Calculation of the primary energy and primary energy balance. The factors considered are: PEFnren for electric-national grid = 2.007; PEFnren for biomass = 0.085. In Torrelago, the PEB is equal to −0.1 GWh/year. Therefore, the PED is achieved.
Step 8: Sankey Diagram.Figure 2 shows the energy diagram flows.
4. Discussion and Conclusions
Correspondingly, the Groningen PED is supplied partially by the power grid, compensating it with heat exported to the district heating network. In Torrelago, there is a need for at least 535 kWp of PV installation in order to be able to meet the electric demand and also to compensate for the biomass use within the district. For the calculation in both case studies, PEFnren has been adopted since there is still lack of standardization regarding the calculation of renewable primary energy factors.
At the design stage of any district such as in the Torrelago case, the amount of energy to be exported, budget limitations and other design parameters need to be considered to be able to design the PED and go through all steps. Groningen followed a similar approach at this stage, and later on will need to implement monitoring solutions and control strategies to measure the achievement of the energy surplus. Note that for PED studies in general, one has to aggregate and disaggregate energy balance calculations, see [
13].
This paper focuses on the validation of the calculation methodology of the annual energy balance of a district in two cities—Groningen and Torrelago [
6]—and was developed as the basis for energy balance calculations in the smart cities H2020 MAKING-CITY project. Apart from these specific cities, this methodology may also be validated by the rest of cities involved in PED lighthouse projects as they are at an implementation phase as in Groningen (6 cities from 18 that form the Lighthouse initiative) [
14]. Moreover, for the rest of the cities aiming for district interventions at the design phase, the methodology may be followed as in the Torrelago case. Note that with the lack of standardization in PED frameworks, each study considering the calculation of energy balance in PEDs deals with assumptions and limitations regarding the size, type of boundary and critical elements.
Author Contributions
State of the art, R.O. and C.S.; methodology, A.G., B.A. and R.O.; visualization, A.G. and C.S.; writing and review, A.G., R.O., B.A., C.S. and G.B.H.; project administration, C.S. All authors have read and agreed to the published version of the manuscript.
Funding
This research has received funding from the European Union’s Horizon 2020 research and innovation programme under grant agreement No 824418 (MAKING-CITY).
Acknowledgments
CARTIF is a Cervera’s Centre of Excellence, granted by the Ministry of Science and Innovation and the Centre for Technological and Industrial Development (CDTI) under the work record CER20191019. The authors are grateful to both the MAKING-CITY (in particular the Groningen Consortium) and CITyFiED project team for fruitful discussions and collaboration.
Conflicts of Interest
The authors declare no conflict of interest.
References
- FIT FOR 55 Package under the European Green Deal (14 July 2021) Retrieved from Commission Proposes Transformation of EU Economy and Society to Meet Climate Ambitions. Available online: https://ec.europa.eu/commission/presscorner/detail/en/IP_21_3541 (accessed on 14 September 2021).
- European Commission. (14 July 2021). Retrieved from Commission Presents Renewable Energy Directive Revision. Available online: https://ec.europa.eu/info/news/commission-presents-renewable-energy-directive-revision-2021-jul-14_en (accessed on 14 September 2021).
- SET-Plan ACTION n°3.2 Implementation Plan. Europe to Become a Global Role Model in Integrated, Innovative Solutions for the Planning, Deployment, and Replication of Positive Energy Districts. Available online: https://setis.ec.europa.eu/system/files/2021-04/setplan_smartcities_implementationplan.pdf (accessed on 26 April 2021).
- Zhang, X.; Penaka, S.R.; Giriraj, S.; Sánchez, M.N.; Civiero, P.; Vandevyvere, H. Characterizing Positive Energy District (PED) through a Preliminary Review of 60 Existing Projects in Europe. Buildings 2021, 11, 318. [Google Scholar] [CrossRef]
- Salom, J.; Tamm, M.; Andresen, I.; Cali, D.; Magyari, Á.; Bukovszki, V.; Gaitani, N. An Evaluation Framework for Sustainable Plus Energy Neighbourhoods: Moving Beyond the Traditional Building Energy Assessment. Energies 2021, 14, 4314. [Google Scholar] [CrossRef]
- Gabaldón Moreno, A.; Vélez, F.; Alpagut, B.; Hernández, P.; Sanz Montalvillo, C. How to Achieve Positive Energy Districts for Sustainable Cities: A Proposed Calculation Methodology. Sustainability 2021, 13, 710. [Google Scholar] [CrossRef]
- MAKING-CITY (The MAKING-CITY Project Received Funding from the H2020 Programme under Grant Agreement No 824418). Available online: https://makingcity.eu/ (accessed on 31 July 2021).
- Omgevingsvisie ‘The Next City’: De Groningse Leefkwaliteit Voorop. 2018. Available online: www.gemeente.groningen.nl/omgevingsvisie (accessed on 18 October 2021).
- CITyFiED. Torrelago District Energy-Efficient Retrofitting. (CITyFiED Project). 2018. Available online: http://www.cityfied.eu/demo-sites/sezione_uno_uno/torrelago-district-energy-efficient-retrofitting.kl (accessed on 13 November 2020).
- Macía, A.; Vallejo, E.; Vasallo, A.; Gómez, J.; Muñoz, C.; Martín, J.; Andersson, R. D4.20—Report of the Energy Performance Analysis. (CITyFiED). Available online: http://www.cityfied.eu/deliverables/ (accessed on 13 November 2020).
- Sanz, A.J. Proyecto básico y de Ejecución de Mejora de la Eficiencia Energética del CEIP Miguel Hernández. Available online: https://sede.lagunadeduero.org/documentos/565B68DB97126045BDE2D4FA8130C308.pdf (accessed on 17 November 2020).
- IDAE. Análisis del Consumo Energético del Sector Residencial en España; IDAE Secretaría General Departamento de Planificación y Estudios: Madrid, Spain, 2011. [Google Scholar]
- Causevic, S.; Huitema, G.B.; Subramanian, A.; Leeuwen Cv Konsman, M. Towards positive energy districts in smart cities: A data-driven approach using aggregation and disaggregation of energy balance calculations. Environ. Sci. Proc. 2021, 3. [Google Scholar]
- SCIS. Smart Cities and Communities Lighthouse Projects. EU Smart Cities Information System. 2020. Available online: https://smartcities-infosystem.eu/scc-lighthouse-projects (accessed on 30 October 2020).
| Publisher’s Note: MDPI stays neutral with regard to jurisdictional claims in published maps and institutional affiliations. |
© 2021 by the authors. Licensee MDPI, Basel, Switzerland. This article is an open access article distributed under the terms and conditions of the Creative Commons Attribution (CC BY) license (https://creativecommons.org/licenses/by/4.0/).


 ,
, 


