Article

Evaluation of Geogenic Enrichment Using Satellite, Geochemical, and Aeromagnetic Data in the Central Anti-Atlas (Morocco): Implications for Soil Enrichment

1
Department of Earth Sciences, Faculty of Sciences, Ibnou Zohr University, Agadir 80000, Morocco
2
MARE-Marine and Environmental Sciences Centre—Sedimentary Geology Group, Department of Earth Sciences, Faculty of Sciences and Technology, University of Coimbra, 3030-790 Coimbra, Portugal
*
Author to whom correspondence should be addressed.
Earth 2025, 6(4), 113; https://doi.org/10.3390/earth6040113
Submission received: 27 June 2025 / Revised: 16 September 2025 / Accepted: 23 September 2025 / Published: 25 September 2025

Abstract

Natural geogenic effects lead to alterations in soil heavy metal concentrations. This study assesses the presence of elevated trace-element concentrations in the Oued Irriri watershed in southeastern Morocco. ASTER satellite imagery, geochemical, and aeromagnetic data are combined to determine the origin of these anomalies. Processing of ASTER images delineated alteration zones coinciding with areas of high heavy metal anomalies by detecting hydrothermal alteration minerals, including muscovite, montmorillonite, illite, hematite, jarosite, chlorite, and epidote. Principal Component Analysis (PCA) of geochemical data distribution in soils enabled the characterization of variations in trace-element concentrations, the extraction of geochemical anomalies, and the identification of potential sources of contamination. Comparing satellite image processing results with geochemical analyses facilitated the production of a geogenic enrichment map. The study results indicate high enrichment levels of zinc, Molybdenum, and bismuth in the western basin, of purely lithological origin. Hydrothermal alteration surfaces intersect geochemical anomaly zones in the north and northeast, primarily showing the impact of fault rooting on the surface deposition of Cu, Ba, Hg, and Pb-rich deposits. This study developed a geogenic enrichment map indicating naturally affected areas, identifying potential risks to eco-environmental systems, and better preventing the effects of geogenic enrichment.

1. Introduction

Soil contamination by heavy metals is a significant concern for the environment and human well-being, given that soils play a crucial role in life through food production [1,2]. Numerous research studies have highlighted the increasing concentrations of heavy metals in soils, primarily attributed to anthropogenic activities such as industrial processes, mining, and agricultural practices [3,4,5]. However, it is noteworthy that certain specific geographical regions also naturally exhibit high concentrations of these heavy metals, necessitating precise mapping and comprehensive evaluation to address these geogenic enrichment issues [6,7,8]. This environmental concern is particularly pronounced in regions characterized by bedrock geological formations, often marked by hydrothermal alterations [9,10,11,12]. A pertinent example illustrating this phenomenon can be found in the Iriri area, located in southeastern Morocco, which is characterized by a distinctive island arc environment, where the geological formations primarily include meta-andesites, tonalitic orthogneiss, migmatites, sedimentary rocks, as well as glacial deposits and detrital formations [13]. The unique combination of factors in this region, including (i) regional hydro-climatic conditions, (ii) the physico-chemical composition of geological outcrops, and (iii) prolonged exposure to the open atmosphere, leads to oxidation processes, thereby increasing the high trace-element concentrations and creating a conducive environment for the development of geogenic enrichment.
This region is primarily characterized by human activities, including traditional agriculture, practiced seasonally along the wadis with localized use of fertilizers, as well as extensive grazing, where overgrazing can reduce vegetation cover and promote soil erosion. Small-scale or artisanal mining is also present, particularly for Cu, Pb, Zn, or Ag, which can lead to increased dispersion of metals around these sites. Finally, urbanization remains limited, with small villages generally located near water sources and few large-scale industrial activities.
In response to this growing concern, numerous worldwide case studies have been conducted to locate and delineate areas susceptible to such contamination [14,15,16,17,18,19,20,21,22]. These studies have covered various geological contexts in Africa, Asia, and South America, mapping areas at risk for ecosystems and human health. In the Siroua Massif and the broader Anti-Atlas, research has primarily focused on polymetallic mineralization (Cu, Pb, Zn, Ag) associated with Neoproterozoic formations, highlighting significant metallogenic potential [23]. Furthermore, the study of volcanic and volcano-sedimentary rocks, particularly phonolites, trachytes, and andesites, has revealed their role in the enrichment of metallic elements within these geological formations [13,24].
Investigations in the study area have primarily relied on the integration of ASTER data, geochemistry, and aeromagnetics to delineate mineralization corridors and identify zones of heavy metal enrichment linked to geogenic processes [25,26]. However, despite these advancements, studies remain limited, and a more in-depth analysis of the mechanisms governing the dispersion and accumulation of metallic elements is necessary for a better understanding of the geogenic enrichment process. Previous studies in Moroccan basins have shown that heavy metals in soils are heterogeneously distributed due to both geogenic mineralization and surface remobilization. For example, El Hamzaoui et al. [27] mapped Cu, Pb, and Zn contamination in the Tadla plain, while El Khalil et al. [28] reported elevated metals near mining zones in southern Morocco. Mimouni et al. [29] demonstrated the role of erosion and hydrological transport in dispersing Cd, Cu, Pb, and Zn from mine residues. These findings confirm that metal enrichment is shaped by both natural and anthropogenic factors, underscoring the relevance of an integrated approach in the Assif n’Iriri basin.
This study aims to precisely delineate areas of geogenic enrichment by integrating remote sensing, geological, geochemical, and geophysical data. The main objectives of this study are:
To map hydrothermally altered zones (argillic, phyllic, and propylitic) using ASTER data.
To study the geochemical characteristics of alluvial soils and the level of base metal concentrations in the soil.
To interpret aeromagnetic geophysical data to understand the origins of this enrichment problem in the region.
Assess the occurrence of hydrothermal risk zones through field studies and develop a map showing naturally affected areas to provide in-depth knowledge for identifying potential risks to eco-environmental systems and better preventing the effects of geogenic enrichment.

2. Geology of the Oued Iriri Watershed
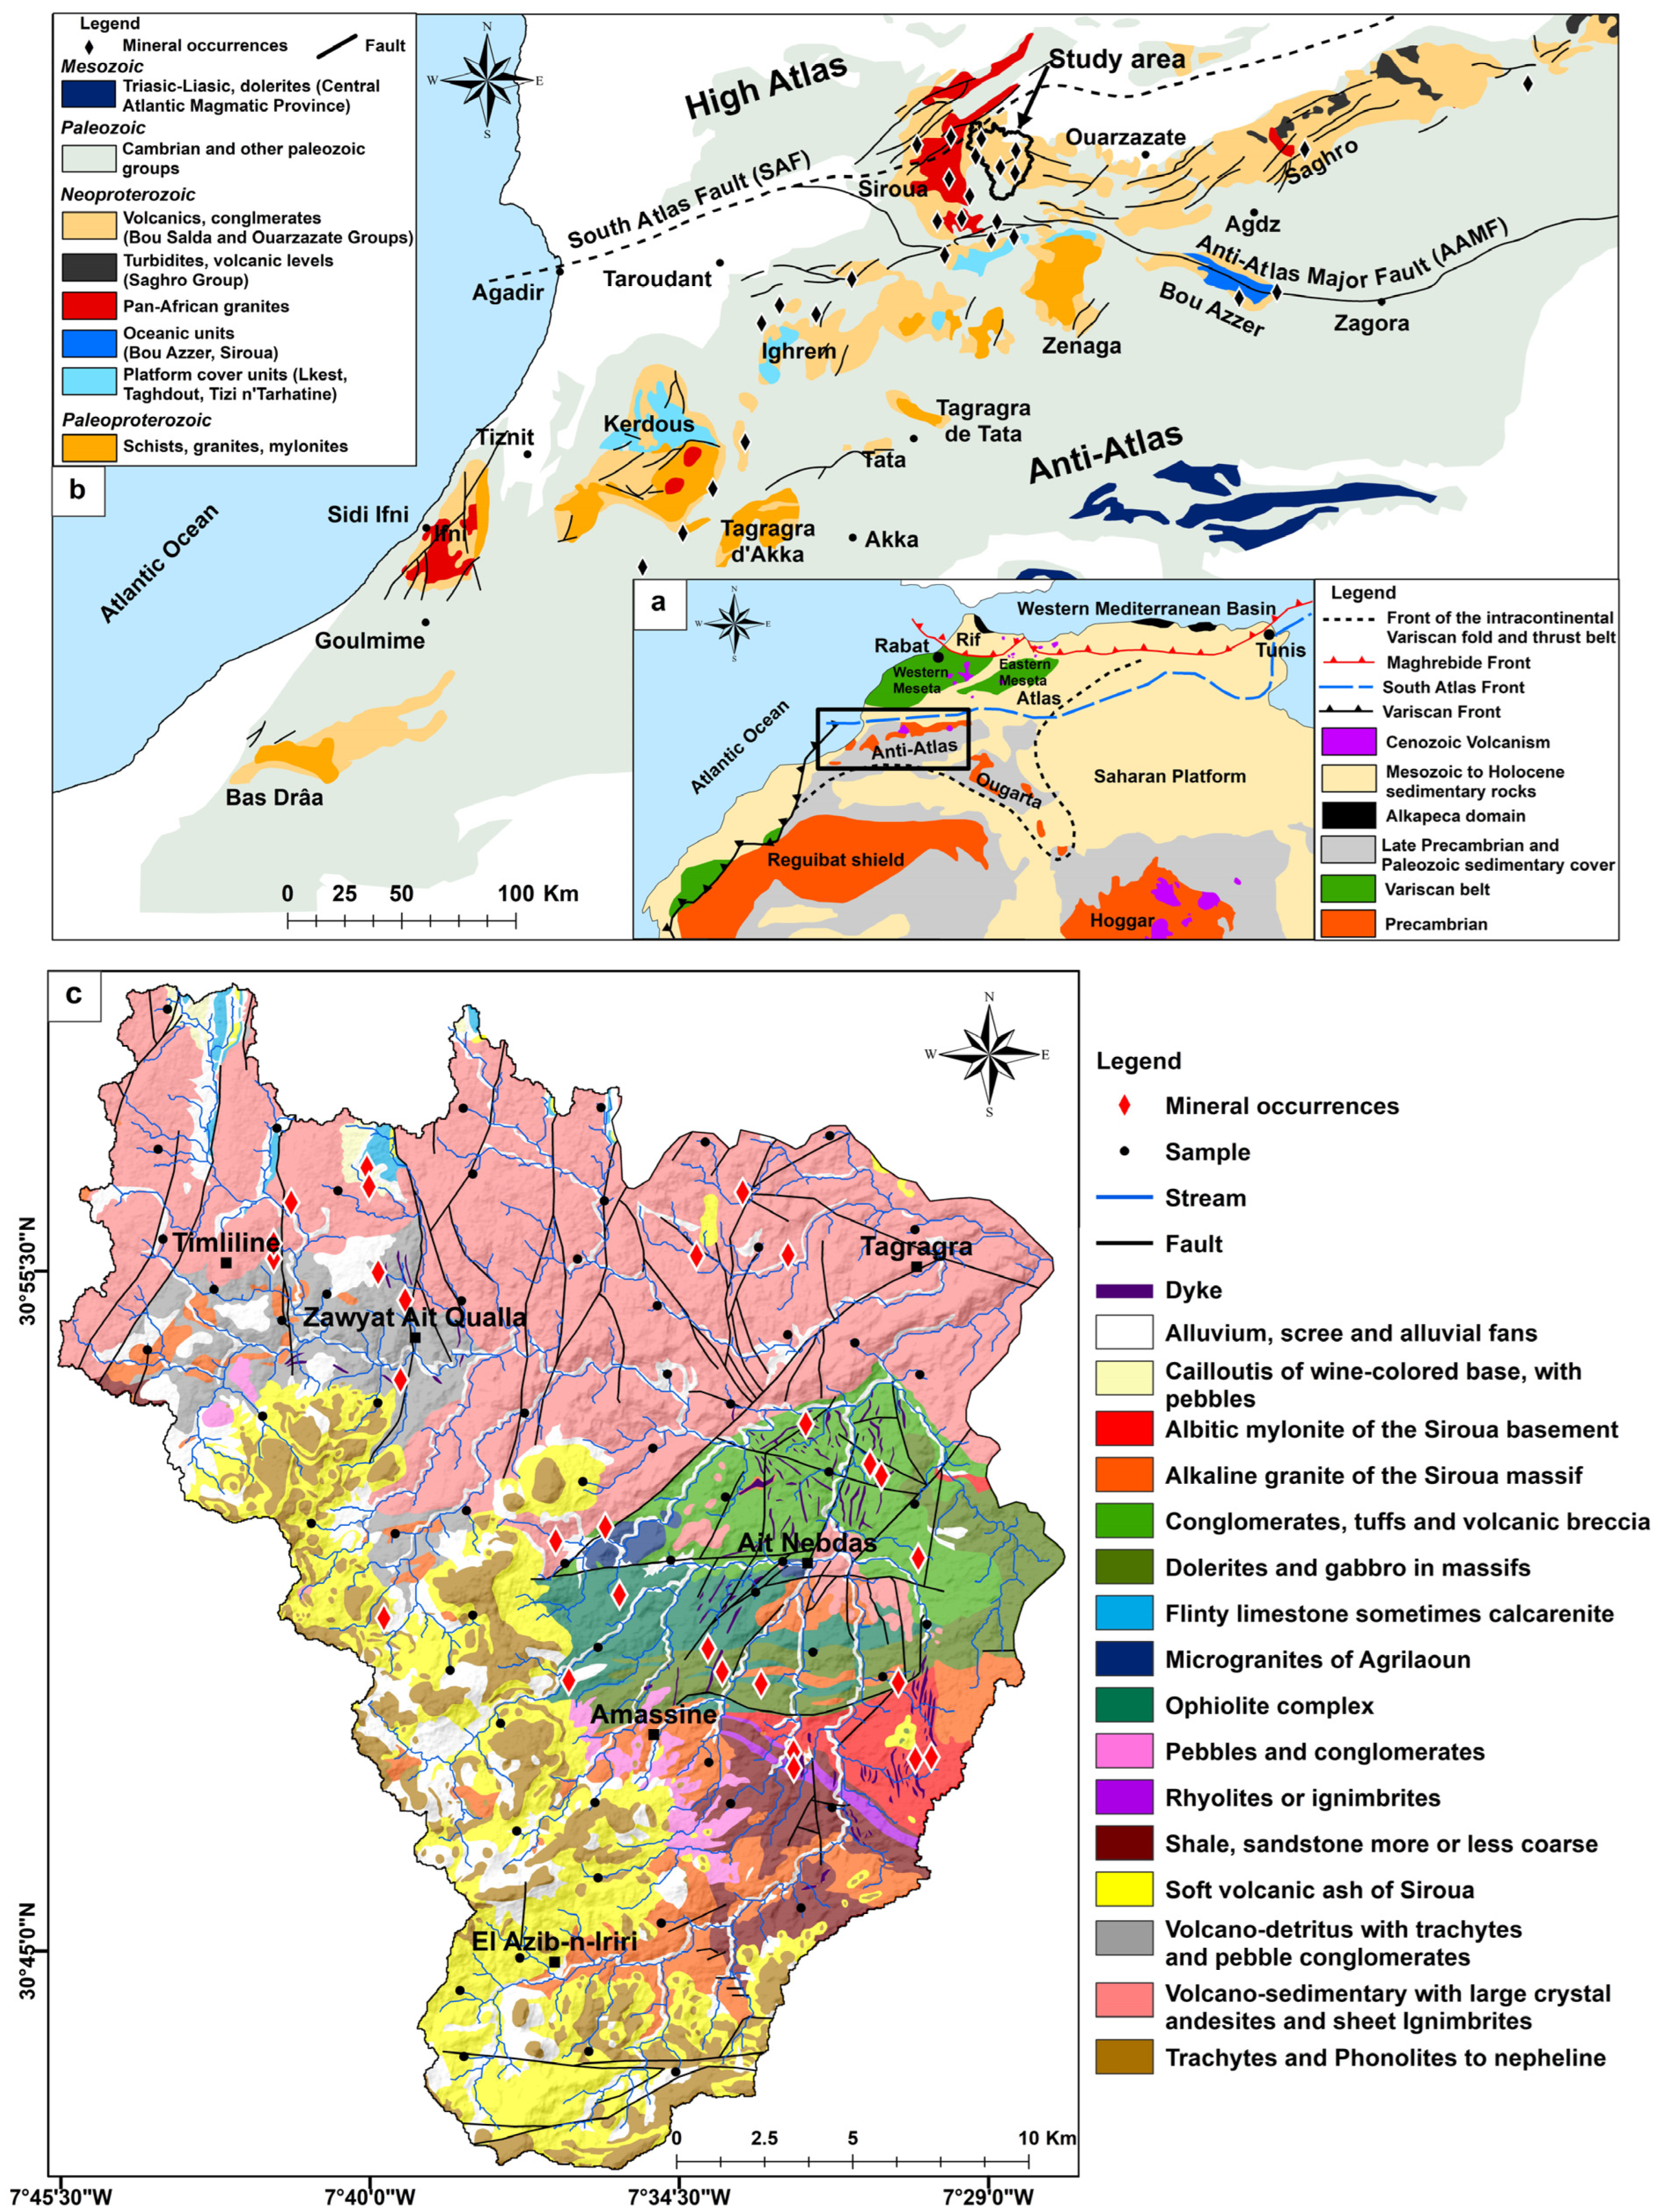
The Oued Iriri watershed is part of the Siroua Massif, a crucial connection between the High Atlas and Anti-Atlas Mountain ranges (Figure 1a,b). This region is characterized by rugged and difficult-to-access terrain, with an average elevation of around 2000 m, reaching a peak of 3304 m at Adrar n’Siroua. The climate is particularly harsh, with continental characteristics, featuring dry summers and wet, snowy winters. Temperature fluctuations are significant, ranging from −4 °C in winter to torrid peaks of +46 °C in summer. The landscape, bordering on semi-desert, bears the scars of intensive deforestation and excessive pastoral activity, leading to severe vegetation degradation. Inhabitants are primarily located along the wadis, particularly near freshwater sources, facilitating limited agricultural activities.
The Assif n’Iriri basin, a geological marvel within the Siroua massif, is a significant part of the Anti-Atlas Mountain range. This range, stretching from the western Atlantic coasts at Guelmim–Tarfaya to the eastern limits of Tafilalt–Maider, forms the deformed northern boundary of the West African craton. The Siroua massif hosts various mining deposits, resulting from the significant geodynamic events that have shaped the geology of the Anti-Atlas. Among the most important is the epithermal deposit of precious metals, primarily silver (Ag-Hg), located on the western flank of the massif. This deposit is associated with low-sulfidation epithermal mineralization, embedded within a series of Proterozoic volcanic-sedimentary formations, along east–west oriented fractures and their intersections with northeast and northwest faults [23,30]. To the south, specifically in the western extension of the MAAF (Major Anti-Atlas Fault), lies the Tafrent gold deposit, which manifests as lenticular layers hosted in intensely tectonized metavolcanic rocks that have undergone hydrothermal alteration processes [31,32]. Another talc deposit, Nkob, is located in the southeast of Siroua and is primarily the result of contact metamorphism between metacarbonates of the Taghdout Group and the Ediacaran granite of Amassine [33]. This process has led to the formation of talcite layers. Subsequently, these layers have been affected by hydrothermal circulations rich in H2O and silica, locally altering the mineralogical composition of the deposit. These hydrothermal fluids have contributed to the recrystallization of talc and the enrichment of silicate minerals, thereby influencing the quality and purity of the extracted talc [33].
Other deposits exist in various parts of the massif, including the cobalt deposit of Tifaddine, characterized by a banded and brecciated fracture containing cobalt arsenides. Stratiform manganese deposits have also developed near Assif Zimer, within the Miocene volcanic complex of Siroua. Additionally, iron deposits appear as ooliths localized in fractures of Proterozoic rocks [34]. The basin is a vast expanse of folded Paleozoic sedimentary terrain, resulting from the Hercynian orogeny. Erosion has exposed older rocks in the form of inliers, including those of Kerdous, Ighrem, Agadir Melloul, Siroua, and Bou-Azzer, revealing a Proterozoic basement composed of magmatic and sedimentary formations. These rock formations have undergone localized metamorphism due to the transformative effects of two Proterozoic orogenies: the Eburnean and Pan-African orogenies, followed by the Hercynian orogenic episode (Figure 1c) [30,35,36]. The primarily volcanic Ouarzazate Group (PIII) covers the basin’s northern sector. This geological formation includes a sequence of terminal Neoproterozoic layers closely linked to significant volcanic activities. These volcanic eruptions occurred during tectonic extension following the collision of the Anti-Atlas belt. The series is composed of the Anmid Formation, which begins at the base (south of Zaouiat Ait Qualla) with the Ghlame volcanoclastic Member (Nan4), mainly consisting of a thick succession of conglomerates, volcanic breccias, and ignimbrites. However, to the south and west of Anmid, it also contains tuffs, dacites, and andesites. It is conformably overlain by the Gourarr Member (Nan3), a highly characteristic unit of porphyritic basalt and mafic and acidic andesitic lavas containing megacrysts of feldspar up to 3 cm long, forming the central mass of the Anmid Formation. The mafic andesites and basalts are porphyritic, with plagioclase phenocrysts often surrounded by a green rim of secondary calcite, chlorite, sericite, epidote, albite, and quartz. Some olivine, clinopyroxene, and amphibole relics are almost entirely replaced by chlorite and opaque minerals. Late fractures and fault mirrors are filled with epidote and quartz. The Azroug Formation forms a general southwest-oriented belt in the vicinity of Azroug, where it is bounded by the Anmid–Tagragra fault zone and overlain by the Tifiras Formation (Tiouin subgroup) to the east. The formation, which caps the escarpment along the northern slope of the Oued Ignane, thins westward and terminates against the Aït Qalla fault. It is conformable with the lower Anmid Formation, and a significant rhyolite flow near the top of the escarpment marks its base [24,37,38,39]. The overlying Talatine Formation (Ntl) covers most of the northern plateau of the permit area. It generally dips gently northward but shows open N-S folds to the east. It is displaced in en echelon patterns by repeated N-S normal faults during the latest (reactivation) phase of the Alpine orogeny. It unconformably overlies the Azroug Formation north of Aït Qalla and directly overlies the Anmid Formation further west. During the Cretaceous, sub-horizontal red sandstones, conglomerates, argillites, and dolomites were deposited in rift basins in central and western Morocco, north of the Tizi-n-Test fault zone. Remnants of upper deposits from the southern margin of the Atlas Basin have been discovered in synclinal depressions controlled by N-S-oriented faults. The basal Tala Formation (Ctab) consists of two cycles of red conglomerates with small pebbles and sandstones, featuring thin intercalated dolomite layers thickening towards the north. The polymictic conglomerates contain well-rounded to sub-rounded stones and excellent volcanic material (likely from the underlying Ouarzazate Group) in a quartz sand and secondary dolomite matrix. This formation is typically very friable and extensively eroded. It thins and terminates eastward, overlain by the upper Tala Formation (Ctaa), as observed in the Lbar-n-Igdad syncline [40,41,42].
Figure 1. (a). The location of the geological map in northwest Africa (after Michard et al. [43]). (b). Geological map of the Anti-Atlas Mountains modified after Gasquet et al. [44] (An outline shows the study area). (c). The geology map of the Assif n’Iriri basin shows the locations of the alluvial sample.
Earth 06 00113 g001

3. Methodology

3.1. Data and Image Processing Methods

The initial step in our research was the use of ASTER data and ASTER spectral indices to map altered zones, such as argillic, phyllic, and propylitic zones. This approach was crucial in comprehending the geogenic influences on enrichment in the basin.
The dataset used in this investigation includes three multispectral images of the ASTER L1T category obtained from NASA’s Terra satellite. These images cover a broad spectrum, ranging from visible to thermal infrared, including 14 bands characterized by high spatial, spectral, and radiometric resolution. The acquisition dates for two of these images are 2 May 2003, with the most recent one dating to 19 July 2005. An atmospheric correction procedure was employed to create a composite mosaic of the three ASTER images, collectively covering the study area, referred to as FLAASH (Fast Line-of-sight Atmospheric Analysis of Spectral Hypercubes). This correction method relies on the fundamental principles of the MODTRAN4 radiative transfer model. The process requires radiance imagery as the primary input and results in generating a corrected reflectance image as the final output [45]. By contrast, ASTER imagery provides resolutions of 15 m (VNIR), 30 m (SWIR), and 90 m (TIR) [46]. To harmonize these datasets, we applied resampling and aggregation techniques to bring ASTER to a scale comparable with aeromagnetics. Additionally, a multi-scale approach was used: ASTER resolves local surface mineralogical anomalies, while aeromagnetics defines regional structural frameworks. Their integration within a GIS ensured complementary and coherent interpretation. To address potential temporal mismatches between datasets, we verified the temporal robustness of the integrated signals. Although acquired at different times, this discrepancy does not compromise integration. Aeromagnetic data capture deep lithological/structural frameworks that remain stable over decades, whereas ASTER scenes map surface mineralogical variability. Radiometric and atmospheric corrections (FLAASH) and seasonal harmonization minimized surface-signal inconsistencies. Cross-validation against geological maps and geochemical anomalies ensured that only temporally stable patterns were retained in the final interpretation.
Hydrothermal alteration zones are defined by the presence of mineral assemblages with spectral absorption or reflection characteristics, with at least one mineral displaying diagnostic features [47,48,49,50,51,52,53,54]. Notable alteration minerals observed in these zones include muscovite (sericite), kaolinite, montmorillonite, chlorite, epidote, carbonates, silica, and jarosite. These minerals are significant as they provide clues about the geological processes that have occurred in the area. Generally, clay alteration mineral assemblages are dominated by kaolinite and montmorillonite [55,56]. Clay alteration is represented by the presence of kaolinite and montmorillonite, indicated by the absorption feature near 2.20 µm (ASTER band 6), with spectra significantly different from those of muscovite and illite [57,58]. Kaolinite exhibits a secondary feature at a wavelength of 2.17 µm (ASTER band 5). The phyllic phase is characterized by sericite (muscovite) and illite, with a significant spectral absorption feature at a wavelength of 2.20 µm (ASTER band 6) [49,59,60]. Propylitic alteration is identified by epidote, chlorite, and carbonates, which show absorption features at a wavelength of 2.35 µm (ASTER band 8) [61,62,63]. The ASTER VNIR (0.52–0.86 µm) and SWIR (1.6–2.43 µm) bands were specifically selected because of their sensitivity to diagnostic absorption features of hydrothermal alteration minerals. Clay minerals (kaolinite, illite, montmorillonite) display strong absorption around 2.2 μm related to Al–OH and Si–OH vibrations, while carbonates and chlorite absorb around 2.3 μm. The VNIR bands complement this by highlighting Fe-oxide anomalies associated with phyllic and propylitic alteration. The combination of VNIR (15 m) and SWIR (30 m), therefore, provides robust discrimination between alteration types, as validated in arid and semi-arid regions [49,64,65,66]. The visible and near-infrared (VNIR) and shortwave infrared (SWIR) regions of the ASTER images enable the distinction of these primary alteration minerals [67,68,69,70,71].
Additionally, our research utilized advanced techniques to identify the minerals of the argillic, phyllic, and propylitic alteration zones in the basin using ASTER’s VNIR-SWIR spectral bands such as: (i) Principal Component Analysis (PCA), a precise method, is employed to identify the spectral signatures of target minerals in each principal component (PC) image [69,72,73,74]; (ii) Spectral Angle Mapper (SAM) such as the Spectral Angle Mapper (SAM) method [75], involve comparing the spectra of the image with reference spectra. Initially developed for hyperspectral images, this method can also be applied to systems with lower resolution [65,66]; (iii) Linear Spectral Unmixing (LSU) is a mapping technique used to determine the relative proportions of different spectral end-members based on the decomposition of a mixed pixel’s composite spectral signature [60,76,77,78,79]; and (iv) Matched Filtering (MF) is a technique used in remote sensing, particularly for the analysis of hyperspectral images. It aims to detect specific targets by comparing the spectral signatures of the pixels in the image to a reference spectral signature. This approach maximizes the response of the target being searched for while reducing the influence of background noise, thereby facilitating the identification of particular materials or objects in a complex scene [73,80]. These methods were selected for their complementary strengths: SPCA enhances spectral contrasts, SAM minimizes angular distance to reference spectra, LSU estimates sub-pixel abundances, and MF isolates weak signals from complex backgrounds. In the Assif n’Iriri basin, SAM and LSU produced the clearest discrimination of alteration zones, while SPCA and MF confirmed the robustness of these results. These techniques are at the forefront of mineral exploration and environmental science, demonstrating the innovative nature of our research.

3.2. Geochemical Data and Analysis

3.2.1. Sample Collection and Analysis

58 alluvial soil samples were collected to determine the concentrations of elements As, Cu, Sb, Ba, Pb, Zn, Mo, Bi, and Hg, which are reliable indicators of geogenic enrichment. These samples were collected during the summer 2022 field campaign, under dry-season conditions to minimize hydrological variability and ensure accessibility of major riverbeds. Our sampling approach and error control measures closely followed the methodology described by Johnson et al. [25]. Although the Assif n’Iriri basin is highly heterogeneous, sampling locations were distributed along major tributaries to maximize representativeness and capture variability in sediment sources. This design ensured basin-wide coverage while recognizing that adaptive high-density sampling could further improve anomaly resolution in future investigations. Sampling sites were selected with priority given to the most dynamically active river channels, focusing efforts on second and third-order tributaries (Figure 1c). Each sample consisted of five subsamples collected from the active riverbed. The sampling density was 1 per 10 square kilometers. This density was designed to ensure homogeneous regional coverage, in line with recommendations for alluvial geochemical surveys [25], while considering terrain accessibility and seasonal constraints. Nonetheless, adaptive sampling strategies such as those proposed by Nazarpour et al. [81] could enhance capture of local heterogeneity. Although beyond the scope of this regional study, such adaptive methods represent a valuable avenue for future refinement.
The surface layer’s top 2 to 5 cm was removed to minimize potential wind contamination. A total of 10 kg of material with particle sizes less than 2 mm was collected for subsequent sieving at the base camp. Alluvial samples underwent meticulous washing using a gold pan near a nearby water source at the base camp. Weighing of the samples was followed by mechanical grinding for 25 min at speeds exceeding 270 revolutions per minute (rpm). Subsequently, 8.0 g ± 0.05 g of the powdered material were carefully extracted to prepare pressed pellets for X-ray fluorescence (XRF) analysis.
The X-ray Fluorescence (XRF) Analysis, using the Spectro X-LAB 2000 Model, was a crucial part of our study. We introduced standard samples in each analysis session to ensure quality control, and control samples were randomly included. The XRF equipment was meticulously calibrated using international standard samples, ensuring the accuracy and reliability of our results.

3.2.2. Data Analysis

Our data analysis process was comprehensive, ensuring that we extracted meaningful insights from the complex geochemical data. We used factor Analysis (FA), a widely respected method for interpreting geochemical data [82]. FA generally assumes a normal distribution; however, geochemical data rarely follow this pattern [83]. In reality, variables are not independent but are interconnected components of a more extensive system [84,85]. To address this, a logarithmic transformation is applied to achieve a normalized distribution [86]. Transformed data for Cu, As, Sb, Ba, Pb, Hg, Zn, Mo, and Bi are then subjected to Principal Component Analysis (PCA), a form of FA, to extract multi-variable factors and reduce the number of variables [87]. The varimax rotation method [88] retains factors with eigenvalues greater than 1. A threshold value of 0.6 is also employed to extract multi-element geochemical factors [89,90]. In this study, we used factor analysis to understand the distribution and concentrations of elements within the Assif n’Iriri basin, providing a robust foundation for our conclusions. While PCA and fractal modeling were selected for their transparency and geological interpretability, advanced techniques such as artificial neural networks or singularity matrix analysis [91] could capture non-linear geochemical patterns. Incorporating such methods in future work could refine anomaly detection and improve predictive performance.
Determination of the Geochemical Mineralization Probability Index (GMPI)
The GMPI is derived by transforming multi-element geochemical values into a new logistic space that provides enhanced discrimination of geochemical anomalies, as studied by Yousefi et al. [89]. They introduced the Geochemical Mineralization Probability Index (GMPI) to convert the values from factor analysis (FA) into the interval [0, 1] using the following equation:
G M P I =   e F S 1 + e F S  
where FS represents the factor score derived from the FA. The logistic function is applied to rescale the dataset into the [0, 1] range [90,92]. This transformation facilitates the distinction between geochemical anomalies and background values [90,92]. The GMPI for each multi-element geochemical dataset was determined following a second-factor analysis, using only those multi-elements positively associated with a component.
Study of Fractal Discretization of Geochemical Signatures
Identifying multi-element geochemical signatures and differentiating geochemical anomalies from background values is critical. To address this challenge, fractal and multifractal models were applied in this study [82,93]. The literature indicates that various fractal methods have been introduced for this purpose, including Concentration-Area (C-A) [86], Spectrum-Area (S-A) [94], Size-Number (N-S) [93,95], and Concentration-Distance (C-D) [96]. The fractal model C-A used in this study is expressed as follows:
A ( ρ v )   ρ ^ ( a 1 ) ;   A ( ρ v )   ρ ^ ( a 2 )
where A(ρ) represents the area containing concentration values exceeding the threshold value ρ; v represents the threshold; and −a1 and −a2 are the characteristic exponents of fractal dimensions. These fractal dimensions are calculated from the slopes observed in the A(ρ) log-log plot against ρ. The breakpoints in the log-log plot and their corresponding ρ values serve as thresholds for differentiating between geochemical anomalies and background.
Evaluation of Geochemical Signatures Using Prediction-Area (P-A) Plots
The potential of multi-element geochemical signatures can be assessed by considering known mineral occurrences [97,98]. To facilitate this evaluation, Prediction-Area (P-A) plots [99] and normalized density (Nd) [100] have been employed. The values required to construct the Prediction-Area (P-A) plot are derived from the C-A fractal model. Parsa et al. [92] utilized the Prediction-Area (P-A) plot, which involves plotting the prediction rate of known mineral occurrences and the area occupied by different geochemical signatures relative to their respective threshold values. The geochemical signatures of these parameters are determined from the intersection point on the P-A plot by calculating the normalized density (Nd) and weights (We) [99]. Nd is calculated as the prediction rate of a geochemical layer divided by the area it occupies, extracted from the intersection point on the P-A plot. We is calculated by taking the natural logarithm of Nd [100]. A Nd > 1 (We > 0) for a geochemical signature map suggests a positive association, while a Nd < 1 (We < 0) indicates a negative association.

3.3. Aeromagnetic Data and Processing

3.3.1. Aeromagnetic Data

The aeromagnetic dataset used in this study was acquired in 1999 under the auspices of the Ministry of Energy and Mines, with data collection conducted by Geoterrx-Dighem. Despite the 1999 acquisition date, these data images indicate deep, time-invariant structures; see Section 3.1 for temporal harmonization with the 2003–2005 ASTER scenes. The data acquisition was performed using Eurocopter AS350B2 and AS350B3 helicopters equipped with a video recording system adhering to the PAL video camera standard. Flight lines, oriented from N15° to N315°, were spaced 500 m apart. Measurements were taken at an average altitude of 30 m above ground level, utilizing a cesium magnetometer with a sensitivity of 0.01 nanotesla (nT).

3.3.2. Data Processing

Reduction to the Pole (RTP)
The magnetic data, corrected for the total field, underwent subtraction of the International Geomagnetic Reference Field (IGRF) model of 1999 to generate a residual magnetic anomaly (RMA) dataset. Due to the unavailability of original digital data, the RMA map was digitized at a grid interval of 250 m, followed by gridding the digitized data at a 125 m interval to produce a digital RMA dataset. To mitigate the dipolar effect of the Earth’s magnetic field, the RMA data were transformed to the magnetic north pole according to the method described by Baranov [101], resulting in a dataset of reduced-to-the-pole (RTP) magnetic anomalies. Subsequently, the RMA and RTP grids generated color maps representing RMA and RTP magnetic anomalies.
Tilt Derivative Application (TDR)
Estimating magnetic contacts associated with faults and other structural discontinuities can be performed using conventional approaches involving horizontal or vertical derivatives. However, these derivatives face challenges due to multiple sources, resulting in a broad amplitude spectrum that complicates source identification [102]. In contrast, the tilt derivative, which relies on the ratio of vertical and horizontal derivatives (Equation (3)), overcomes these issues [103]:
T D R =   V D R T H D R  
The resulting numerical value of the tilt derivative is referred to as the magnetic tilt angle. In interpreting tilt angle results, positive values indicate tilt variations occurring above a magnetic source; negative values suggest areas external to the magnetic source, and zero values correspond to locations on the periphery of the magnetic source [103].
Depth Estimation via Euler Deconvolution
Euler deconvolution delineated geological contacts, automatically estimating source location and depth. This technique serves both as a boundary detector and a depth estimation method. Euler deconvolution is commonly used in magnetic interpretation due to its minimal requirement for prior knowledge of magnetic source geometry and lack of information on magnetization vectors [104,105]. The technique is based on solving the Euler homogeneity equation (Equation (4)) [105]:
N B M = x x 0 M x + y y 0 M y + z z 0 M z  
where M is the observed field at locations (x, y, z), (x0, y0, z0) are the source coordinates, B is the background field level, and N is the structural index (SI), which is a function of the source geometry. The most critical parameter in Euler deconvolution is the structural index N [104], a homogeneity factor linking magnetic field components and their gradients to the source location. Essentially, N measures the rate of field variation with distance from the source (rate of drop) and is directly related to the source dimensions. For magnetic data, physically plausible values for N range from 0 to 3. This study calculated Euler solutions using a structural index SI = 1, a 10 × 10 moving window, and a maximum relative error of 15%. Following the mathematical processing of the magnetic data, a field of lineaments with variable lengths and extensions was identified. These contours were then overlaid on a geological map incorporating structures and lithology, resulting in a new structural map for the study area.
The methodology employed to map geogenic enrichment zones is detailed in the organizational diagram presented in Figure 2. This methodology primarily relies on satellite image processing, geochemical data analysis, and aeromagnetic data processing.

4. Results

4.1. Mapping of Hydrothermal Alteration Zones and Altered Minerals

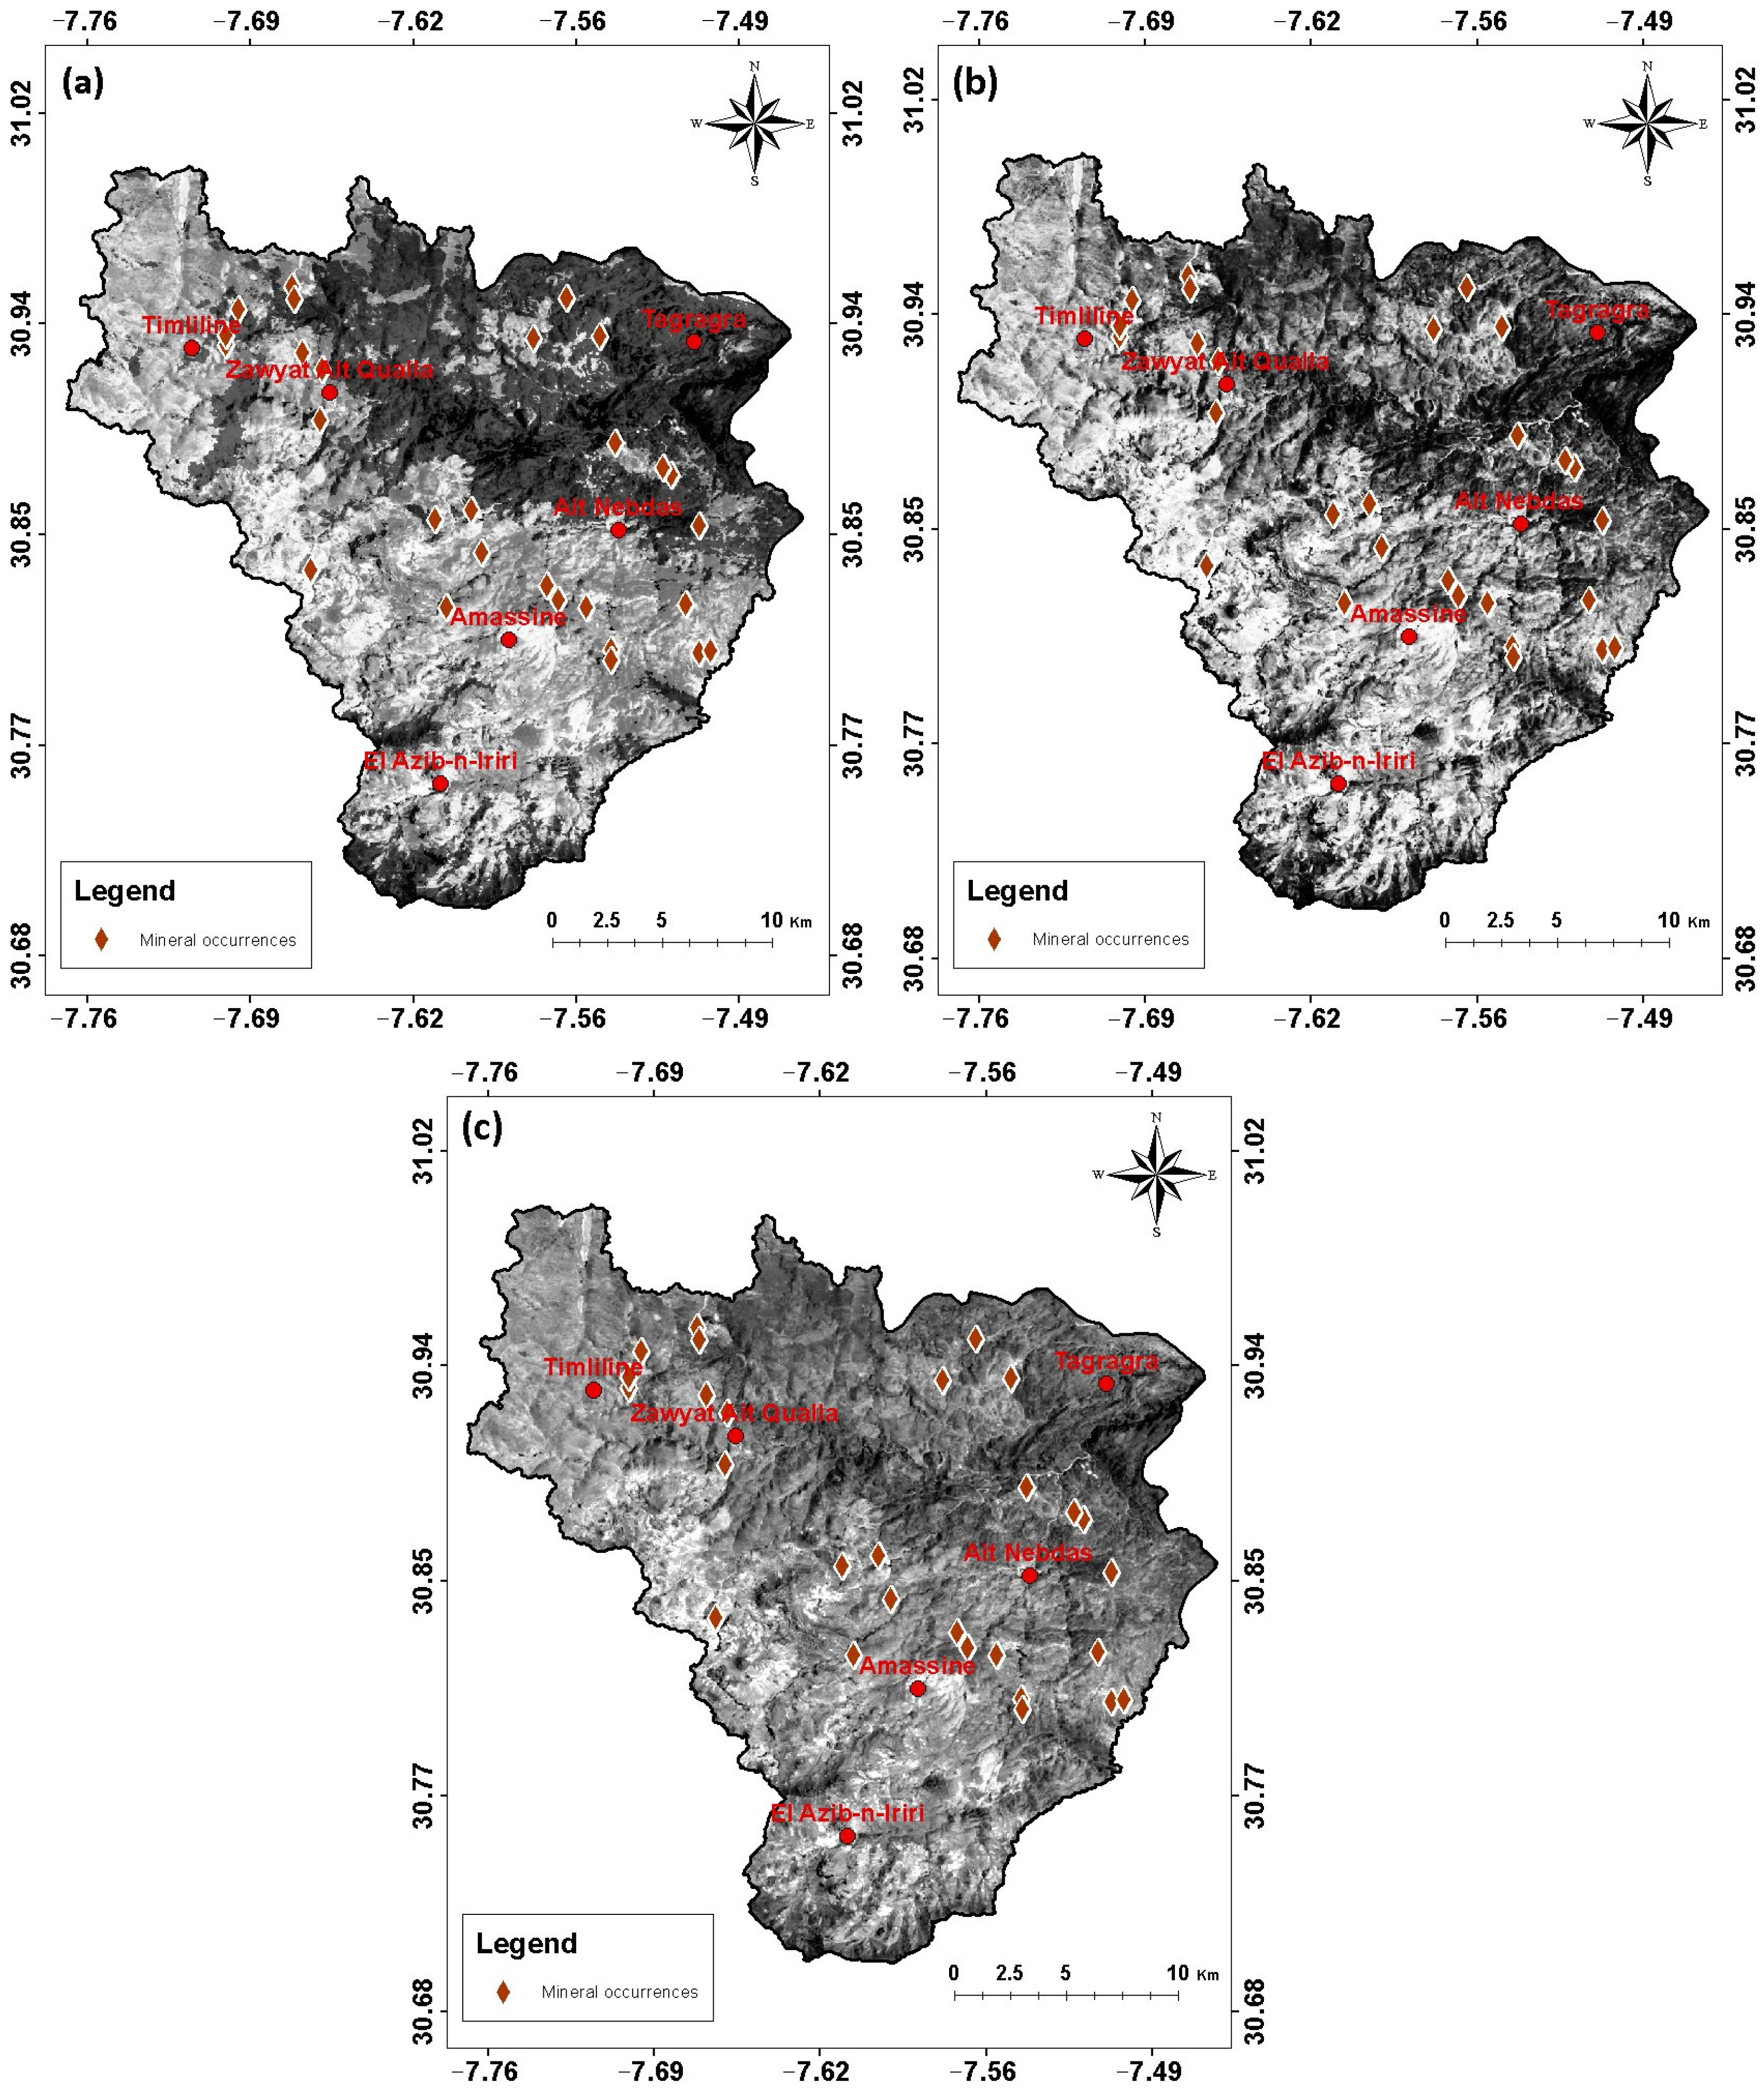
To improve the accuracy of the results, Selective Principal Component Analysis (SPCA) [106], also known as Directed Principal Component Analysis (DPCA), was applied to the VNIR + SWIR bands to map hydrothermal alterations in the studied region. The main distinction between PCA and SPCA is that SPCA selects only a subgroup of bands based on the intended objectives. In this research, specific band subsystems were chosen for SPCA, based on known ASTER band indices for mapping hydrothermal alteration minerals [107,108]. Bands 4, 5, and 6 were designated for mapping argillic alterations, bands 4, 6, and 7 were nominated to specify the phyllic zone, and bands 7, 8, and 9 were used to map propylitic alteration zones. The results of the eigenvector statistics are displayed in Table 1.
Examining the eigenvector loadings in Table 1a for clay alteration mapping reveals that SPC1 displays a low loading for band 4 (−0.13655). In contrast, bands 5 (0.5803) and 6 (−0.4162) show a strong contribution with opposite signs. Kaolinite and alunite are the primary minerals associated with clay alteration, characterized by Al-OH absorption signatures found in bands 5 and 6 of ASTER [65,66]. These minerals exhibit maximum reflectance in band 4 of ASTER, covering the spectral range of 1.6 µm [48]. As a result, the clay alteration zone appears as dark pixels in the SPC1 image due to the negative sign in band 4 (reflectance band). The dark pixels in the SPC1 image were inverted to bright pixels by multiplying by −1. The surface distribution pattern of minerals in the clay alteration zone is concentrated in the southern and western parts of the basin (Figure 3a). Table 1b presents the eigenvector loadings for mapping the phyllic alteration zone. SPC1 shows a low loading for band 4 (−0.13655) and a high loading for band 6 (−0.4162) with negative signs, while band 7 (0.38082) exhibits a moderate contribution in SPC1. The phyllic zone, composed of illite/muscovite, displays a strong Al-OH absorption feature in band 6 of ASTER [109]. The phyllic alteration zone is represented in the southern and western areas of the study zone by bright pixels in SPC1 (Figure 3b). In considering the eigenvector loadings in Table 1c for identifying the propylitic alteration zone, SPC1 exhibits low loadings for band 7 (0.09839) and band 9 (0.0772), along with a moderate contribution from band 8 (0.19268). The propylitic alteration zone, consisting of epidote, chlorite, and calcite, demonstrates a strong absorption feature in band 8 of the ASTER image [48]. Consequently, the SPC1 image represents the propylitic alteration zone with dark pixels due to the positive sign in the absorption band (band 8). The dark pixels in the SPC1 image were inverted to bright pixels by multiplying by −1. However, the propylitic surfaces extend into the southern and eastern parts of the studied basin (Figure 3c).
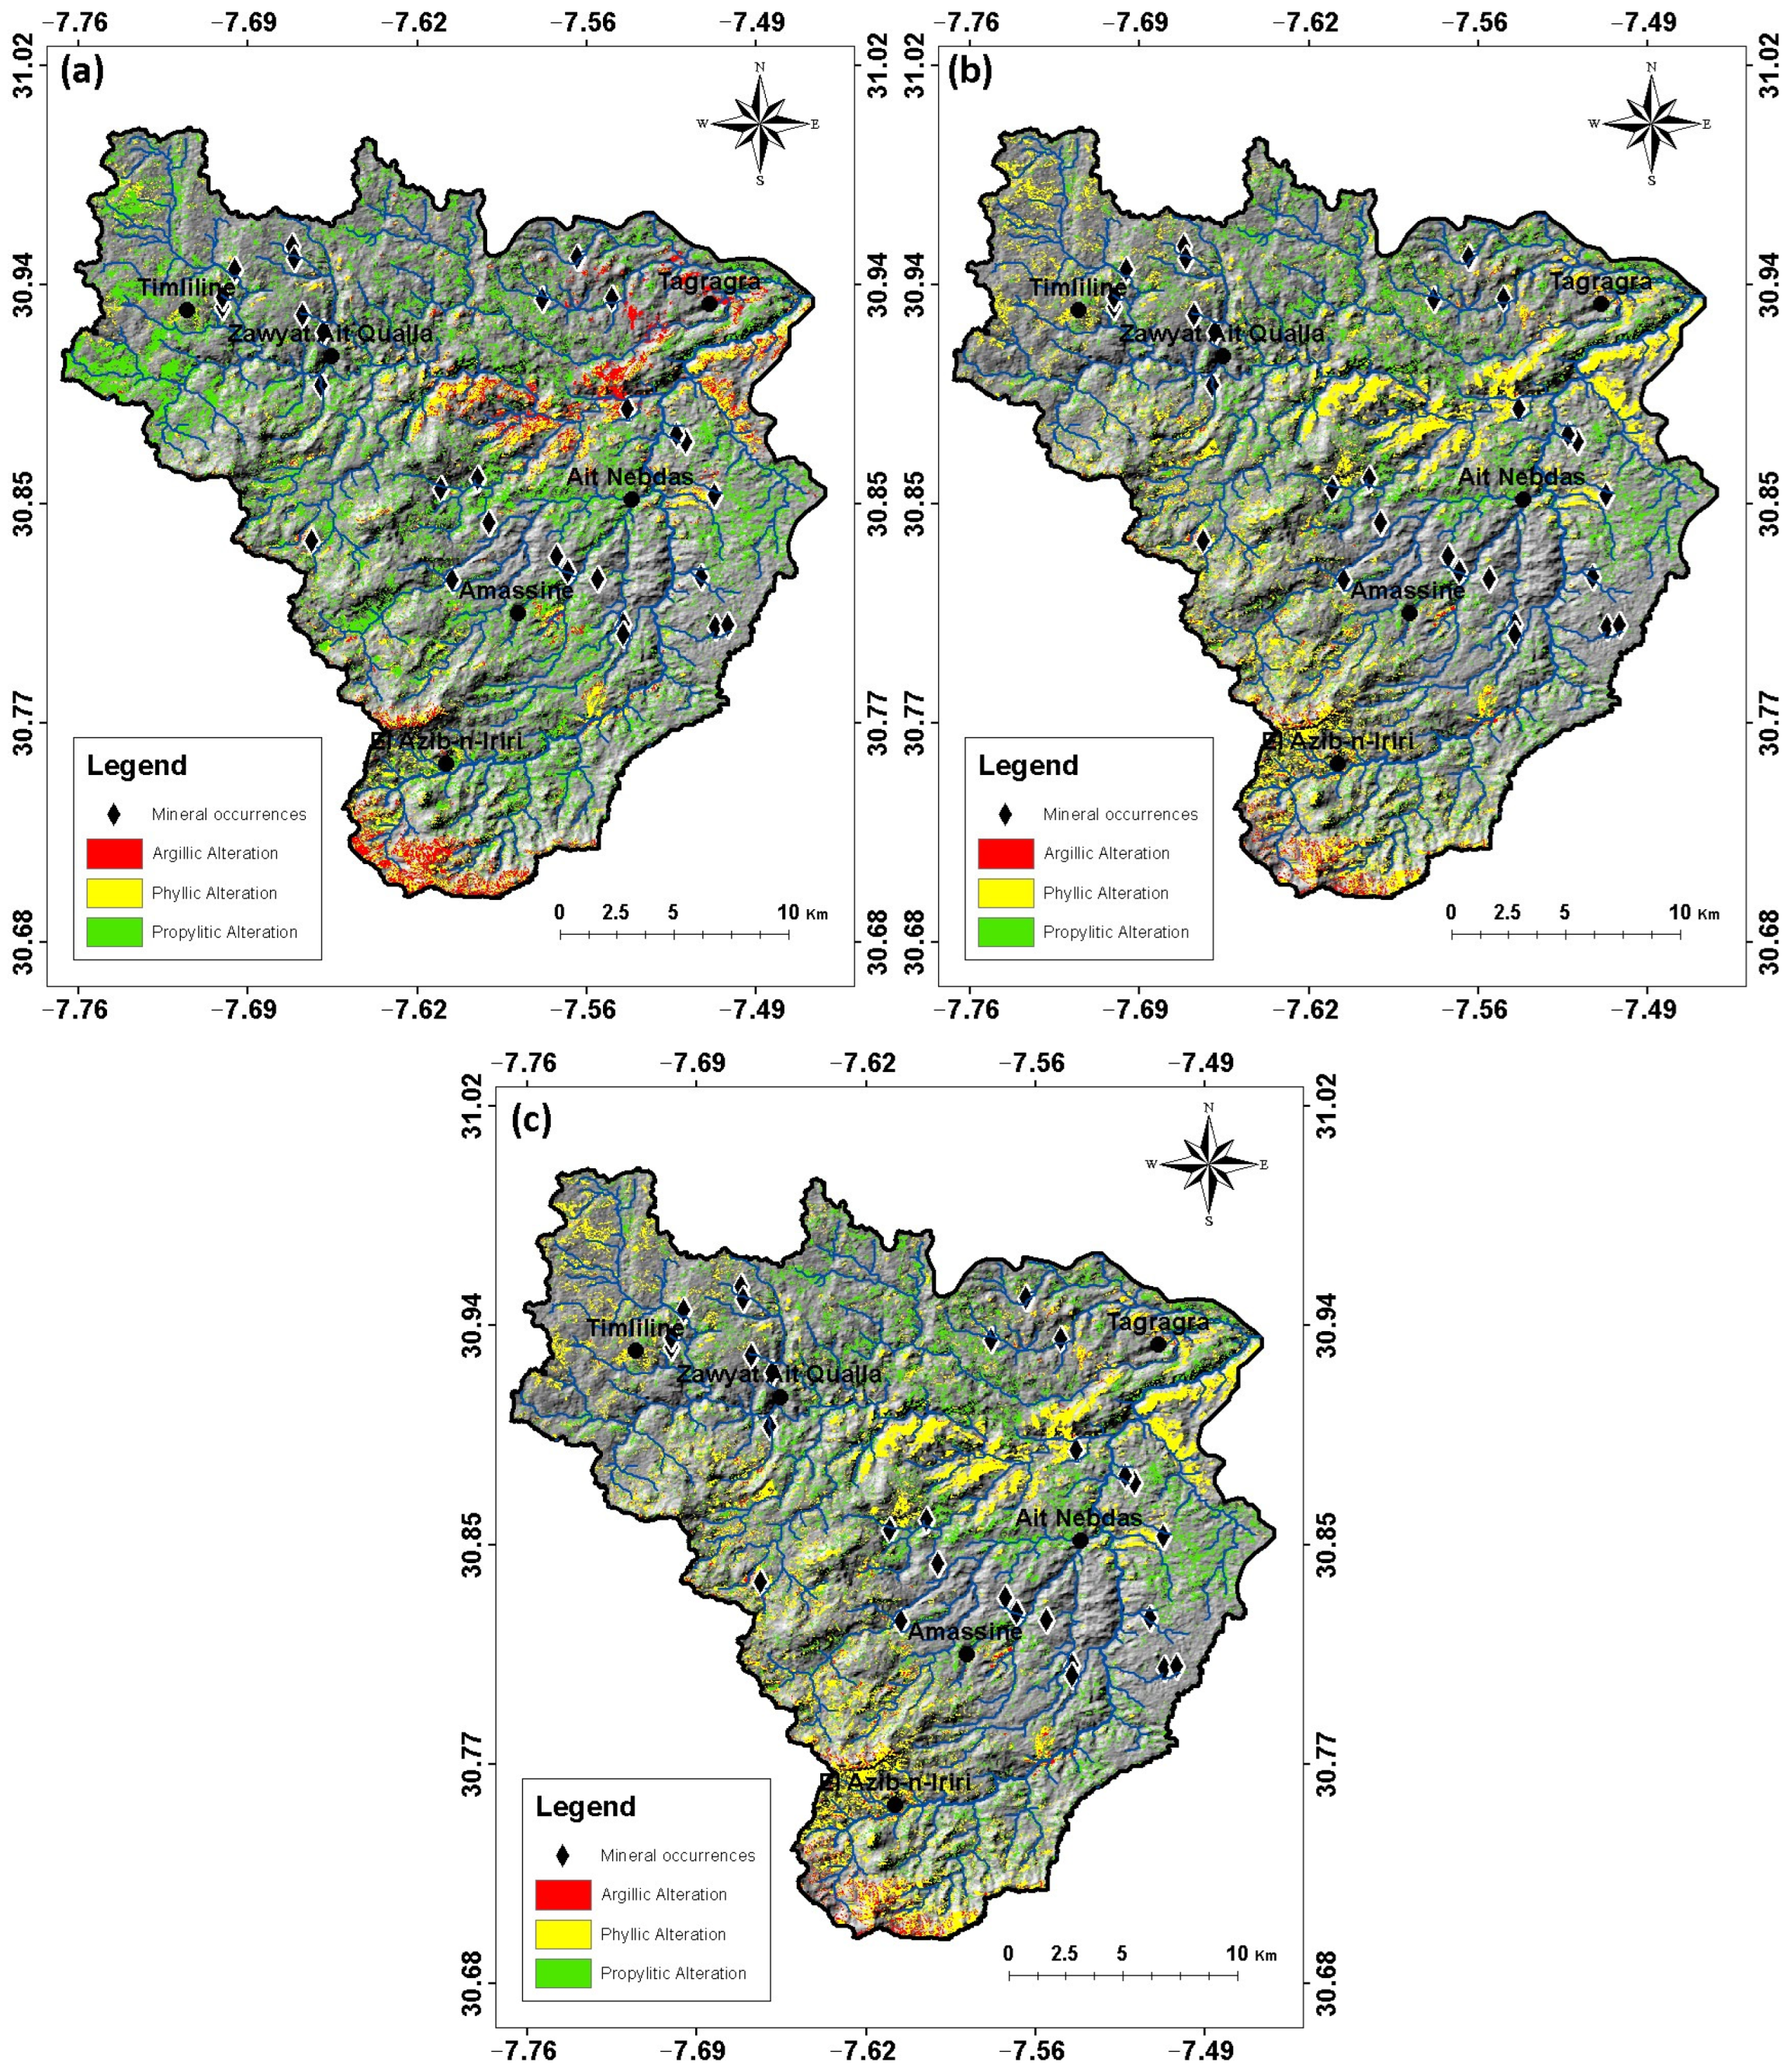
Results from the SAM method applied to the Assif n’Iriri watershed enabled the study of end-members extracted using nD-Visualizer. The spectra of end-members representing clay, phyllic, and propylitic minerals were analyzed, following the work of Rajendran et al. [110] and Rajendran and Nasir [60,111,112]. The spectra of classes n-D Mean #4 and #5 indicate altered silicate minerals in the clay zone, classes n-D Mean #6 to #8 represent weakly altered silicate minerals in the phyllic zone, and classes n-D Mean #9 to #10 depict altered silicate minerals in the propylitic zone. Figure 4a shows the distribution of hydrothermally altered minerals, with clay, phyllic, and propylitic zones marked in red, yellow, and green, respectively. These results reveal a concentration of clay and phyllic types in the west, south, and northeast of the basin, and a broader dispersion of the propylitic type.
The number of end-members to be identified and estimated for abundance using the LSU method can vary significantly depending on the spectral complexity of a scene, the number of spectral bands used, and the spatial and spectral resolution of the image [113]. To decompose the mixed spectral response into its components, the number of bands must exceed the number of spectral end-members required to be spectrally resolved within a single scene pixel. Figure 4b presents the LSU results, showing an almost complete absence of the clay zone except for a few traces in the south, evident phyllic surfaces in the northeast, west, and southwest, and predominantly propylitic alteration in the eastern part of the study area.
As shown in Figure 4c, the MF method revealed clay alterations in the south, phyllic alterations in the south and northeast, and propylitic alterations in the east of the basin.

4.2. Geochemical Signature

4.2.1. Element Distribution

Statistical analysis was performed using the SPSS software package (Table 2). The results indicate a high variability in trace element concentrations in alluvial soils. Some elements, such as Ba and Pb, exhibit very high maximum values and means that are considerably higher than the medians. In contrast, elements including Sb, Mo, and Bi occur at relatively low concentration levels.
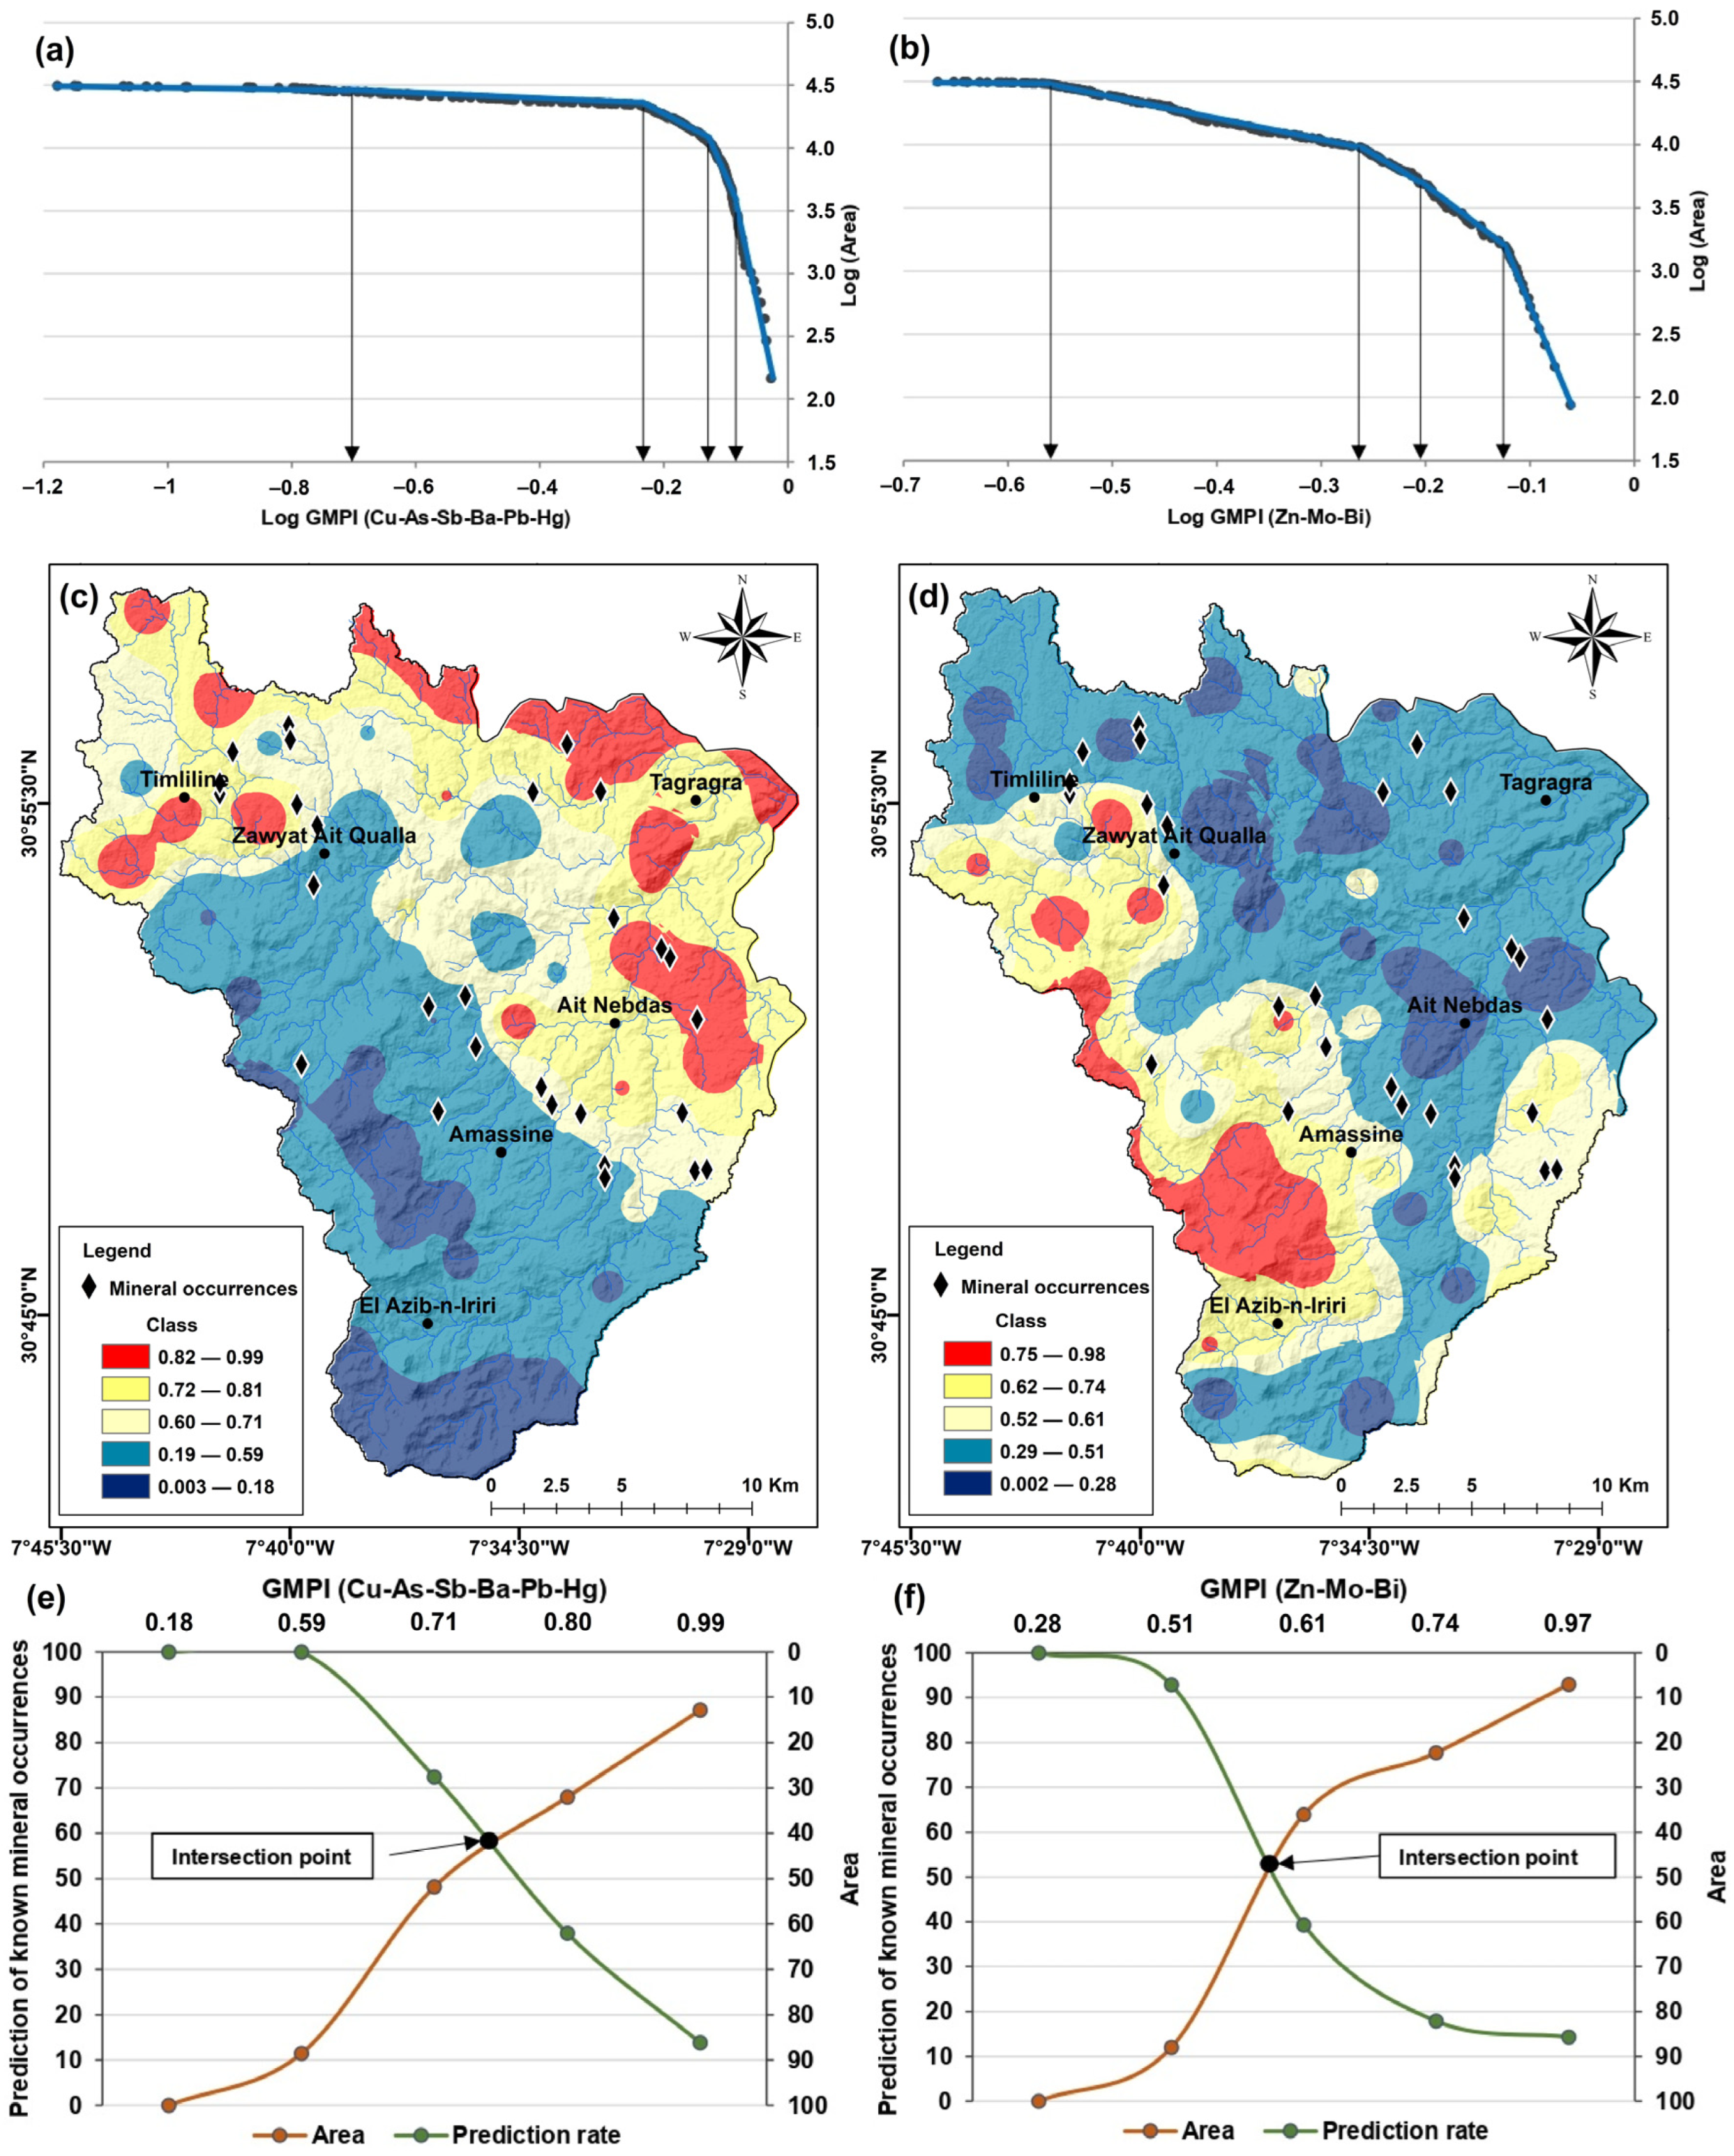
Factor analysis applied to the geochemical data of the study area (Table 3) identified two rotated components, each with eigenvalues greater than one and threshold values exceeding 0.6. Factor F1, representing an association of Cu-As-Sb-Ba-Pb-Hg, accounts for 40.55% of the total variance, while Factor F2, associated with Zn-Mo-Bi, explains a lesser total variance of 27.67%. The factor scores (FS) obtained were used as indicators of multi-element anomalies, and maps were created to identify geochemical anomalies potentially indicative of mineralization or sources of geochemical contamination [114]. The factor score distribution maps for Cu-As-Sb-Ba-Pb-Hg (Figure 5a) and Zn-Mo-Bi (Figure 5b) display the FS values in the Assif n’Iriri basin, with red areas indicating regions of high geogenic enrichment levels. The factor score maps for F1 (Cu-As-Sb-Ba-Pb-Hg) and F2 (Zn-Mo-Bi) and their GMPI are presented with interpolated values in Figure 5c and Figure 5d, respectively.

4.2.2. Fractal Model for Anomaly Separation

The evolution of the Concentration–Area (C-A) model about GMPI values (Figure 6a,b) highlights the presence of five distinct geochemical populations. Based on the classified maps (Figure 6c,d), Prediction-Area (P-A) maps were generated for GMPI (Cu-As-Sb-Ba-Pb-Hg) and GMPI (Zn-Mo-Bi) (Figure 6e,f). Thresholds were identified from clear breakpoints in log–log concentration–area plots. Sensitivity checks confirmed that small changes in threshold selection did not significantly affect anomaly patterns, thereby supporting the robustness of anomaly–background separation. Intersection parameters from the P-A curve (forecast rate and occupied area) were extracted and used to calculate Nd and We parameters (Figure 6e,f, and Table 4). The obtained values, Nd > 1 and We > 0, can be interpreted as effective targeting criteria. Ghezelbash et al. [115] demonstrated that if the intersection point on a P-A plot exceeds the values of other targeting criteria, it indicates the superior effectiveness of that particular criterion. The results reveal Nd = 1.44 (We = 0.36) for GMPI (Cu-As-Sb-Ba-Pb-Hg) and Nd = 1.13 (We = 0.12) for GMPI (Zn-Mo-Bi), suggesting that the geochemical associations used effectively identify areas of geogenic enrichment.

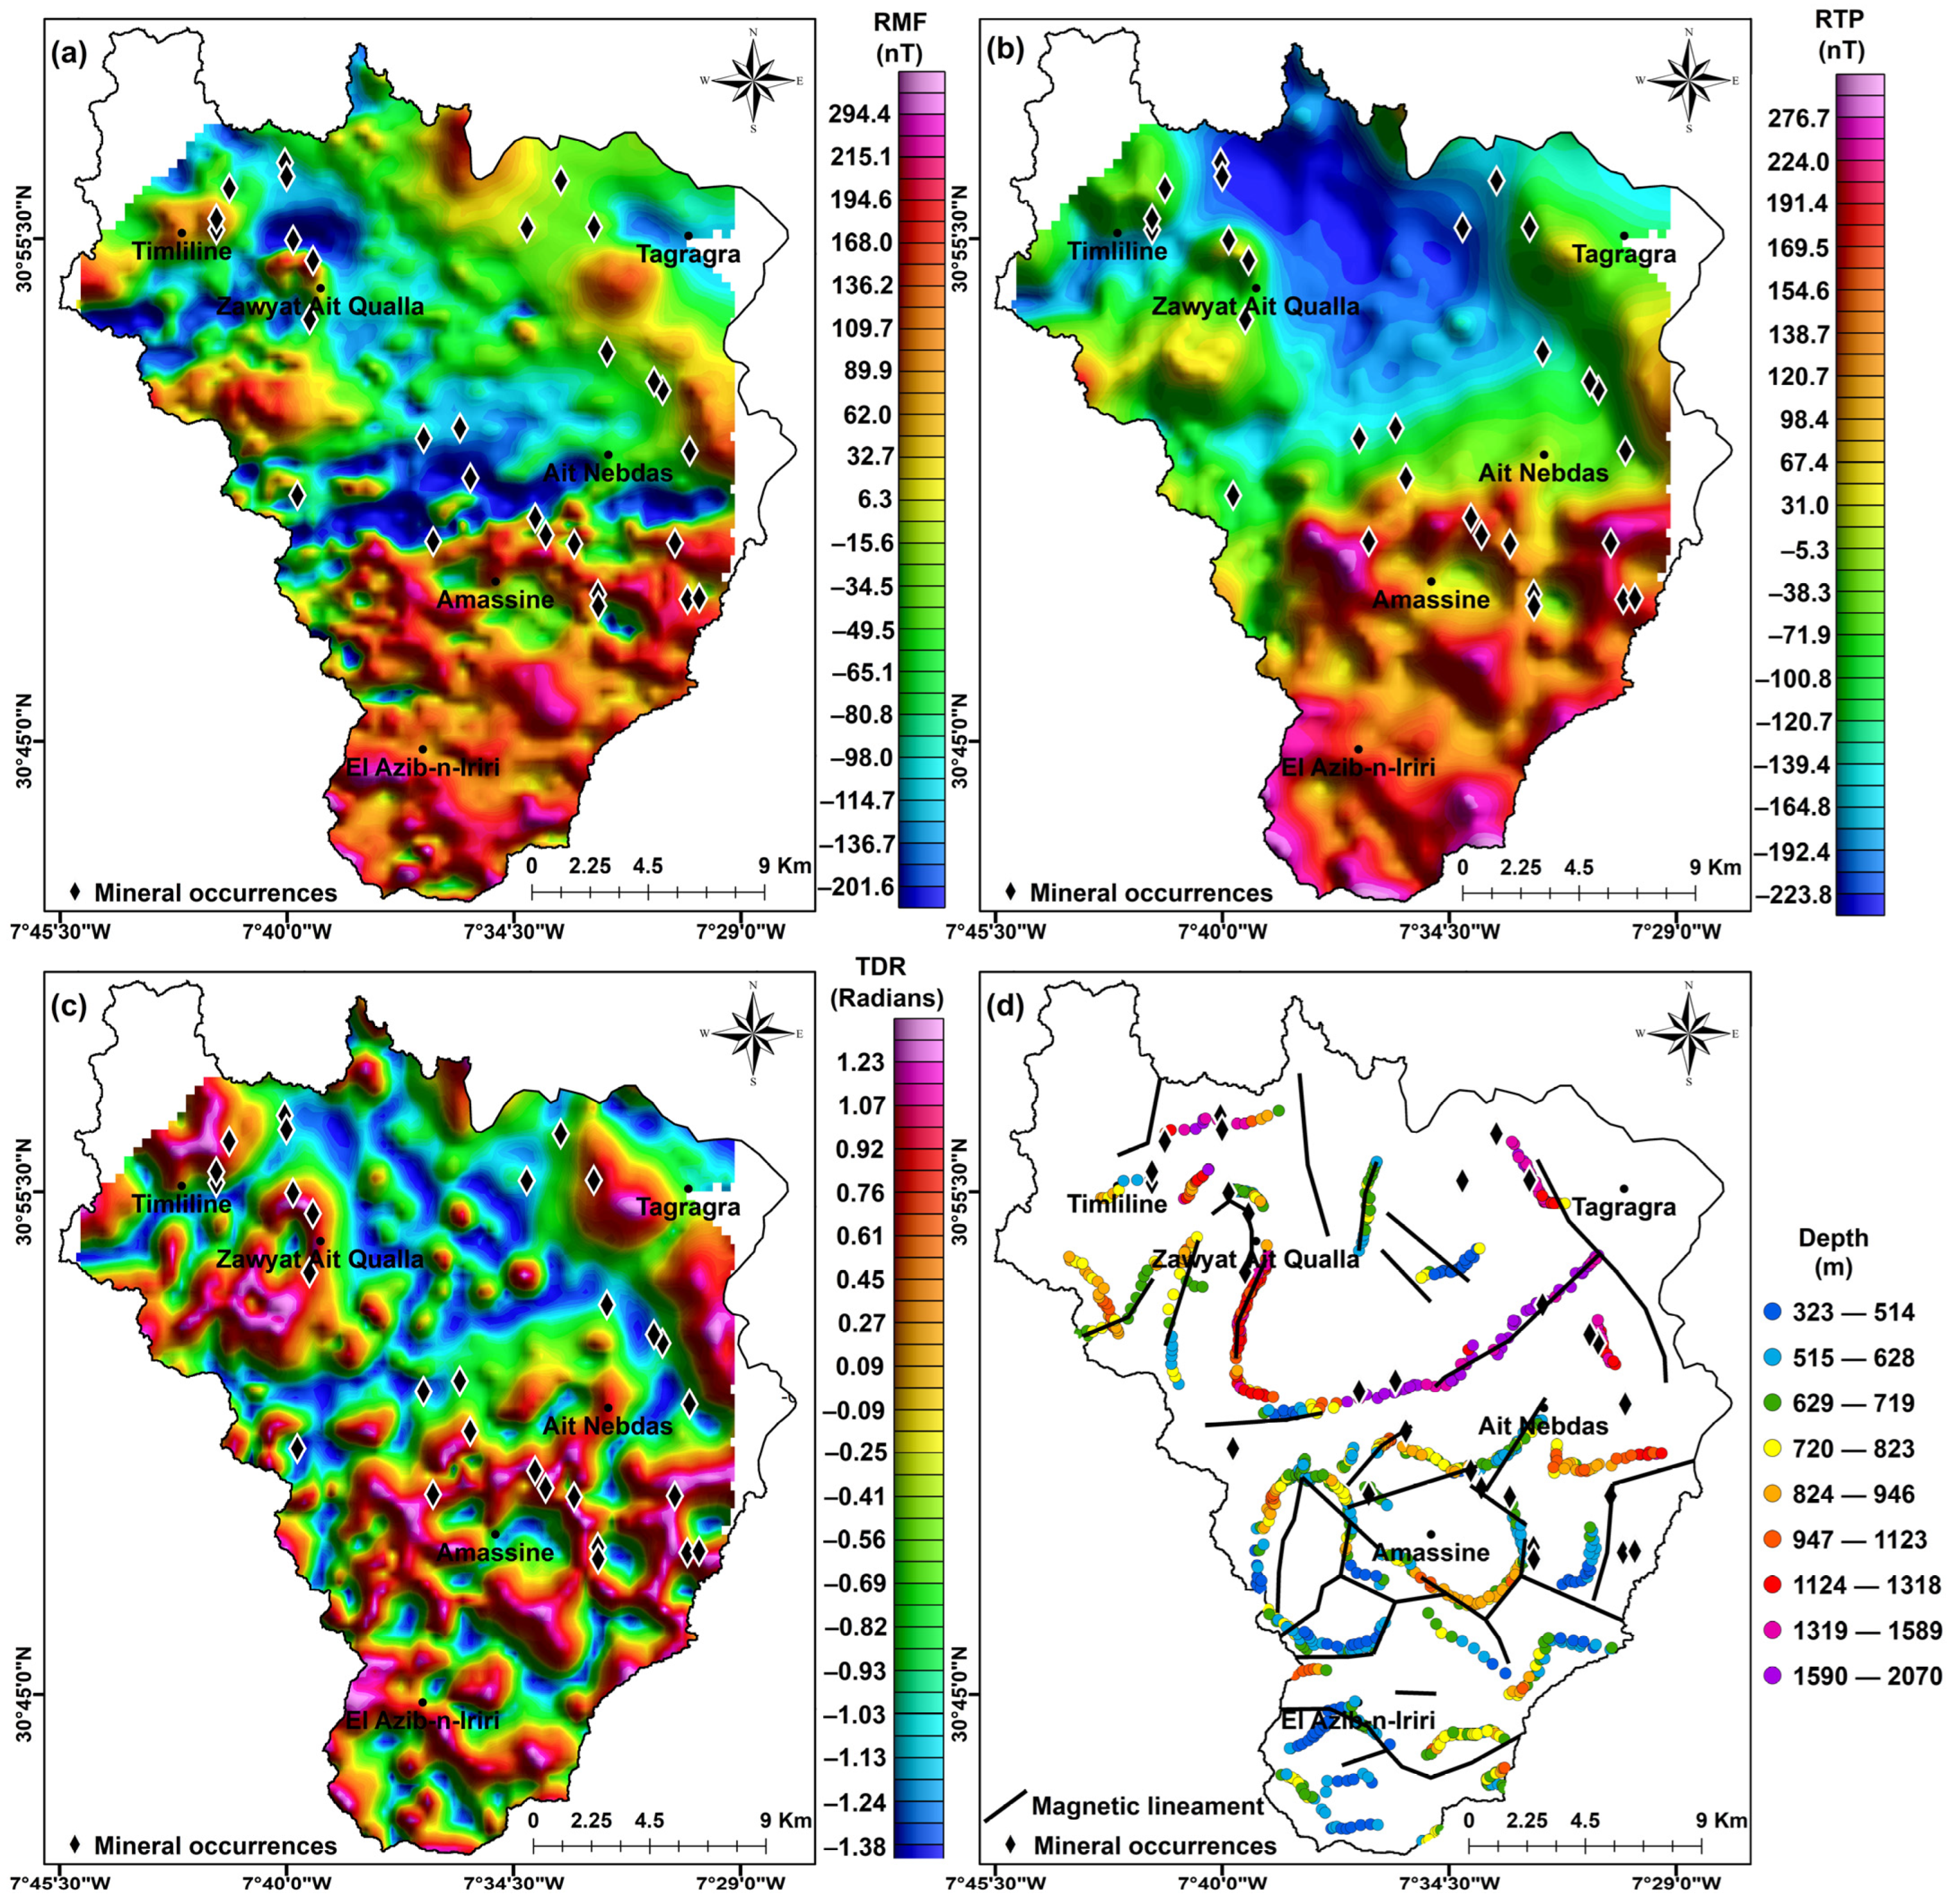
4.3. Analysis of Geophysical Data

The residual magnetic field (RMF) (Figure 7a) map reveals local variations in the magnetic field within the Assif n’Iriri basin, showcasing both short-wavelength and long-wavelength anomalies (Figure 7b). Maximum amplitude anomalies are potentially located over buried mafic formations of volcanic-sedimentary type and acidic ignimbrites on the basement of the Sirwa volcanic massif from the Mio–Pliocene, particularly in the southern parts of the study area. In the northern sector, a northwest-oriented magnetic peak aligns with dolerite and granite veins associated with faults primarily oriented north to northwest. These faults exhibit distinctive magnetic signatures providing valuable insights into the structural framework and mineralization formation conditions [116,117,118,119,120,121].
Magnetic data analysis was conducted using a three-dimensional Euler deconvolution, a precise method that facilitates the determination of the depth of magnetic sources with high accuracy [105]. Euler deconvolution involves several critical parameters, including window size, structural index (representing the source geometry based on the predominant geology of the study area), and grid interval [105]. In this study, window sizes ranged from 5 to 20 km, consistently yielding comparable depths for each window. A structural index of zero, corresponding to a thin sheet model, was used.
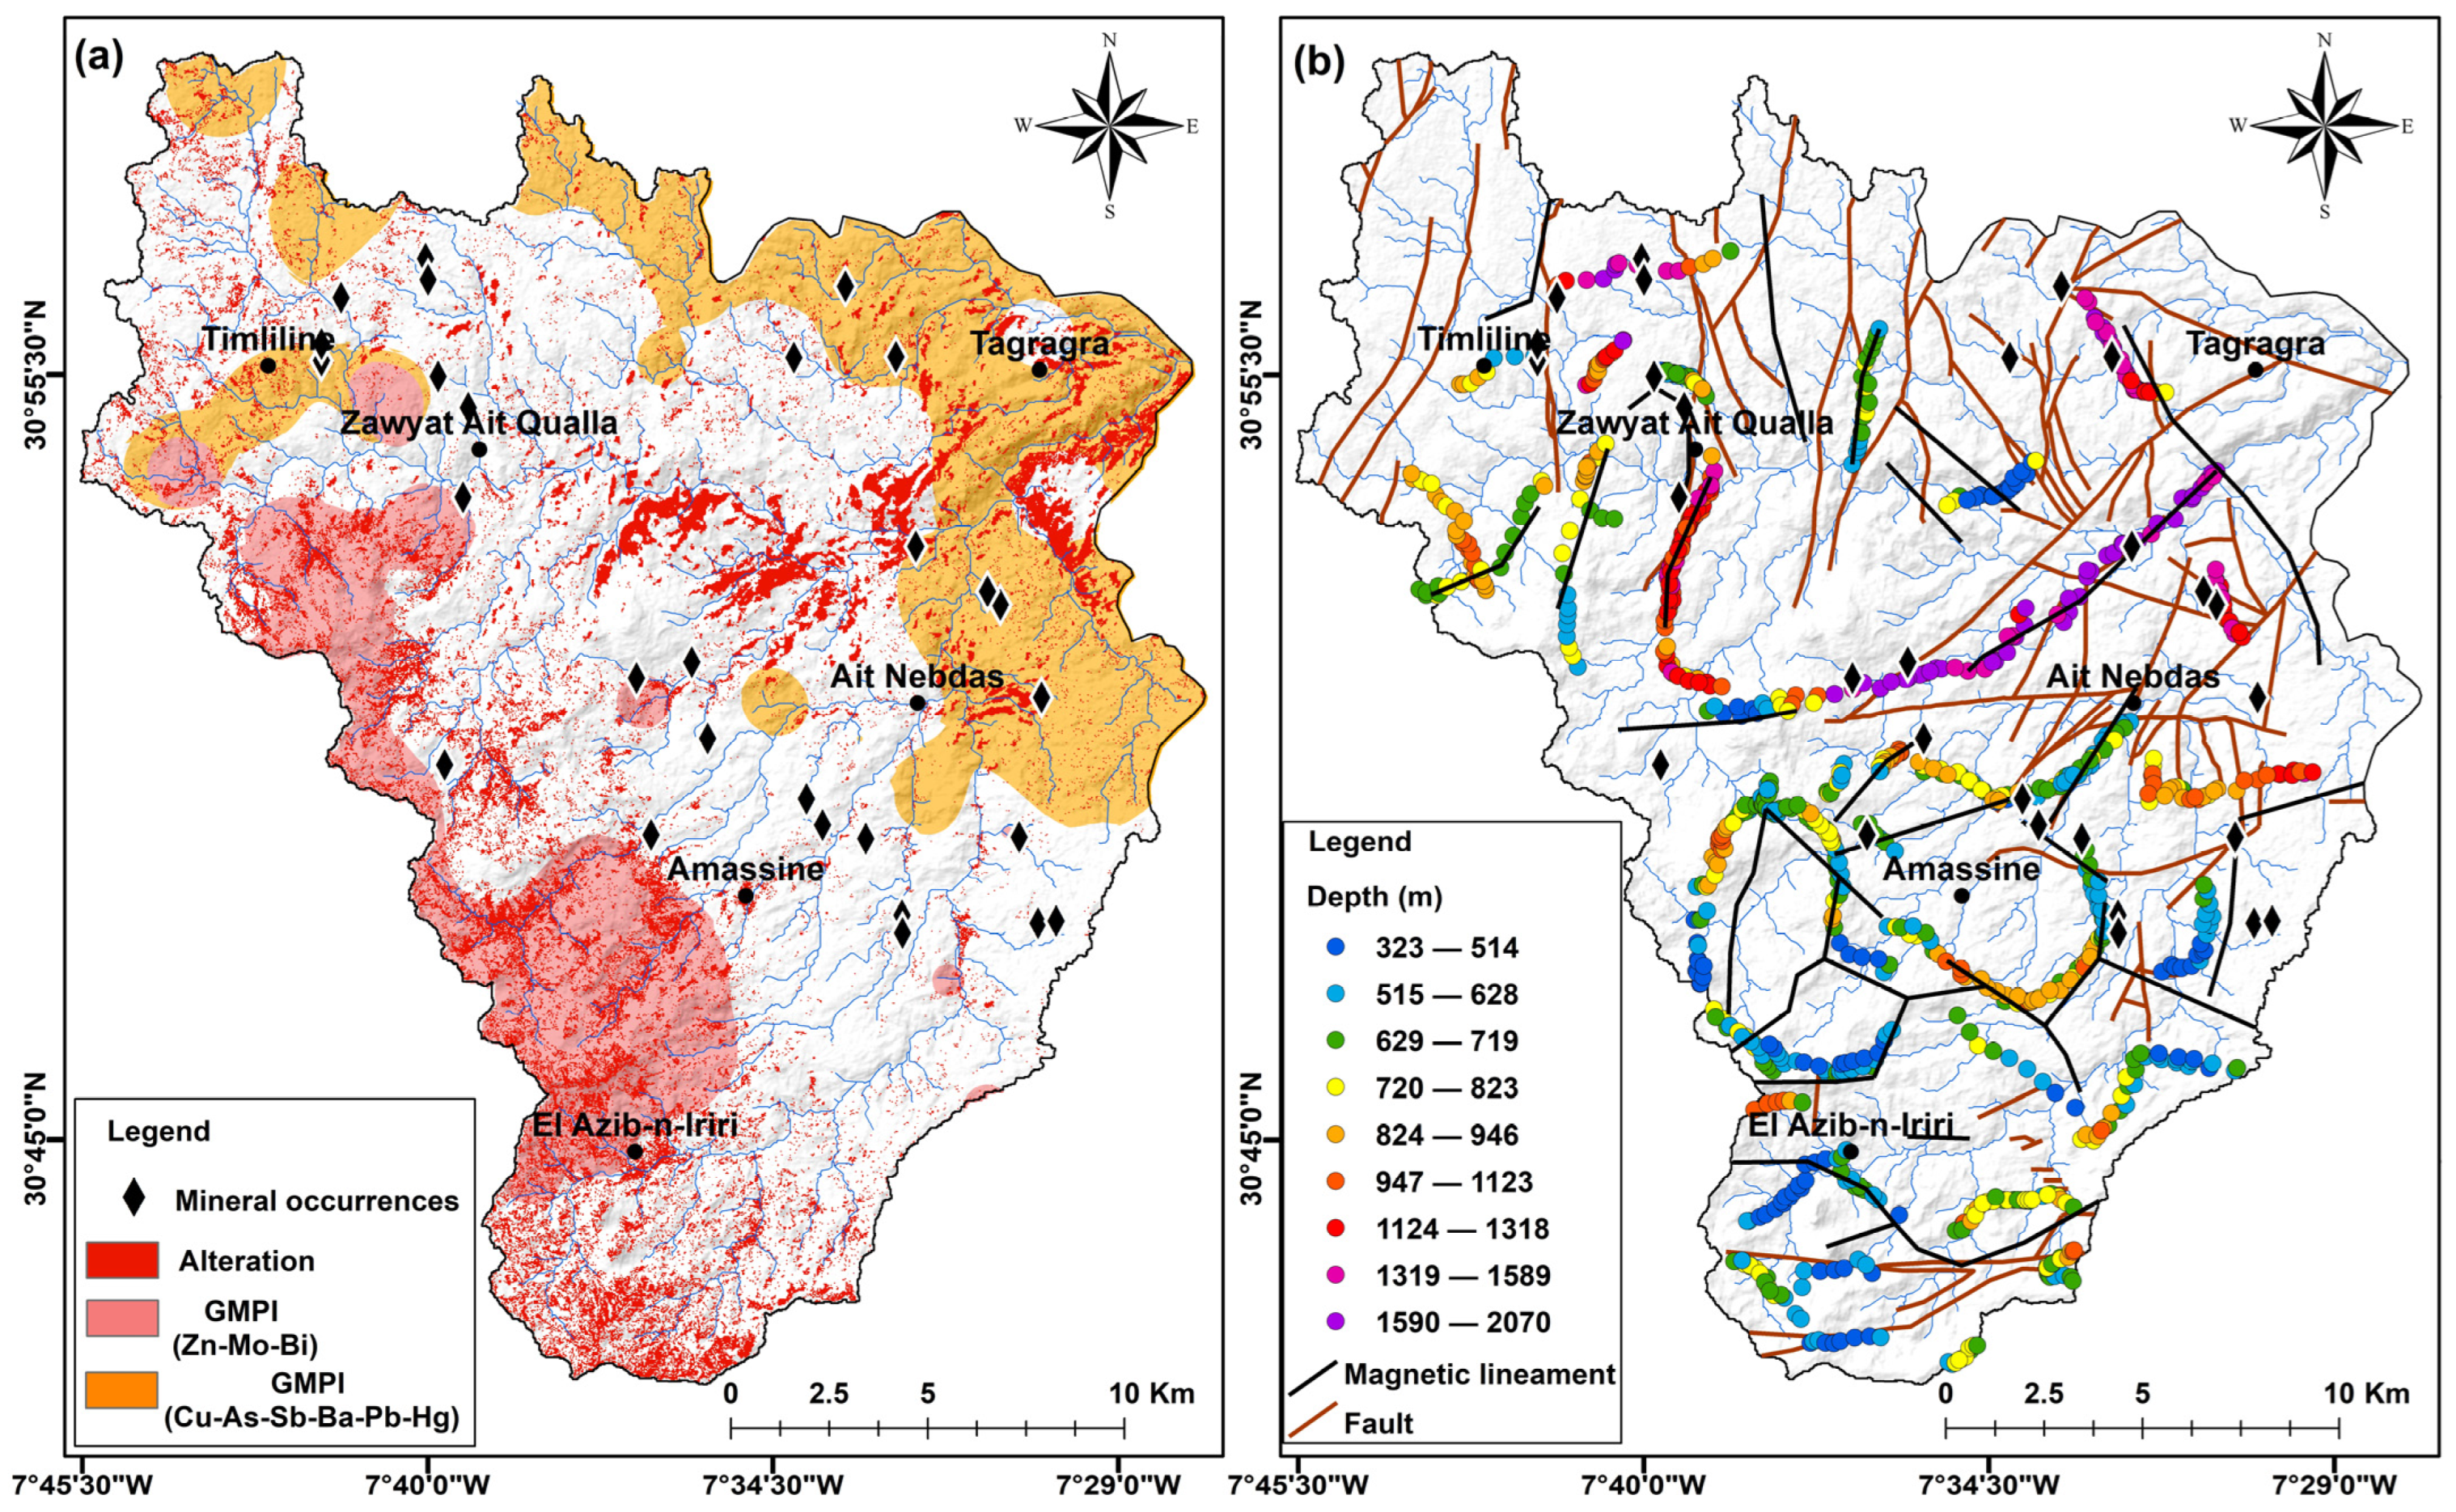
The interpreted magnetic lineaments were compared with mapped geological faults and known mineral occurrences (Cu, Pb, Zn). The strong agreement provides indirect validation of the aeromagnetic analysis, even in the absence of extensive field structural mapping. TDR analyses and Euler deconvolution revealed lineament-oriented NNE-SSW, NW-SE, and E-W, with depths ranging from 300 to 2000 m (Figure 7c,d). Many of these lineaments coincided with known Cu, Pb, and Zn deposits. These lineaments, identified through magnetic derivative analysis, were integrated into the fault database and incorporated into the Fault-Dip (FD) model. Field checks corroborate the aeromagnetic lineaments, with representative outcrops (Figure 8) precisely aligned with the mapped trends and Euler solutions.

5. Discussion

Geogenic soil enrichment is a complex phenomenon influenced by various geological factors. The lithology of geological formations and hydrothermal phenomena plays a crucial role in amplifying trace-element concentrations in soils [122,123]. Beyond delineating anomalies, the results bear environmental implications. Incorporating sustainability indices, such as those developed by Vaziri et al. [124] and Golabkesh et al. [125], could strengthen environmental risk evaluation by linking geogenic enrichment to agricultural and ecological impacts. This integrative perspective represents a crucial step for effective environmental management in the basin. In the Irirri basin, the impact of these factors on geogenic enrichment was investigated using ASTER data, geochemical surveys, and aeromagnetic analyses. Each dataset contains inherent uncertainties: spectral overlap and atmospheric correction can affect ASTER results, while local heterogeneity may bias geochemical data. To mitigate these, we relied on cross-validation, integrating multiple independent datasets. The strong correspondence between ASTER anomalies, geochemical signatures, and aeromagnetic structures enhances the reliability of the final enrichment map.
The analysis of satellite images using four processing techniques—SPCA, SAM, LSU, and MF—reveals that alteration zones are primarily concentrated in the basin’s NE, extreme W, and S. The alterations in the NE are associated with outcrops of andesites and ignimbrites, as well as the presence of hydrothermal drains characterized by a high density of NE-SW oriented faults, near which several mineral indicators are found. In the extreme west of the basin, alterations coincide with outcrops of trachytes, phonolites, and nephelines. Finally, alterations in the basin’s southern part are linked to E-W-oriented faults. A mix of argillic, phyllic, and propylitic alterations is evident in most identified alteration zones.
Argillic and phyllic alterations exhibit similar spatial distribution. At the same time, the propylitic zone is characterized by a more extensive surface distribution and a high level of mixing with argillic and phyllic alterations (see Figure 3 and Figure 4). The increased relative abundance of propylitic alterations compared to argillic and phyllic alterations can be attributed to the mineralogical composition of the predominant volcano-sedimentary rocks in the region.
Volcano-sedimentary rocks exhibit two distinct types of alteration: (i) regional deuteric alteration and (ii) quartz-sericite alteration centered on mineralized zones. The first regional alteration varies based on the acidic or basic nature of the affected rocks. In basic volcanic rocks, this alteration manifests as propylitization, characterized by the development of chlorite, sericite, epidote, carbonates, and quartz at the expense of ferromagnesian minerals, plagioclases, and mesostasis. Conversely, in acidic facies, argillic and phyllic alterations develop through pseudomorphism of ferromagnesian minerals into chlorite, sericite, or muscovite. At the same time, feldspars transform into albite, often accompanied by epidote and chlorite, and mesostasis consists of quartz, epidote, and chlorite.
The second alteration, quartz-sericite type, occurs near mineral deposits and indicators, with its intensity increasing closer to these indicators (Figure 9a). This process is directly linked to the emplacement of mineralizations and serves as a good indicator of geogenic enrichment in the region. The minerals in the affected rocks are wholly or partially transformed near mineralized hydrothermal drains (veins), replaced by a paragenesis including quartz, sericite, pyrite, chlorite, and calcite (less abundant). In corridors affected by this alteration, the products of propylitization (quartz, albite, calcite, chlorite, epidote), well-expressed far from mineral indicators, are progressively destabilized in favor of quartz and sericite, which can form the bulk of the rock near mineral indicators (see Figure 9b).
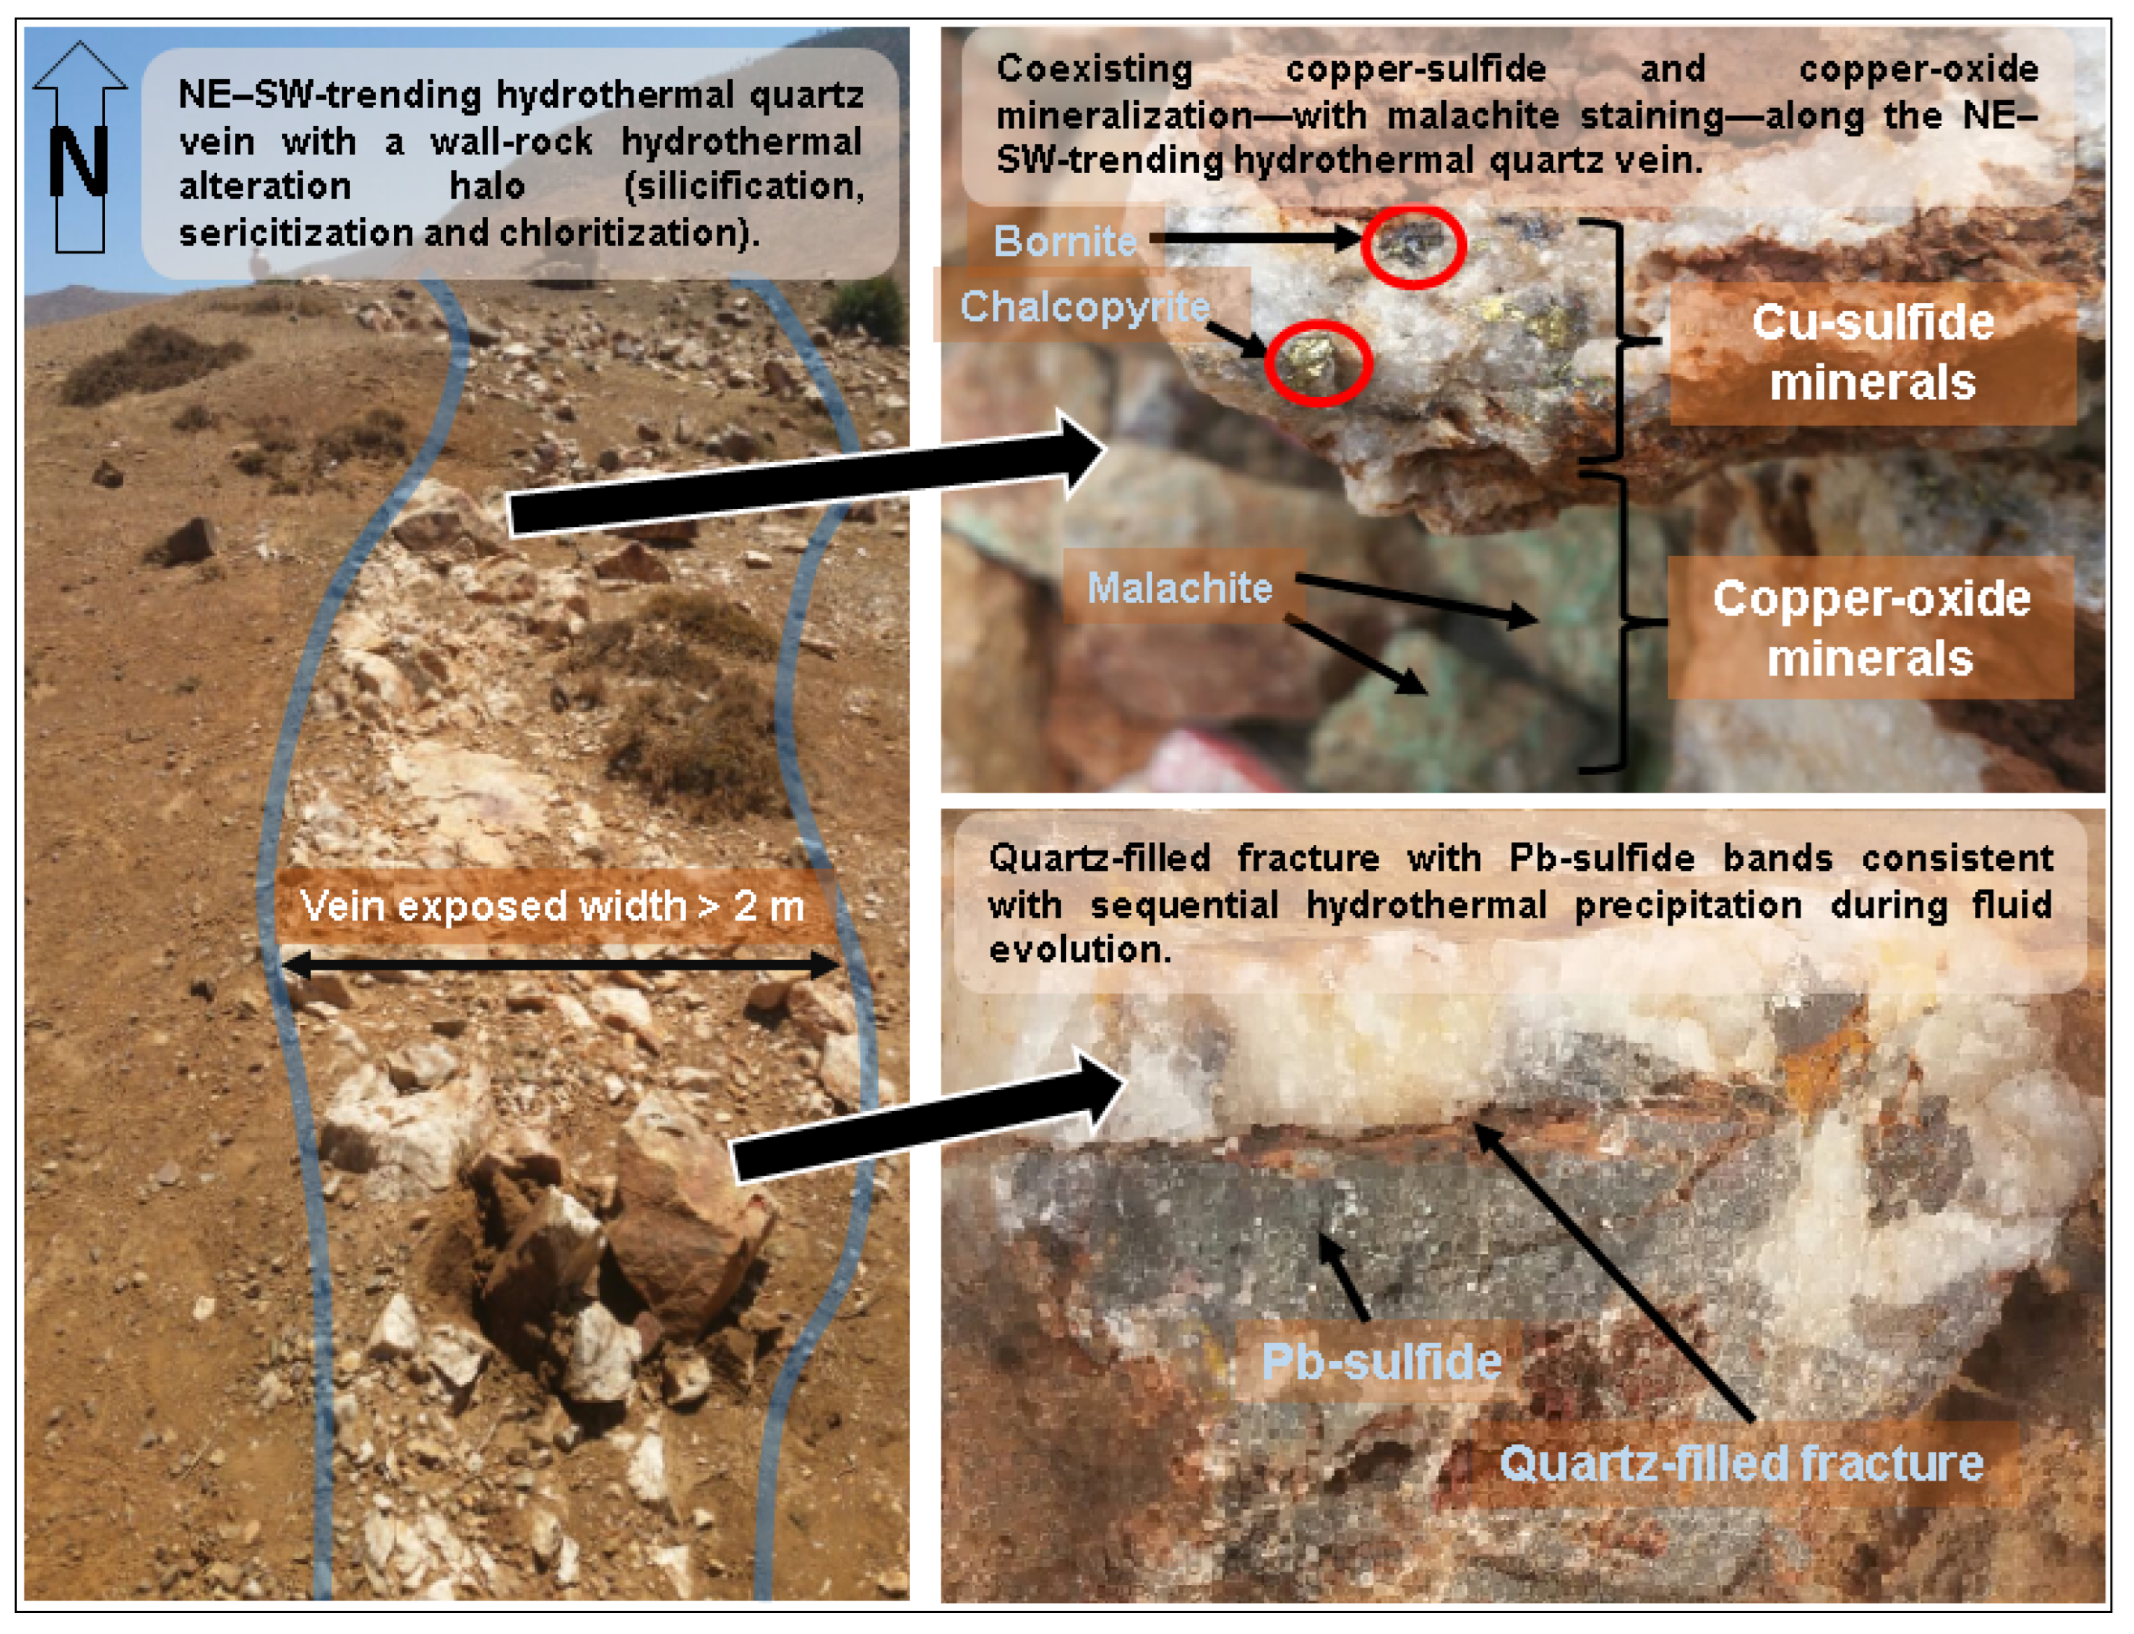
In this second type of alteration, the discoloration often observed in mineralized shear zones is attributed to a supergene effect related to the oxidation of sulfides (Figure 10a). The mineralization primarily consists of chalcopyrite, bornite, and chalcocite, observable only at depth (Figure 10b). These minerals are oxidized near the surface to malachite, azurite, and chrysocolla (Figure 10c,d). Other sulfides, such as sphalerite and galena, are occasionally encountered. In addition, external hydrological processes such as surface runoff and episodic precipitation strongly influence the redistribution of heavy metals. Runoff transports fine, metal-rich sediments into floodplains and depressions, while intense but infrequent rainfall events cause localized accumulations. These mechanisms explain part of the observed heterogeneity in metal concentrations and may produce secondary anomalies independent of primary mineralization [29,126,127].
Geochemically, two associations (Cu-As-Sb-Ba-Pb-Hg) and (Zn-Mo-Bi) emerge from the statistical analysis of geochemical survey results. These associations can be linked to the impact of lithological formations or the formation conditions of the region’s hydrothermal mineralizations. In some areas, these associations overlap, reflecting transitional environments where lithological and hydrothermal processes interact. Such mixed signatures highlight zones of particular interest for further field investigation and mineral exploration.
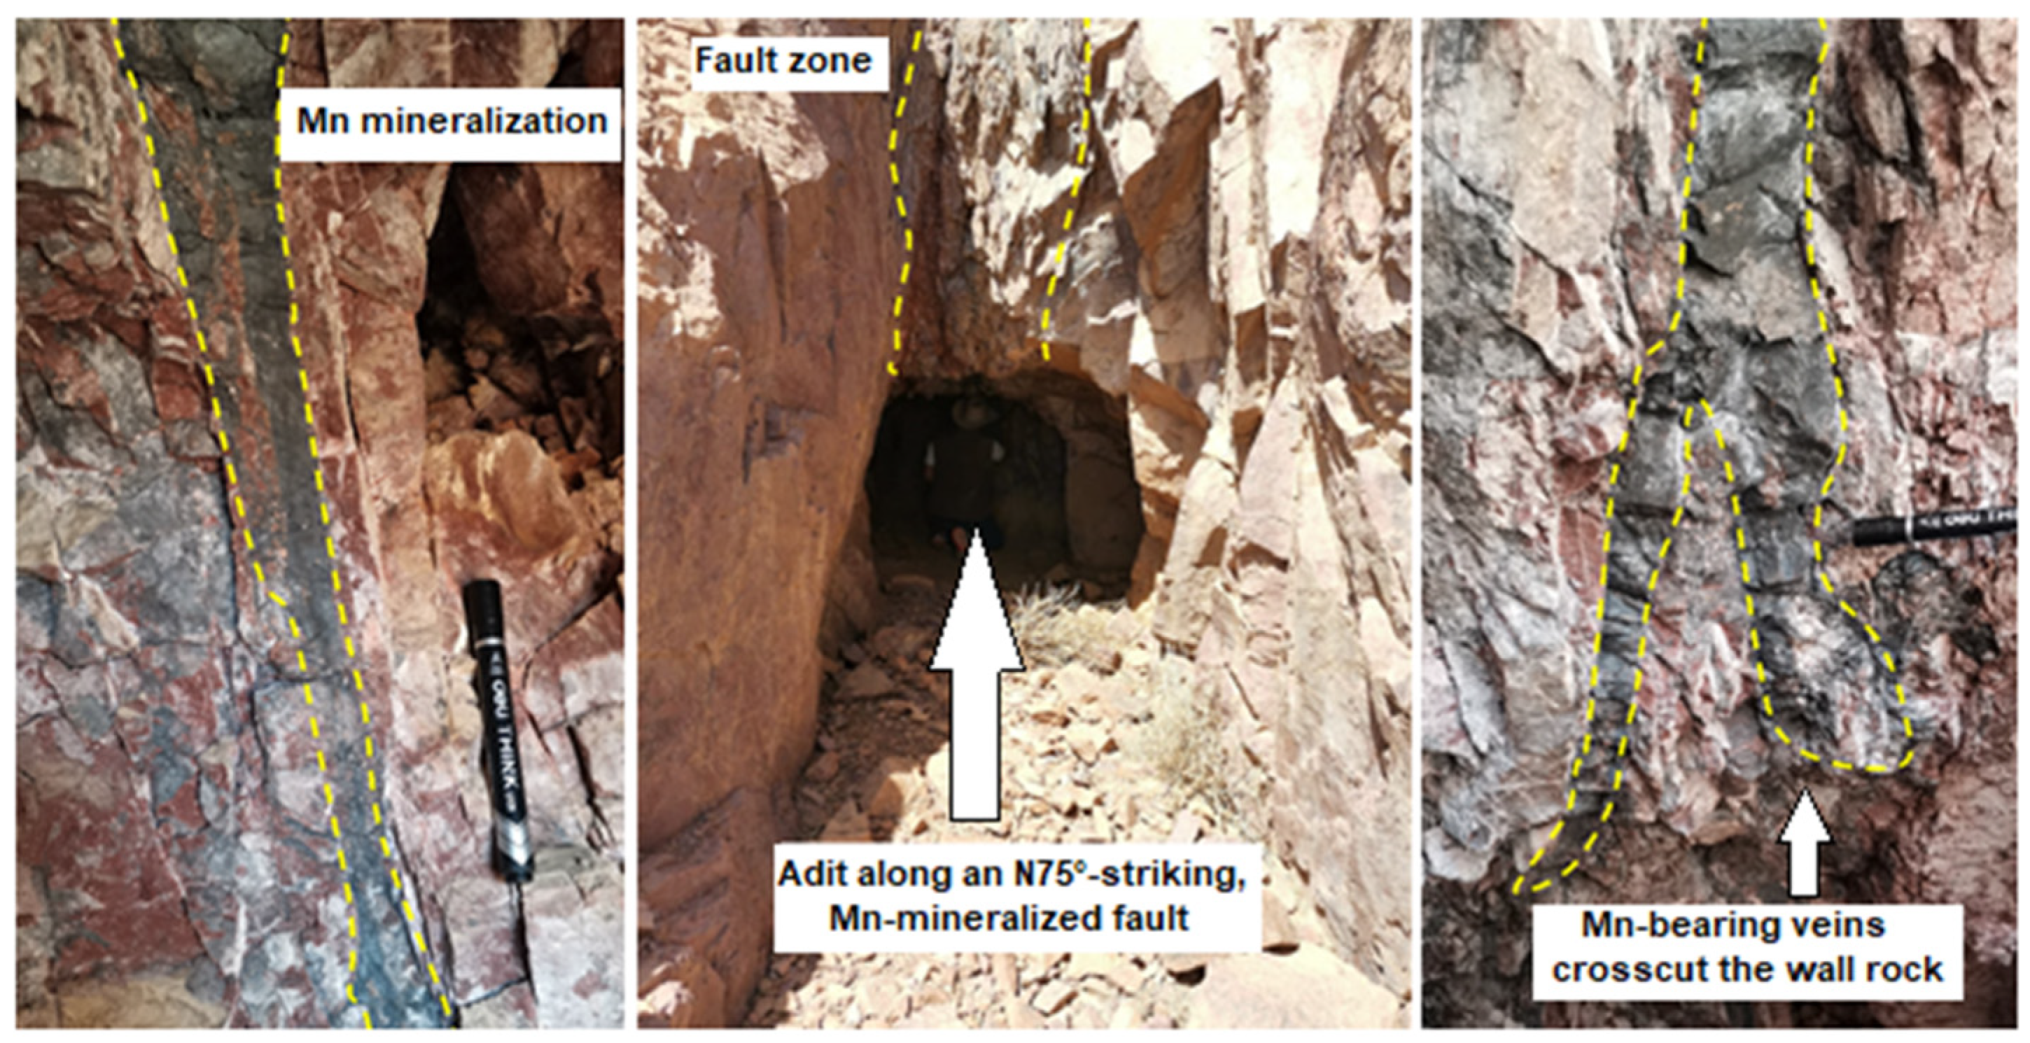
The Zn-Mo-Bi association, predominant in the extreme west of the region, coincides with outcrops of trachytes, phonolites, and nephelines, indicating a direct lithological impact on this type of enrichment. Indeed, phonolites and trachytes are alkaline-rich volcanic rocks rich in alkaline elements, characterized by a high alkali content (Na2O + K2O) relative to silica, and are typically formed from evolved magmatic systems. They typically contain minerals such as feldspathoids (nepheline, leucite) and alkaline feldspars (sanidine, orthoclase), which can incorporate trace elements more efficiently than other rocks. Additionally, they contain accessory minerals such as apatite, titanite, and zircon, which can host significant quantities of trace elements, including Zn, Mo, and Bi, which often remain in the residual magma during its evolution, concentrating in late-stage mineral phases or hydrothermal fluids. This process can lead to localized geochemical anomalies, with minor outcrops of trachyte or phonolite displaying high metallic signatures. These rocks are also likely to be associated with small mineral occurrences or veins containing these elements, especially when affected by fractures or faults, allowing the circulation of hydrothermal fluids. The Mn-mineralized structures documented in the field (Figure 11) provide direct evidence for the Zn and Mo enrichment associated with this hydrothermal circulation.
By linking these geochemical anomalies to the mapped trachyte-phonolite units, it is demonstrated that alkaline volcanic lithologies can produce soils or sediments naturally enriched in Zn, Mo, Bi, and other trace elements, thereby explaining the observed anomalies without the involvement of large-scale anthropogenic or hydrothermal processes. This strengthened link between regional geology and the observed geochemical anomalies helps to better understand the distinctive geochemical signatures of these rocks and their metallogenic potential.
The Cu-As-Sb-Ba-Pb-Hg association, predominant in the north and northeast of the basin, appears to be of hydrothermal origin since it coincides with major drains (deep faults) mapped on the geological map. High concentrations are located downstream of watersheds containing upstream mining indicators. These anomalies are directly related to surface mineralizations, which were placed in two stages [23,128].
The first stage corresponds to the deposition of quartz-biotite (rare tourmaline) parageneses, iron-copper sulfides, arsenides (As-Sb), and iron and cobalt sulfo-arsenides. This stage is associated with aqueous H2O-CO2-CH4 (±N2) fluids trapped at high temperatures (450–300 °C) under varying pressures (0.5–1.9 kbar).
The second stage is characterized by the deposition of sphalerite, chalcopyrite (Cu), and galena (Pb) in N-S-oriented veins filled with quartz-albite-chlorite and siderite-calcite. This stage is followed by the deposition of silver-rich parageneses, including Ag-Hg amalgams (dominant silver phases), acanthite, galena, pearceite, polybasite, and Ag-Hg sulfides. It corresponds to moderate temperature conditions, below 200 °C, with hypersaline brine fluids H2O-NaCl-CaCl2 (24–40% by weight NaCl + CaCl2) under moderate pressures.
The field photographs of quartz-vein material (Figure 12) with disseminated sulfides and pervasive Fe-oxide alteration corroborate the Cu–Pb anomalies and implicate the vein system as the primary source of the surrounding geochemical signal.
Field studies show that faults and fractures are crucial in the spatial distribution of hydrothermal alteration zones and mineralization in the study area. These faults are either brecciated or filled with hydrothermal minerals such as dolomite, quartz, and iron oxides. Consequently, the structural features within alteration zones can be considered areas with high potential for mineralization and geogenic enrichment in the study region. The mapping of these faults has been enhanced by magnetic surveys, enabling the mapping of deep structures that are sometimes undetectable at the surface (Figure 7). The overlay of geogenic pollution enrichment zones, known mining indicators in the study region, and sources of magnetic anomalies at different levels (Figure 8) shows that:
There is a good correlation between residual anomalies, mining indicators, and high enrichment zones, especially for faults with deep rooting. Exceptions to this correlation are found in the indicators located east of the village of Amassine, which show structural rooting at depths less than 500 m.
Although geogenic enrichment indicators and most sulfide minerals exhibit low or antiferromagnetic magnetic susceptibility values, magnetic data effectively detect these high enrichment zones.
Moreover, the presence of a surface layer of iron oxide, such as magnetite and hematite, often conceals some mining indicators. As we have discovered, this layer significantly enhances the effectiveness of magnetic tools, sparking our curiosity and driving further research [129]. Many indicators in the region, including the manganese-rich district of the Timliline region to the north, have been profoundly affected by oxidation and are now covered by iron oxides.
Trace metal enrichment may affect soil fertility, agricultural productivity, and water quality through leaching into irrigation networks. Elevated concentrations of Pb, Zn, and Cu also pose potential risks to human health. These implications stress the need for environmental monitoring and integration of geoscientific findings into local risk management strategies.

6. Conclusions

The application of ASTER image-processing methods has proven effective in identifying soil alterations in the study region. Specifically, four techniques were employed to systematically detect mineral groups with spectral dominance: spectral angle mapping (SAM), linear spectral unmixing (LSU), matched filtering (SMF), and principal component analysis (PCA). These methods enabled the identification of minerals such as muscovite, montmorillonite, illite, hematite, jarosite, chlorite, and epidote.
Furthermore, the detailed processing of geochemical data through PCA facilitated the identification of potential sources of trace-element contamination. The results revealed two distinct associations of trace elements: one comprising Cu-As-Sb-Ba-Pb-Hg, located in the north, northeast, and south of the basin, which is linked to hydrothermal phenomena; and another comprising Zn-Mo-Bi, situated in the western part of the basin, which has a purely lithological origin.
The analysis of magnetic data further supported these findings. It was observed that abnormal concentrations of Cu, As, Sb, Ba, Pb, and Hg are associated with deep structural faults. These deep-rooted faults play a crucial role in the distribution of these trace elements, indicating a significant influence on hydrothermal processes. In contrast, surface features did not exhibit similar geochemical anomalies, suggesting that surface processes have a lesser impact on the distribution of these elements.
Additionally, the study highlighted the effectiveness of combining ASTER image processing with magnetic and geochemical data analysis. The overlay of information from these sources not only provided a comprehensive understanding of the spatial distribution of hydrothermal alteration zones and associated trace-element contamination but also enlightened us about the complexity of these processes. This integrated approach allowed for the identification of areas with high potential for mineralization and geogenic enrichment, providing a wealth of knowledge for future research and management.
Although tailored to the specific geology of the Assif n’Iriri basin, this integrated workflow—combining ASTER spectral mapping, geochemistry, and aeromagnetics—can be adapted to other arid and semi-arid terrains. Lessons learned here provide a methodological template for similar geoscientific investigations in comparable environments.
Overall, the findings underscore the importance of using advanced remote sensing and data analysis techniques to map and monitor soil alterations and trace-element contamination. Developing a detailed map of naturally affected areas offers valuable insights into potential risks to eco-environmental systems and provides a solid foundation for targeted management and prevention of geogenic enrichment impacts. The practical implications of our research highlight its relevance and applicability in the field.

Author Contributions

Conceptualization, M.I.-B., S.B. and F.Z.E.; methodology, M.I.-B., S.B. and F.Z.E.; software, M.I.-B. and F.Z.E.; validation, M.I.-B., S.B., F.Z.E., M.I. and H.E.A.; formal analysis, M.I.-B., S.B. and F.Z.E.; investigation, M.I.-B.; resources, M.I.-B.; data curation, M.I.-B.; writing—original draft preparation, M.I.-B., S.B., F.Z.E., M.I. and H.E.A.; writing—review and editing, M.I.-B., S.B., F.Z.E., M.I., H.E.A. and M.A.; visualization, F.Z.E. and M.A.; supervision, S.B.; project administration, S.B. All authors have read and agreed to the published version of the manuscript.

Funding

This research received no external funding.

Institutional Review Board Statement

Not applicable.

Informed Consent Statement

Not applicable.

Data Availability Statement

The original contributions presented in this study are included in the article. Further inquiries can be directed to the corresponding author.

Acknowledgments

We thank our colleague Mohammed Ouchchen for his assistance during the field work. The co-author, Mohamed Abioui, also thanks Enas Abioui for her help with the English proofreading of this manuscript.

Conflicts of Interest

The authors declare no conflicts of interest.

References

  1. Ramón, F.; Lull, C. Legal measures to prevent and manage soil contamination and to increase food safety for consumer health: The case of Spain. Environ. Pollut. 2019, 250, 883–891. [Google Scholar] [CrossRef]
  2. Liu, Y.; Xiao, T.; Zhu, Z.; Ma, L.; Li, H.; Ning, Z. Geogenic pollution, fractionation and potential risks of Cd and Zn in soils from a mountainous region underlain by black shale. Sci. Total Environ. 2021, 760, 143426. [Google Scholar] [CrossRef]
  3. Huang, Y.; Wang, H.; Xiao, W.H.; Chen, L.H.; Zhou, Y.Y.; Song, X.Y.; Wang, H.J. Contributions of climate change and anthropogenic activities to runoff change in the Hongshui River, Southwest China. IOP Conf. Ser. Earth Environ. Sci. 2018, 191, 012143. [Google Scholar] [CrossRef]
  4. Chai, R.; Mao, J.; Chen, H.; Wang, Y.; Shi, X.; Jin, M.; Zhao, T.; Hoffman, F.M.; Ricciuto, D.M.; Wullschleger, S.D. Human-caused long-term changes in global aridity. npj Clim. Atmos. Sci. 2021, 4, 65. [Google Scholar] [CrossRef]
  5. Zhang, Z.; Wang, Y.; Qin, H.; Zhang, S.; Chen, H.; Jin, G.; Liu, Z.; Xu, Q.; Zhan, Y. The hydrological regime of Taihu Lake under the influence of anthropogenic activities. J. Hydrol. Reg. Stud. 2023, 50, 101568. [Google Scholar] [CrossRef]
  6. Izah, S.C.; Chakrabarty, N.; Srivastav, A.L. A review on heavy metal concentration in potable water sources in Nigeria: Human health effects and mitigating measures. Expo. Health 2016, 8, 285–304. [Google Scholar] [CrossRef]
  7. Gyamfi, E.; Appiah-Adjei, E.K.; Adjei, K.A. Potential heavy metal pollution of soil and water resources from artisanal mining in Kokoteasua, Ghana. Groundw. Sustain. Dev. 2019, 8, 450–456. [Google Scholar] [CrossRef]
  8. Akhtar, M.S.; Hameed, A.; Aslam, S.; Ullah, R.; Kashif, A. Phytoremediation of metal-contaminated soils and water in Pakistan: A review. Water Air Soil Pollut. 2023, 234, 11. [Google Scholar] [CrossRef]
  9. Aisabokhae, J.; Alimi, S.; Adeoye, M.; Oresajo, B. Geological structure and hydrothermal alteration mapping for mineral deposit prospectivity using airborne geomagnetic and multispectral data in Zuru Province, northwestern Nigeria. Egypt. J. Remote Sens. Space Sci. 2023, 26, 231–244. [Google Scholar] [CrossRef]
  10. Olomo, K.O.; Olayanju, G.M.; Bayode, S.; Alagbe, O.A.; Olaleye, O.K. Electrical and electromagnetic geophysical signature associated with geological frame of polymineralic deposit within hydrothermal alteration zones. J. Appl. Geophys. 2024, 222, 105315. [Google Scholar] [CrossRef]
  11. Liang, J.; Tao, C.; Zheng, Y.; Zhang, G.; Su, C.; Yang, W.; Liao, S.; Wang, N. Geology context, vent morphology, and sulfide paragenesis of the Longqi-1 modern seafloor hydrothermal system on the ultraslow-spreading Southwest Indian ridge. Deep-Sea Res. I Oceanogr. Res. Pap. 2023, 194, 103962. [Google Scholar] [CrossRef]
  12. Ma, Y.; Li, M.; Li, P.; Yang, L.; Wu, L.; Gao, F.; Qi, X.; Zhang, Z. Hydrothermal synthesis of magnetic sludge biochar for tetracycline and ciprofloxacin adsorptive removal. Bioresour. Technol. 2021, 319, 124199. [Google Scholar] [CrossRef]
  13. Thomas, R.J.; Chevallier, L.P.; Gresse, P.G.; Harmer, R.E.; Eglington, B.M.; Armstrong, R.A.; de Beer, C.H.; Martini, J.E.J.; de Kock, G.S.; Macey, P.H.; et al. Precambrian evolution of the Sirwa window, Anti-Atlas orogen, Morocco. Precambrian Res. 2002, 118, 1–57. [Google Scholar] [CrossRef]
  14. Wang, H.; Lu, S. Spatial distribution, source identification and affecting factors of heavy metals contamination in urban–suburban soils of Lishui city, China. Environ. Earth Sci. 2011, 64, 1921–1929. [Google Scholar] [CrossRef]
  15. Chen, T.; Chang, Q.; Liu, J.; Clevers, J.G.P.W.; Kooistra, L. Identification of soil heavy metal sources and improvement in spatial mapping based on soil spectral information: A case study in northwest China. Sci. Total Environ. 2016, 565, 155–164. [Google Scholar] [CrossRef]
  16. Lapworth, D.J.; Krishan, G.; MacDonald, A.M.; Rao, M.S. Groundwater quality in the alluvial aquifer system of northwest India: New evidence of the extent of anthropogenic and geogenic contamination. Sci. Total Environ. 2017, 599–600, 1433–1444. [Google Scholar] [CrossRef] [PubMed]
  17. Fei, X.; Christakos, G.; Xiao, R.; Ren, Z.; Liu, Y.; Lv, X. Improved heavy metal mapping and pollution source apportionment in Shanghai City soils using auxiliary information. Sci. Total Environ. 2019, 661, 168–177. [Google Scholar] [CrossRef]
  18. Kalpana, L.; Brindha, K.; Elango, L. FIMAR: A new Fluoride Index to Mitigate Geogenic Contamination by Managed Aquifer Recharge. Chemosphere 2019, 220, 381–390. [Google Scholar] [CrossRef]
  19. Maliqi, E.; Jusufi, K.; Singh, S.K. Assessment and spatial mapping of groundwater quality parameters using metal pollution indices, graphical methods and geoinformatics. Anal. Chem. Lett. 2020, 10, 152–180. [Google Scholar] [CrossRef]
  20. Ligate, F.; Ijumulana, J.; Ahmad, A.; Kimambo, V.; Irunde, R.; Mtamba, J.O.; Mtalo, F.; Bhattacharya, P. Groundwater resources in the East African Rift Valley: Understanding the geogenic contamination and water quality challenges in Tanzania. Sci. Afr. 2021, 13, e00831. [Google Scholar] [CrossRef]
  21. Petermann, E.; Bossew, P. Mapping indoor radon hazard in Germany: The geogenic component. Sci. Total Environ. 2021, 780, 146601. [Google Scholar] [CrossRef]
  22. Ma, X.; Song, Z.; Wang, Y.P.; Wang, S.; Zhan, Z.W.; He, D. Heavy metal dynamics in riverine mangrove systems: A case study on content, migration, and enrichment in surface sediments, pore water, and plants in Zhanjiang, China. Mar. Environ. Res. 2025, 203, 106832. [Google Scholar] [CrossRef] [PubMed]
  23. Marcoux, E.; Wadjinny, A. The Ag-Hg Zgounder ore deposit (Jebel Siroua, Anti-Atlas, Morocco): A Neoproterozoic epithermal mineralization of the Imiter type. Comptes Rendus Geosci. 2005, 337, 1439–1446. [Google Scholar] [CrossRef]
  24. Belkacim, S.; Ikenne, M.; Souhassou, M.; Elbasbas, A.; Toummite, A. The Cu-Mo ± Au mineralizations associated to the high-K calc-alkaline granitoids from Tifnoute valley (Siroua massif, Anti-Atlas, Morocco): An arc-type porphyry in the Late Neoproterozoic series. J. Environ. Earth Sci. 2014, 4, 90–106. [Google Scholar]
  25. Johnson, C.C.; Flight, D.M.A.; Lister, T.R.; Strutt, M.H. Le Rapport Final Pour les Travaux de Recherches Géologique Pour la Réalisation de Cinq Cartes Géochimiques au 1/100 000 dans le Domaine de l’Anti-Atlas (Maroc); Geological Survey Confidential Internal Report Prepared for the Moroccan Ministry of Mines and Energy; Commissioned Report Series; No. CR/01/031; British Geological Survey: Nottingham, UK, 2001.
  26. Ouchchen, M.; Abia, E.H.; Soulaimani, A.; Abioui, M.; Lutz, B.; Benssaou, M.; Abdelrahman, K.; Abu-Alam, T.; Echogdali, F.Z.; Boutaleb, S. The Missing Link in the Genesis of the Lower Paleozoic Copper Deposits of the Anti-Atlas (Morocco): The Late Triassic Central Atlantic Magmatic Province Event. Minerals 2023, 13, 488. [Google Scholar] [CrossRef]
  27. El Hamzaoui, E.H.; El Baghdadi, M.; Oumenskou, H.; Aadraoui, M.; Hilali, A. Spatial repartition and contamination assessment of heavy metal in agricultural soils of Beni-Moussa, Tadla plain (Morocco). Model. Earth Syst. Environ. 2020, 6, 1387–1406. [Google Scholar] [CrossRef]
  28. El Khalil, H.; El Hamiani, O.; Bitton, G.; Ouazzani, N.; Boularbah, A. Heavy metal contamination from mining sites in South Morocco: Monitoring metal content and toxicity of soil runoff and groundwater. Environ. Monit. Assess. 2008, 136, 147–160. [Google Scholar] [CrossRef]
  29. Mimouni, Y.; Chafi, A.; Bouabdli, A.; Baghdad, B.; Deliege, J.F. Assessment of Multiple Trace Metal Fluxes in a Semi-Arid Watershed Containing Mine Tailing, Using a Multiple Tool Approach (Zaida Mine, Upper Moulouya Watershed, Morocco). Hydrology 2024, 11, 105. [Google Scholar] [CrossRef]
  30. El Aouad, N.; Admou, H.; Wafik, A.; Ahmid, H.; Kharis, A.A.; Atif, Y.; Daafi, Y.; Chaib, L. Geology, geochemistry, and geodynamic implications of Ediacaran magmatic rocks of the Zgounder inlier, Siroua window, Anti-Atlas, Morocco. Arab. J. Geosci. 2021, 14, 314. [Google Scholar] [CrossRef]
  31. Barbey, P.; Oberli, F.; Burg, J.P.; Nachit, H.; Pons, J.; Meier, M. The Palaeoproterozoic in western Anti-Atlas (Morocco): A clarification. J. Afr. Earth Sci. 2004, 39, 239–245. [Google Scholar] [CrossRef]
  32. Tuduri, J. Processus de Formation et Relations Spatio-Temporelles des Minéralisations à or et Argent en Contexte Volcanique Précambrien (Jbel Saghro, Anti-Atlas, Maroc): Implications sur Les Relations Déformation-Magmatisme-Volcanisme-Hydrothermalisme. Doctoral Dissertation, Orléans University, Orléans, France, 2005. [Google Scholar]
  33. Chatir, A.; Berger, J.; Ennih, N.; Triantafyllou, A.; de Parseval, P.; Errami, E.; Boutaleb, M. Formation of the Nkob talc deposit by contact metamorphism and fluid infiltration into siliceous dolostones (Moroccan Anti-Atlas). Ore Geol. Rev. 2022, 140, 104629. [Google Scholar] [CrossRef]
  34. De Beer, C.H.; Chevallier, L.P.; De Kock, G.S.; Gresse, P.G.; Thomas, R.J. Notice Explicatif Pour Carte Géologique du Maroc au 1/50 000 Feuille Sirwa; Notes et Mémoires du Service Géologique; Service Géologique du Maroc: Rabat, Morocco, 2000; No. 395. [Google Scholar]
  35. Thomas, R.J.; Fekkak, A.; Ennih, N.; Errami, E.; Loughlin, S.C.; Gresse, P.G.; Chevallier, L.P.; Liégeois, J.P. A new lithostratigraphic framework for the Anti-Atlas Orogen, Morocco. J. Afr. Earth Sci. 2004, 39, 217–226. [Google Scholar] [CrossRef]
  36. Soulaimani, A.; Ouanaimi, H.; Saddiqi, O.; Baidder, L.; Michard, A. The Anti-Atlas pan-african belt (Morocco): Overview and pending questions. Comptes Rendus Geosci. 2018, 350, 279–288. [Google Scholar] [CrossRef]
  37. Choubert, G. Note sur le Précambrien marocain. Comptes Rendus Acad. Sci. 1945, 221, 249–251. [Google Scholar]
  38. Choubert, G. L’accident majeur de l’Anti-Atlas. Comptes Rendus Acad. Sci. 1947, 234, 1172–1173. [Google Scholar]
  39. Choubert, G. Histoire Géologique de l’Anti-Atlas; Notes et Mémoires du Service Géologique du Maroc; Service Géologique du Maroc: Rabat, Morocco, 1963; 162p. [Google Scholar]
  40. Leblanc, M.; Lancelot, J.R. Interprétation géodynamique du domaine pan-africain (Précambrien terminal) de l’Anti-Atlas (Maroc) à partir des données géologiques et géochronologiques. Can. J. Earth Sci. 1980, 17, 142–155. [Google Scholar] [CrossRef]
  41. Toummite, A.; Liégeois, J.P.; Gasquet, D.; Bruguier, O.; Beraaouz, E.H.; Ikenne, M. Field, geochemistry and Sr-Nd isotopes of the PanAfrican granitoids from the Tifnoute Valley (Sirwa, Anti-Atlas, Morocco): A post-collisional event in a metacratonic setting. Miner. Petrol. 2012, 107, 739–763. [Google Scholar] [CrossRef]
  42. Kouyaté, D.; Söderlund, U.; Youbi, N.; Ernst, R.; Hafid, A.; Ikenne, M.; Soulaimani, A.; Bertrand, H.; El Janati, M.; R’kha Chaham, K. U–Pb baddeleyite and zircon ages of 2040 Ma, 1650 Ma and 885 Ma on dolerites in the West African Craton (Anti-Atlas inliers): Possible links to break-up of Precambrian supercontinents. Lithos 2013, 174, 71–84. [Google Scholar] [CrossRef]
  43. Michard, A.; Frizon de Lamotte, D.; Liégeois, J.P.; Saddiqi, O.; Chalouan, A.; Roure, F. Conclusion: Continental evolution in Western Maghreb. In Continental Evolution: The Geology of Morocco; Michard, A., Saddiqi, O., Chalouan, A., Frizon de Lamotte, D., Eds.; Springer: Berlin/Heidelberg, Germany, 2008; pp. 395–404. [Google Scholar] [CrossRef]
  44. Gasquet, D.; Ennih, N.; Liégeois, J.P.; Soulaimani, A.; Michard, A. The Pan-African belt. In Continental Evolution: The Geology of Morocco; Michard, A., Saddiqi, O., Chalouan, A., Frizon Lamotte, D., Eds.; Springer: Berlin/Heidelberg, Germany, 2008; pp. 33–64. [Google Scholar] [CrossRef]
  45. Ramos, Y. Étude du Potentiel des Données Satellitaires Pour la Cartographie Géologique; Bibliothèque et Archives Canada: Ottawa, QC, Canada, 2011. [Google Scholar]
  46. Abrams, M. The Advanced Spaceborne Thermal Emission and Reflection Radiometer (ASTER): Data products for the high spatial resolution imager on NASA’s Terra platform. Int. J. Remote Sens. 2000, 21, 847–859. [Google Scholar] [CrossRef]
  47. Ninomiya, Y. A stabilized vegetation index and several mineralogic indices defined for ASTER VNIR and SWIR data. In Proceedings of the IEEE 2003 International Geoscience and Remote Sensing Symposium (IGARSS’03), Toulouse, France, 21–25 July 2003; Volume 3, pp. 1552–1554. [Google Scholar]
  48. Mars, J.C.; Rowan, L.C. Regional mapping of phyllic-and argillic-altered rocks in the Zagros magmatic arc, Iran, using Advanced Spaceborne Thermal Emission and Reflection Radiometer (ASTER) data and logical operator algorithms. Geosphere 2006, 2, 161–186. [Google Scholar] [CrossRef]
  49. Di Tommaso, I.; Rubinstein, N. Hydrothermal alteration mapping using ASTER data in the Infiernillo porphyry deposit, Argentina. Ore Geol. Rev. 2007, 32, 275–290. [Google Scholar] [CrossRef]
  50. Mars, J.C.; Rowan, L.C. ASTER spectral analysis and lithologic mapping of the Khanneshin carbonatite volcano, Afghanistan. Geosphere 2011, 7, 276–289. [Google Scholar] [CrossRef]
  51. Ranjbar, H. Application of spectral analysis in mapping hydrothermal alteration of the Northwestern Part of the Kerman Cenozoic Magmatic Arc, Iran. J. Sci. Islam. Repub. Iran 2011, 22, 221–238. [Google Scholar]
  52. Shahriari, H.; Honarmand, M.; Ranjbar, H. Comparison of multi-temporal ASTER images for hydrothermal alteration mapping using a fractal-aided SAM method. Int. J. Remote Sens. 2015, 36, 1271–1289. [Google Scholar] [CrossRef]
  53. Shahriari, H.; Ranjbar, H.; Honarmand, M. Image segmentation for hydrothermal alteration mapping using PCA and concentration–area fractal model. Nat. Resour. Res. 2013, 22, 191–206. [Google Scholar] [CrossRef]
  54. Yousefi, S.J.; Ranjbar, H.; Alirezaei, S.; Dargahi, S.; Lentz, D.R. Comparison of hydrothermal alteration patterns associated with porphyry Cu deposits hosted by granitoids and intermediate-mafic volcanic rocks, Kerman Magmatic Arc, Iran: Application of geological, mineralogical and remote sensing data. J. Afr. Earth Sci. 2018, 142, 112–123. [Google Scholar] [CrossRef]
  55. Yang, K.; Lian, C.; Huntington, J.F.; Peng, Q.; Wang, Q. Infrared spectral reflectance characterization of the hydrothermal alteration at the Tuwu Cu–Au deposit, Xinjiang, China. Miner. Depos. 2005, 40, 324–336. [Google Scholar] [CrossRef]
  56. Beygi, S.; Talovina, I.V.; Tadayon, M.; Pour, A.B. Alteration and structural features mapping in Kacho-Mesqal zone, Central Iran using ASTER remote sensing data for porphyry copper exploration. Int. J. Image Data Fusion 2021, 12, 155–175. [Google Scholar] [CrossRef]
  57. Hunt, G.R. Spectral signatures of particulate minerals in the visible and near infrared. Geophysics 1977, 42, 501–513. [Google Scholar] [CrossRef]
  58. Hunt, G.R.; Ashley, R.P. Spectra of altered rocks in the visible and near infrared. Econ. Geol. 1979, 74, 1613–1629. [Google Scholar] [CrossRef]
  59. Zadeh, M.H.; Tangestani, M.H.; Roldan, F.V.; Yusta, I. Spectral characteristics of minerals in alteration zones associated with porphyry copper deposits in the middle part of Kerman copper belt, SE Iran. Ore Geol. Rev. 2014, 62, 191–198. [Google Scholar] [CrossRef]
  60. Rajendran, S.; Nasir, S. Characterization of ASTER spectral bands for mapping of alteration zones of volcanogenic massive sulphide deposits. Ore Geol. Rev. 2017, 88, 317–335. [Google Scholar] [CrossRef]
  61. Mas, A.; Guisseau, D.; Patrier Mas, P.; Beaufort, D.; Genter, A.; Sanjuan, B.; Girard, J.P. Clay minerals related to the hydrothermal activity of the Bouillante geothermal field (Guadeloupe). J. Volcanol. Geotherm. Res. 2016, 158, 380–400. [Google Scholar] [CrossRef]
  62. Molan, Y.E.; Refahi, D.; Tarashti, A.H. Mineral mapping in the Maherabad area, eastern Iran, using the HyMap remote sensing data. Int. J. Appl. Earth Obs. Geoinf. 2014, 27, 17–127. [Google Scholar] [CrossRef]
  63. Neal, L.C.; Wilkinson, J.J.; Mason, P.J.; Chang, Z. Spectral characteristics of propylitic alteration minerals as a vectoring tool for porphyry copper deposits. J. Geochem. Explor. 2018, 184, 179–198. [Google Scholar] [CrossRef]
  64. Abrams, M.J.; Hook, S.; Abrams, M.C. Imaging Spectrometry in the Thermal Infrared. In Imaging Spectrometry; Meer, F.D.V., Jong, S.M.D., Eds.; Springer: Dordrecht, Germany, 2002; pp. 283–306. [Google Scholar]
  65. Rowan, L.C.; Hook, S.J.; Abrams, M.J.; Mars, J.C. Mapping hydrothermally altered rocks at Cuprite, Nevada, using the Advanced Spaceborne Thermal Emission and Reflection Radiometer (ASTER), a new satellite-imaging system. Econ. Geol. 2003, 98, 1019–1027. [Google Scholar] [CrossRef]
  66. Rowan, L.C.; Mars, J.C. Lithologic mapping in the Mountain Pass, California area using Advanced Spaceborne Thermal Emission and Reflection Radiometer (ASTER) data. Remote Sens. Environ. 2003, 84, 350–366. [Google Scholar] [CrossRef]
  67. Abrams, M.; Hook, S.J. Simulated ASTER data for geologic studies. IEEE Trans. Geosci. Remote Sens. 1995, 33, 692–699. [Google Scholar] [CrossRef]
  68. Kusky, T.M.; Ramadan, T.M. Structural controls on Neoproterozoic mineralization in the South Eastern Desert, Egypt: An integrated field, Landsat TM, and SIR-C/X SAR approach. J. Afr. Earth Sci. 2002, 35, 107–121. [Google Scholar] [CrossRef]
  69. Gabr, S.; Ghulam, A.; Kusky, T. Detecting areas of high-potential gold mineralization using ASTER data. Ore Geol. Rev. 2010, 38, 59–69. [Google Scholar] [CrossRef]
  70. Nair, A.; Mathew, G. Lithological discrimination of the Phenaimata felsic–mafic complex, Gujarat, India, using the advanced Spaceborne thermal emission and reflection radiometer (ASTER). Int. J. Remote Sens. 2012, 33, 198–219. [Google Scholar] [CrossRef]
  71. Mehdikhani, B.; Imamalipour, A. ASTER-based remote sensing image analysis for prospection criteria of podiform chromite at the Khoy ophiolite (NW Iran). Minerals 2021, 11, 960. [Google Scholar] [CrossRef]
  72. Loughlin, W.P. Principal component analysis for alteration mapping. Photogramm. Eng. Remote Sens. 1991, 57, 1163–1169. [Google Scholar]
  73. Pour, A.B.; Hashim, M. Identification of hydrothermal alteration minerals for exploring of porphyry copper deposit using ASTER data, SE Iran. J. Asian Earth Sci. 2011, 42, 1309–1323. [Google Scholar] [CrossRef]
  74. Zhang, N.; Zhou, K. Identification of hydrothermal alteration zones of the Baogutu porphyry copper deposits in northwest China using ASTER data. J. Appl. Remote Sens. 2017, 11, 015016. [Google Scholar] [CrossRef]
  75. Kruse, F.A.; Lefkoff, A.B.; Boardman, J.W.; Heidebrecht, K.B.; Shapiro, A.T.; Barloon, P.J.; Goetz, A.F.H. The spectral image processing system (SIPS)—Interactive visualization and analysis of imaging spectrometer data. Remote Sens. Environ. 1993, 44, 145–163. [Google Scholar] [CrossRef]
  76. Falcone, J.A.; Gomez, R. Mapping impervious surface type and sub-pixel abundance using hyperion hyperspectral imagery. Geocarto Int. 2005, 20, 3–10. [Google Scholar] [CrossRef]
  77. Hosseinjani, M.; Tangestani, M.H. Mapping alteration minerals using sub-pixel unmixing of ASTER data in the Sarduiyeh area, SE Kerman, Iran. Int. J. Digit. Earth 2011, 4, 487–504. [Google Scholar] [CrossRef]
  78. Abuzied, S.M.; Ibrahim, S.K.; Kaiser, M.F.; Seleem, T.A. Application of remote sensing and spatial data integrations for mapping porphyry copper zones in Nuweiba area, Egypt. Int. J. Signal Process. Syst. 2016, 4, 102–108. [Google Scholar] [CrossRef]
  79. Magendran, T.; Sanjeevi, S. Hyperion image analysis and linear spectral unmixing to evaluate the grades of iron ores in parts of Noamundi, Eastern India. Int. J. Appl. Earth Obs. Geoinf. 2014, 26, 413–426. [Google Scholar] [CrossRef]
  80. Moradpour, H.; Rostami Paydar, G.; Feizizadeh, B.; Blaschke, T.; Pour, A.B.; Valizadeh Kamran, K.; Hossain, M.S. Fusion of ASTER satellite imagery, geochemical and geology data for gold prospecting in the Astaneh granite intrusive, West Central Iran. Int. J. Image Data Fusion 2021, 13, 71–94. [Google Scholar] [CrossRef]
  81. Nazarpour, A.; Paydar, G.R.; Mehregan, F.; Hejazi, S.J.; Jafari, M.A. Application of geographically weighted regression (GWR) and singularity analysis to identify stream sediment geochemical anomalies, case study, Takab Area, NW Iran. J. Geochem. Explor. 2022, 235, 106953. [Google Scholar] [CrossRef]
  82. Afzal, P.; Mirzaei, M.; Yousefi, M.; Adib, A.; Khalajmasoumi, M.; Zarifi, A.Z.; Foster, P.; Yasrebi, A.B. Delineation of geochemical anomalies based on stream sediment data utilizing fractal modeling and staged factor analysis. J. Afr. Earth Sci. 2016, 119, 139–149. [Google Scholar] [CrossRef]
  83. Reimann, C.; Filzmoser, P. Normal and lognormal data distribution in geochemistry: Death of a myth. Consequences of geochemical and environmental data. Environ. Geol. 2000, 39, 1001–1014. [Google Scholar] [CrossRef]
  84. Carranza, E.J.M. Analysis and mapping of geochemical anomalies using logratio transformed stream sediment data with censored values. J. Geochem. Explor. 2011, 110, 167–185. [Google Scholar] [CrossRef]
  85. Filzmoser, P.; Hron, K.; Reimann, C. Univariate statistical analysis of environmental (compositional) data: Problems and possibilities. Sci. Total Environ. 2009, 407, 6100–6108. [Google Scholar] [CrossRef] [PubMed]
  86. Cheng, Q.; Agterberg, F.P.; Ballantyne, S.B. The separation of geochemical anomalies from background by fractal methods. J. Geochem. Explor. 1994, 51, 109–130. [Google Scholar] [CrossRef]
  87. Filzmoser, P.; Hron, K.; Reimann, C. Principal components analysis for compositional data with outliers. Environmetrics 2009, 20, 621–632. [Google Scholar] [CrossRef]
  88. Kaiser, H.F. The varimax criteria for analytical rotation in factor analysis. Psychometrika 1958, 23, 187–200. [Google Scholar] [CrossRef]
  89. Yousefi, M.; Kamkar-Rouhani, A.; Carranza, E.J.M. Geochemical mineralization probability index (GMPI): A new approach to generate enhanced stream sediment geochemical evidential map for increasing probability of success in mineral potential mapping. J. Geochem. Explor. 2012, 115, 24–35. [Google Scholar] [CrossRef]
  90. Yousefi, M.; Kamkar-Rouhani, A.; Carranza, E.J.M. Application of staged factor analysis and logistic function to create a fuzzy stream sediment geochemical evidence layer for mineral prospectivity mapping. Geochem. Explor. Environ. Anal. 2014, 14, 45–58. [Google Scholar] [CrossRef]
  91. Borojerdnia, A.; Rozbahani, M.M.; Nazarpour, A.; Ghanavati, N.; Payandeh, K. Application of exploratory and Spatial Data Analysis (SDA), singularity matrix analysis, and fractal models to delineate background of potentially toxic elements: A case study of Ahvaz, SW Iran. Sci. Total Environ. 2020, 740, 140103. [Google Scholar] [CrossRef]
  92. Parsa, M.; Maghsoudi, A.; Yousefi, M.; Sadeghi, M. Prospectivity modeling of porphyry-Cu deposits by identification and integration of efficient mono-elemental geochemical signatures. J. Afr. Earth Sci. 2016, 114, 228–241. [Google Scholar] [CrossRef]
  93. Mandelbrot, B.B. The Fractal Geometry of Nature; Freeman: San Francisco, CA, USA, 1983. [Google Scholar]
  94. Cheng, Q.; Xu, Y.; Grunsky, E. Integrated spatial and spectral analysis for geochemical anomaly separation. In Proceedings of the Fifth Annual Conference of the International Association for Mathematical Geology, Trondheim, Norway, 6–11 August 1999; pp. 87–92. [Google Scholar]
  95. Agterberg, F.P. Multifractal modeling of the sizes and grades of giant and supergiant deposits. Int. Geol. Rev. 1995, 37, 1–8. [Google Scholar] [CrossRef]
  96. Li, C.; Ma, T.; Shi, J. Application of a fractal method relating concentrations and distances for separation of geochemical anomalies from background. J. Geochem. Explor. 2003, 77, 167–175. [Google Scholar] [CrossRef]
  97. Agterberg, F.P.; Bonham-Carter, G.F. Measuring the performance of mineral-potential maps. Nat. Resour. Res. 2005, 14, 1–17. [Google Scholar] [CrossRef]
  98. Porwal, A.; Carranza, E.J.M.; Hale, M. A hybrid d fuzzy weights-of-evidence model for mineral potential mapping. Nat. Resour. Res. 2006, 15, 1–14. [Google Scholar] [CrossRef]
  99. Yousefi, M.; Carranza, E.J.M. Prediction–area (P–A) plot and C–A fractal analysis to classify and evaluate evidential maps for mineral prospectivity modeling. Comput. Geosci. 2015, 79, 69–81. [Google Scholar] [CrossRef]
  100. Mihalasky, M.J.; Bonham-Carter, G.F. Lithodiversity and its spatial association with metallic mineral sites, Great Basin of Nevada. Nat. Resour. Res. 2001, 10, 209–226. [Google Scholar] [CrossRef]
  101. Baranov, V. A new method for interpretation of aeromagnetic maps: Pseudo-gravimetric anomalies. Geophysics 1957, 22, 359–383. [Google Scholar] [CrossRef]
  102. Demissie, Z.; Mickus, K.; Bridges, D.; Abdelsalam, M.G.; Atekwana, E. Upper lithospheric structure of the Dobi graben, Afar Depression from magnetics and gravity data. J. Afr. Earth Sci. 2018, 147, 136–151. [Google Scholar] [CrossRef]
  103. Salem, A.; Williams, S.; Fairhead, J.D.; Ravat, D.; Smith, R. Tilt-depth method: A simple depth estimation method using first-order magnetic derivatives. Lead. Edge 2007, 26, 1502–1505. [Google Scholar] [CrossRef]
  104. Thompson, D.T. EULDPH: A new technique for making computer-assisted depth estimates from magnetic data. Geophysics 1982, 47, 31–37. [Google Scholar] [CrossRef]
  105. Reid, A.B.; Allsop, J.M.; Granser, H.; Millett, A.J.; Somerton, I.W. Magnetic interpretation in three dimensions using Euler deconvolution. Geophysics 1990, 55, 80–90. [Google Scholar] [CrossRef]
  106. Siljestrom, P.; Moreno, A.; Vikgren, K.; Cáceres Puro, L. The application of selective principal components analysis (SPCA) to a Thematic Mapper (TM) image for the recognition of geomorphologic configuration. Int. J. Remote Sens. 1997, 18, 3843–3852. [Google Scholar] [CrossRef]
  107. Abdelsalam, M.G.; Stern, R.J.; Berhane, W.G. Mapping gossan in arid regions with Landsat TM and SIR-C images, the Beddaho Alteration Zone in northern Eritrea. J. Afr. Earth Sci. 2000, 30, 903–916. [Google Scholar] [CrossRef]
  108. Rowan, L.C.; Robert, G.S.; John, C. Distribution of hydrothermally altered rocks in the Peko Diq, Pakistan mineralized area based on spectral analysis of ASTER data. Remote Sens. Environ. 2006, 104, 74–87. [Google Scholar] [CrossRef]
  109. Noori, L.; Pour, A.; Askari, G.; Taghipour, N.; Pradhan, B.; Lee, C.W.; Honarmand, M. Comparison of different algorithms to map hydrothermal alteration zones using ASTER remote sensing data for polymetallic vein-type ore exploration: Toroud–Chahshirin Magmatic Belt (TCMB), North Iran. Remote Sens. 2019, 11, 495. [Google Scholar] [CrossRef]
  110. Rajendran, S.; Nasir, S.; Kusky, T.M.; Ghulam, A.; Gabr, S.; El-Ghali, M.A. Detection of hydrothermal mineralized zones associated with listwaenites in Central Oman using ASTER data. Ore Geol. Rev. 2013, 53, 470–488. [Google Scholar] [CrossRef]
  111. Rajendran, S.; Nasir, S. Hydrothermal altered serpentinized zone and a study of Ni-magnesioferrite–magnetite–awaruite occurrences in Wadi Hibi, Northern Oman Mountain: Discrimination through ASTER mapping. Ore Geol. Rev. 2014, 62, 211–226. [Google Scholar] [CrossRef]
  112. Rajendran, S.; Nasir, S. Mapping of high pressure metamorphics in the As Sifah region, NE Oman using ASTER data. Adv. Space Res. 2015, 55, 1134–1157. [Google Scholar] [CrossRef]
  113. Guha, A.; Vinod Kumar, K. Comparative analysis on utilisation of linear spectral unmixing and band ratio methods for processing ASTER data to delineate bauxite over a part of Chotonagpur plateau, Jharkhand, India. Geocarto Int. 2016, 31, 367–384. [Google Scholar] [CrossRef]
  114. Helvoort, P.J.; Filzmoser, P.; Gaans, P.F.M. Sequential Factor Analysis as a new approach to multivariate analysis of heterogeneous geochemical datasets: An application to a bulk chemical characterization of fluvial deposits (Rhine–Meuse delta, The Netherlands). Appl. Geochem. 2005, 20, 2233–2251. [Google Scholar] [CrossRef]
  115. Ghezelbash, R.; Maghsoudi, A.; Carranza, E.J.M. An improved data-driven multiple criteria decision making procedure for spatial modeling of mineral prospectivity: Adaption of prediction–area plot and logistic functions. Nat. Resour. Res. 2019, 28, 1299–1316. [Google Scholar] [CrossRef]
  116. Salem, A.; Williams, S.; Fairhead, D.; Smith, R.; Ravat, D. Interpretation of magnetic data using tilt-angle derivatives. Geophysics 2008, 73, L1–L10. [Google Scholar] [CrossRef]
  117. Pham, L.T.; Eldosouky, A.M.; Abdelrahman, K.; Fnais, M.S.; Gomez-Ortiz, D.; Khedr, F. Application of the improved parabola-based method in delineating lineaments of subsurface structures: A case study. J. King Saud Univ. Sci. 2021, 33, 101585. [Google Scholar] [CrossRef]
  118. Pham, L.T.; Oksum, E.; Vu, M.D.; Vo, Q.T.; Du Le-Viet, K.; Eldosouky, A.M. An improved approach for detecting ridge locations to interpret the potential field data for more accurate structural mapping: A case study from Vredefort dome area (South Africa). J. Afr. Earth Sci. 2021, 175, 104099. [Google Scholar] [CrossRef]
  119. Austin, J.R.; Blenkinsop, T.G. The Cloncurry Lineament: Geophysical and geological evidence for a deep crustal structure in the Eastern Succession of the Mount Isa Inlier. Precambrian Res. 2008, 163, 50–68. [Google Scholar] [CrossRef]
  120. Austin, J.R.; Blenkinsop, T.G. Local to regional scale structural controls on mineralisation and the importance of a major lineament in the eastern Mount Isa Inlier, Australia: Review and analysis with autocorrelation and weights of evidence. Ore Geol. Rev. 2009, 35, 298–316. [Google Scholar] [CrossRef]
  121. Henson, P.A.; Blewett, R.S.; Roy, I.G.; Miller, J.M.; Czarnota, K. 4D architecture and tectonic evolution of the Laverton region, eastern Yilgarn Craton, Western Australia. Precambrian Res. 2010, 183, 338–355. [Google Scholar] [CrossRef]
  122. Pour, A.B.; Hashim, M. Identifying areas of high economic-potential copper mineralization using ASTER data in the Urumieh–Dokhtar Volcanic Belt, Iran. Adv. Space Res. 2012, 49, 753–769. [Google Scholar] [CrossRef]
  123. Mathieu, L. Quantifying hydrothermal alteration: A review of methods. Geosciences 2018, 8, 245. [Google Scholar] [CrossRef]
  124. Vaziri, A.; Nazarpour, A.; Ghanavati, N.; Babainejad, T.; Watts, M.J. An integrated approach for spatial distribution of potentially toxic elements (Cu, Pb and Zn) in topsoil. Sci. Rep. 2021, 11, 7806. [Google Scholar] [CrossRef] [PubMed]
  125. Golabkesh, F.; Ghanavati, N.; Nazarpour, A.; Nejad, T.B. Monitoring Soil Salinity Changes, Comparison of Different Maps and Indices Extracted from Landsat Satellite Images (Case Study: Atabieh, Khuzestan). Pol. J. Environ. Stud. 2021, 30, 1139–1154. [Google Scholar] [CrossRef] [PubMed]
  126. Yan, Y.; Shi, H.; Miao, Q.; Zhao, Y.; Nie, X.; Li, Z.; Pan, M.; Feng, W.; Gonçalves, J.M.; Duarte, I.M. Evolution of chemical characteristics and irrigation suitability of groundwater in arid and semi-arid regions. Agric. Water Manag. 2025, 311, 109361. [Google Scholar] [CrossRef]
  127. Li, C.; Dong, P.; Yan, J.; Gong, R.; Meng, Q.; Yao, J.; Xie, R. Analytical study on heavy metal output fluxes and source apportionment of a non-ferrous smelter in southwest China. Environ. Pollut. 2023, 331, 121867. [Google Scholar] [CrossRef] [PubMed]
  128. Essarraj, S.; Boiron, M.C.; Cathelineau, M.; Banks, D.A.; El Boukhari, A.; Chouhaidi, M.Y. Brines related to Ag deposition in the Zgounder silver deposit (Anti-Atlas, Morocco). Eur. J. Mineral. 1998, 10, 1201–1214. [Google Scholar]
  129. Morgan, L.A. Geophysical Characteristics of Volcanogenic Massive Sulfide Deposits; Report 2010–5070–C; U.S. Geological Survey Scientific Investigations: Reston, VA, USA, 2012; 16p.
Figure 2. Diagram of the applied methodology.
Earth 06 00113 g002
Figure 3. Selective principal components showing the hydrothermal alterations in the Assif n’Iriri Basin. (a). Argillic alteration. (b). Phyllic alteration. (c). Propylitic alteration.
Earth 06 00113 g003
Figure 4. (a). Spectral Angle Mapper (SAM). (b). Linear Spectral Unmixing (LSU). (c). Matched Filter (MF).
Earth 06 00113 g004
Figure 5. (a). Factor score (FS) distribution of F1 (Cu-As-Sb-Ba-Pb-Hg). (b). Factor score (FS) distribution of F2 (Zn-Mo-Bi). (c). GMPI distribution of (Cu-As-Sb-Ba-Pb-Hg). (d). GMPI distribution of (Zn-Mo-Bi).
Earth 06 00113 g005
Figure 6. (a). Concentration–area fractal model (C–A) of GMPI (Cu-As-Sb-Ba-Pb-Hg). (b). Concentration–area fractal model (C–A) of GMPI (Zn-Mo-Bi). (c). Classification maps of GMPI (Cu-As-Sb-Ba-Pb-Hg). (d). Classification maps of GMPI (Zn-Mo-Bi). (e). Prediction–area (P–A) plot of GMPI (Cu-As-Sb-Ba-Pb-Hg). (f). Prediction–area (P–A) plot of GMPI (Zn-Mo-Bi).
Earth 06 00113 g006
Figure 7. (a). Residual magnetic field (RMF) map. (b). Reduction to the pole (RTP) map. (c). The tilt angle of the RTP. (d). Euler deconvolution depths using a structural index of 1 superimposed the TDR angle-derived lineaments.
Earth 06 00113 g007
Figure 8. Validation of NE–SW aeromagnetic lineaments by field mapping: sinuous fault corridor with conjugate shear bands.
Earth 06 00113 g008
Figure 9. Geogenic enrichment map of the Assif n’Iriri basin: (a) distribution of alterations and geochemical anomalies; (b) network of geological and geophysical faults.
Earth 06 00113 g009
Figure 10. (ad) Quartz-sericite alteration near mineral deposits and its association with mineralized hydrothermal veins.
Earth 06 00113 g010
Figure 11. Fault-controlled Mn mineralization: Adit along an N75°-striking structure with crosscutting Mn-bearing veins.
Earth 06 00113 g011
Figure 12. Origin of the Cu–Pb geochemical anomalies: NE–SW hydrothermal quartz-vein system with Cu sulfides/oxides and galena-banded quartz fractures.
Earth 06 00113 g012
Table 1. Eigenvector statistics of SPCA. a. Argillic alteration. b. Phyllic alteration. c. Propylitic alteration.
aSPC1SPC2SPC3
Band 4−0.13655−0.12307−0.06399
Band 50.58030−0.070950.01265
Band 6−0.416200.70393−0.04989
bSPC1SPC2SPC3
Band 4−0.13655−0.063990.94242
Band 6−0.41620−0.049890.04350
Band 70.380820.026320.09839
cSPC1SPC2SPC3
Band 70.098390.00657−0.00194
Band 80.192680.025410.00147
Band 90.077200.013860.00256
Table 2. Statistical parameters of trace element concentrations in alluvial soils.
CuBaAsHgSbMoPbBiZn
Min000600000
Max143.652,630652.837337.944.924,600126.61451
Average38.093222339.16670.3313643.033337.37383313.92167523.91556.157167411.6483
Median29.1532.74618.52.3510.133.753.17190.95
Table 3. Matrix of the rotated components from the first stage of the factor analysis (bold loadings represent factors selected based on the threshold of 0.6).
ElementsF1F2F3
Cu0.7600.152−0.202
Zn−0.1180.8870.049
As0.919−0.1770.070
Mo0.0680.9120.011
Sb0.665−0.2350.632
Ba0.7420.066−0.536
Pb0.8210.245−0.033
Bi0.1040.8260.235
Hg0.728−0.1210.103
Eigenvalues3.6502.4900.802
Variance (%)40.55127.6708.916
Cumulative variance (%)40.55168.22177.138
Table 4. Geochemical association and their corresponding prediction rate (Pr), occupied area (Oa), normalized density (Nd), and weight (We).
ModelPrediction Rate (Pr) (%)Occupied Area (Oa) (%)Normalized Density (Nd)Weight (We)
GMPI (Cu-As-Sb-Ba-Pb-Hg)59411.440.36
GMPI (Zn-Mo-Bi)53471.130.12
Disclaimer/Publisher’s Note: The statements, opinions and data contained in all publications are solely those of the individual author(s) and contributor(s) and not of MDPI and/or the editor(s). MDPI and/or the editor(s) disclaim responsibility for any injury to people or property resulting from any ideas, methods, instructions or products referred to in the content.