3.2.2. Individual WSUD Performance
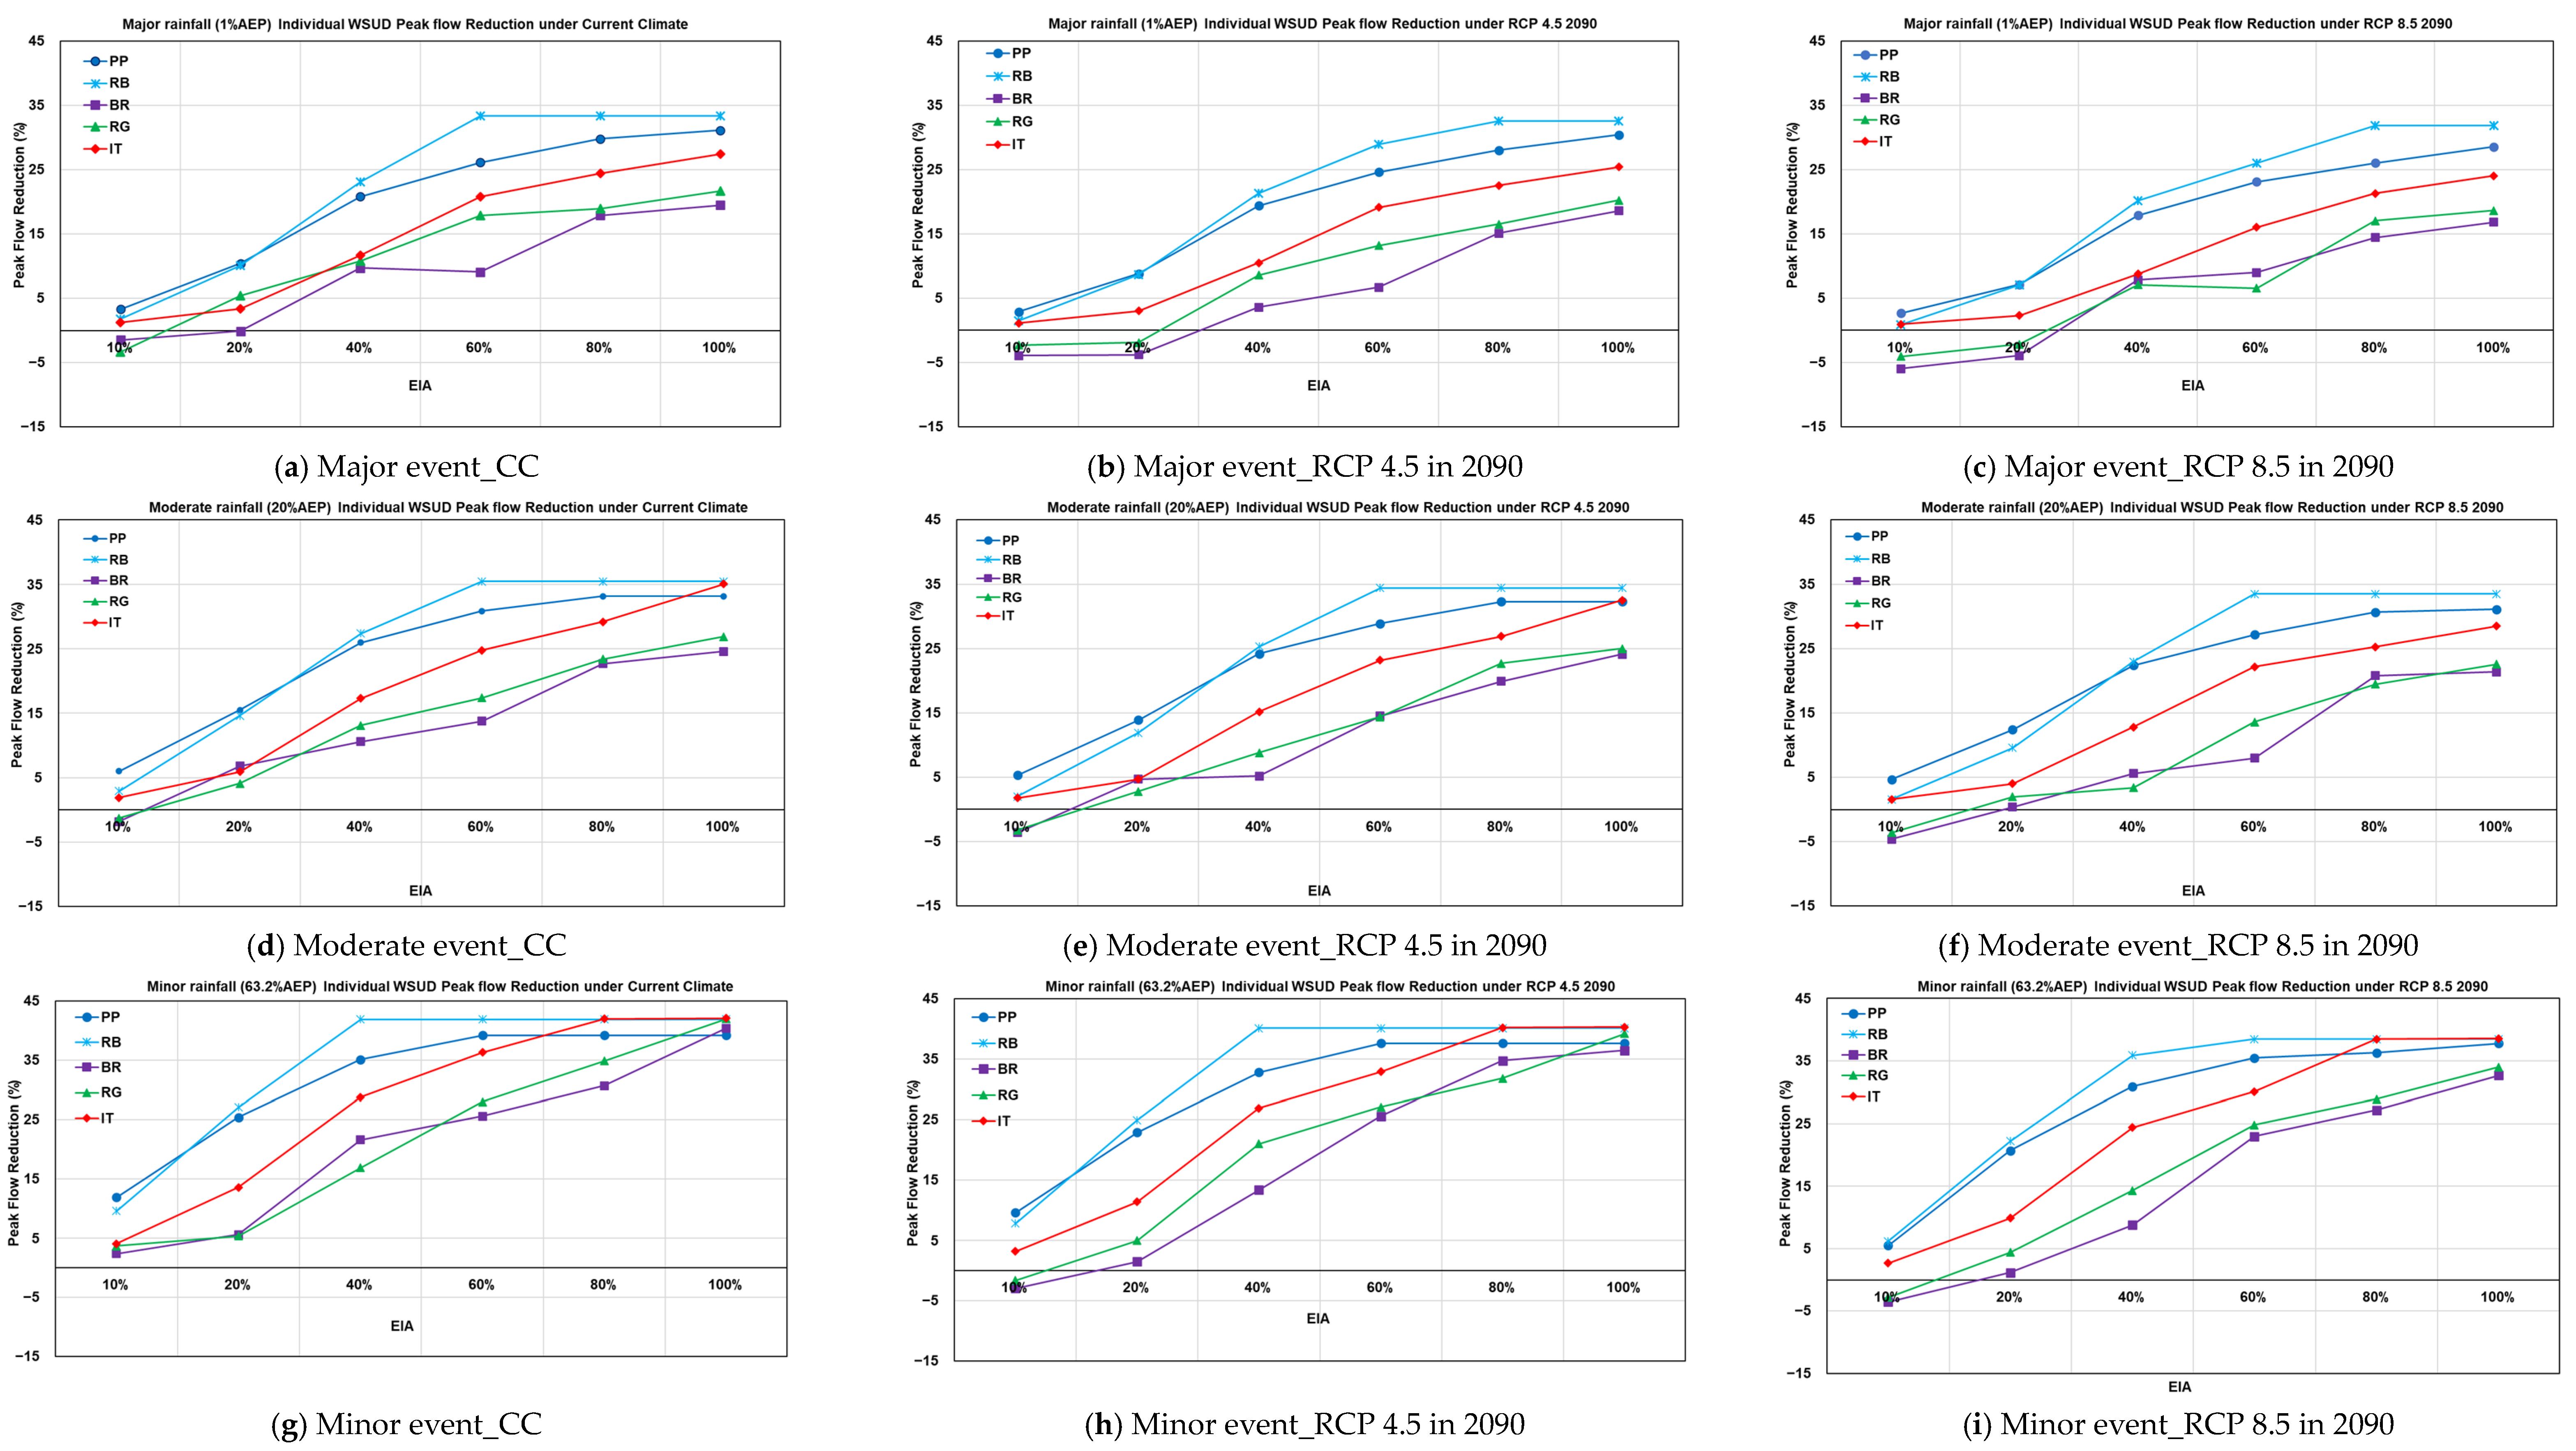
The peak flow and total runoff volume reduction achieved by individual WSUD systems under different climate scenarios are presented in
Figure 4 and
Figure 5 (average results in
Appendix A,
Table A3). Rain barrel was the best-performing WSUD system, demonstrating peak flow and total runoff volume reductions ranging from 1% to 42% and 7% to 46%, respectively. On the other hand, bio-retention was the worst-performing system, with peak flow and total runoff volume reductions ranging from −6.0% to 40% and 1% to 42%, respectively. Overall, the individual WSUD systems’ peak flow and total runoff volume reductions follow an ascending order of bio-retention < rain garden < infiltration trench < porous pavement < rain barrel.
A comparative analysis of the best- and worst-performing WSUD efficiencies under rainfall events reveals that the percentage reduction in peak flow ranges from 1% to 21% under climate change (CC) and from 6% to 27% for the RCP 8.5 in 2090. At the same time, the efficiency difference between the best and worst WSUDs under climate change scenarios ranges from 1% to 7% and 0% to 4% during major rainfall events under CC and RCP 8.5 in 2090, respectively. Similarly, total runoff volume reduction performance shows a small degree of variation. During minor rainfall, total runoff volume reduction ranges from 11% to 15% and 2% to 18% for rain barrel and bio-retention, respectively, for RPC 8.5 in 2090. On the other hand, under RCP 8.5 in 2090, total runoff volume reduction differences between rain barrels and bio-retention range from 1.5% to 3.9% during major rainfall, with bio-retention intermittently showing a negative performance (−2.6%). The sensitivity of individual WSUD peak flow reduction efficiency is notably high compared to total runoff volume, remarkably during rainfall events.
The wide range of WSUD performance variation under rainfall design events was due to significant alteration in rainfall depth, i.e., by 29% and 48% during major rainfall relative to minor rainfall events. However, the rainfall depth variation compared to the climate scenario between CC and RCP 8.5 in 2090 was only about 14%. The rainfall variation between minor and major design events under the current climate was almost 2 to 3 times higher than in the climate scenarios. The performance of WSUD systems showed a nominal decline in efficiency of flood mitigation when comparing current and future climate scenarios. The selection of the rainfall design event is a critical factor, followed by climate change factors, in determining the performance of WSUD flood mitigation [
52].
The minimum effective impervious area reduction required to achieve a positive peak flow reduction under CC was a 10% reduction in effective impervious area during minor rainfall. Under CC, an effective impervious area reduction of 10% or less after intervention by WSUD resulted in a negative peak flow reduction, implying an increase in peak flow. In addition, under RCP 8.5 in 2090, an effective impervious area reduction of <20% yielded a negative result. In comparison, for RCP 8.5 in 2090, WSUD, such as bio-retention and RG, resulted in higher negative results than the CC scenario. The study also found that the increasingly negative values become more noticeable during peak flow reduction, resulting from the lower WSUD coverage of a 20% effective impervious area, particularly during moderate or minor rainfall events, in addition to major events.
In contrast, with the maximum effective impervious area reduction, the peak flow efficiency remains almost constant after a 60% effective impervious area under current climate conditions. However, the WSUD peak flow reduction, particularly effective impervious area reduction under RCP 8.5 in 2090, requires an 80% effective impervious area reduction to achieve maximum efficiency. The results suggest that the impact of climate change necessitates an increase in effective impervious area reduction in proportion to the effect during minor, moderate, and major events. However, a 40% to 60% effective impervious area reduction with WSUD application appears to be the optimal peak flow reduction for all WSUD types under current and future climate change scenarios.
Examining the trend of peak flow and total runoff volume reduction efficiency, the WSUD peak flow reduction exhibits a non-linear relationship with the decrease in effective impervious area, influenced by the climate change impact on rainfall events. Climate change scenarios are projected to increase rainfall intensity, implying an increase in complexity and potential uncertainty in their performance. The relationship of WSUD performance was governed by effective impervious area reduction versus peak flow and total runoff volume reduction, exhibiting a linear trend until a 60% effective impervious area under CC, after which the results remain constant even with an effective impervious area increment to a 100% effective impervious area. However, under RCP 8.5 in 2090 climate change scenarios, WSUD showed a linear relationship with efficiency until an 80% reduction in impervious area was achieved, after which it remained constant or exhibited a nominal increment towards a 100% effective impervious area.
With an increase in rainfall extremeness, driven by climate change, a large area of the total catchment needs to be managed by the WSUD system to achieve a positive contribution to reducing the flooding condition. However, it is not always possible to reduce the entire effective impervious area due to economic and technical limitations. Therefore, to achieve the optimal positive results of flood reduction, in general, the relationship between WSUD efficiency and effective impervious area reduction exhibited a varying non-linear trend, depending on the rainfall design events; this trend becomes more pronounced with the impact of climate change, raising further concerns about WSUD performance under future climate change scenarios.
3.2.3. Mixed WSUD Performance
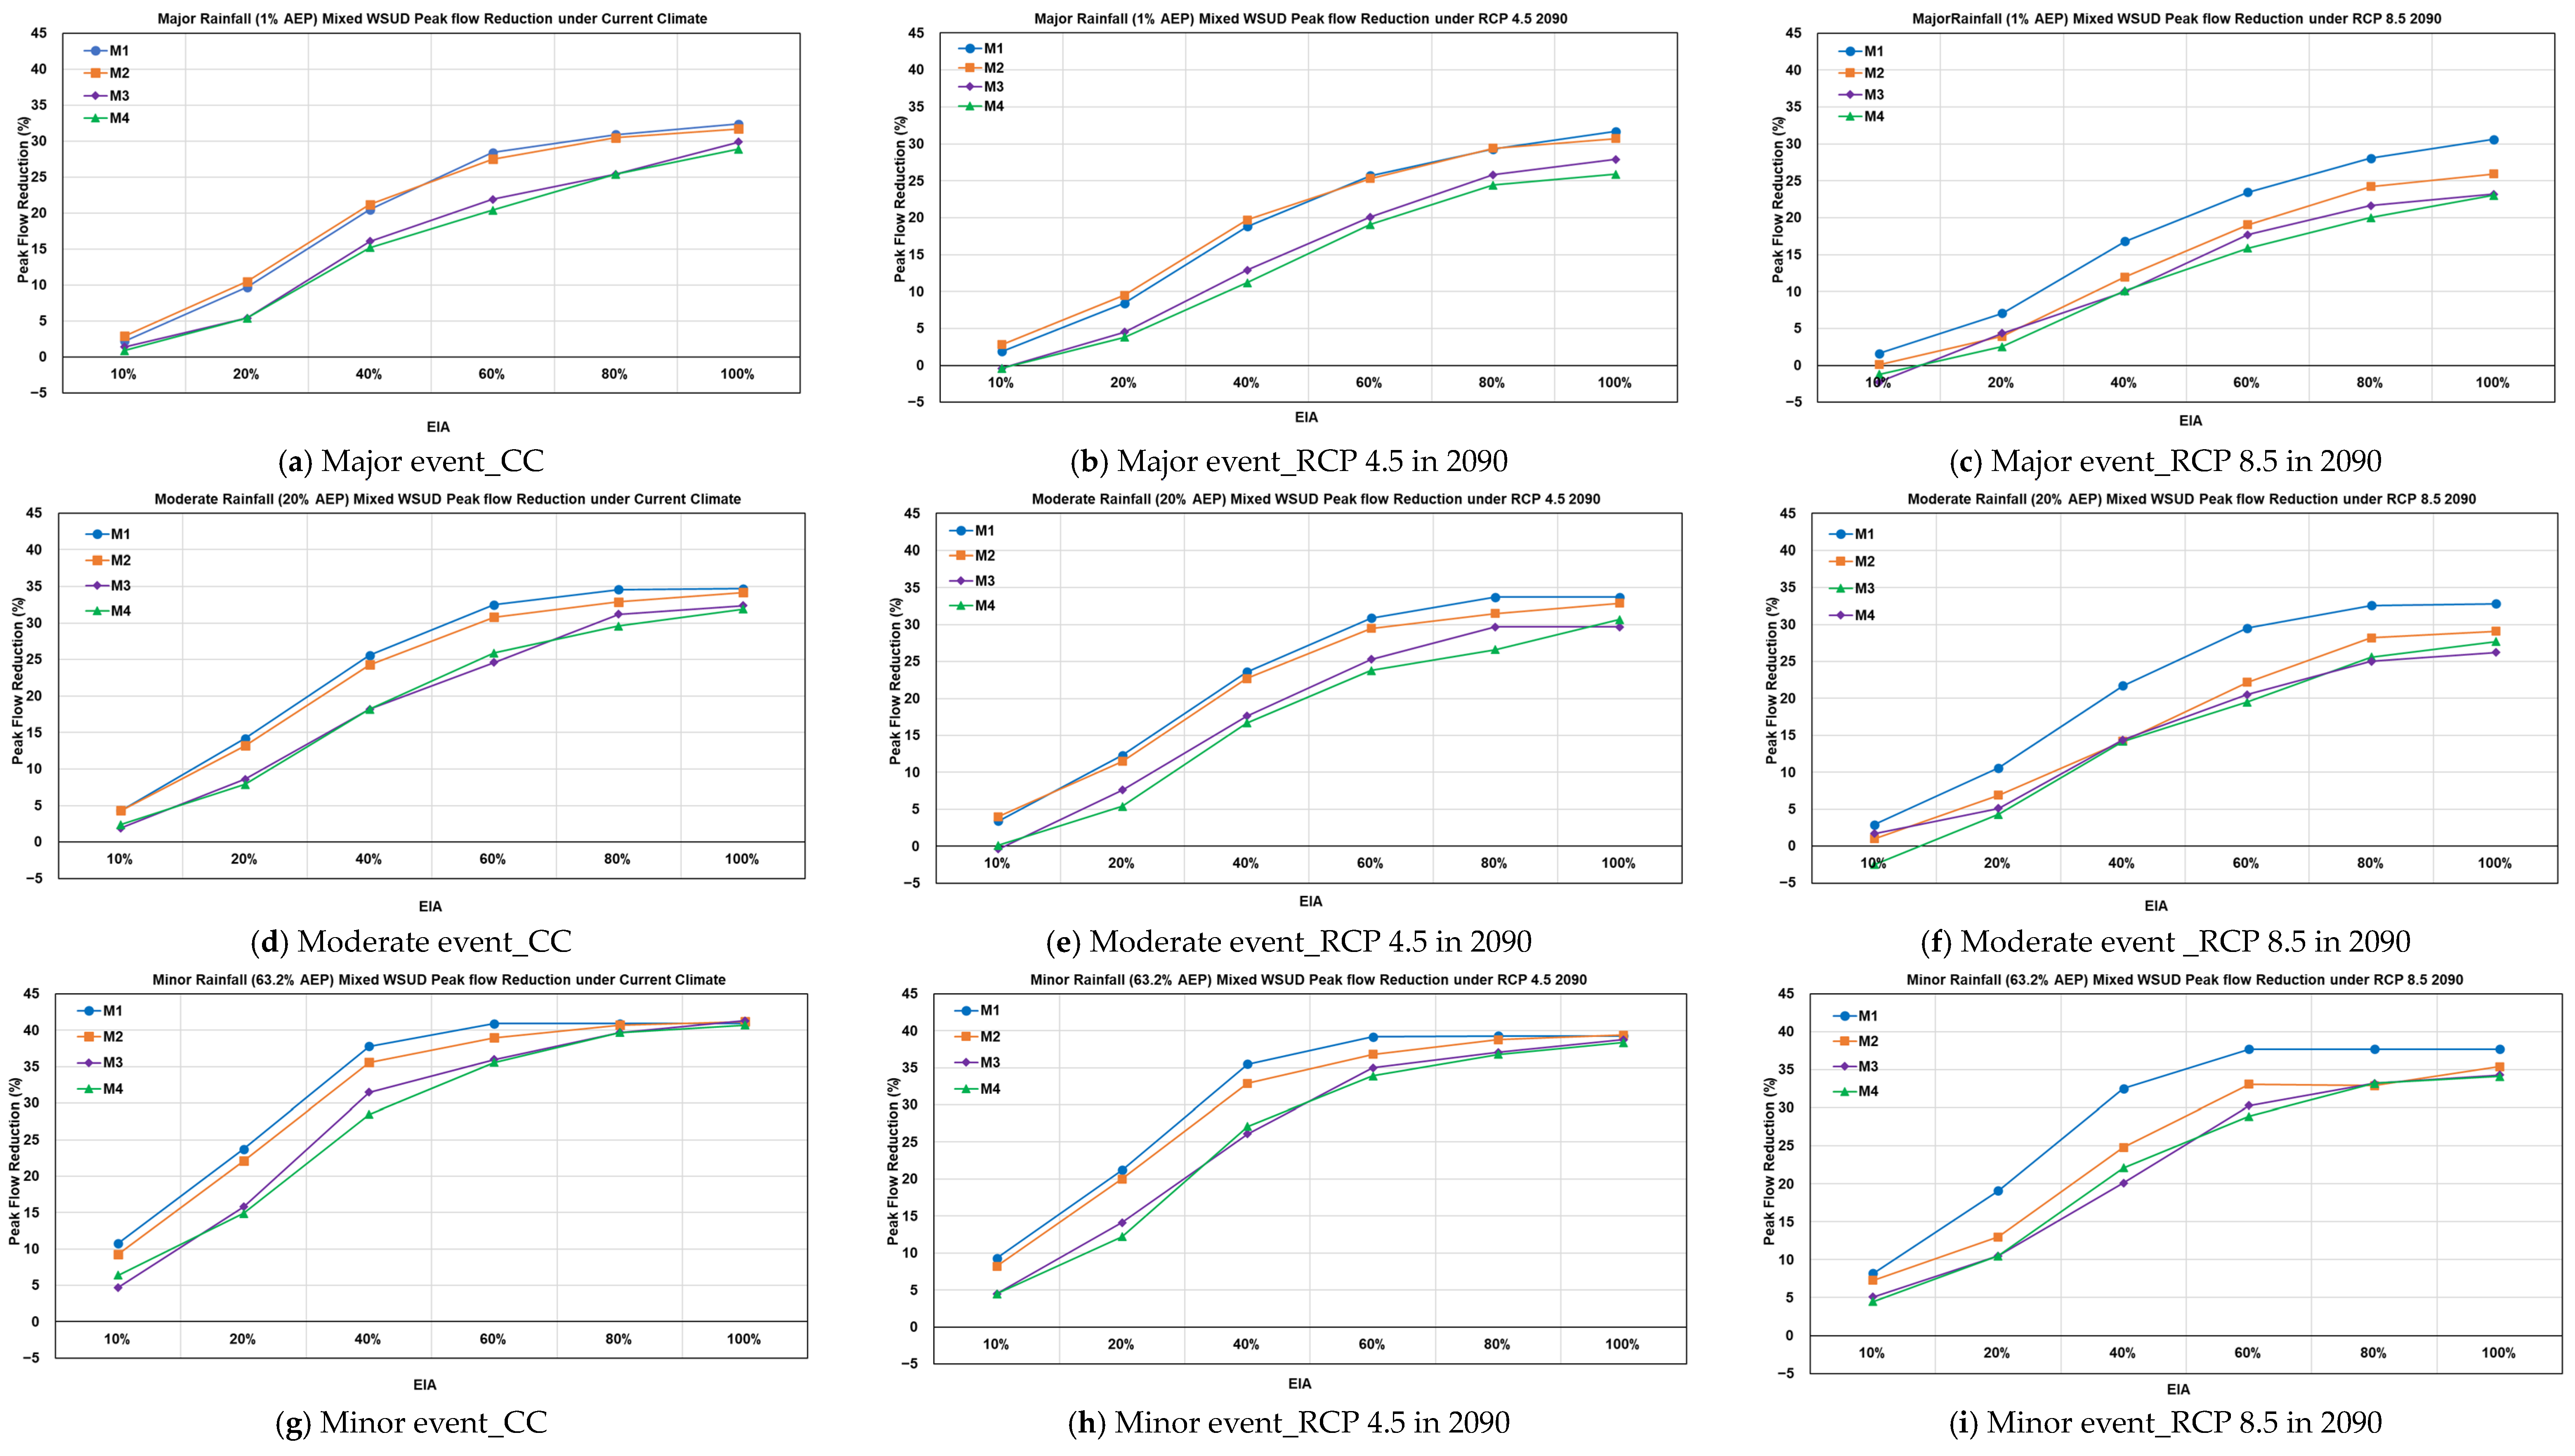
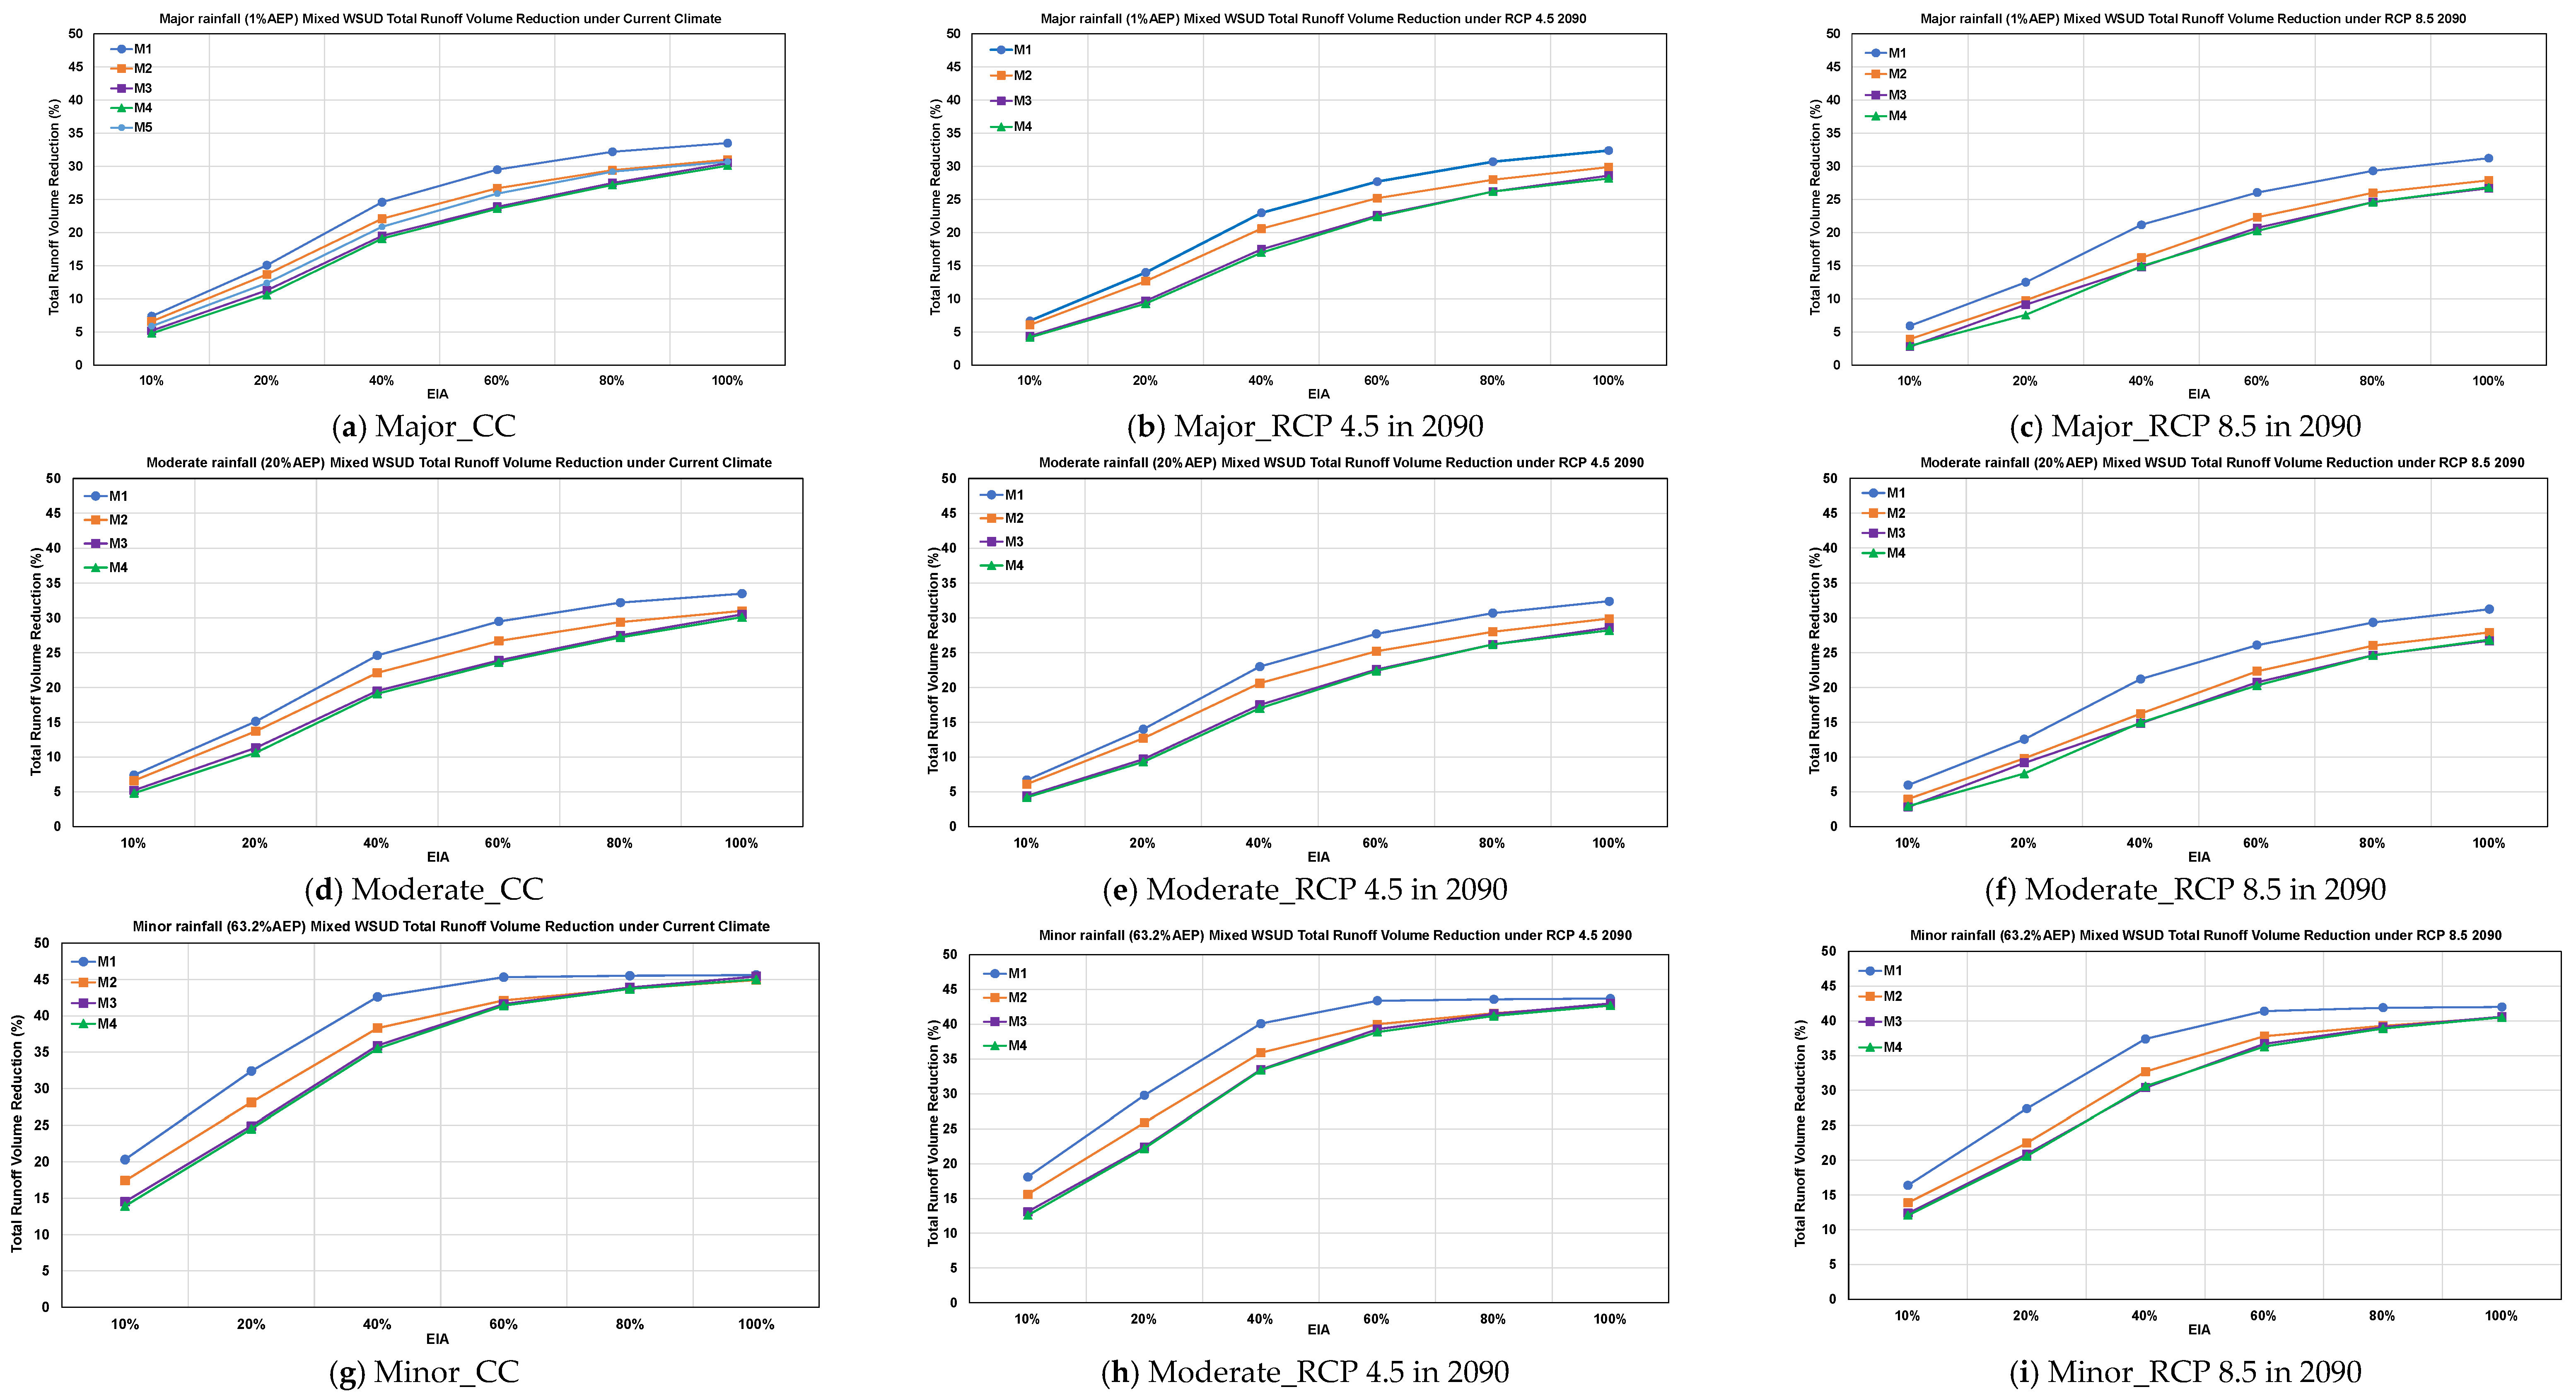
The application of a mixed WSUD approach assumes that different individual methods can be combined to enhance the flood mitigation capacity. The mixed WSUD peak flow and total runoff volume reduction is presented in
Figure 6 and
Figure 7. The graphs indicate that M1 (which is porous pavement + rain barrel) and M4 (which is porous pavement + rain barrel + bio-retention + rain garden + infiltration trench) are the most and least effective mixed WSUDs for peak flow and total runoff volume reduction, respectively. Mixed WSUDs can be ranked in ascending order: M1 > M2 > M3 > M4, for all rainfall and climate scenarios. The individual performance of WSUD in this catchment controlled the overall ranking of the WSUD options.
Earlier studies have reported that combining different WSUDs helps improve peak flow reduction [
18,
21,
53,
54,
55]. The combination of individual systems influences the functions of both retention and infiltration-based systems, thereby enhancing overall efficiency. The low infiltration capacity of the soil in this catchment limited the effectiveness of the infiltration-based systems, and the combination of retention and infiltration-based systems contributed to reducing the negative results with small effective impervious area reductions.
Furthermore, combining different WSUD systems significantly reduced the inconsistency in results compared to those of individual WSUD systems under climate change scenarios. The negative peak flow value, with the minimum effective impervious area reduction, observed positive results or improvements in efficiency. For illustration, the discrepancy in peak flow between the best- and worst-performing WSUDs during major rainfall under RCP 8.5 in 2090 is 15%, with a 100% effective impervious area for an individual WSUD component. It reduced the discrepancy of individual WSUD components in peak flow by 7.6%. A 50% improvement in alignment between options was observed with the combination of different WSUD systems. The inconsistency in efficiency was reduced after combining the WSUD system under a broader range of uncertain scenarios, improving the reliability of WSUD performance under uncertain conditions.
3.2.4. WSUD Flood Mitigations
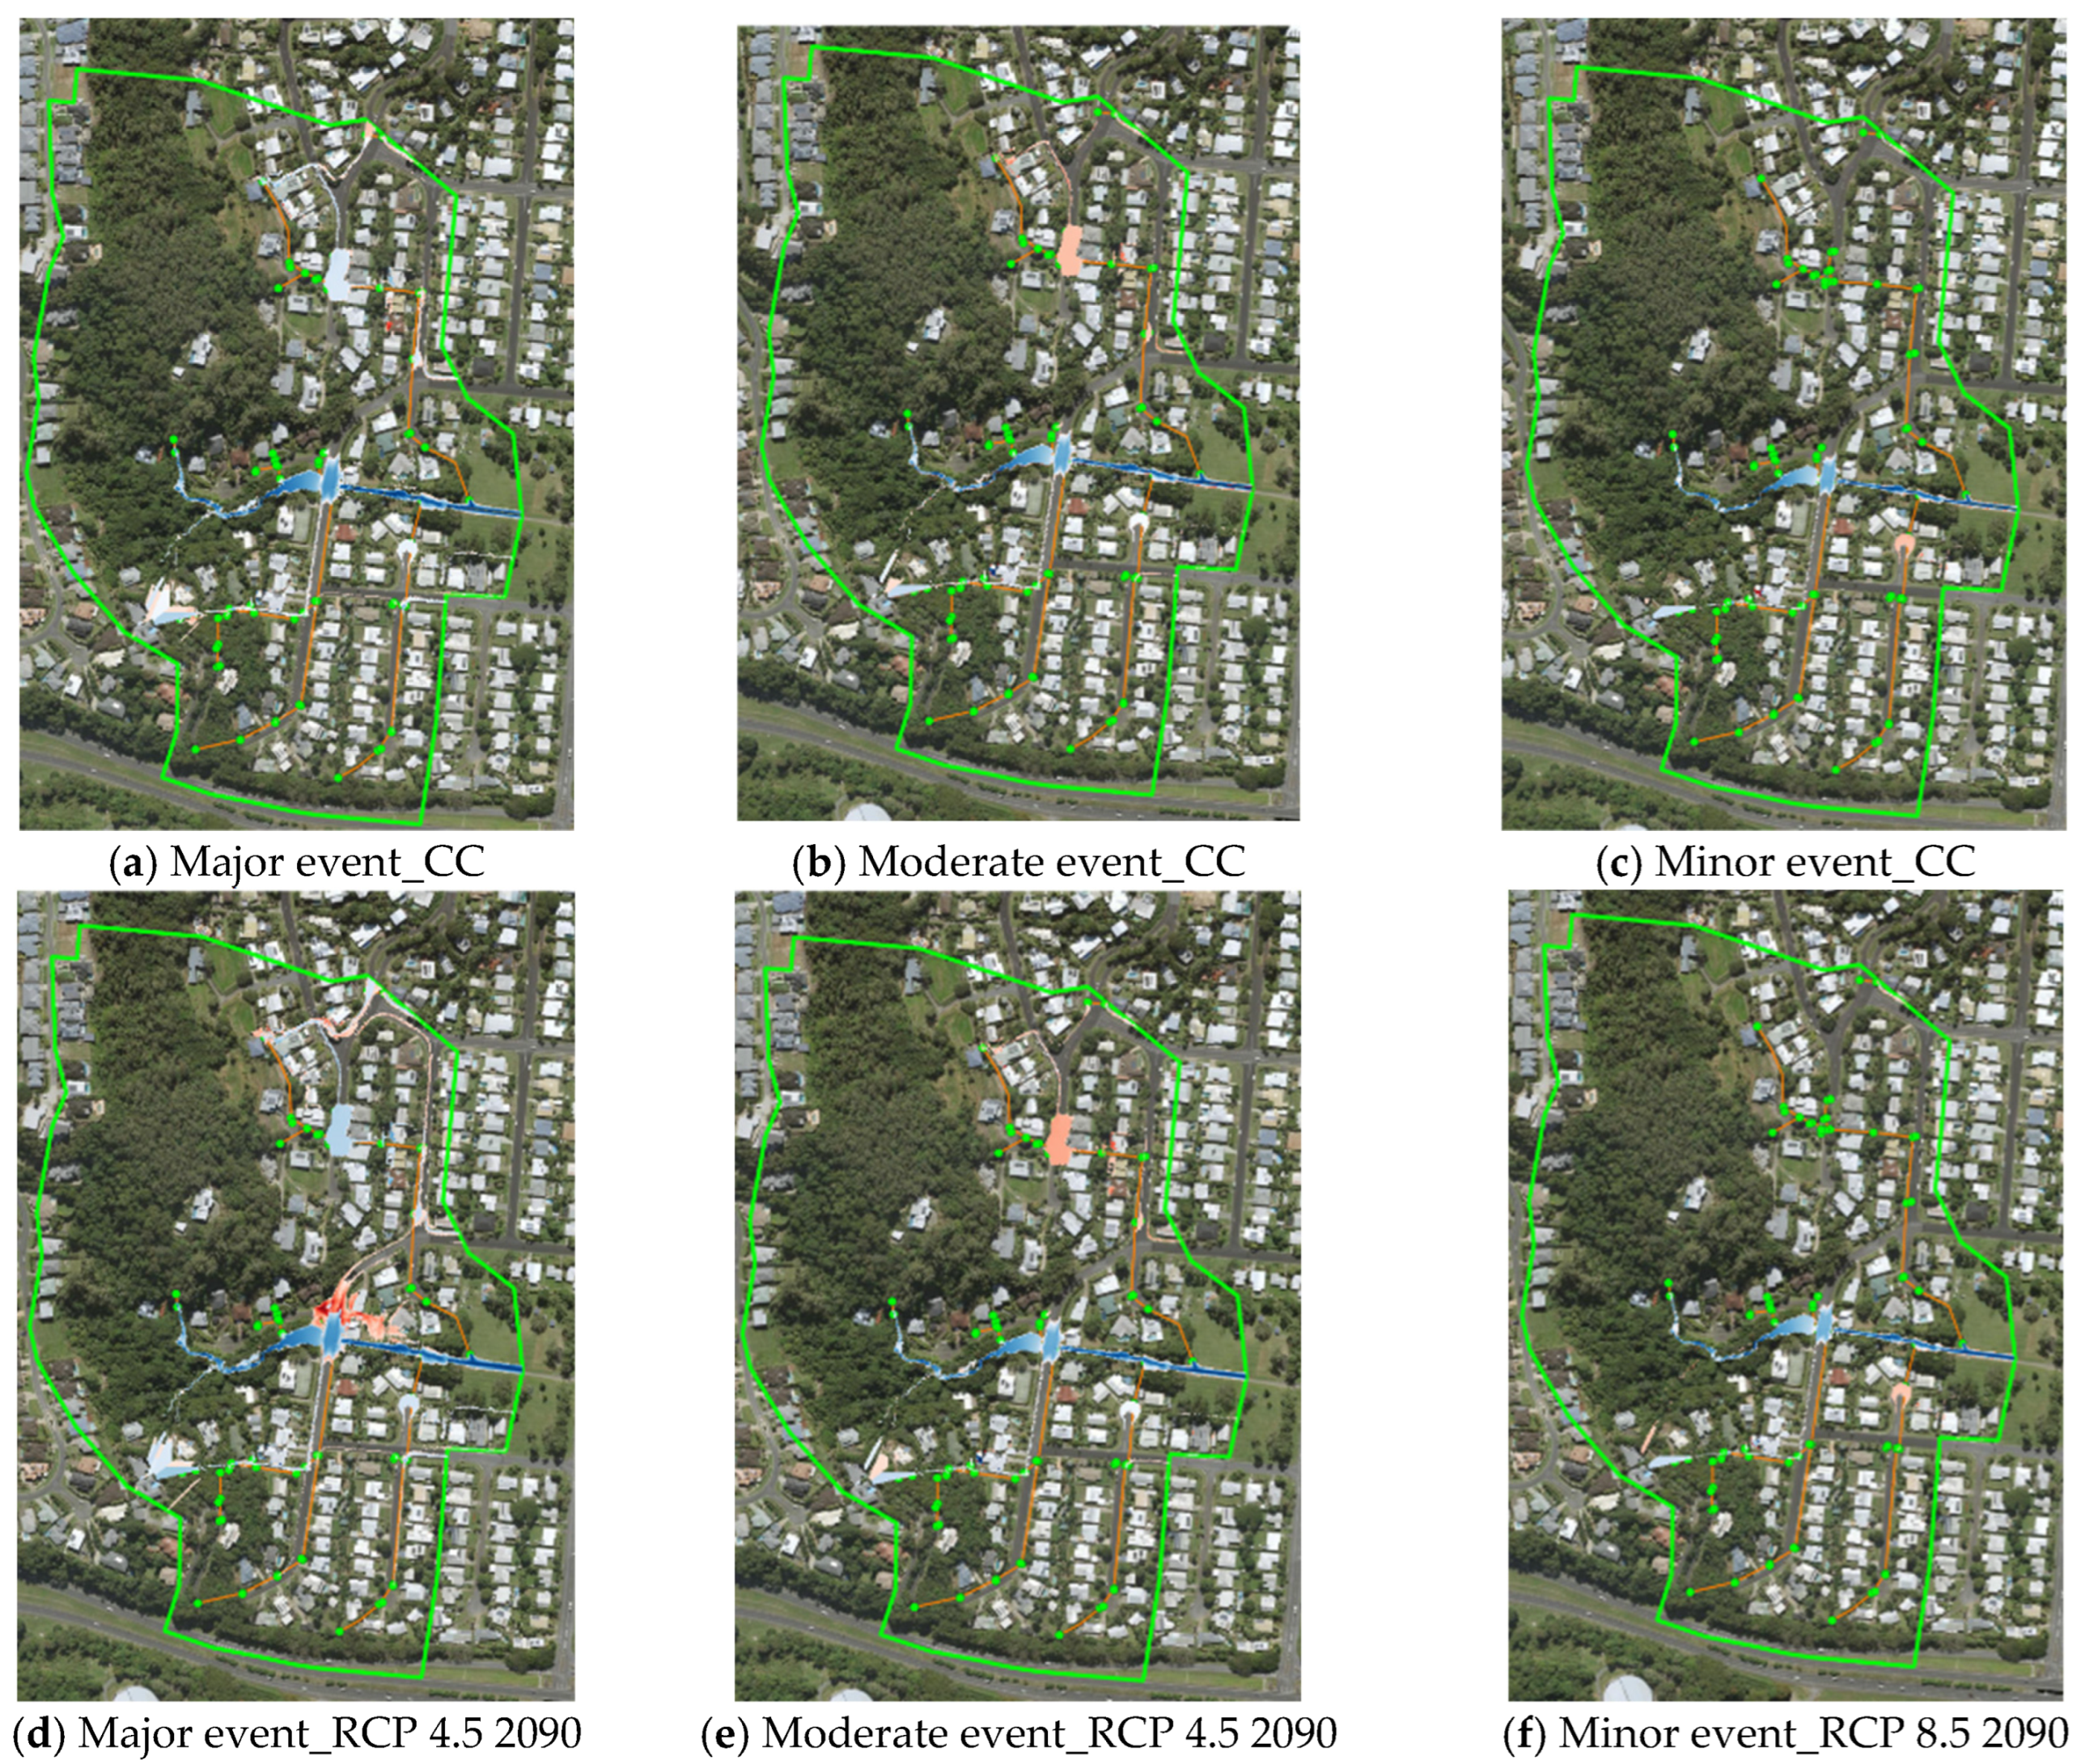
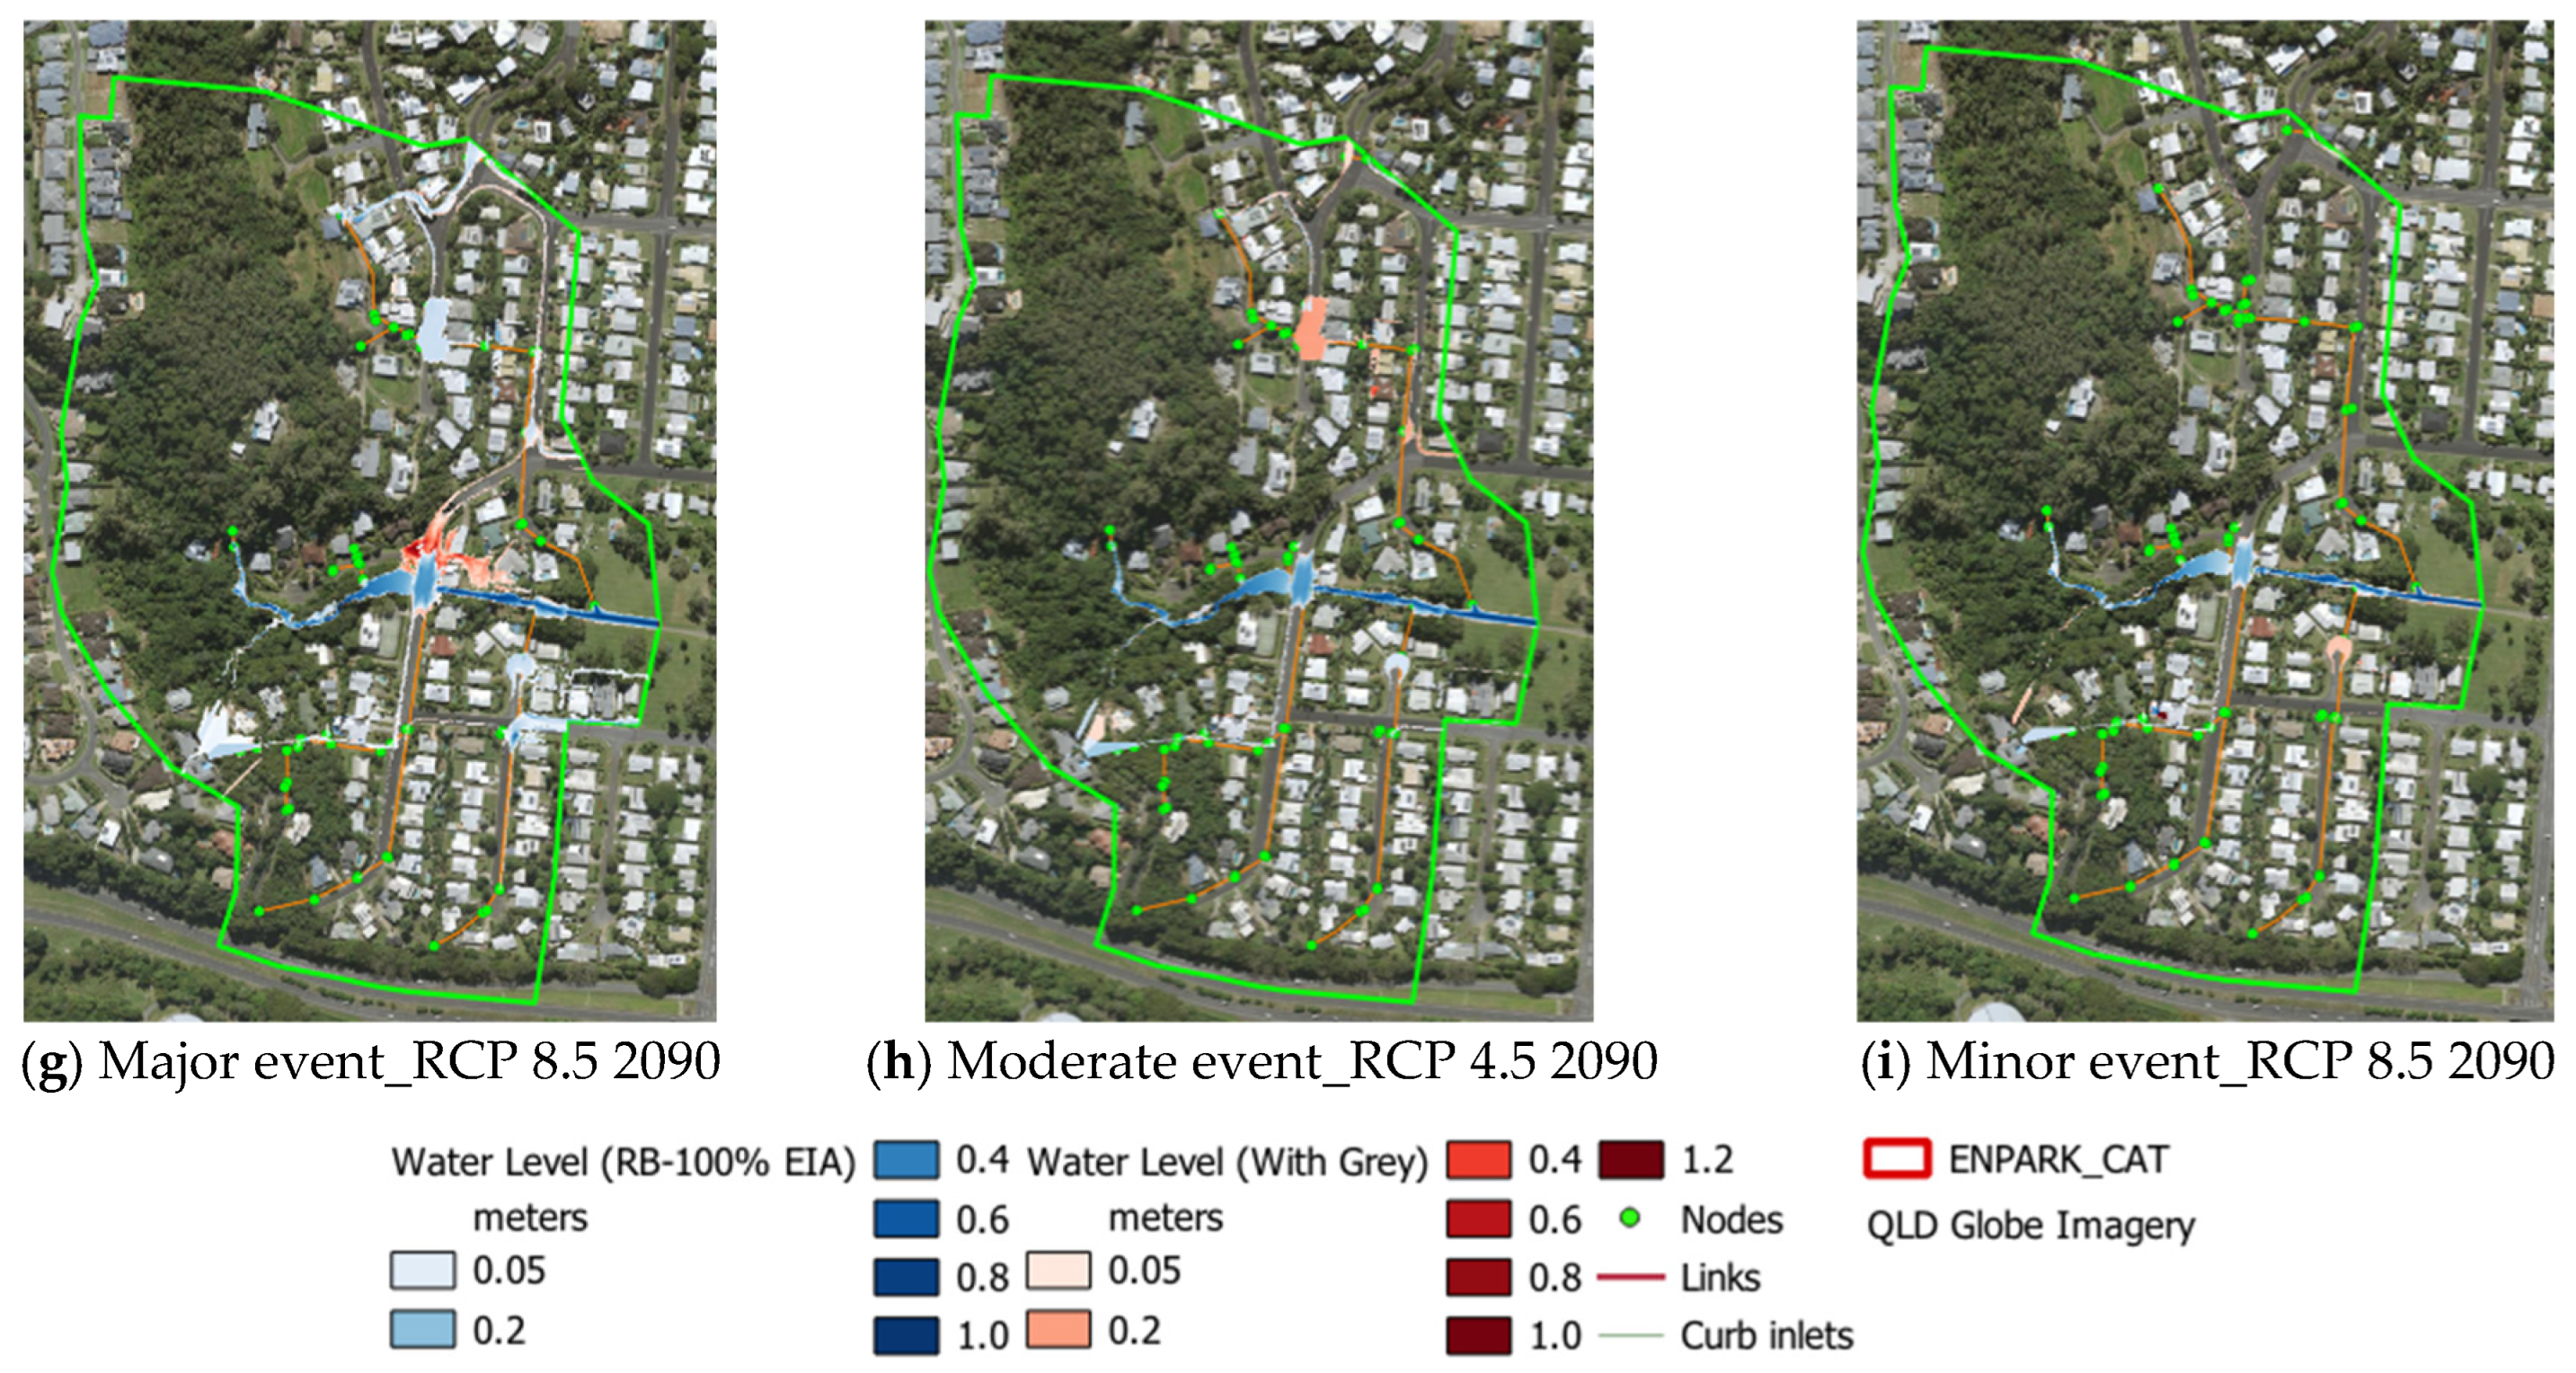
To assess the flood mitigation performance of WSUD, a coupled 1D2D model was used to simulate both individual and combined WSUD systems (
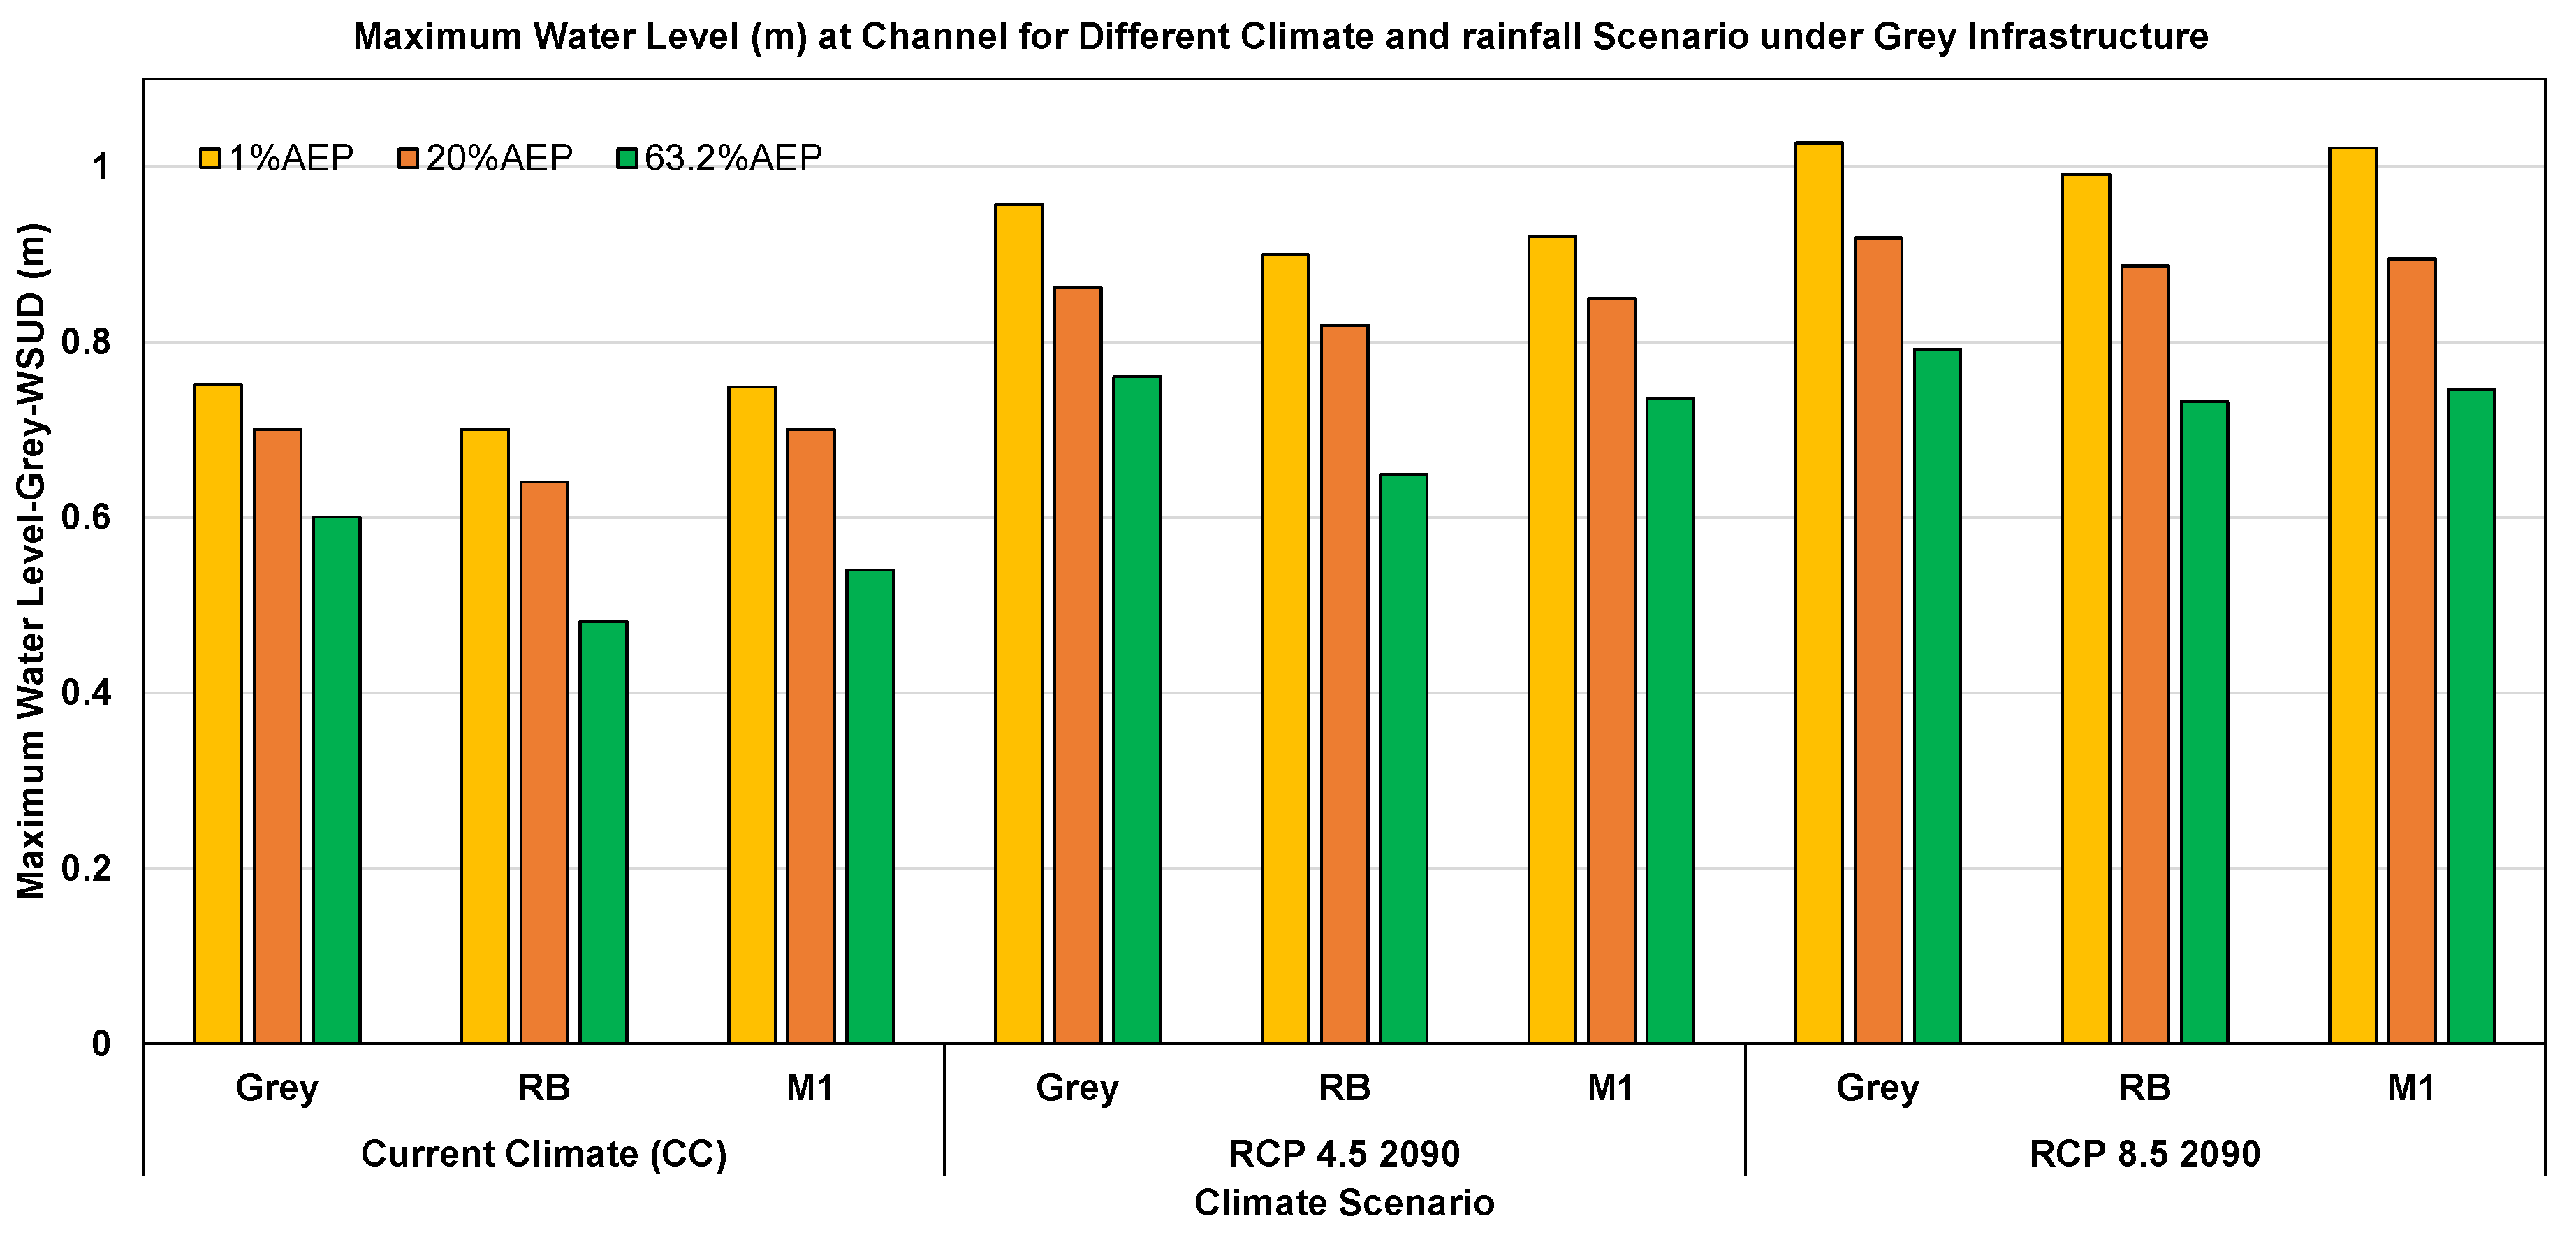
Figure 8). Results showed water level variations ranging from 0.05 m to 1.03 m across different rainfall and climate scenarios. Higher water level changes occurred in channel and roadside areas, especially near culverts and road ends, under intense rainfall. Integrating WSUD with grey infrastructure reduced maximum water levels at the catchment outlet by 7–20% under current climate conditions, and by 3–7% under RCP 8.5 for 2090. WSUD also significantly reduced overland flow, though extreme rainfall under climate change scenarios challenged inlet and pipe capacities, leading to localised overflow.
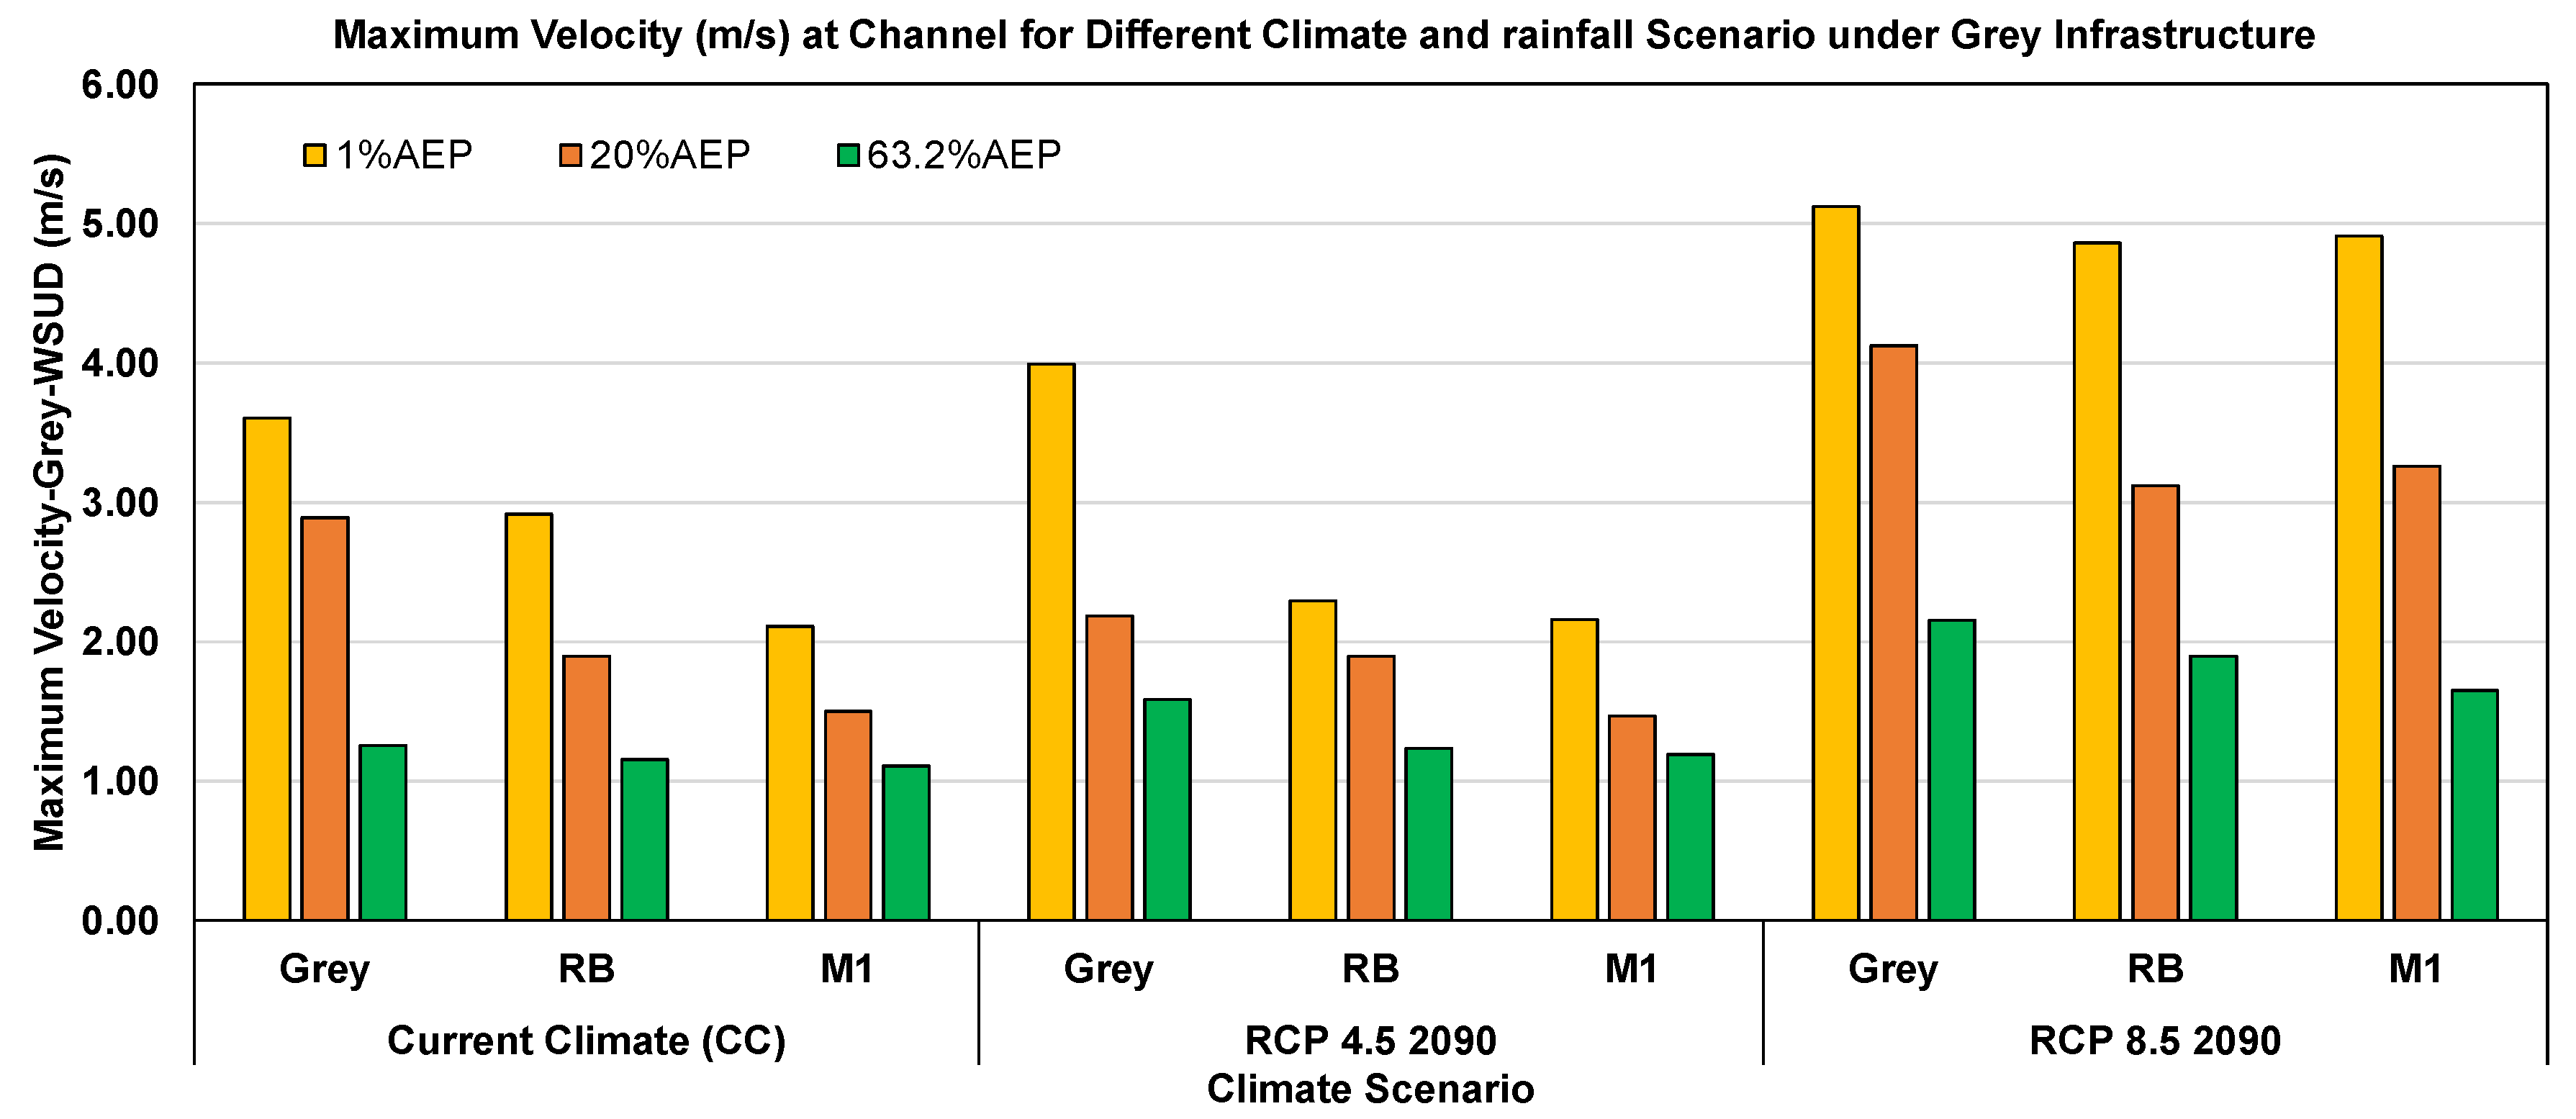
The maximum velocity variation at the channel outlet under different rainfall and climate scenarios ranged from 1 to 3.5 m/s under current conditions and up to 5 m/s under RCP 8.5 by 2090, indicating a potential 40% increase due to intensified rainfall (
Figure 9). While velocity is less discussed in the literature compared to inundation or the water level, it is critical for assessing the flood hazard. The increase is attributed not only to greater runoff but also to the steep upper catchment and grey infrastructure. In contrast, effective WSUD measures like rain barrels and M1 significantly reduced velocities by 4–48%, particularly under major and moderate rainfall events. High velocities pose safety risks, transporting debris and increasing flood damage potential, even during minor events.
The number of flooded nodes under different climate scenarios and rainfall conditions varied notably with the integration of WSUD (
Figure 10). Under RCP 8.5 in 2090, flooded nodes increased by up to 33% and 62% during moderate and minor events, respectively, due to higher rainfall and runoff. However, WSUD implementation led to a reduction in flooded nodes by up to 30% (current climate) and 57% (RCP 8.5) during moderate events, and up to 62% and 25% under minor events, respectively (
Figure 10). The data suggest that WSUD is most effective in reducing node flooding during moderate and minor rainfall, while its impact is limited under major events.
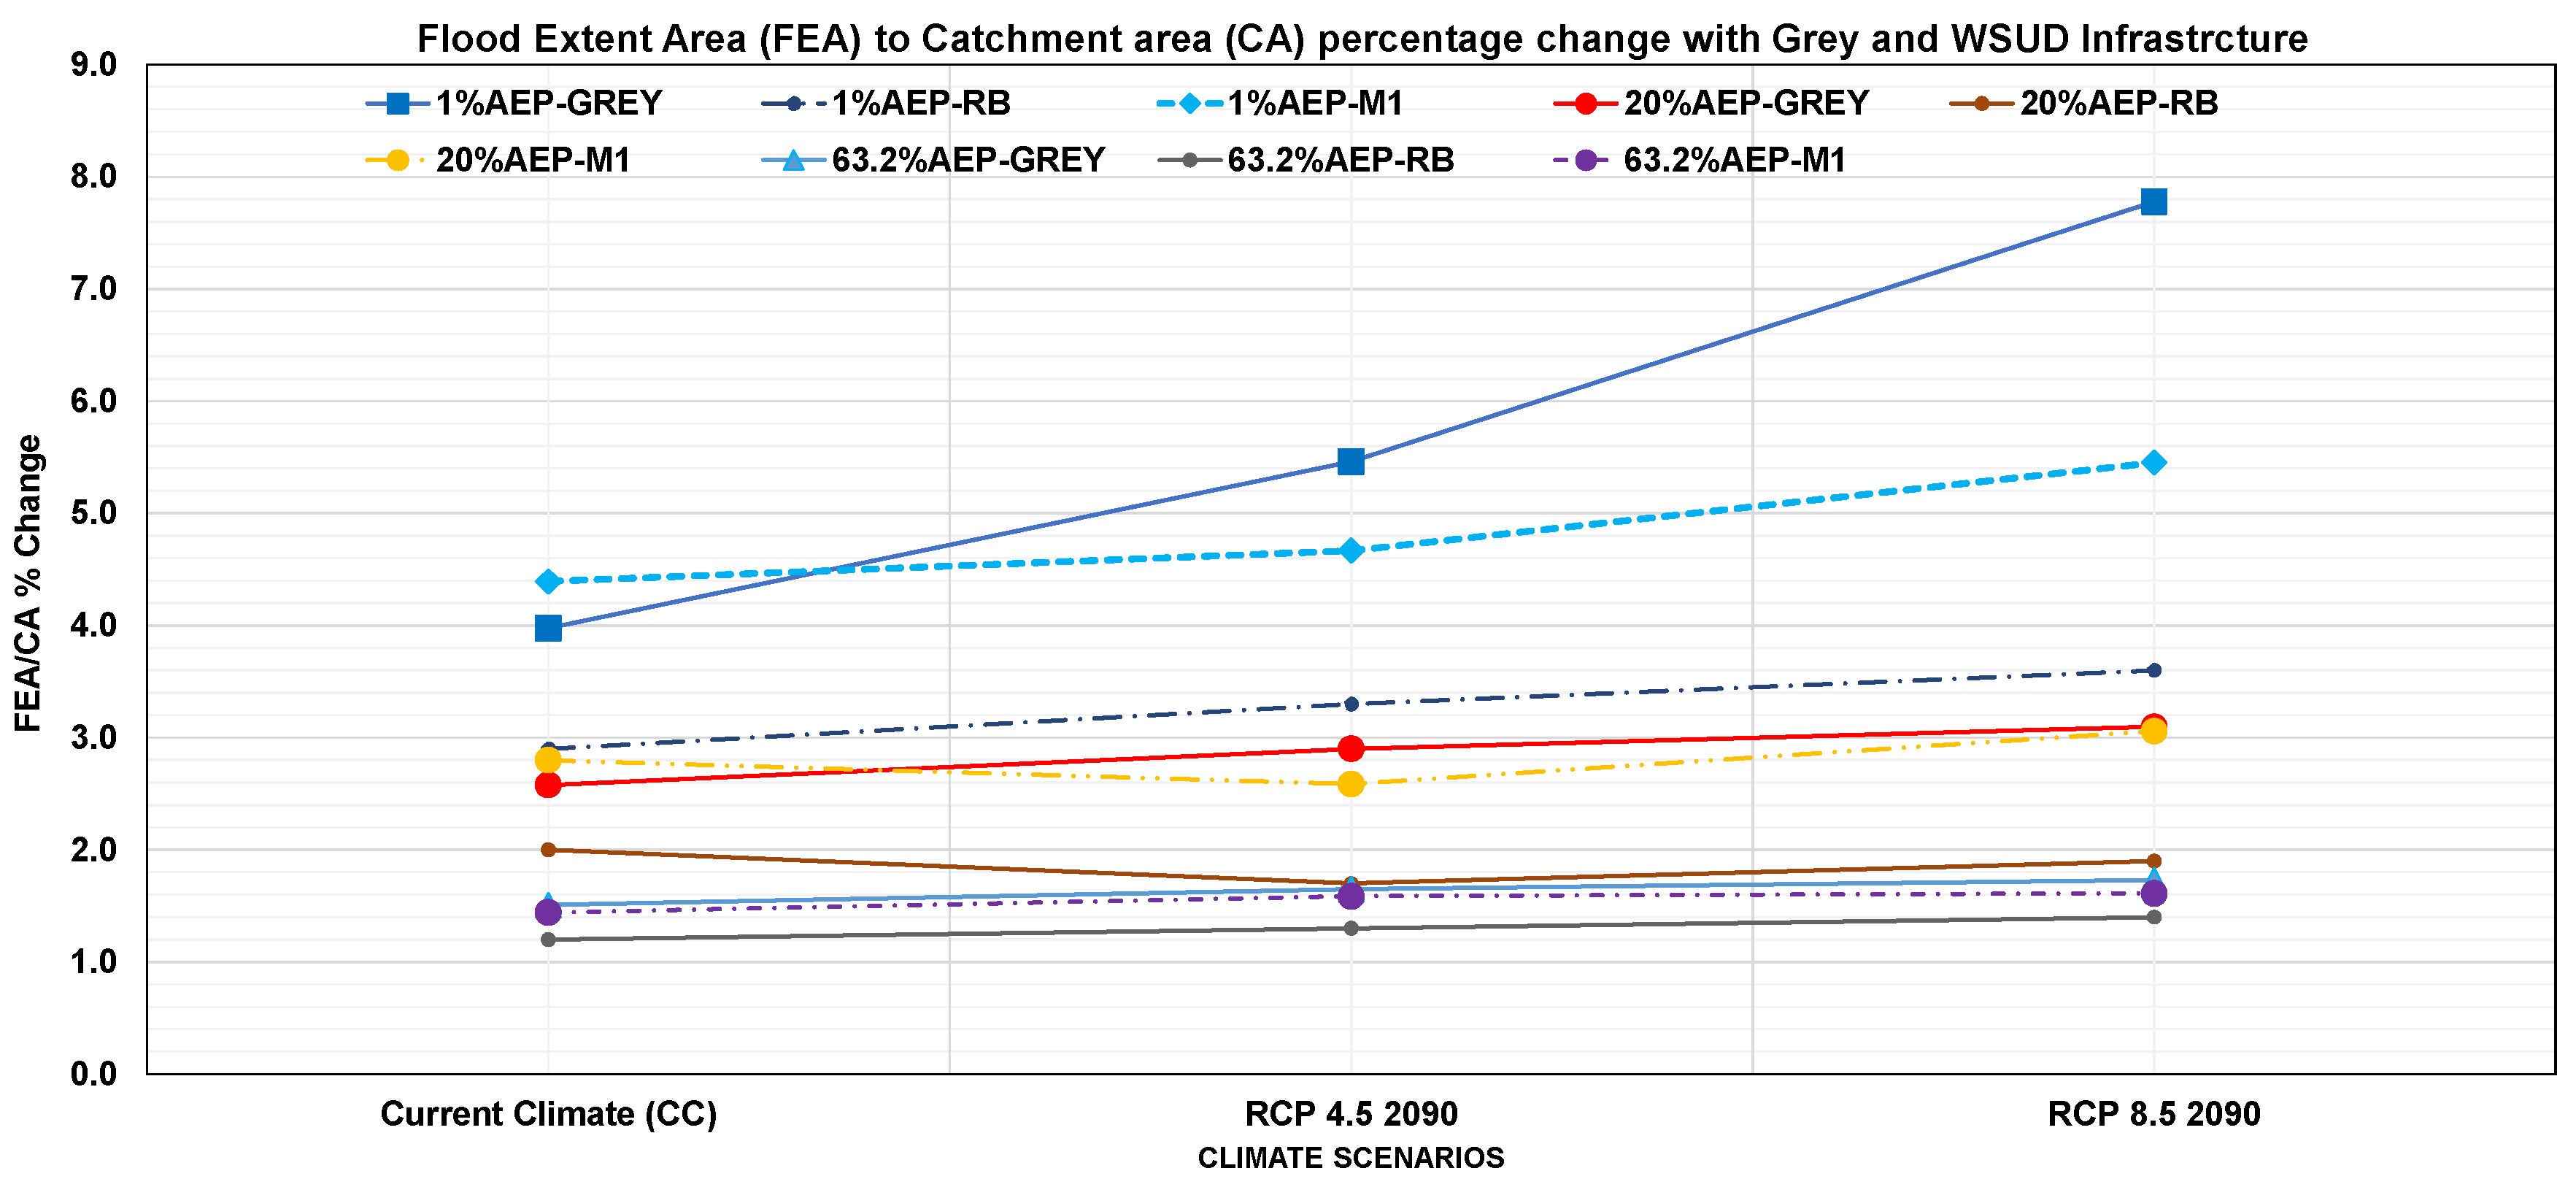
The flood extent area-to-catchment area (FEA/CA) ratio, ranging from 1% to 8% across scenarios, serves as a key indicator of flood mitigation efficiency (
Figure 11). A sharp increase in this ratio was observed during major rainfall under future climate scenarios (RCP 4.5 and 8.5 in 2090), while it remained relatively stable during minor and moderate events (
Figure 11). WSUD integration significantly improved runoff management by intercepting direct flows from impervious surfaces and routing them to inlets, effectively reducing flooded nodes, overland flow, and inundation depths. Overall, WSUD reduced the FEA by 22–26% under the current climate and by 18–54% under RCP 8.5 in 2090, with the most notable reductions during major rainfall events.


