Article

Morphodynamics, Genesis, and Anthropogenically Modulated Evolution of the Elfeija Continental Dune Field, Arid Southeastern Morocco

by
Rachid Amiha
1,
Belkacem Kabbachi
1,
Mohamed Ait Haddou
1,
Adolfo Quesada-Román
2,*,
Youssef Bouchriti
1 and
Mohamed Abioui
1,3
1
Geosciences, Environment and Geomatics Laboratory (GEG), Department of Earth Sciences, Faculty of Sciences, Ibnou Zohr University, Agadir 80000, Morocco
2
Laboratorio de Geografía Física, Escuela de Geografía, Universidad de Costa Rica, San José 2060, Costa Rica
3
Collaborator Member, MARE-Marine and Environmental Sciences Centre-Sedimentary Geology Group, Department of Earth Sciences, Faculty of Sciences and Technology, University of Coimbra, 3030-790 Coimbra, Portugal
*
Author to whom correspondence should be addressed.
Earth 2025, 6(3), 100; https://doi.org/10.3390/earth6030100
Submission received: 30 May 2025 / Revised: 8 August 2025 / Accepted: 14 August 2025 / Published: 19 August 2025

Abstract

The Elfeija Dune Field (EDF) is a continental aeolian system in an arid region of southeastern Morocco. Studying this system is critical for understanding the effects of mounting climatic and anthropogenic pressures. This study provides a comprehensive characterization of the EDF’s morphology, sedimentology, aeolian dynamics, genesis, and recent evolution. A multi-scale, multidisciplinary approach was adopted, integrating field observations, sedimentological analyses, MERRA-2 reanalysis wind data, cartographic analysis, digital terrain modeling, and morphometric measurements. The results reveal an active 30 km2 dune field, elongated WSW-ENE, which is divisible into three morphodynamic zones with a high dune density (80–90 dunes/km2). The wind regime is predominantly from the W to WSW, driving a net ENE sand transport and creating conditions conducive to barchan formation (RDP/DP > 0.78). Sediments are quartz dominated, with significant calcite and various clay minerals (illite, kaolinite, and smectite). Dune sands are primarily fine- to medium-grained and well sorted, in contrast to the more poorly sorted interdune deposits. The landscape is dominated by barchans (mean height H = 2.5 m; mean length L = 50 m) and their coalescent forms, indicating sustained aeolian activity. The potential sand flux was estimated at 1.7 kg/m/s, with a dune collision probability of 32%. The field’s genesis is hypothesized to be controlled by a topographically induced Venturi effect, with an initiation approximately 1000 years ago, potentially linked to the Medieval Climatic Optimum. Significant anthropogenic impacts from expanding irrigated agriculture are observed at the dune field margins. By providing a detailed characterization of the EDF and its sensitivity to natural and anthropogenic forcings, this study establishes a critical baseline for the sustainable management of arid environments.

1. Introduction

Dune fields and sand seas are aeolian sedimentary systems of global significance, characterized by a complexity and dynamism that continue to present major scientific challenges [1,2]. These landscapes are not static entities but are instead the product of self-organizing processes driven by multi-scale interactions between airflow, sediment transport, and surface morphology [3,4,5]. Consequently, current understanding has evolved from viewing dune systems as simple products of regional wind regimes to recognizing the complex, non-linear interactions that govern their behavior. The study of their genesis, characteristics, and evolution is therefore crucial, not only for deciphering fundamental aeolian processes and reconstructing Quaternary paleoenvironments [6,7,8] but also for addressing contemporary challenges in resource and risk management in arid and coastal regions [9]. Research approaches have evolved, increasingly integrating field observations, high-resolution remote sensing [10], numerical modeling, and laboratory experiments [11,12] to apprehend this complexity.
Dune formation is controlled by a subtle interplay between sediment availability, wind strength and variability, and the physical properties of sand [13,14]. Recent studies have highlighted how even minor parameter variations can induce significant morphological responses, such as the inverse correlation between dune size and migration rate. Sediment granulometry and chemical composition also provide essential clues to provenance and the history of dune formation [15,16]. The evolution of dune fields can thus manifest through processes of dune coalescence and lateral linking, influenced by these initial factors. A well-established theoretical understanding of aeolian processes already exists. However, detailed and integrated case studies of specific dune fields remain essential, particularly for testing evolutionary models and assessing regional variability [17]. This is especially true for moderate-sized systems in specific geographical contexts that are subject to increasing anthropogenic pressures [18].
Although large ergs and coastal systems are extensively documented, there remains a scarcity of integrated studies on moderate-sized, topographically constrained continental dune fields. This research gap is particularly acute for systems at the interface with intense human activity, such as agricultural expansion, where the interactions between natural and anthropogenic forcings are poorly understood. The Elfeija Dune Field (EDF), therefore, provides an ideal natural laboratory for addressing these questions. Located in the Feija of the Zagora tectonic depression, an arid high valley in southeastern Morocco (Figure 1), its confinement between two Anti-Atlas mountain ridgelines promotes a strongly unidirectional wind regime and potential Venturi effects. Critically, its margins are undergoing rapid transformation due to the expansion of irrigated agriculture. This unique combination of clear natural controls and intense, localized anthropogenic pressure makes the EDF a prime location to investigate the complex interactions that shape such aeolian systems. It also provides an ideal setting to assess their sensitivity to contemporary environmental changes. The primary objective of this research is to conduct a comprehensive characterization of the EDF by analyzing (1) its morphology and morphometric characteristics at various scales, including detailed mapping of dune types and their spatial organization; (2) its current aeolian dynamics and sediment transport processes; (3) hypotheses regarding its genesis, considering topographic and climatic controls; and (4) its recent evolution, with particular attention to the impact of human activities, notably the expansion of irrigated agriculture, which modifies land cover. To achieve these objectives, a multi-scale and multidisciplinary approach was implemented. This paper first presents a detailed description of the study area and methodology. Subsequently, the results are detailed and discussed in terms of aeolian dynamics, probable genesis, and evolution under natural and anthropogenic forcings, before concluding on the implications of this study for understanding continental dune systems in arid environments. Therefore, our central hypothesis is as follows: while topographically steered wind dynamics primarily control the genesis and large-scale morphology of the EDF, its recent evolution and margin dynamics are increasingly modulated by anthropogenic land use change. This change, in turn, alters the local sediment budget and surface boundary conditions.

2. Materials and Methods

2.1. Study Area

The Elfeija Dune Field (EDF) is located in southeastern Morocco, within the vast Feija of Zagora depression, a region characterized by an arid climate. Geomorphologically, the EDF is situated on an intracontinental plateau with altitudes ranging from 761 m to 795 m. The field itself covers an area of approximately 30 km2, with an elongated shape along a general WSW-ENE direction (N60°–N65°) (Figure 1a). It is bordered to the north by the Anti-Atlas and Bani reliefs, and its southern flank is traversed by the bed of the Oued Elfeija, currently a dry river. The area is also marked by increasing agricultural activity, notably irrigated watermelon cultivation. The landscape of the EDF is characterized by a combination of active mobile dunes and sandy–gravelly interdune areas with sparse xerophytic vegetation, primarily composed of Vachellia tortilis subsp. raddiana (Figure 1b). The dunal surfaces themselves show well-developed ripple marks, indicative of active sediment transport, and are increasingly impacted by agricultural practices (Figure 1c).

2.2. Data Acquisition and Processing

To achieve the study’s objectives, a multi-scale and integrated methodological approach was adopted. The cornerstone of this approach is the analysis of an exceptionally high-resolution (VHR) satellite image with a 30 cm/pixel resolution, acquired over the region in December 2022. This unique dataset provided an unprecedented level of detail for morphological mapping and morphometric analysis. This remote sensing component was complemented using climatic reanalysis data to characterize the aeolian regime. Furthermore, these analyses were systematically validated and enriched by targeted field campaigns, during which sediment samples were collected for subsequent laboratory analysis. The following sub-sections detail the specific protocols applied for each component of this integrated approach.

2.2.1. Remote Sensing Data and Digital Terrain Model (DTM)

A multi-source remote sensing approach, complemented by field validation, was employed for this study. The datasets were structured as follows:
  • Primary Morphological Data: Very high-resolution (VHR) satellite imagery (30 cm resolution, primarily from December 2022), accessed via the Google Earth Pro platform, served as the primary dataset for detailed morphological mapping. This imagery enabled precise dune field delineation, the identification of dune types, and the measurement of key morphometric parameters. Fine-scale topographic profiles were also extracted using the platform’s altimetric tools to analyze local variations in altitude and slope.
  • Foundational Topographic Data: For the broader topographic context, the NASA Digital Elevation Model (NASADEM) was utilized. Specifically, the SRTMGL1 (Version 1) product provided a foundational digital terrain model (DTM) with a 1 arc-second (~30-m) resolution for the entire study area.
  • Multispectral and Thermal Analysis: To analyze land cover and surface dynamics, data from two satellite systems were acquired for May 2024:
    -
    Sentinel-2 (ESA): Multispectral imagery was used to discriminate vegetation and land cover. A false-color composite (SWIR2, NIR, and Green bands) was generated following atmospheric correction to highlight variations between bare sand, sparse vegetation, and irrigated crops.
    -
    Landsat 8/9 (NASA/USGS): Thermal infrared data from the onboard Thermal Infrared Sensor (TIRS) were used to map surface temperature, providing a proxy for assessing soil moisture and the impact of irrigation.
  • Field Validation: The remote sensing analyses were validated through targeted in situ observations. These campaigns included ground truthing of the land cover classifications and a direct sand flux measurement experiment conducted on a representative barchan dune within Zone Z3.

2.2.2. Wind Data and Aeolian Regime Characterization

Wind data for the Elfeija Dune Field were obtained from the MERRA-2 (Modern-Era Retrospective analysis for Research and Applications, Version 2) reanalysis system, accessed via NASA’s Power Data Access Viewer (DAV) platform. Aeolian dynamics were assessed by calculating the Drift Potential (DP) and Resultant Drift Potential (RDP), as well as the RDP/DP ratio and the resultant transport direction (RDP°), following the methodology proposed by Fryberger & Dean [19].

2.2.3. Sampling and Sedimentological Analyses

We collected a total of 55 sediment samples from dispersed locations across the three zones (Z1, Z2, and Z3) of the EDF in 2023, including samples from dune crests, slopes, and interdune areas, to characterize the dune sediments. We determined the mineralogical composition using X-Ray Diffraction (XRD) on powder samples. This analysis included the identification of clay minerals from the fine fraction. Diffractogram acquisition and interpretation were performed using HighScore Plus software V.4.9. The XRD analysis was performed on unoriented powder mounts using a Bruker D8 ADVANCE diffractometer (Bruker AXS, Karlsruhe, Germany) equipped with a LYNXEYE detector and operating with CuKα radiation. Concurrently, the grain-size distribution was determined by dry sieving using an electric sieve shaker (Retsch AS 200, Retsch GmbH, Haan, Germany). The sieve stack consisted of a standard AFNOR column with mesh intervals following a geometric progression from 1 mm down to 0.05 mm. Then, the raw data were processed using GRADISTAT software V.8 to calculate descriptive statistical parameters.

2.3. Detailed Morphological and Morphometric Analysis

A detailed morphological and morphometric analysis of the Elfeija Dune Field (EDF) was conducted using VHR satellite imagery and a DTM. This analysis encompassed defining the field’s boundaries and calculating its general characteristics; identifying, mapping, and classifying dune types, subdividing the EDF into three main morphodynamic zones (Z1, Z2, and Z3); performing precise measurements of barchan and coalesced barchan arc dimensions; extracting topographic profiles to analyze altitude and slope variations; and finally, estimating dune density, occupancy rate, and sand encroachment area per km2 to assess the spatial variability of dune activity.

2.4. Aeolian Dynamics Modeling

Aeolian dynamics modeling was undertaken to estimate potential sand flux and dune collision probability. Sand flux was calculated using Owen’s model [20], with a threshold shear velocity determined by Bagnold’s equation [13], and considering a comparative approach based on ripple marks [21]. To provide a first-order estimation of dune collision probability, a logistic regression model was adapted, drawing inspiration from recent advancements in understanding the probabilistic nature of dune interactions [22,23]. The model defines collision probability as P_collision = σ (β0 + Σ (βi × Xi_norm)), where S(z) = 1/(1 + e-z) is the logistic function. The explanatory variables (Xi) considered include velocity differential (Δv), relative orientation (θ), slope (α), interdune distance (d), and height ratio (H_ratio). Each variable was standardized using its mean (µi) and standard deviation (σi) as Xi _norm = (Xi − µi)/σi, with values adopted from general observations in barchan fields (Δv: µ = 1.5 m/yr, σ = 0.5; θ: µ = 45°, σ = 10; α: max = 15°, σ =10; d: µ = 50 m, σ =20; H_ratio: µ = 1.85, σ =0.3). The model coefficients (β0 = 0.03 (intercept); β1 = 0.15 (relative velocity); β2 = 0.002 (orientation); β3 = 0.5 (slope); β4 = −0.02 (distance); β5 = −0.1 (height ratio)) were selected based on general tendencies observed in barchan dynamics and assumed conditions for the EDF.

3. Results

3.1. Aeolian Dynamics

3.1.1. Wind Regime Characteristics

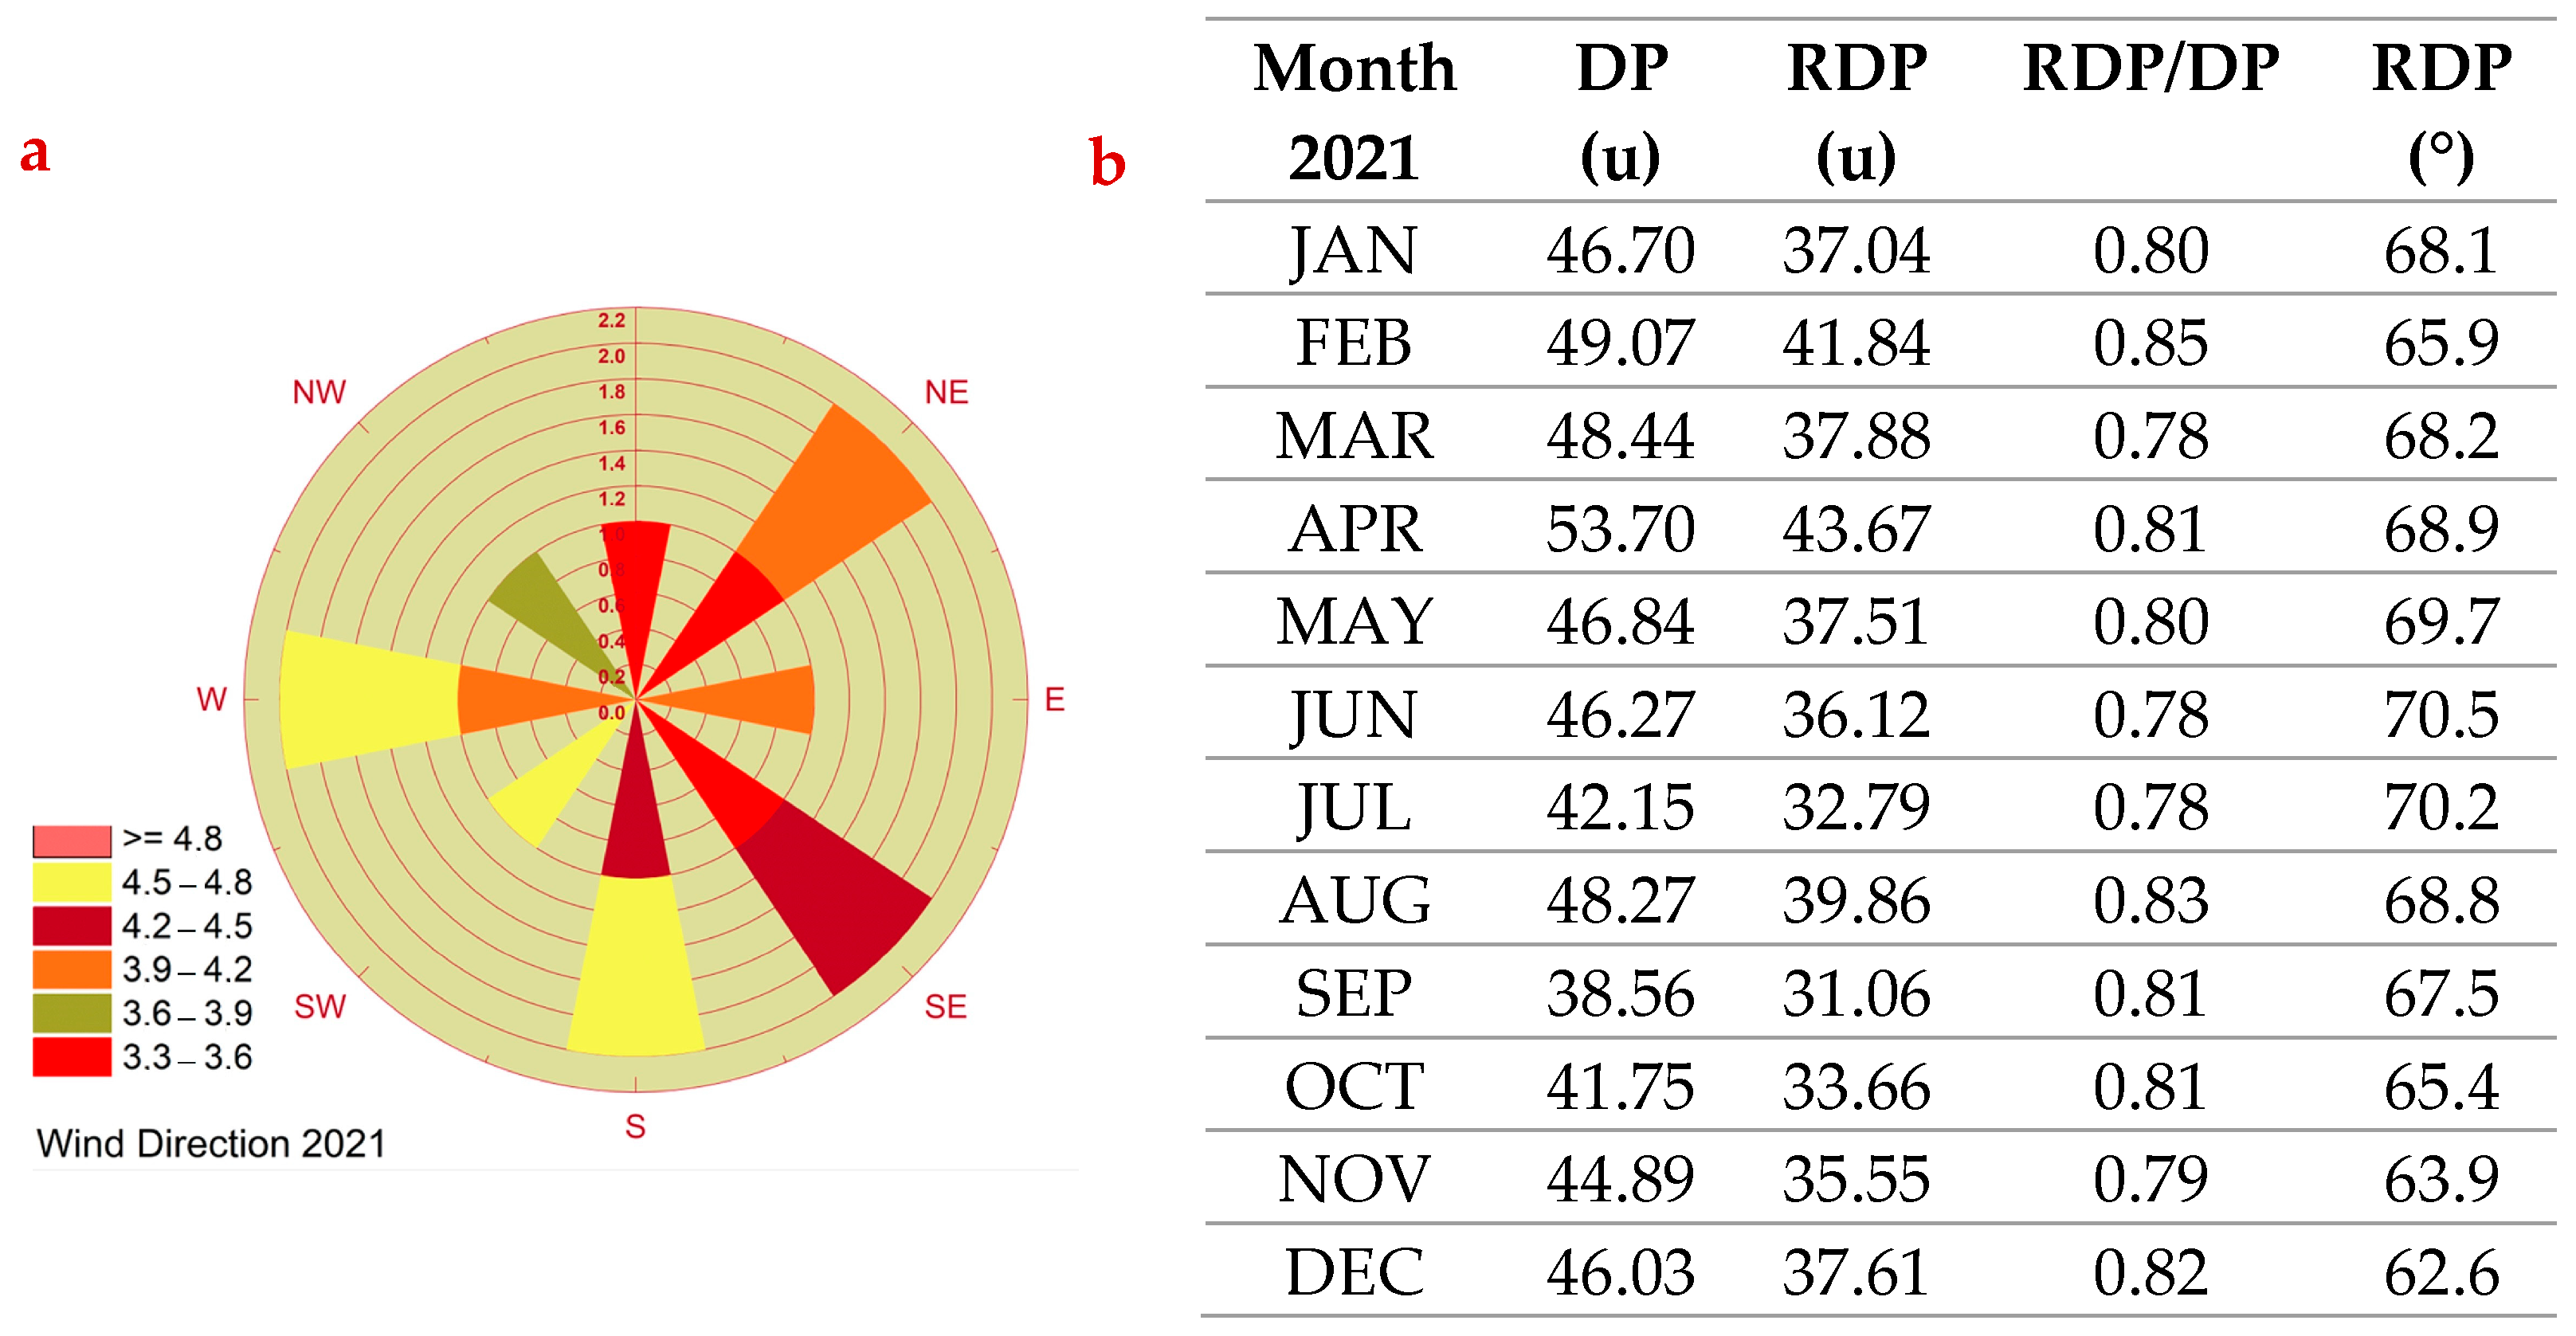
The wind regime characteristics for the Elfeija Dune Field (EDF) in 2021, derived from MERRA-2 reanalysis data, are presented in Figure 2. The annual wind rose (Figure 2a) indicates a multimodal wind distribution, with dominant winds blowing from the West (W) and West–Southwest (WSW) sectors. Secondary contributions are observed from the East (E) and East–Northeast (ENE) sectors. Winds from northerly and southerly directions are less frequent and generally of lower intensity.
The monthly analysis of aeolian dynamic parameters, calculated according to Fryberger & Dean [19] (Figure 2b), reveals seasonal variability in wind energy and directionality. The total Drift Potential (DP) values range from 38.56 U (September) to 53.70 U (April), indicating moderate to significant potential for sand transport throughout the year. The Resultant Drift Potential (RDP) values, which reflect the net sand transport capacity, vary from 31.06 U (September) to 43.67 U (April). The RDP/DP ratio, an indicator of wind direction variability, consistently remains high, with monthly values ranging from 0.78 to 0.85. These high ratios are characteristic of a unimodal wind regime, which is conducive to the formation of transverse dunes like barchans. Such high ratios suggest a relatively low directional variability or a strongly dominant wind component for sand transport each month. The resultant drift direction (RDP°) shows a predominant WSW to WNW transport vector, with most monthly values clustered between approximately 62° (ENE, in December) and 70.5° (ENE, in June), indicating a net sand transport towards the ENE.

3.1.2. Sand Flux and Collision Probability

The aeolian dynamics of the EDF were investigated through modeling and field measurements. Using Owen’s [20] model with an assumed wind speed of 8 m/s and an estimated threshold velocity of 0.24 m/s (derived from Bagnold’s equation), the potential sand flux (q) for the EDF is calculated at 1.7 kg/m2/s. In contrast, direct field measurements using a sand trap on a barchan in Z3 (Figure 3) yielded a significantly lower measured flux of 1.1 kg/m2/h under a recorded wind speed of 4.2 m/s.
Furthermore, the probability of collision between successive barchans was estimated using an adapted logistic regression model (inspired by Grohmann et al. [24]; see Section 2.4 for model details, including the specified coefficients). Applying this model with a representative set of input parameters for interacting dunes within the EDF (e.g., velocity differential Δv = 1.1 m/yr, relative orientation θ = 60°, slope α ≈ 2.58° (equivalent to 4.5% gradient), interdune distance d = 55 m, and height ratio H_ratio = 0.85), the standardized variables (X1_norm to X5_norm) are −0.8, 3.5, −1.24, 0.25, and 0, respectively. The linear combination using the model coefficients (β0 = 0.03, β1 = 0.15, β2 = 0.002, β3 = 0.5, β4 = −0.02, and β5 = −0.1) yields z ≈ −0.708. This results in a final collision probability P_collision = σ (−0.708) ≈ 32%. This value, significantly above zero, indicates a high likelihood of dune interaction and coalescence, characteristic of a densely populated and active dune field as the EDF.

3.2. General Morphology, Characteristics, and Cartography of the Elfeija Dune Field

The Elfeija Dune Field (EDF) is an intracontinental aeolian system located on a plateau with altitudes varying from 761 m to 795 m. The field covers approximately 30 km2 (1.3% of the watershed area) and exhibits an elongated shape, extending 12 km in length and 2.5 km in width, oriented WSW-ENE (N65°). Its longitudinal profile reveals a progressively gentler gradient, with average slopes in its upper, middle, and lower sections measuring approximately 4.5%, 3.4%, and 1.4%, respectively.
The natural vegetation is xerophytic, including species such as Acacias, Tamarisk, Alfa, Laurels, Zygophyllum, Calotropis, and Colocynth. The substratum consists of sandy, gravelly–sandy, and silty–sandy materials. Current land occupation includes intensive centripetal agriculture, isolated habitats, and tracks. The presence of a dry riverbed, “wadi Elfeija,” along the southern flank of the dune field underscores the area’s pronounced aridity and suggests a past hydrographic evolution that likely supplied sediment to the field.

3.2.1. Topographic Profiles

Topographic profiles across the EDF reveal its overall concave nature. The longitudinal profile (WSW-ENE, N70°, Figure 4a) shows a general slope of 2.5%, with steeper gradients (up to 9.5%) near the piedmont in the upper part, and gentler slopes (1.5%) towards the terraces in the lower part. The transverse profile (NW-SE, N130°, Figure 4b) confirms this concavity. The topography is characterized by undulations, mounds, and hollows, indicative of a complex depositional and erosional history influenced by both aeolian and past fluvial processes.

3.2.2. Dune Forms and Morphometric Parameters

The EDF is characterized by a variety of dune morphologies, revealing constant aeolian activity. Dominant forms include barchans and their coalescent derivatives. Detailed morphometric analysis of these forms shows the predominant dune motifs and their characteristics illustrated in Table 1, including fat barchans (c/a = 1.15), asymmetric barchans, normal barchanoid dihedrals (a/c = 0.68), and dome dunes. Linear dunes are sparsely observed. Isolated barchans typically exhibit a mean height (H_mean) of 2.5 m, a mean length (L_mean) of 50 m, and a mean width (l_mean) of 30 m.

3.3. Morphodynamic Zonation of the EDF

Based on morphological evolution, dune density, topography, and positioning, the EDF has been subdivided into three distinct morphodynamic zones (Z1, Z2, and Z3) from WSW to ENE:
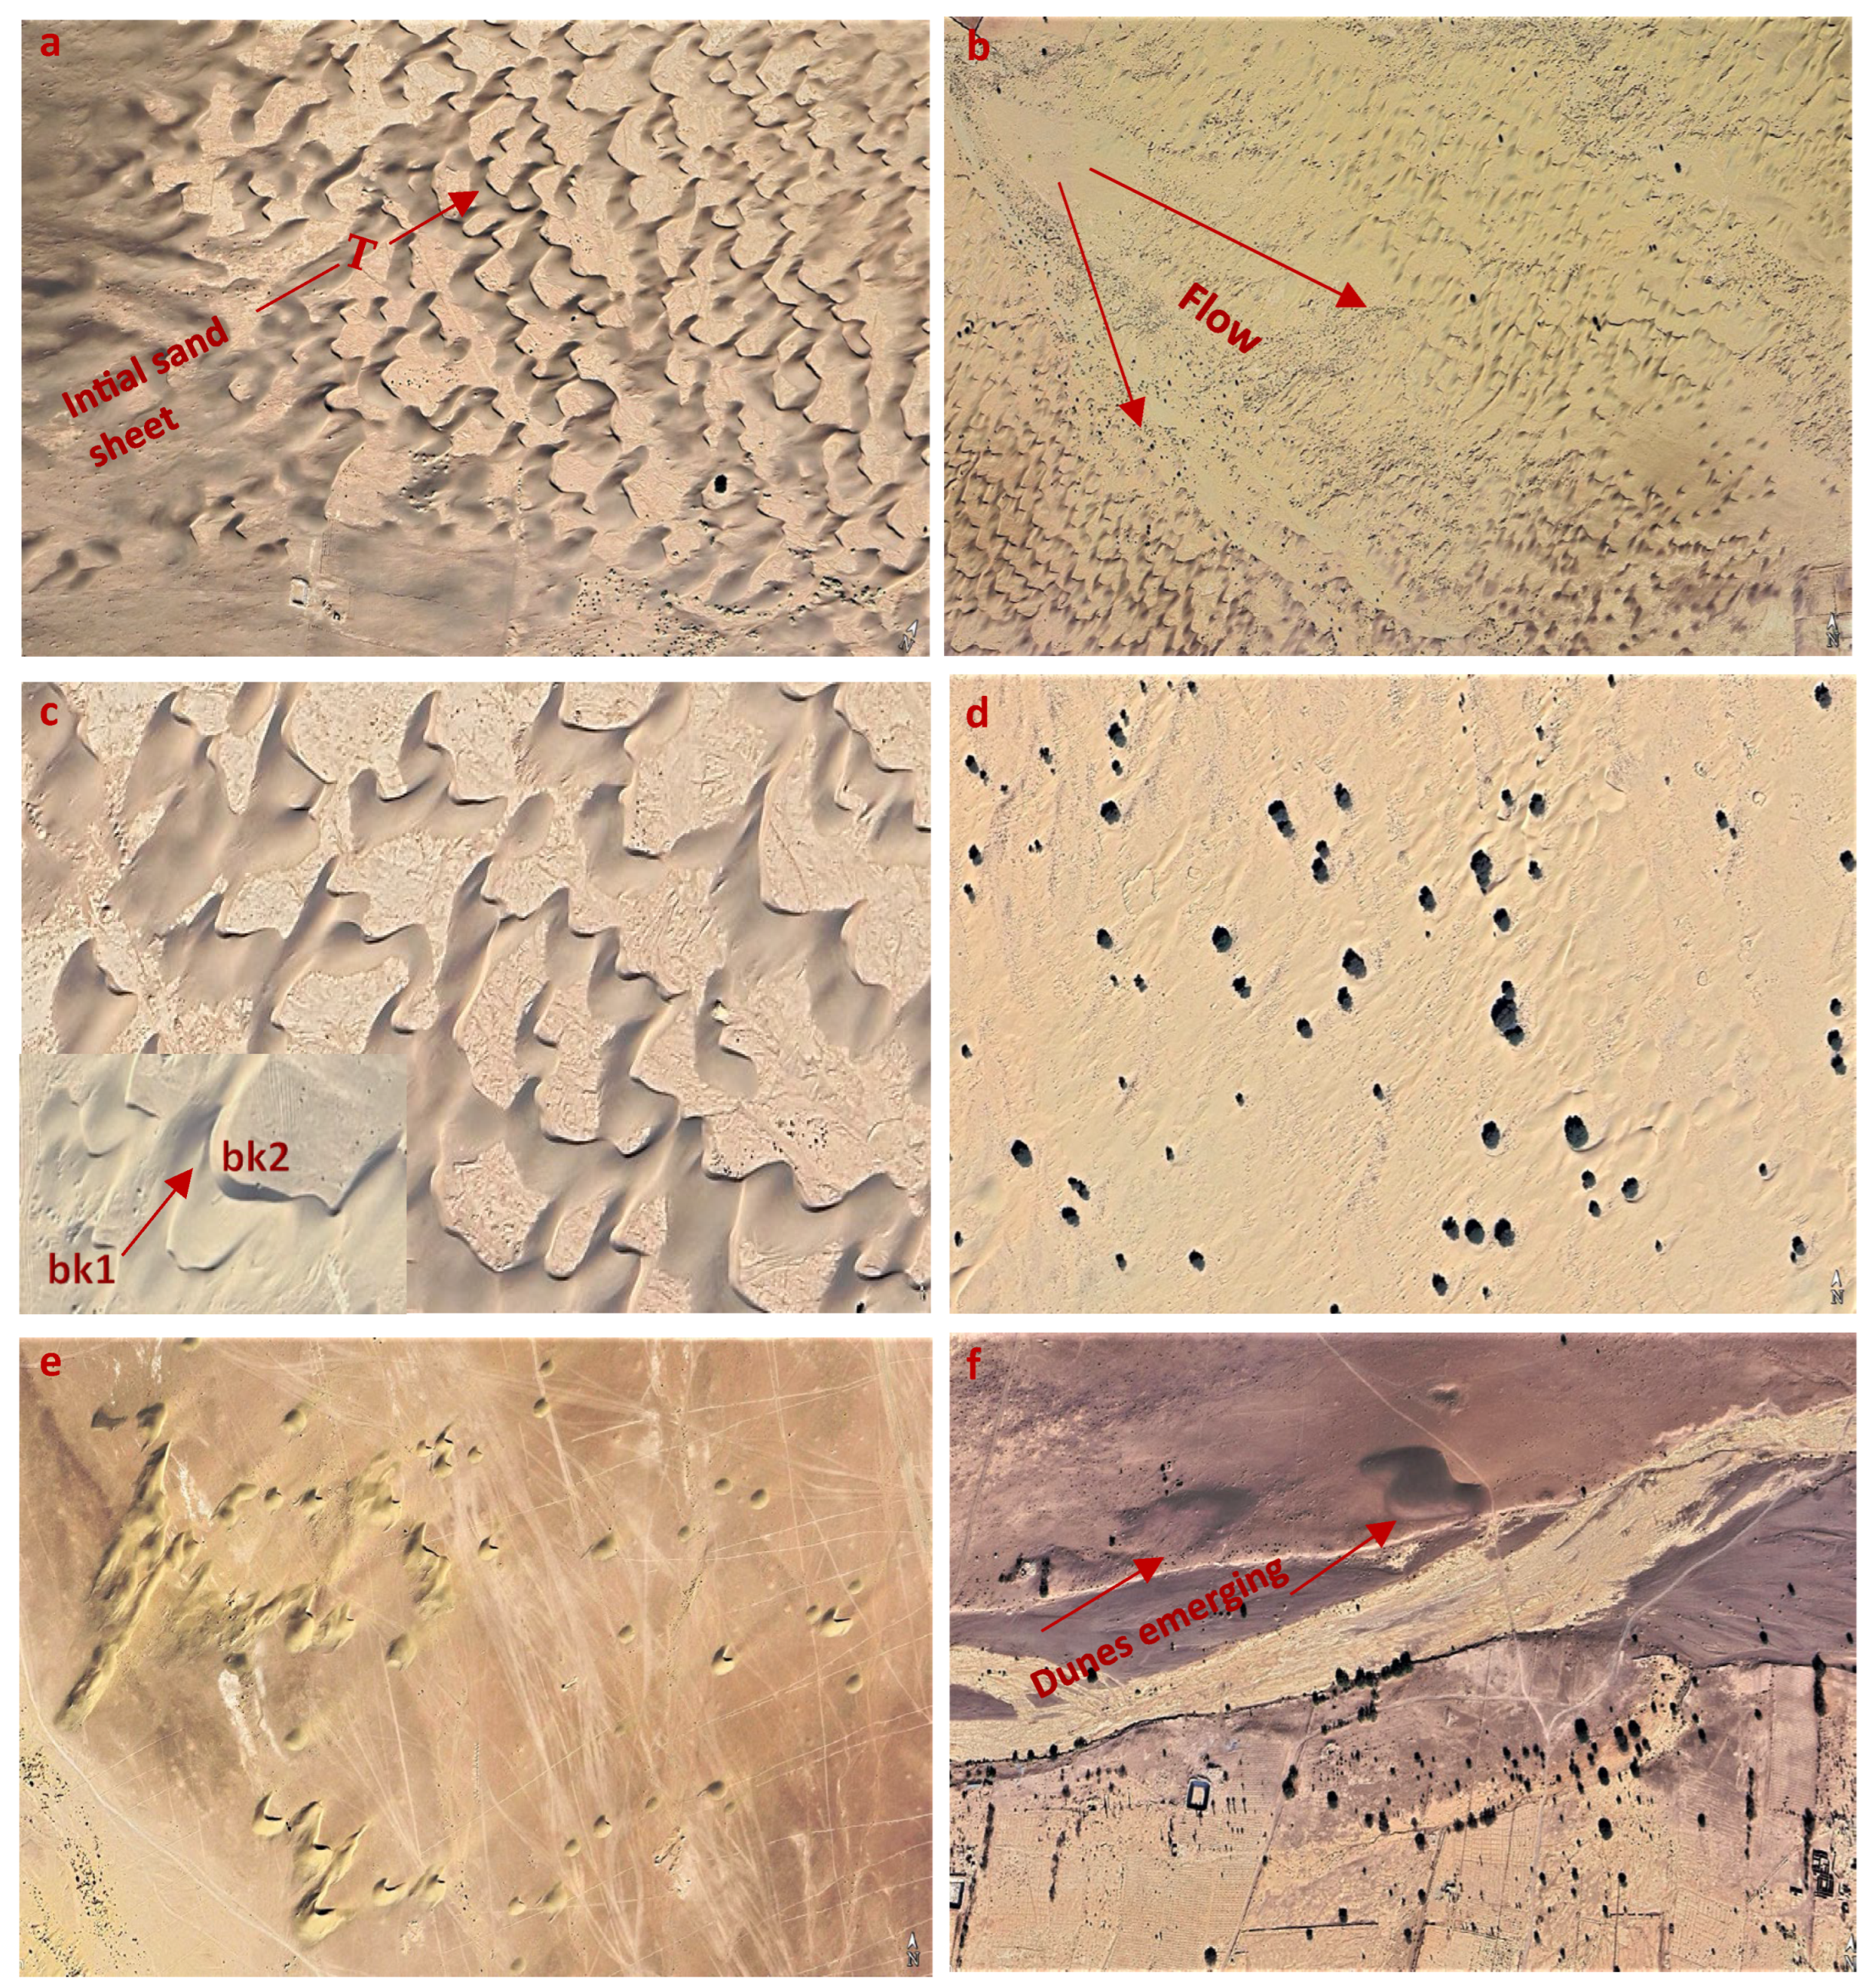
  • Zone Z1 (0–3.3 km): This upstream zone, with altitudes from 785 m to 795 m (10 m elevation difference, mean slope 0.3%, and max slope 12%), acts as the primary sediment source area for the EDF. As depicted in Figure 5a, which shows the initiation area of the dune field, this zone is characterized by the initial detachment of sand accumulations into individualized barchanoid bodies. These often advance as sand sheets (chasse-sable), primarily composed of darker-toned, likely Fe-Mg-rich materials, derived from alluvial fan deposits such as those of Bou Rbia and Oued Sfissifa. Barchans, emerging from these sand sheets, are the dominant morphodynamic motif in this zone.
  • Zone Z2 (3.3–7.7 km): This central zone shows significant altimetric variation (770–785 m, mean slope 0.35%, and max slope 24%). Barchan ribbons from Z1, initially oriented N120–130° E, undergo a localized 30° E deviation before returning to their original orientation. Coalescent barchans form successive, irregular, or imperfect convex arcs, particularly in the southern part of this zone (circumference L = 700–1300 m, mean radius R = 800 m, central angle θ = 85°, and sagitta = 220–230 m in N62° E direction). Figure 5b shows disorganized barchans under torrential flow effects, and Figure 5c depicts barchan fusion/collision. Figure 5d shows the transition from barchanoid ribbons to isolated, disorganized dunes influenced by vegetation and slope changes.
  • Zone Z3 (7.7–11.9 km): This downstream zone exhibits lower altimetric variation (770–762 m, mean slope 0.28%, and max slope 5.5%). As illustrated in Figure 5e, simple or isolated barchans become more frequent in this zone, contrasting with more coalesced forms observed further upstream. Their color also tends to change from dark brown to lighter beige, suggesting qualitative granulometric sorting. The interdune areas in this zone are often extensive and marked by numerous linear tracks. Zone Z3 is characterized by an indented northern margin (P = 10%) and extensive agricultural land use, which appears to impede dune progression. Interdune corridors are more developed, with the most significant one (approx. 3 km long, N120° E) connecting the Oued Steila alluvial fan to the Oued Elfeija. Dune wavelength here reaches a maximum of λ = 130 m and locally up to 400 m. Moreover, certain sections of the El Feija wadi show the emergence of dune shields, which evolve into barchans (Figure 5f).

3.4. Dune Density and Sand Encroachment

3.4.1. Dune Density

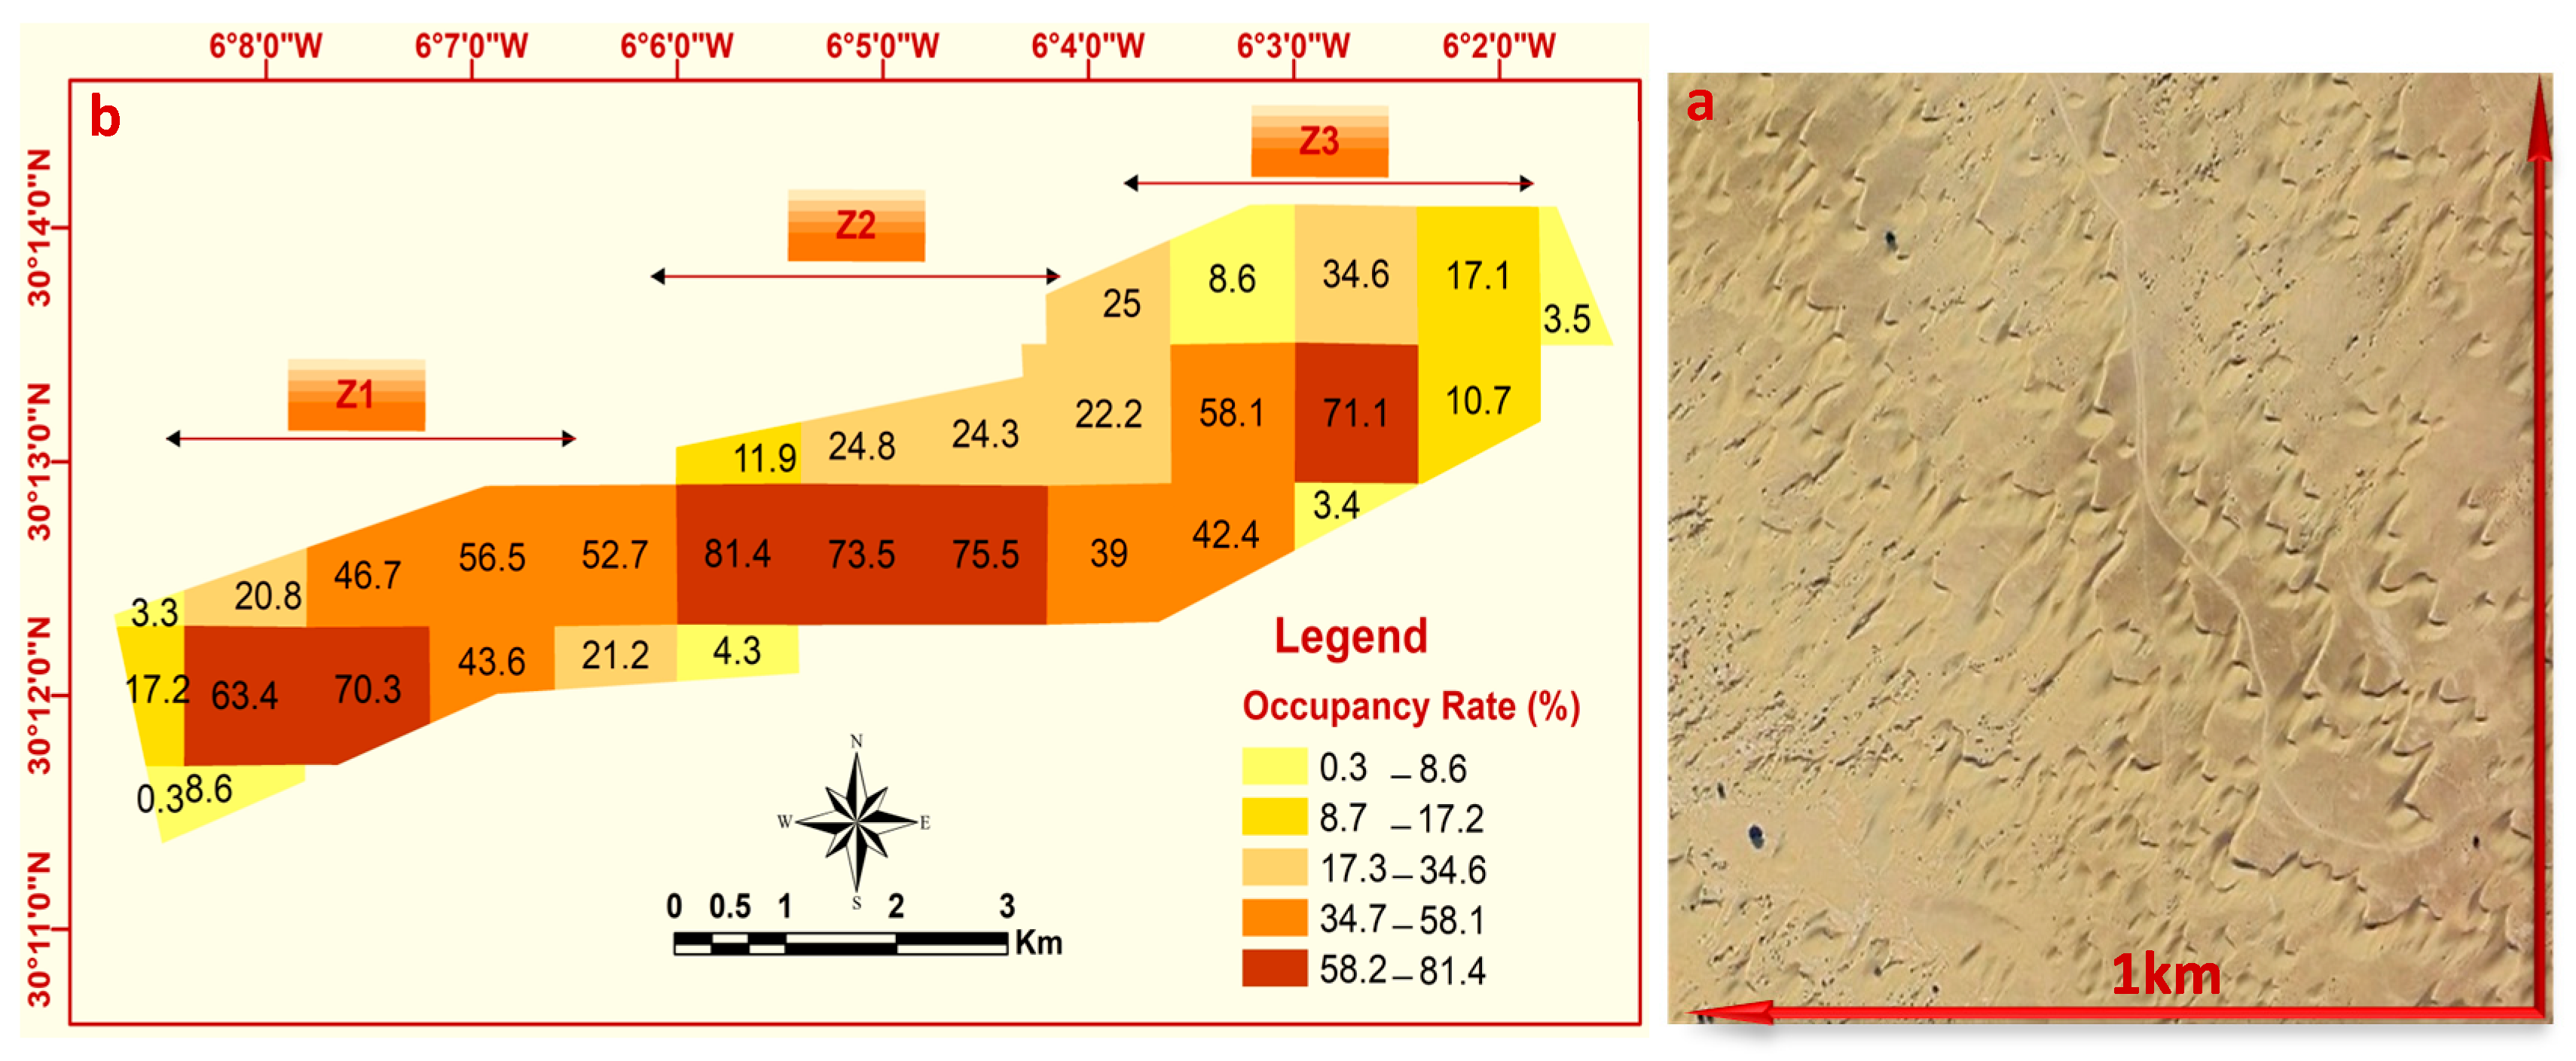
Direct observation and counting on high-resolution Google Earth imagery (2022) using a 1 km × 1 km grid (example for Z2 shown in Figure 6a indicates a dune density of approximately 80 to 100 dunes/km2 in the high-density areas of the EDF. This high density suggests a relatively active dune field with significant potential for dune interaction [25].
Zonal variations are also apparent from the map (Figure 6b). Zone Z1, the upstream area, is characterized by extreme heterogeneity, containing some of the highest occupancy cells (e.g., 63.4%, 70.3%, and 81.4%), indicative of dense dune formation, immediately adjacent to cells with very low occupancy, suggesting strong morphodynamic activity and sediment sorting at the field’s initiation. Zone Z2, the central part, presents a mixed pattern with extensive areas of high occupancy (e.g., 73.5% and 75.5%) interspersed with cells of moderate (e.g., 24.8% and 39%) to lower occupancy, suggesting ongoing dune migration and coalescence but also the presence of more stable interdune corridors. The previous characterization of Z2 as having “lower occupancy and relative stabilization” needs to be nuanced by these observations of significant active patches. Zone Z3, the downstream area, generally displays lower average occupancy rates (many cells < 35%), though it also contains localized patches of high activity (e.g., 58.1% and 71.1%), particularly before the influence of agricultural encroachment becomes more prominent.

3.4.2. Dune Occupancy Rate and Sand Encroachment Surface

The spatial distribution of dune activity was assessed through dune occupancy rates (%) and sand encroachment surface (ha) per km2. The spatial distribution of dunal landforms within the EDF, quantified as the dune occupancy rate per km2, is illustrated in Figure 7. The overall mean dune occupancy rate for the EDF is calculated at 41%, with a standard deviation of 21.26%, confirming significant spatial variability across the field. As is visually evident in Figure 7, no simple progressive gradient of increasing or decreasing occupancy is observed from the WSW to the ENE. Instead, the EDF exhibits a distinct “mosaic” or “patchwork” structure, with juxtaposed 1 km2 cells showing highly contrasting occupancy rates. For instance, some cells display very high occupancy, exceeding 70–80% (e.g., cells with 70.3%, 81.4%, and 71.1%), while adjacent or nearby cells can have rates below 10% (e.g., 0.3%, 3.5%, and 4.3%). Despite this heterogeneity, a general SW-NE elongation of patches with higher occupancy rates can be discerned, likely reflecting the influence of the dominant W-WSW wind regime.
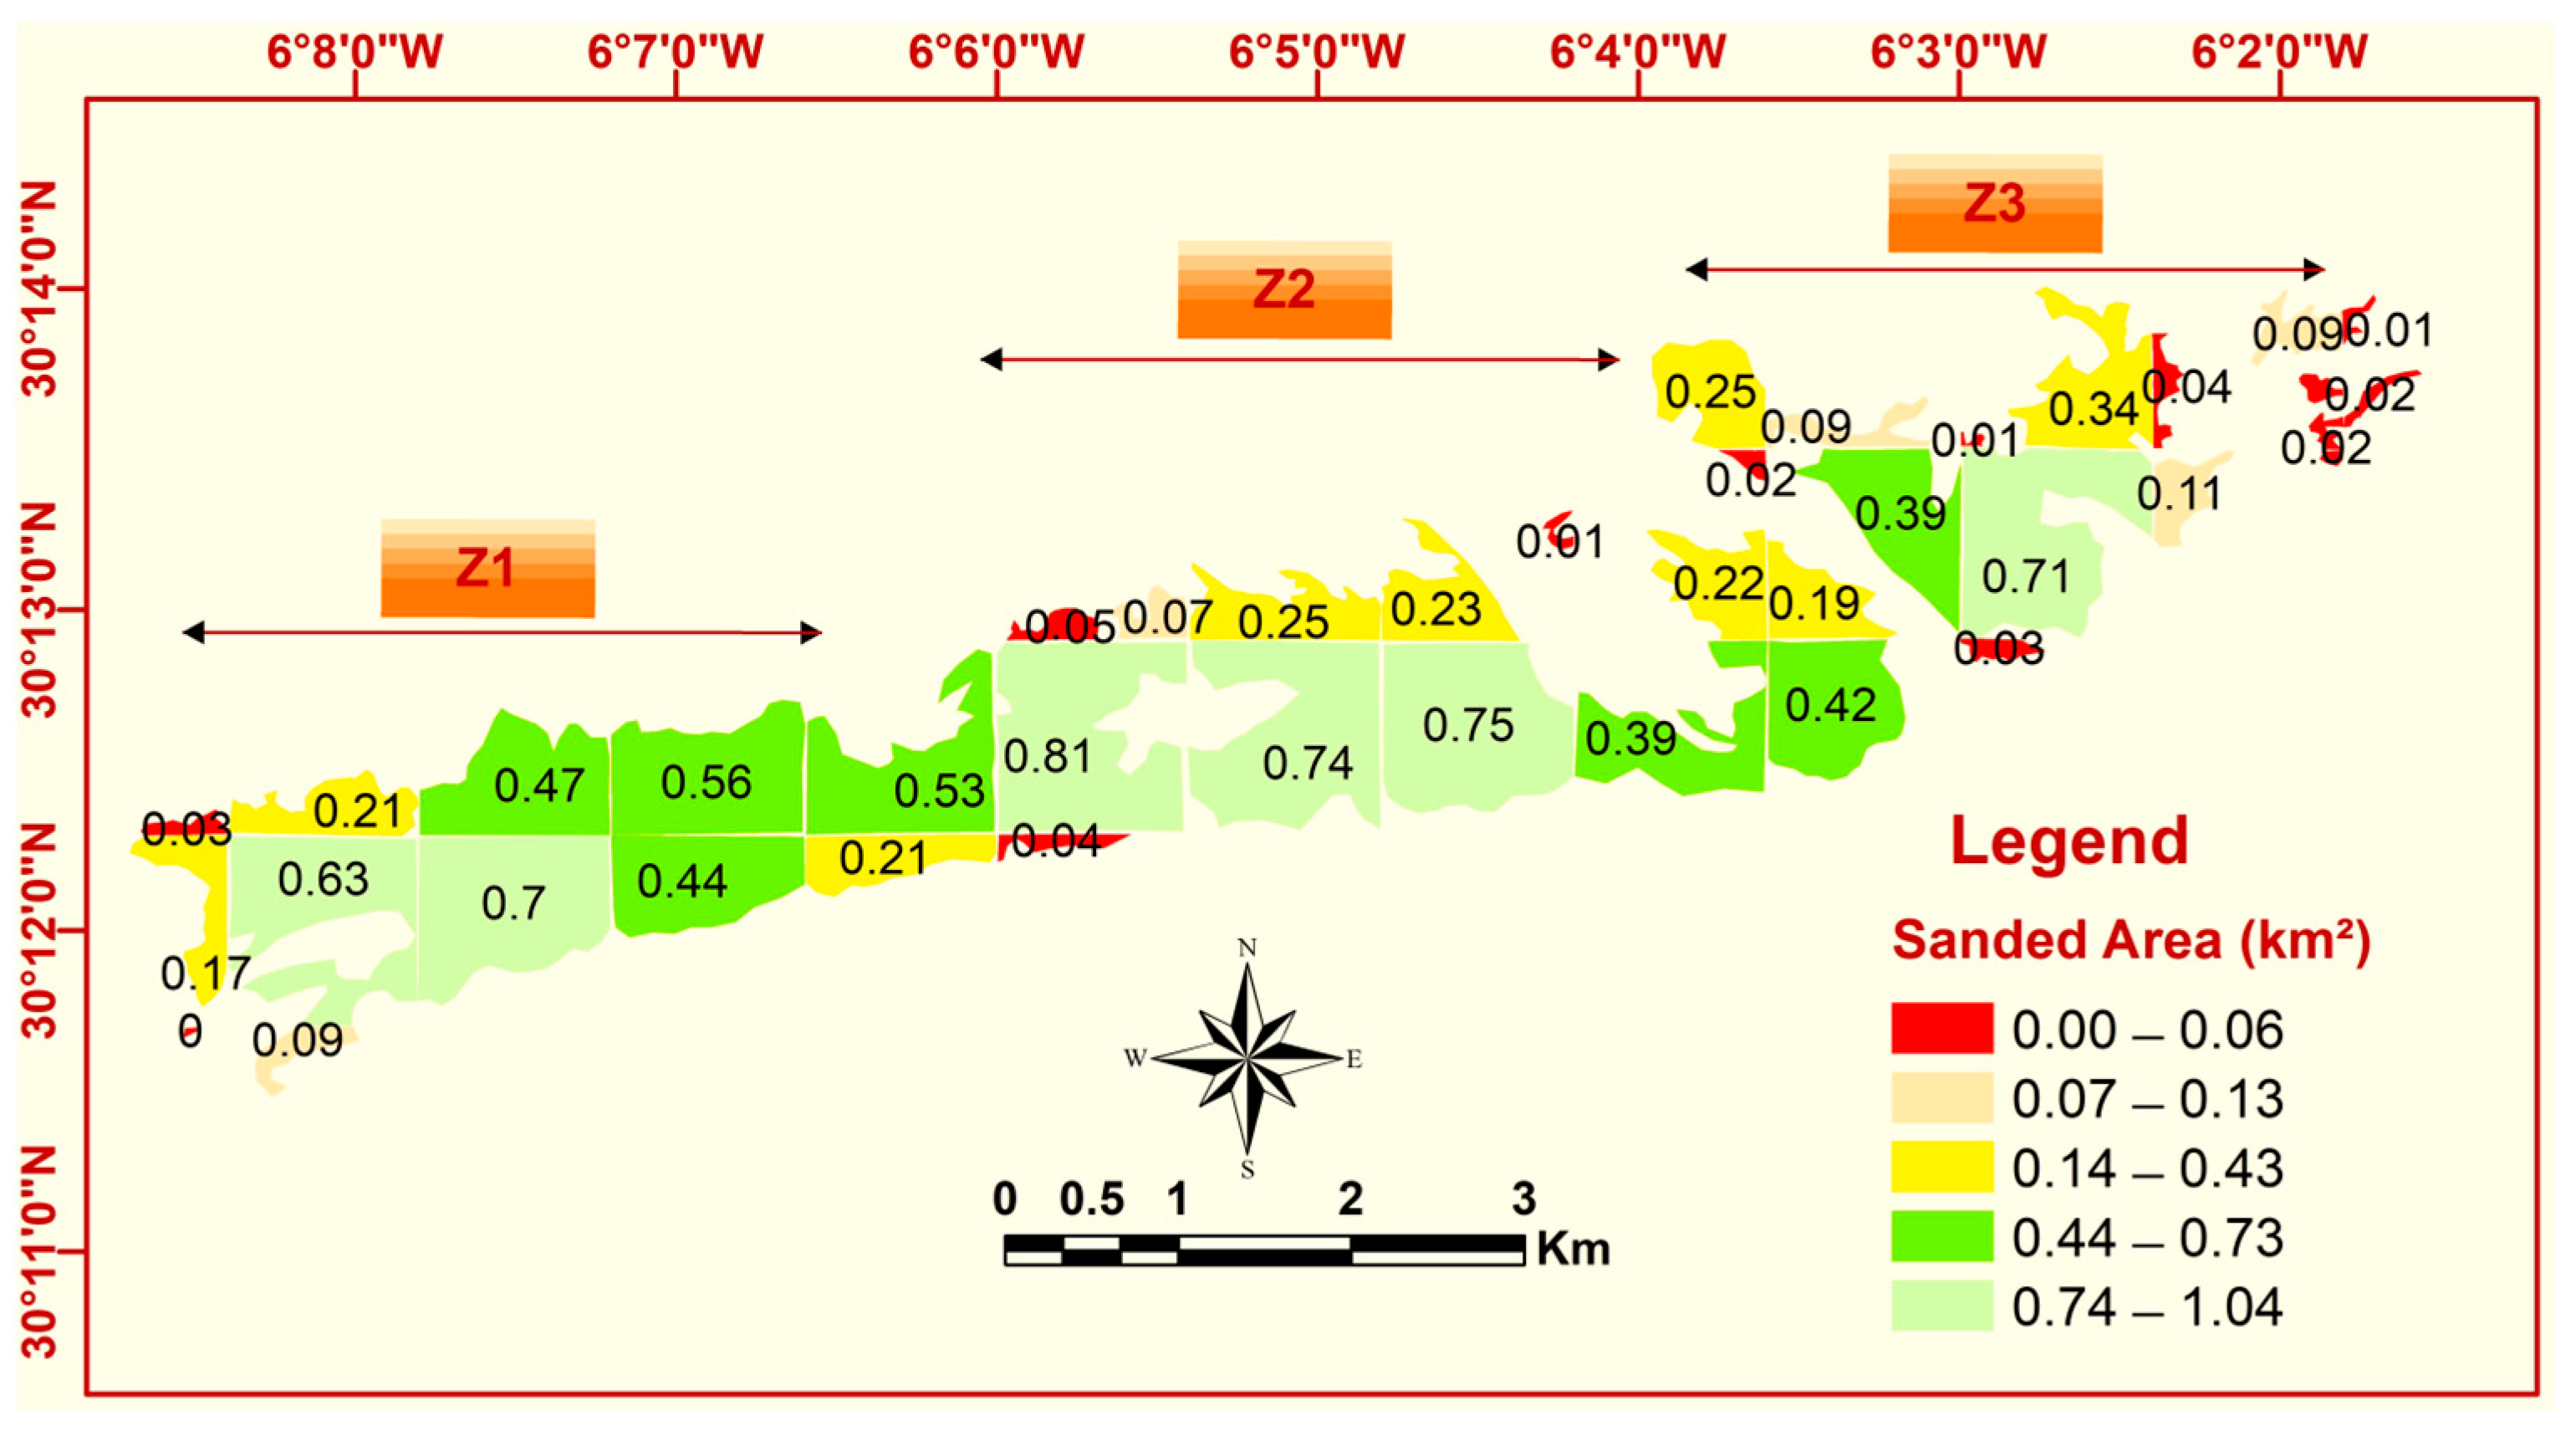
The actual sanded area per km2, representing a direct measure of sand encroachment, is depicted in Figure 7. This map reveals significant spatial heterogeneity in sand coverage across the EDF. The mean sand encroachment surface, as detailed in Table 2, varies significantly between zones: Zone Z2 exhibits the highest mean encroachment (57 ha/km2), followed by Zone Z1 (36 ha/km2) and Zone Z3 (17 ha/km2). This finding for Zone Z2 can appear counterintuitive. While several cells in this zone have very high sanded areas (e.g., 0.81 km2, 0.74 km2, and 0.75 km2; Figure 7), some representations of dune occupancy rates suggest that parts of Z2 are less densely covered by distinct dune forms (Figure 6). This difference is attributed to a few extensive 1 km2.
Figure 7 reveals a highly heterogeneous sand distribution across the three zones. Zone Z2 is characterized by the most significant sand cover, with some cells almost entirely covered and thus yielding very high absolute encroachment values. In contrast, Zone Z1 displays a more variable pattern, with sand cover ranging from low (9 ha) to high (70 ha). Finally, Zone Z3 generally presents the lowest sand cover, with many cells below 0.43 km2 (43 ha), despite the presence of localized cells with greater encroachment (up to 71 ha). These observations underscore the complex nature of sand distribution and highlight critical areas of sand accumulation, particularly in the east-central part of Zone Z1 and across large portions of Zone Z2.

3.5. Geochemical and Textural Characterization of Dunal Geo-Materials

3.5.1. Grain-Size Distribution

Representative cumulative grain-size distribution curves for dune sands and interdune sands are presented in Figure 8. Dune sands are predominantly composed of fine to medium sand, with a modal class typically centered around (150–250 µm) (Table 3). These sands are generally well sorted to moderately well sorted, as indicated by the steepness of the cumulative curves. In contrast, interdune sands (Figure 8b) exhibit a broader grain-size distribution. While also dominated by fine to medium sand, they tend to show a slightly coarser tail and/or a higher proportion of very fine sand/silt, resulting in poorer sorting compared to dune sands. This differentiation in sorting and grain size is a classic feature of active dune fields, reflecting the efficiency of wind in selectively transporting sand grains onto dune bodies while interdune areas trap coarser lag deposits and finer airborne dust [15,26].

3.5.2. Bulk Mineralogical Composition

The bulk mineralogical composition of the EDF sediments, determined by XRD analysis, is presented in Figure 9. Quartz is the overwhelmingly dominant mineral phase, with its proportion generally exceeding 40–50% and reaching up to 65% in some samples. This quartz dominance is a typical feature of mature aeolian systems, reflecting the high resistance of this mineral to weathering and abrasion [1,14]. Calcite is also a significant component, showing considerable variability with proportions ranging from approximately 12% to 20%. Feldspars, including Albite and Microcline, are present in smaller, variable amounts. Other identified minerals such as Dolomite, Magnetite, Phengite, Biotite, Muscovite, Clinoenstatite, Orthoclase, Hematite, Qenstatite, and Chamosite occur generally in trace to minor quantities, with some showing notable outliers indicating localized concentrations (Phengite and Biotite).

3.5.3. Clay Mineral Assemblage

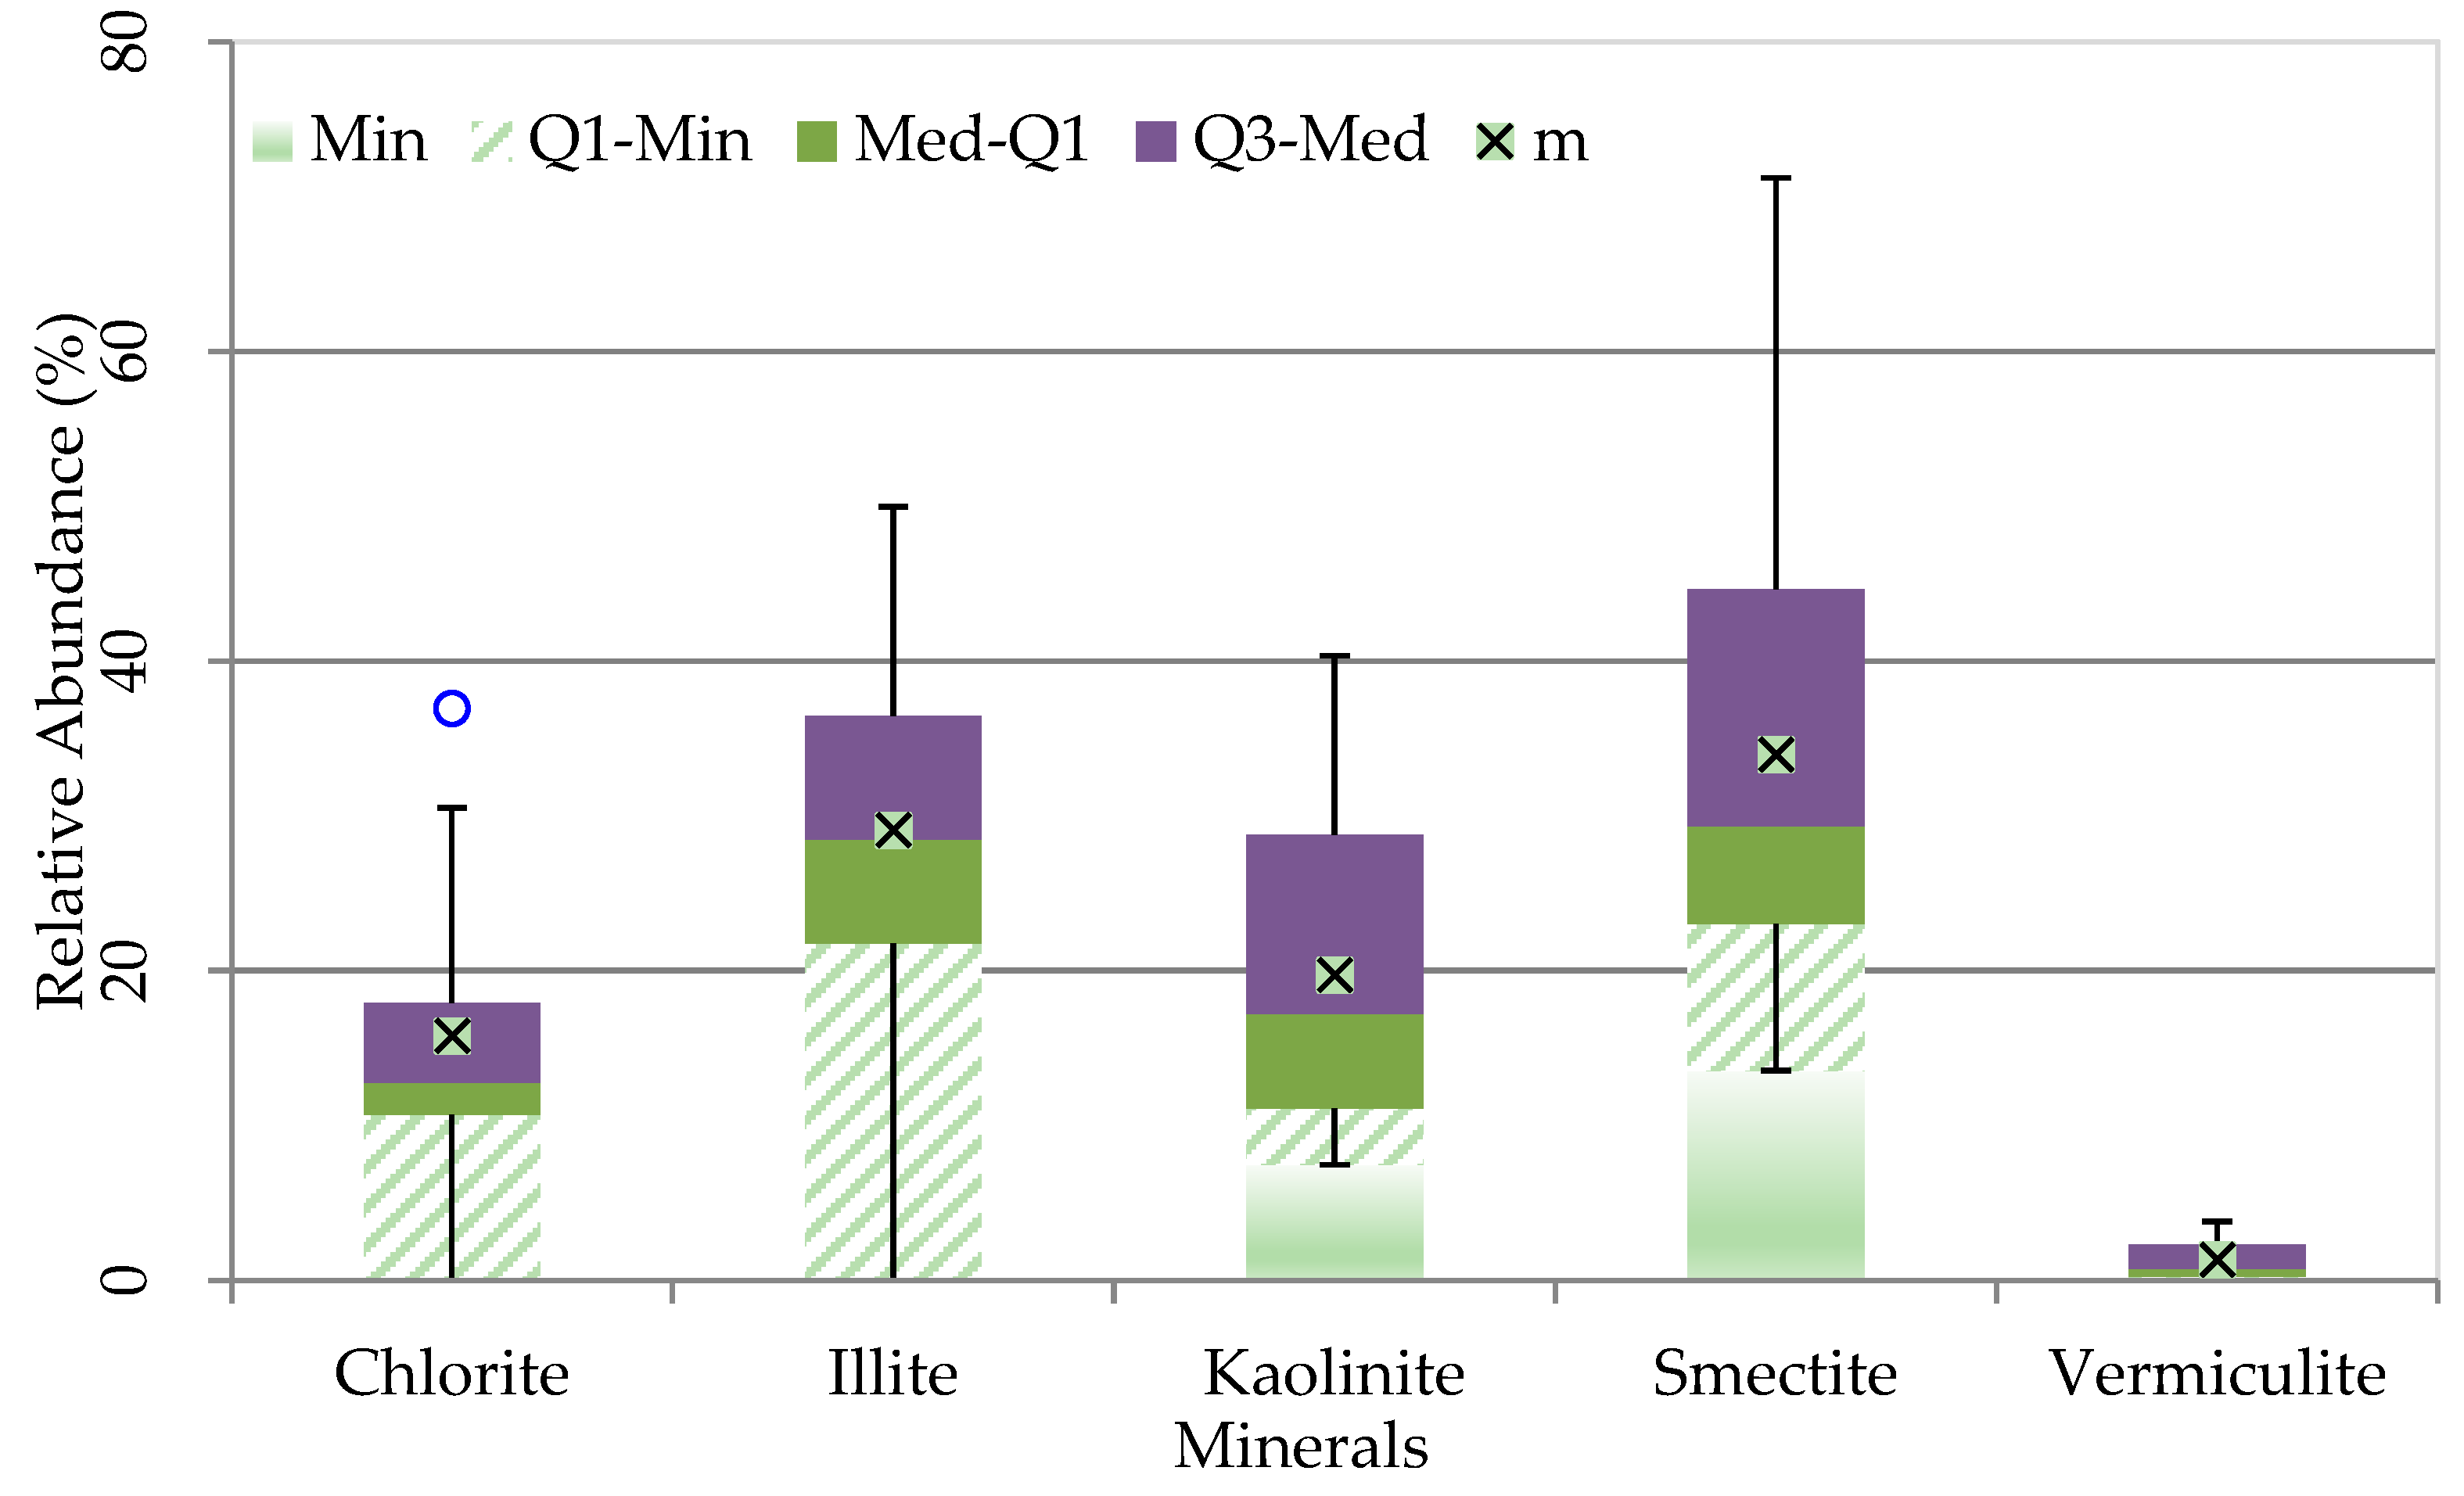
The clay mineral assemblage of the EDF sediments, identified by XRD on the fine fraction, is shown in Figure 10. The clay fraction is primarily composed of Illite and Kaolinite, which exhibit relatively similar median proportions but varying ranges. Smectite is also a significant component, showing a wider distribution and higher maximum values compared to Illite and Kaolinite in some samples, and its median appears higher. Vermiculite is present in consistently lower proportions. Chlorite is also detected, generally in minor amounts, with some variability.

3.6. Land Use and Human Activities

The interaction between the dune field and the surrounding landscape, particularly in relation to land cover and vegetation, was analyzed using both thermal and multispectral satellite imagery (Figure 11). Thermal infrared imagery (TIRS1, Figure 11a) of the Elfeija basin reveals a marked thermal contrast. The central area, corresponding to irrigated watermelon cultivation, appears cooler (darker tones) than the surrounding areas, confirming the impact of evapotranspiration and soil moisture from irrigation. Brighter (warmer) zones around the irrigated perimeter may indicate potential hydric stress. Atmospherically corrected Sentinel 2 imagery (SWIR2, NIR, and Green composite, May 2024, Figure 11b) shows the following:
  • Dominance of arid zones (pink tones for bare, sterile soil).
  • Numerous rectangular plots of bright green (irrigated agriculture, likely watermelon), with some intra-parcel variability (lighter green/yellowish, indicating variations in vegetation density or hydric stress).
  • Orange and brown zones (sparse vegetation, likely natural rangeland, or less dense crops) are predominantly at the basin’s edges. The heart of the EDF appears as homogeneous pink (bare, mobile sand) with a WSW-ENE orientation, indicating limited biological activity. A progressive transition to mixed pink and light orange (sparse vegetation) is observed on the southern border of the EDF, a likely sand source area.
  • The northeastern border, in direct contact with agricultural plots, represents the active dunal front. Qualitatively, the EDF’s natural vegetation cover is sparse, mainly outside wadi beds and small valleys, consistent with HCEF [27] descriptions of Tamarix, Zygophyllum gaetulum, Pulicaria crispa, Hammada scoparia, and Acacia tortilis subsp. raddiana communities.

3.7. Hypotheses on EDF Genesis and Evolution

The genesis and evolutionary timeline of the EDF were explored through morphometric analysis and comparison with existing models. Morphometric parameters of the Feija of Zagora valley (Table 4), including a form ratio (RF) of <0.1, a significant flare angle increase from entrance to exit, relatively low curvature (RC > 1), and asymmetry with steeper northern slopes, suggest a pronounced funnel shape conducive to the Venturi effect. This aerodynamic constriction is hypothesized to be a primary factor in the localized accumulation of sand forming the EDF. Regarding its age, an estimation based on an average dune migration rate of 12 m/year (deduced from multi-temporal satellite imagery) indicates that barchans at the 12 km long EDF front would have taken approximately 1000 years to traverse the field. This timeframe aligns closely with an age slightly below 1000 years derived from projecting the EDF’s surface area (30 km2) onto Lancaster’s [1,28] age-area model for dune fields (Figure 12a). While this timeline provides a valuable working model, it must be considered a first-order estimation that requires validation through absolute dating methods such as Optically Stimulated Luminescence (OSL). These estimations suggest a possible initiation of the EDF around 1024 AD, a period that could potentially coincide with the Medieval Climatic Optimum (Figure 12b), which is known to have caused significant climatic shifts, including in Morocco.

4. Discussion

The integrated analysis of the Elfeija Dune Field (EDF) provides significant insights into the processes governing a moderately sized, topographically controlled continental aeolian system. This discussion interprets the findings in three key areas: (1) the physical controls governing the dune field’s morphology and dynamics; (2) the sediment provenance and transport pathways that feed the system; and (3) its Holocene genesis and recent evolution under increasing anthropogenic pressure.

4.1. Controls on Dune Field Morphology and Dynamics

The morphology of the EDF is a direct expression of the interplay between a dominant wind regime, sediment supply, and strong topographic confinement. The observed WSW-ENE elongation and the prevalence of barchans and their coalescent derivatives (Table 1) are textbook responses to a unimodal effective wind regime, as confirmed by the consistently high RDP/DP ratios (≥0.78) derived from MERRA-2 data [1]. These conditions are ideal for generating transverse dune forms that migrate downwind. Furthermore, the secondary wind component from the ENE, although less effective, could explain some of the observed complexities in dune morphology, such as variations in barchan horn asymmetry, a phenomenon consistent with dune dynamics under bimodal wind regimes [30].
The distinct morphodynamic zonation (Z1, Z2, and Z3) reflects a classic downwind maturation pathway. Zone Z1 acts as an initiation area where sediment, likely sourced from nearby alluvial fans, is organized into nascent barchanoid forms. The high dune density (80–90 dunes/km2) and significant sand coverage in the central Zone Z2 are indicative of high sand flux, leading to frequent dune interactions and the formation of complex coalesced patterns, as suggested by the 32% collision probability [22,23]. This organization aligns with conceptual models where transport capacity and sediment availability modulate dune field patterns downwind [31,32,33]. Interestingly, this spatial evolution, from simple initiation forms to complex interaction patterns, shows remarkable similarities to the organizational pathways observed in other well-studied dune fields, such as the White Sands Dune Field, New Mexico [34].
Significantly, the entire system appears to be governed by a Venturi effect. The funnel-shaped morphometry of the Feija of Zagora valley (Table 4), with its decreasing width-to-depth ratio, likely channels and accelerates regional winds. This aerodynamic constriction provides the necessary energy to sustain sediment transport and maintain a highly active dune field within a confined geographical space [1]. A discrepancy was noted between the high potential sand flux calculated from wind data and the lower flux measured in the field (Figure 3). This gap underscores the complexity of real-world transport. Factors such as surface moisture, vegetation, and micro-topographic roughness likely modulate sediment mobilization. This highlights a known limitation of simplified models [21,35].

4.2. Sediment Provenance and Pathways

The sedimentological characteristics of the EDF reveal a multi-source origin and efficient aeolian sorting. The dominance of quartz, a mineral highly resistant to abrasion, points to a mature and likely polycyclic sediment source, while the significant presence of feldspars (Albite and Microcline) strongly suggests a primary provenance from the crystalline granitic and metamorphic rocks of the adjacent Anti-Atlas Massif [36,37]. The variable calcite content may reflect contributions from both the weathering of local carbonate bedrock and the reworking of older, carbonate-rich fluvial or lacustrine deposits within the Feija basin.
The clay mineral suite (Illite, Kaolinite, and Smectite) further supports a mixed origin, combining products of local rock weathering with potential long-range aeolian dust input, a common process in North African arid environments [38,39]. The presence of these clays, particularly in interdune areas, can influence sediment dynamics by increasing cohesion and moisture retention, thereby affecting erodibility [40]. The grain-size data (Figure 8) provide clear evidence of this dynamic sorting; the well-sorted, fine-to-medium sands of the dune bodies contrast sharply with the more poorly sorted interdune deposits, which trap both coarse lag material and fine airborne dust, confirming the system’s high aeolian efficiency [1,41,42].

4.3. Regional Context: The EDF in Comparison to Other Moroccan Dune Fields

To situate the EDF within a broader regional context, its characteristics were compared with three other major Moroccan aeolian systems: the Tarfaya-Laâyoune coastal dune field, Erg Chebbi, and Erg Chigaga. The key distinguishing features across these environments—the Tarfaya-Laâyoune coastal dune field, Erg Chebbi, and Erg Chigaga—are summarized in Table 5.
An analysis of these features reveals both common principles and unique local responses. A comparison with the Tarfaya-Laâyoune coastal field [43] reveals striking similarities in fundamental processes. Both systems are dominated by barchan dunes and their coalescent forms, driven by strongly unimodal wind regimes (WSW-WNW for EDF; NNW trade winds for Tarfaya-Laâyoune), confirming the universal principles of barchan formation under unidirectional winds. However, the EDF’s setting within a constrained valley contrasts with the more open coastal plain of Tarfaya, suggesting that the EDF’s high dune density and WSW-ENE elongation are strongly influenced by local topographic forcing.
In stark contrast, the large inland sand seas of Erg Chebbi and Erg Chigaga exhibit different dynamics, a common feature in major North African ergs [44]. Erg Chebbi is famous for its large star dunes (up to 150 m high), which are products of a complex, bimodal wind regime [16]. This promotes vertical sand accumulation rather than the sustained lateral transport observed at the EDF. While less studied, Erg Chigaga also presents a more complex morphology [42]. Critically, the primary anthropogenic impact on these large ergs is tourism, which involves localized disturbances. This differs fundamentally from the landscape-scale modifications at the EDF, where agricultural expansion directly alters the sediment budget and fixes dune margins.
This comparative analysis underscores that the EDF is a unique geomorphic system. While it follows known principles of barchan dynamics, it is distinguished by the combination of strong topographic control (Venturi effect) and, most importantly, its role as a key site for studying the direct impacts of agricultural encroachment on an active continental dune field.

4.4. Genesis, Holocene Evolution, and Anthropogenic Modulation

The EDF appears to be a relatively young, Holocene feature. The estimated age of approximately 1000 years, derived from both modern migration rates and Lancaster’s age-area model [1,28], suggests a potential initiation during the Medieval Climatic Optimum (~950–1250 AD). This period is known for significant climatic shifts in North Africa, and a turn towards increased aridity or altered wind patterns could have triggered the accumulation of sand in the Feija valley [30,45,46]. The hypothesis of a Holocene initiation, driven by sediment supplied from the wadi Elfeija and organized by aeolian processes, fits well within the broader context of North African dune fields, which are often linked to alluvial systems and past climatic changes [47]. The initial organization of fluvial sediments into aeolian bedforms represents a critical transition in landscape evolution [48]. While this hypothesis requires definitive confirmation through direct dating methods like OSL [8], it provides a compelling chronological framework for what is the first comprehensive investigation of the Elfeija Dune Field. The primary scope of this study was to establish a foundational understanding of the field’s morphology, dynamics, and sedimentology. This essential baseline work now provides the context needed to justify and effectively target future geochronological analyses. Placing this hypothetical age within a regional context, it aligns with a broader pattern of Holocene aeolian activity in Morocco. For instance, recent OSL dating of the Lala Lallia star dune in Erg Chebbi indicates that its rapid formation occurred within the last millennium, post-dating the African Humid Period [16]. The potential link of the EDF’s initiation to the Medieval Climatic Optimum is therefore plausible but remains a hypothesis to be tested by future geochronological work. Geomorphic indicators like crest defect density (not measured here but suggested by Bishop [3] and Lancaster [34] could, in the future, help refine the relative age of different EDF zones.
More recently, the EDF’s evolutionary trajectory is being fundamentally altered by direct anthropogenic pressures, as clearly illustrated by satellite imagery (Figure 11). The expansion of irrigated agriculture along the dune field’s margins introduces a new and significant boundary condition. These irrigated plots act as effective sediment traps, but the disturbance of the soil can also create new deflation surfaces, while increased moisture may promote more extensive revegetation. This interaction, in which human activity modifies the field’s morphodynamical trajectory, is a process well documented in coastal systems [9]. However, it deserves increased attention in arid continental contexts. The potential long-term transformation of active barchans into stabilized or parabolic forms due to vegetation colonization [48] is a plausible future pathway for the EDF margins.
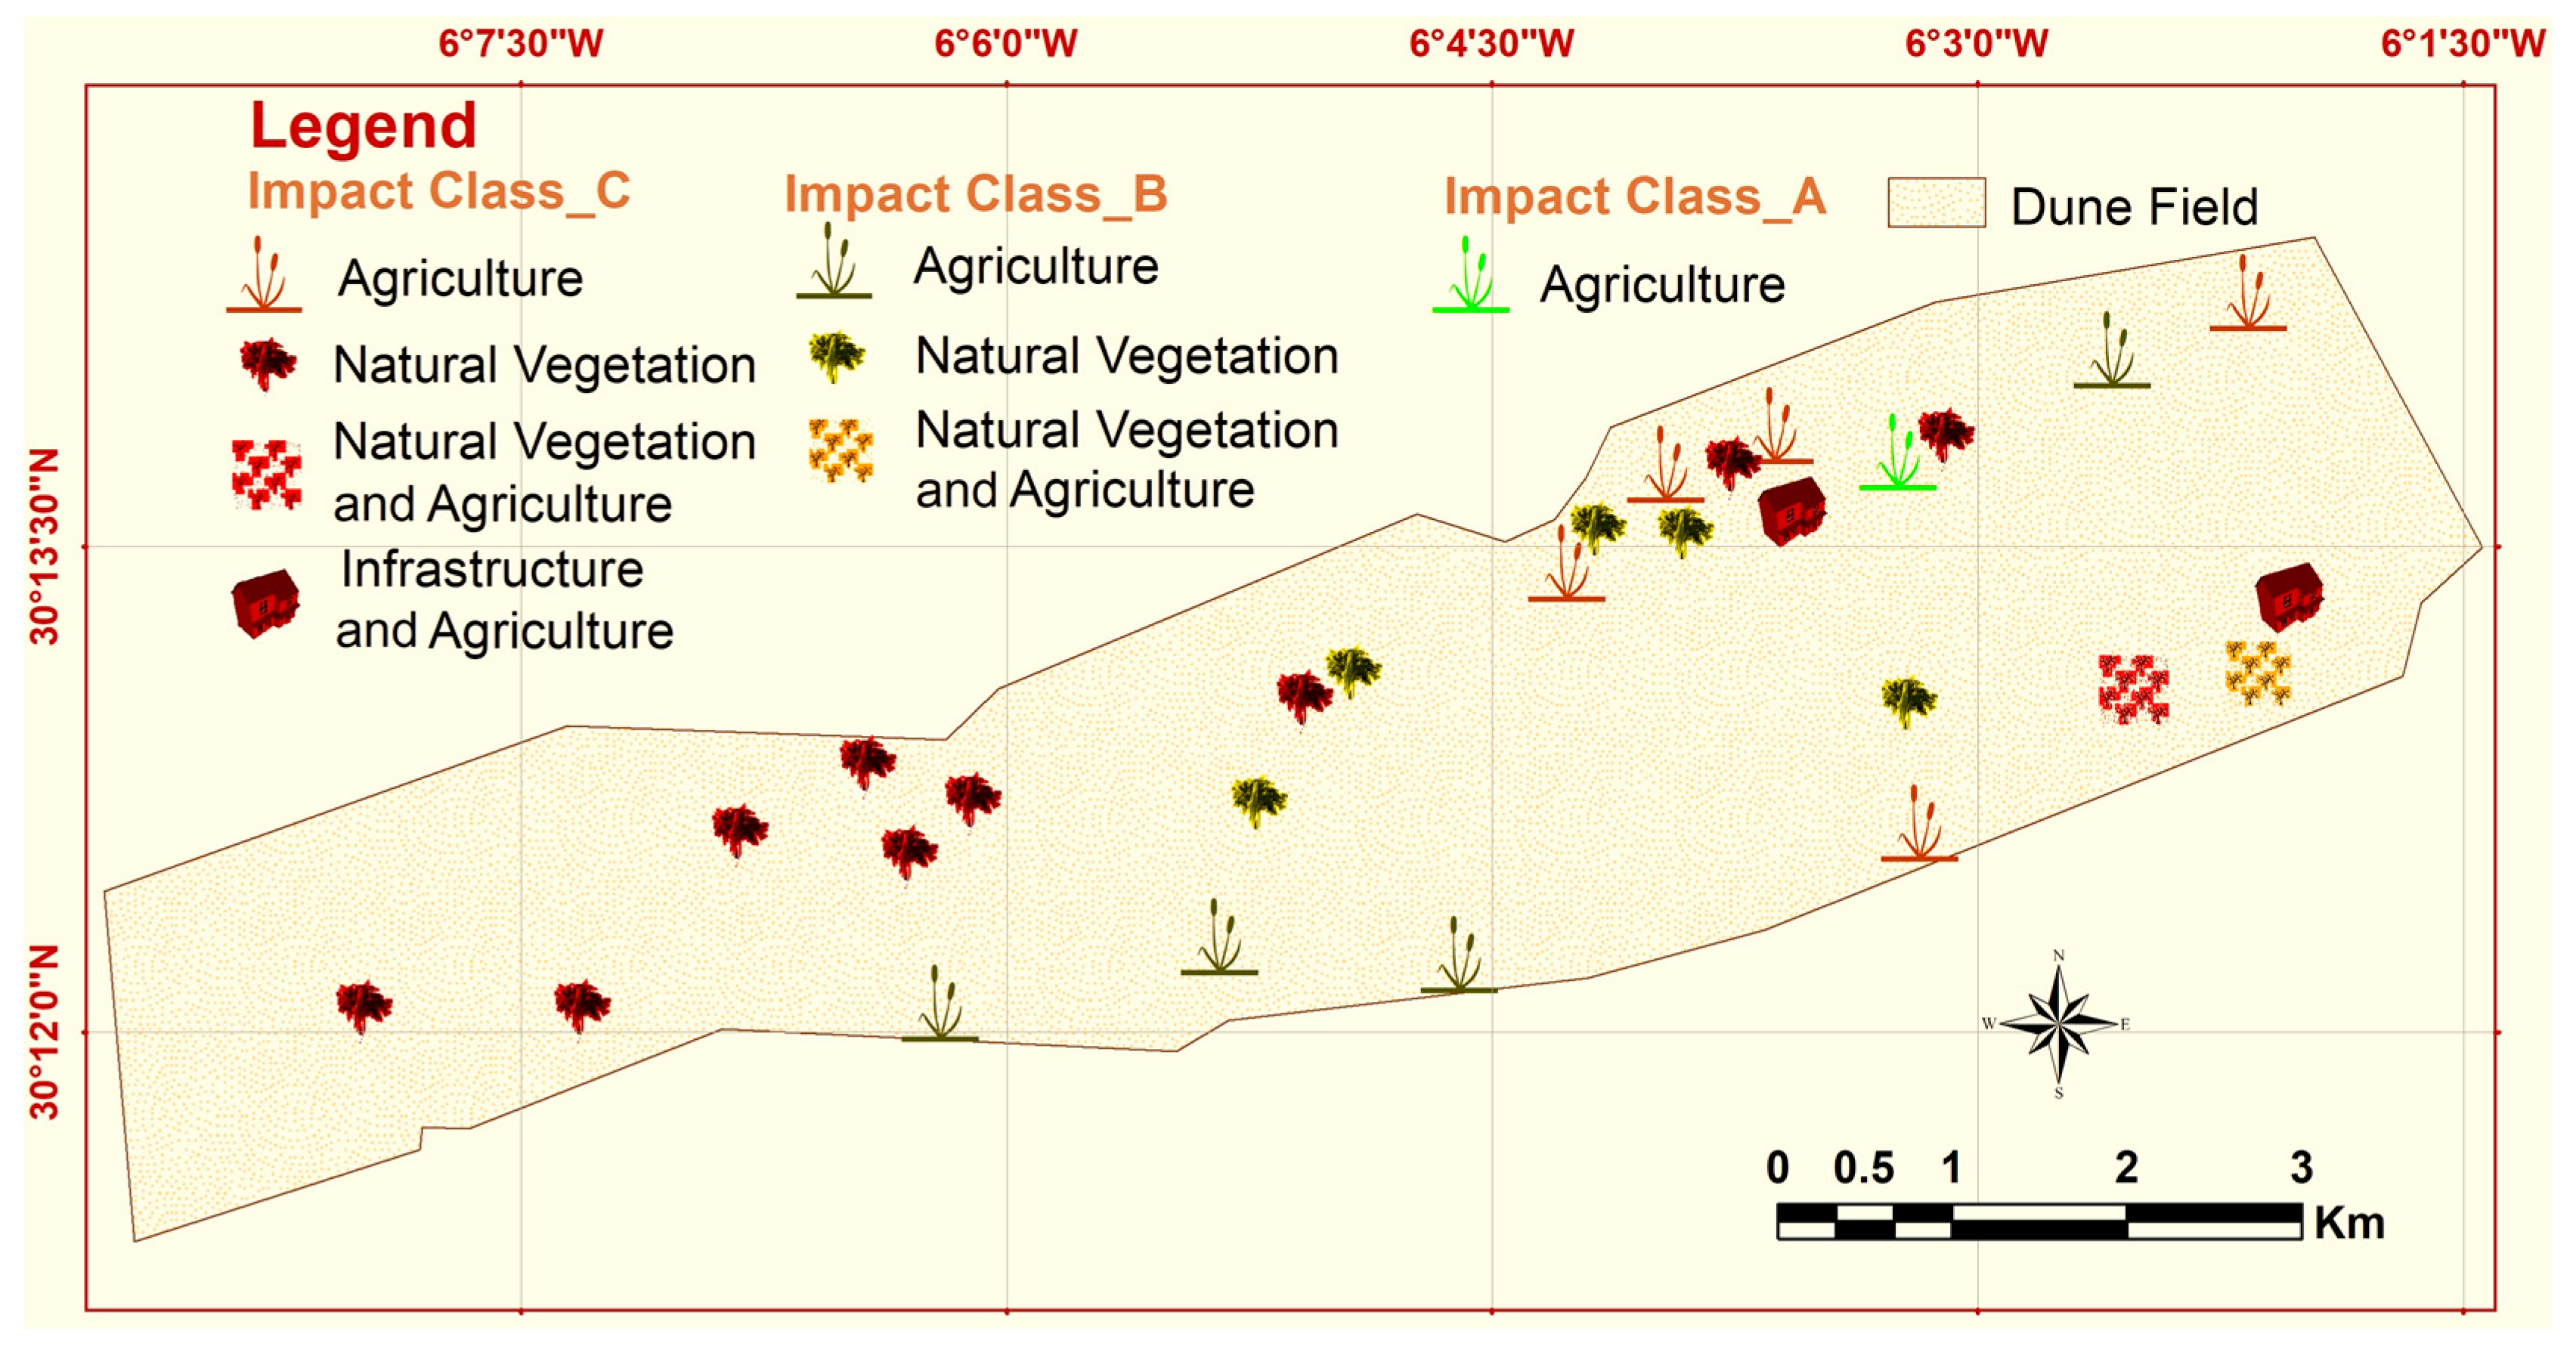
To better quantify the risks associated with this interaction, we developed a sand encroachment impact assessment. Figure 13 maps the potential impact severity based on land use type, while Table 6 details the significance of mobile dune extension classes and proposes recommended management actions. Our analysis indicates that areas of highest concern (Impact Class C) are concentrated in the central-eastern sectors, directly threatening natural vegetation corridors, while lower impact classes (A and B) are more widespread in the western and southern portions, primarily interacting with agriculture and sparse natural vegetation. This assessment provides a critical, spatially explicit tool for local land management, helping to prioritize areas where interventions are most urgently needed to mitigate desertification risks (Figure 13).
The classification of mobile dunes into four extension classes (Table 6) was used to map potential encroachment impacts across the EDF.

5. Conclusions

This comprehensive study of the Elfeija Dune Field (EDF) has provided a detailed characterization of its morphology, aeolian dynamics, land cover interactions, and probable genesis within an arid continental setting in southeastern Morocco. The key findings can be summarized as follows:
  • The EDF is an active, elongated (WSW-ENE) system of approximately 30 km2, primarily composed of barchans and their coalescent forms, indicating a dominant unidirectional or narrowly bimodal wind regime and active sediment transport. A clear morphodynamic zonation (Z1, Z2, and Z3) reflects sediment pathways from source areas to more organized downwind sectors.
  • Aeolian dynamics are significant, with a high dune density (80–90 dunes/km2 in active areas) and a calculated potential sand flux of 1.7 kg/m2/s. The estimated dune collision probability of 32% underscores the constant interaction and reorganization within the field.
  • The genesis of the EDF is strongly linked to a Venturi effect within the Feija of Zagora, creating localized conditions favorable for sand accumulation. The estimated age of approximately 1000 years suggests an initiation possibly related to climatic shifts during the Medieval Climatic Optimum.
  • Increasing anthropogenic pressure, notably the expansion of irrigated watermelon cultivation, is a significant factor influencing the EDF’s margins, altering land cover, local humidity, and potentially acting as sediment traps or sources, thereby modifying the natural dunal dynamics.
This research highlights the sensitivity of continental dune fields, such as Elfeija, to both natural geomorphological controls (topography, wind regime, and sediment supply) and accelerating human impacts. The multi-scale approach employed, combining remote sensing, DTM analysis, and targeted field observations, has proven effective in unraveling the complex interactions shaping this aeolian landscape. The findings provide a central baseline for future monitoring and contribute to a better understanding of dune system behavior in arid environments, which is essential for developing sustainable land management strategies in regions facing desertification and climate change. Further research involving direct sediment dating (OSL) and long-term monitoring of aeolian and anthropogenic influences will be vital to refine our understanding of the EDF’s evolution and its response to ongoing environmental changes.

Author Contributions

Conceptualization, R.A., B.K. and M.A.H.; methodology, R.A., B.K. and M.A.H.; software, R.A. and B.K.; validation, R.A., B.K., M.A.H., A.Q.-R. and M.A.; formal analysis, R.A., B.K. and M.A.H.; investigation, R.A. and B.K.; resources, R.A. and B.K.; data curation, R.A. and B.K.; writing—original draft preparation, R.A., B.K. and M.A.H.; writing—review and editing, A.Q.-R., Y.B. and M.A.; visualization, A.Q.-R. and M.A.; supervision, B.K.; project administration, B.K. All authors have read and agreed to the published version of the manuscript.

Funding

This research received no external funding.

Data Availability Statement

Data are contained within the article.

Acknowledgments

The authors wish to express their gratitude to Fayssal Amiha and Mostapha Lakhdar for their logistical field support, which facilitated the completion of this study. We also thank the numerous members of the Elfeija Agricultural Association for their collaboration and the relevant information provided during the survey on cultivation practices in the region. Finally, we thank the three anonymous reviewers for their constructive comments on the manuscript.

Conflicts of Interest

The authors declare no conflicts of interest.

References

  1. Lancaster, N. Geomorphology of Desert Dunes, 2nd ed.; Routledge: London, UK, 2023. [Google Scholar] [CrossRef]
  2. Lancaster, N. Sand Seas and Dune Fields. In Treatise on Geomorphology; Shroder, J.F., Ed.; Academic Press: San Diego, CA, USA, 2013; Volume 11, pp. 219–245. [Google Scholar] [CrossRef]
  3. Bishop, M.A. Dune field development, interactions and boundary conditions for crescentic and stellate megadunes of the Al Liwa basin, the Empty Quarter. Earth Surf. Process. Landf. 2013, 38, 89–101. [Google Scholar] [CrossRef]
  4. Andreotti, B.; Fourrière, A.; Ould-Kaddour, F.; Murray, B.; Claudin, P. Giant aeolian dune size determined by the average depth of the atmospheric boundary layer. Nature 2009, 457, 1120–1123. [Google Scholar] [CrossRef] [PubMed]
  5. Gunn, A.; Casasanta, G.; Di Liberto, L.; Falcini, F.; Lancaster, N.; Jerolmack, D. What sets aeolian dune height? Nat. Commun. 2022, 13, 2626. [Google Scholar] [CrossRef] [PubMed]
  6. Kocurek, G.; Havholm, K.G.; Deynoux, M.; Blakey, R.C. Amalgamated accumulations resulting from climatic and eustatic changes, Akchar Erg, Mauritania. Sedimentology 1991, 38, 751–772. [Google Scholar] [CrossRef]
  7. Goudie, A. Aeolian Anthropocene. In Landscapes of the Anthropocene with Google Earth; Springer: Cham, Switzerland, 2023; pp. 221–237. [Google Scholar] [CrossRef]
  8. Li, X.; Yan, P.; Liu, B. Geomorphological classification of aeolian-fluvial interactions in the desert region of north China. J. Arid Environ. 2020, 172, 104021. [Google Scholar] [CrossRef]
  9. Zabuz, T.A. A review of field methods to survey coastal dunes-Experience based on research from South Baltic coast. J. Coast. Conserv. 2016, 20, 175–190. [Google Scholar] [CrossRef]
  10. Shao, M.; Luo, W.; Che, X.; Hesp, P.A.; Bryant, R.G. UAV SfM based field quantification of barchan dune celerity and morphodynamics in Gonghe basin. Earth Surf. Process. Landf. 2024, 49, 2380–2404. [Google Scholar] [CrossRef]
  11. Claudin, P.; du Pont, S.C.; Narteau, C. From lab to landscape-scale experiments for the morphodynamics of sand dunes. C. R. Phys. 2024, 25, 267–295. [Google Scholar] [CrossRef]
  12. Marvin, M.C.; Lapôtre, M.G.A.; Gunn, A.; Day, M.; Soto, A. Dune interactions record changes in boundary conditions. Geology 2023, 51, 947–951. [Google Scholar] [CrossRef]
  13. Bagnold, R.A. The Physics of Blown Sand and Desert Dunes; Springer: Dordrecht, The Netherlands, 1974. [Google Scholar] [CrossRef]
  14. Pye, K.; Tsoar, H. Aeolian Sand and Sand Dunes; Springer: Berlin/Heidelberg, Germany, 2009. [Google Scholar] [CrossRef]
  15. Muhs, D.R. Evaluation of simple geochemical indicators of aeolian sand provenance: Late quaternary dune fields of North America revisited. Quat. Sci. Rev. 2017, 171, 260–296. [Google Scholar] [CrossRef]
  16. Zhu, B.Q.; Zhang, J.X.; Sun, C. Physiochemical characteristics, provenance, and dynamics of sand dunes in the arid Hexi corridor. Front. Earth Sci. 2021, 9, 728202. [Google Scholar] [CrossRef]
  17. Bristow, C.S.; Duller, G.A.T. Structure and chronology of a star dune at Erg Chebbi, Morocco, reveals why star dunes are rarely recognized in the rock record. Sci. Rep. 2024, 14, 53485. [Google Scholar] [CrossRef]
  18. Williams, M. Interactions between fluvial and eolian geomorphic systems and processes: Examples from the Sahara and Australia. CATENA 2015, 134, 4–13. [Google Scholar] [CrossRef]
  19. Fryberger, S.G.; Dean, G. Dune forms and wind regime. In A Study of Global Sand Seas; US Government Printing Office: Washington, DC, USA, 1979; pp. 137–169. [Google Scholar]
  20. Owen, P.R. Saltation of uniform grains in air. J. Fluid Mech. 1960, 20, 225–242. [Google Scholar] [CrossRef]
  21. Durán, O.; Parteli, E.J.R.; Herrmann, H.J. A continuous model for sand dunes: Review, new developments and application to barchan dunes and barchan dune fields. Earth Surf. Process. Landf. 2010, 35, 1591–1600. [Google Scholar] [CrossRef]
  22. Hersen, P.; Douady, S. Collision of barchan dunes as a mechanism of size regulation. Geophys. Res. Lett. 2005, 32, L21403. [Google Scholar] [CrossRef]
  23. Jarvis, P.A.; Narteau, C.; Rozier, O.; Vriend, N.M. The probabilistic nature of dune collisions in 2D. Earth Surf. Dyn. 2023, 11, 803–815. [Google Scholar] [CrossRef]
  24. Grohmann, C.H.; Garcia, G.P.; Affonso, A.A.; Albuquerque, R.W. Dune migration and volume change from airborne LiDAR, terrestrial LiDAR and Structure from Motion-Multi View Stereo. Comput. Geosci. 2020, 143, 104569. [Google Scholar] [CrossRef]
  25. Boemke, B.; Turki, I.; Brüll, C.; Lehmkuhl, F. Assessing complex aeolian dune field morphology and evolution with Sentinel-1 SAR imagery-Possibilities and limitations. Aeolian Res. 2023, 62, 100876. [Google Scholar] [CrossRef]
  26. Darke, I. Dynamic coastal dune restoration and spatial-temporal monitoring at the Wickaninnish dunes, Pacific Rim National Park Reserve, British Columbia, Canada. Ph.D. Thesis, University of Victoria, Victoria, BC, Canada, 2018. Available online: https://dspace.library.uvic.ca/server/api/core/bitstreams/7bf58369-3f13-4b29-81db-c0b40e52b3d4/content (accessed on 8 February 2024).
  27. HCEF. Cartographie des Zones Soumises et Vulnérables au Phénomène de l’Ensablement au Niveau de la Région Souss-Massa-Draa; Haut-Commissariat aux Eaux et Forêts et à la Lutte Contre la Désertification: Rabat, Morocco, 2015.
  28. Lancaster, N. Quaternary Dune Systems in Time, and Space: The legacy of A.T. Grove. In Geography in Britain After World War II—Nature, Climate, and the Etchings of Time; Martin, M., Damodaran, V., D’Souza, R., Eds.; Palgrave-Macmillan: Cham, Switzerland, 2019; pp. 93–114. [Google Scholar] [CrossRef]
  29. IPCC. Climate Change 2021: The Physical Science Basis. Contribution of Working Group I to the Sixth Assessment Report of the Intergovernmental Panel on Climate Change; Cambridge University Press: Cambridge, UK, 2021; Available online: https://www.ipcc.ch/report/ar6/wg1/downloads/report/IPCC_AR6_WGI_FullReport.pdf (accessed on 18 April 2024).
  30. Delorme, P.; Wiggs, G.F.S.; Baddock, M.C.; Claudin, P.; Nield, J.M.; Valdez, A. Dune initiation in a bimodal wind regime. J. Geophys. Res. Earth Surf. 2020, 125, e2020JF005757. [Google Scholar] [CrossRef]
  31. de Vries, S.; van Thiel de Vries, J.S.M.; van Rijn, L.C.; Arens, S.M.; Ranasinghe, R. Aeolian sediment transport in supply limited situations. Aeolian Res. 2014, 12, 75–85. [Google Scholar] [CrossRef]
  32. Daynac, J.; Bessin, P.; Pochat, S.; Mourgues, R.; Shumack, S. A new workflow for mapping dune features (outline, crestline and defects) combining deep learning and skeletonization from DEM-derived data. Geomorphology 2024, 463, 109369. [Google Scholar] [CrossRef]
  33. du Pont, S.C. Dune morphodynamics. C. R. Phys. 2015, 16, 118–138. [Google Scholar] [CrossRef]
  34. Ewing, R.C.; Kocurek, G. Aeolian dune interactions and dune-field pattern formation: White Sands Dune Field, New Mexico. Sedimentology 2010, 57, 1199–1219. [Google Scholar] [CrossRef]
  35. Lancaster, N. Dune Morphology and Dynamics. In Geomorphology of Desert Environments; Parsons, A.J., Abrahams, A.D., Eds.; Springer: Dordrecht, The Netherlands, 2009; pp. 557–595. [Google Scholar] [CrossRef]
  36. Muhs, D.R. Eolian Sediments and Processes. In Encyclopedia of Paleoclimatology and Ancient Environments; Gornitz, V., Ed.; Springer: Dordrecht, The Netherlands, 2009; pp. 312–319. [Google Scholar] [CrossRef]
  37. Velde, B. Composition and mineralogy of clay minerals. In Origin and Mineralogy of Clays: Clays and the Environment; Velde, B., Ed.; Springer: Berlin/Heidelberg, Germany, 1995; pp. 8–42. [Google Scholar] [CrossRef]
  38. Mountney, N.P. Aeolian stratigraphy, sedimentology and geomorphology of the southern Kalahari Desert: Implications for the palaeoclimatic record. Earth Surf. Process. Landf. 2020, 45, 1969–1991. [Google Scholar]
  39. Łopuch, M.; Jary, Z. Sand sources and migration of the dune fields in the central European Sand Belt—A pattern analysis approach. Geomorphology 2023, 439, 108856. [Google Scholar] [CrossRef]
  40. Almasrahy, M.A.; Mountney, N.P. Remote sensing of spatial variability in aeolian dune and interdune morphology in the Rub’ al-Khali, Saudi Arabia. Aeolian Res. 2013, 11, 155–170. [Google Scholar] [CrossRef]
  41. Robson, D.; Baas, A.; Annibale, A. Inference of barchan interaction properties from a comparison of theoretical modelling and observation. In Proceedings of the EGU General Assembly 2021, Online, 19–30 April 2021. Abstract EGU21-213. [Google Scholar] [CrossRef]
  42. Raack, J.; Reiss, D.; Balme, M.R.; Taj-Eddine, K.; Ori, G.G. In situ sampling of relative dust devil particle loads and their vertical grain size distributions. Astrobiology 2018, 18, 1305–1317. [Google Scholar] [CrossRef]
  43. Robson, D.; Baas, A.C.W. Barchan corridors. J. Geophys. Res. Earth Surf. 2021, 126, e2020JF005740. [Google Scholar]
  44. Bubenzer, O.; Embabi, N.S.; Ashour, M.M. Sand seas and dune fields of Egypt. Geosciences 2020, 10, 101. [Google Scholar] [CrossRef]
  45. Trouet, V. Tree-ring based May-August HAO reconstruction for Morocco (1049-2010 CE). Clim. Dyn. 2014, 43, 713–724. [Google Scholar]
  46. Thomas, D.S.G.; Bailey, R.M. Analysis of late quaternary dune field development in Asia using the accumulation intensity model. Aeolian Res. 2019, 39, 33–46. [Google Scholar] [CrossRef]
  47. Coleman, S.E.; Nikora, V.I. Fluvial dunes: Initiation, characterization, flow structure. Earth Surf. Process. Landf. 2011, 36, 39–51. [Google Scholar] [CrossRef]
  48. Mackenzie Day. Dune-Field Patterns. In Treatise on Geomorphology, 2nd ed.; Shroder, J.F., Ed.; Academic Press: Cambridge, MA, USA, 2022; Volume 7, pp. 481–495. [Google Scholar] [CrossRef]
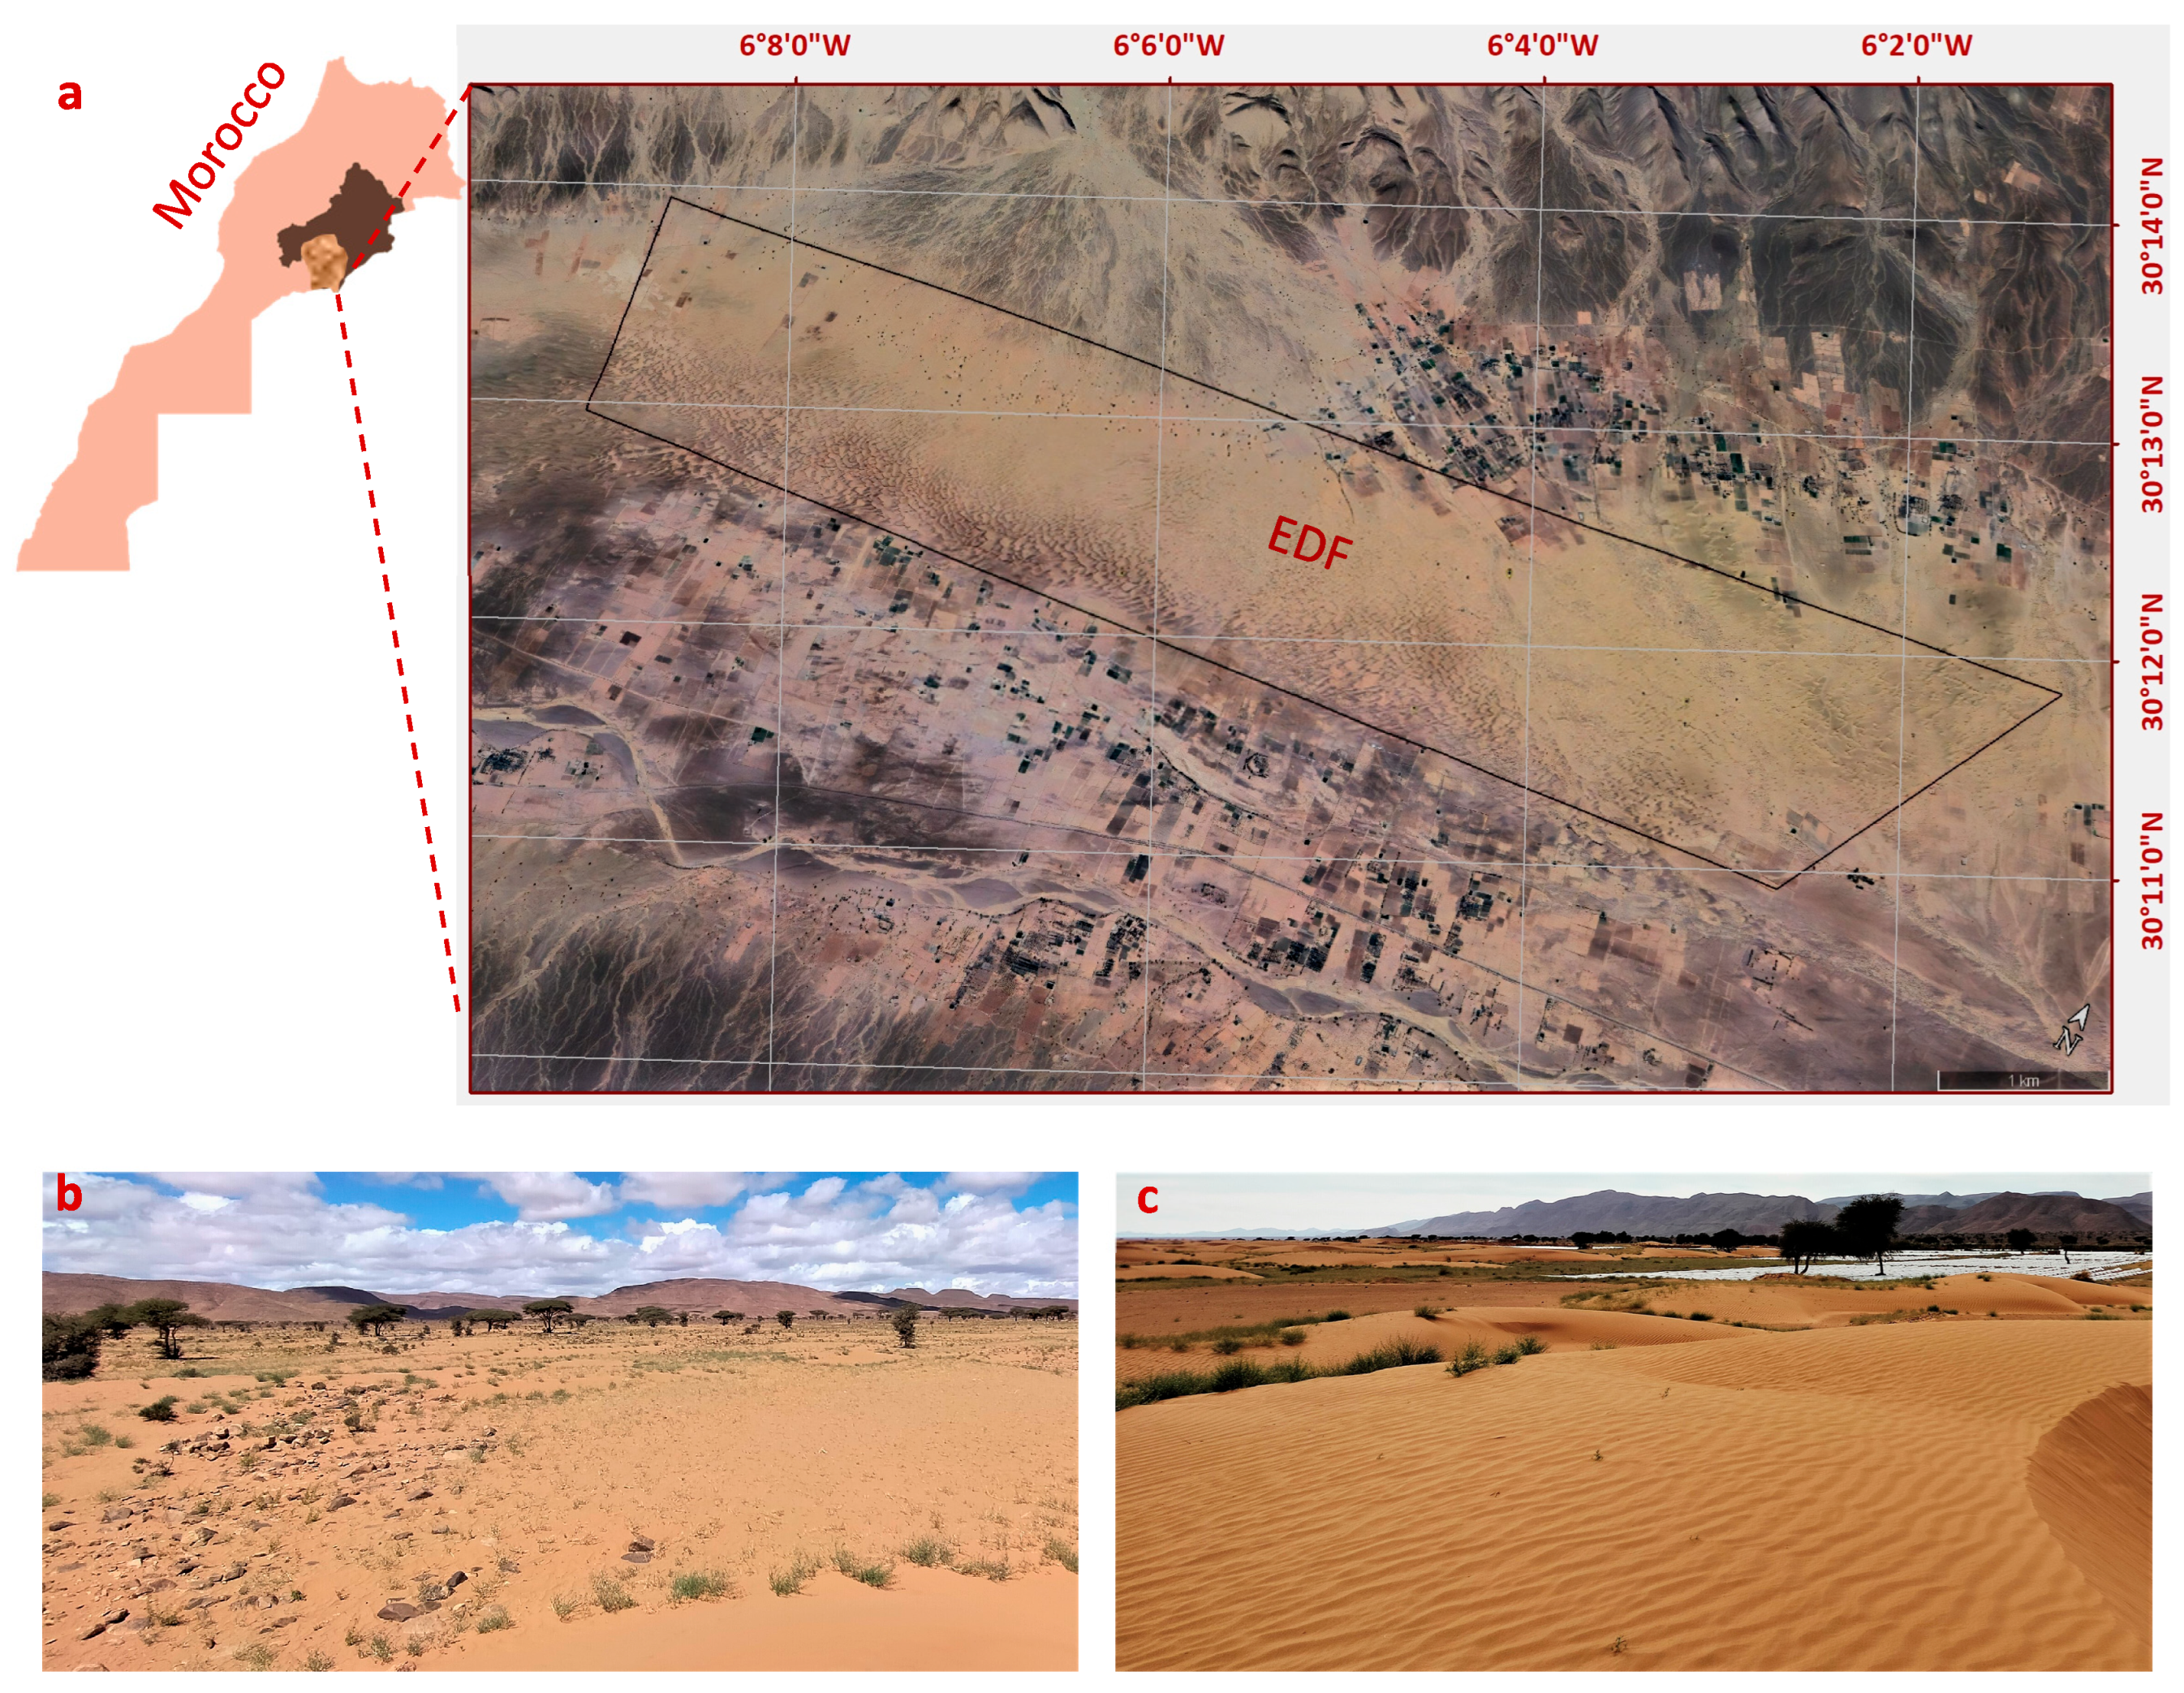
Figure 1. Geographical location and views of the Elfeija Dune Field (EDF): (a) Global aerial view. (b) Typical landscape at the periphery of an interdune area within the EDF, showing the sandy–gravelly substratum and sparse xerophytic vegetation characterized by the dominance of Vachellia tortilis subsp. raddiana. (c) Dunal area with active sandy surfaces affected by well-developed ripple marks, within which irrigated watermelon cultivation is occurring.
Earth 06 00100 g001
Figure 2. Wind regime characteristics of the Elfeija Dune Field (EDF) for 2021. Data derived from MERRA-2 reanalysis. Aeolian dynamic parameters calculated according to Fryberger & Dean [19]. (a) Annual wind rose; (b) monthly aeolian dynamic parameters.
Earth 06 00100 g002
Figure 3. Field methods for sand flux estimation in the Elfeija Dune Field. (a) Example of a trench sand trap (33 m × 0.3 m × 0.3 m, lined with plastic sheeting) installed in front of a barchan dune crest. (b) Aeolian ripple marks on a dune surface, a common bedform used for comparative sand flux estimations.
Earth 06 00100 g003
Figure 4. Topographic profiles across the Elfeija Dune Field (EDF): (a) Longitudinal profile along the WSW-ENE axis (N70° E), illustrating the overall gentle slope and macro-undulations across the dune field. (b) Transverse profile along the NW-SE axis (N130° E), highlighting the concave cross-sectional morphology of the field (extracted from the DTM derived from Google Earth altimetry data, 2024).
Earth 06 00100 g004
Figure 5. Morphodynamic zonation and dunal features of the Elfeija Dune Field (EDF). From VHR satellite imagery (30 cm resolution). (a) Zone 1, the upstream initiation area, where darker-toned sand sheets give rise to nascent barchans (Scale 1:10,000). (b) Disorganized or degrading barchan dunes in Zone Z2, modified by the effects of ephemeral torrential flows (Scale 1:10,000). (c) Barchan dune fusion and collision interactions within Zone Z2, exemplified at points bk1 and bk2 (Scale 1:5000). (d) Interaction with vegetation obstacles north of Zone 2, leading to nebkha formation and more disorganized dunes (Scale 1:2500). (e) Zone Z3, illustrating the prevalence of smaller, isolated barchan dunes and extensive interdune areas marked by linear tracks (Scale 1:4500). (f) Sediment input from the Elfeija wadi, showing dunal forms emerging from the dry riverbed at the southern boundary of the dune field (Scale 1:2500).
Earth 06 00100 g005
Figure 6. (a) VHR satellite imagery (30 cm resolution) overlaid with a 1 km × 1 km grid (example shown in the high-density areas of the EDF). (b) Spatial distribution of dune occupancy rate (%) per km2 across the Elfeija Dune Field (EDF). Classes represent the percentage of each 1 km2 grid cell covered by dunal forms, indicating areas of higher and lower dune concentration and activity.
Earth 06 00100 g006
Figure 7. Spatial distribution of sanded area (km2)/km2 across the Elfeija Dune Field (EDF). Color classes represent the absolute surface covered by sand within each 1 km2 grid cell.
Earth 06 00100 g007
Figure 8. Representative grain-size distribution curves for (a) a typical dune sand sample and (b) a typical interdune sand sample from the Elfeija Dune Field (n = 55 samples, 2023). Graphs show cumulative frequency (blue) and frequency distribution (orange).
Earth 06 00100 g008
Figure 9. Boxplot distribution of bulk mineralogical composition in Elfeija Dune Field (EDF) sediments (n = 55 samples, 2023). The plot shows the median (horizontal line), interquartile range (IQR, the box), and whiskers extending to 1.5 times the IQR. Outliers are shown as individual points.
Earth 06 00100 g009
Figure 10. Boxplot distribution of clay mineral composition in Elfeija Dune Field (EDF) sediments (n = 55 samples, 2023). The plot shows the median (horizontal line), interquartile range (IQR, the box), and whiskers extending to 1.5 times the IQR. Outliers are shown as individual points.
Earth 06 00100 g010
Figure 11. Remote sensing and ground views of the Elfeija Dune Field (EDF) and surrounding agricultural encroachment. (a) Thermal infrared image showing the cooler signature of the EDF (darker central band) amidst warmer surrounding terrain. (b) Sentinel 2 false-color composite, highlighting irrigated agricultural plots (bright green) encroaching upon and surrounding the sparsely vegetated (pink/brown) dune field. (c) Google Earth view of a large, stabilized, or relic dune form adjacent to the active EDF, showing evidence of past aeolian activity (Scale bar = 8 m). (d) Google Earth view showing the intricate pattern of active barchanoid dunes of the EDF close to gridded agricultural fields. (e) Ground photograph illustrating intensive watermelon cultivation practices.
Earth 06 00100 g011
Figure 12. Age estimation and paleoclimatic context for the Elfeija Dune Field (EDF) genesis: (a) Allometric relationship between dune field area and age, with EDF projection [1,29]. (b) Reconstructed Northern Hemisphere temperature anomalies over the last 2000 years [29]. The x-axis label “Years before present” is retained from the original source; however, the numerical tick marks represent calendar years (AD).
Earth 06 00100 g012
Figure 13. Potential impacts of sand encroachment within the Elfeija Dune Field. Different land uses (agriculture and infrastructure) and natural vegetation types are categorized into three impact severity classes (A: low, B: moderate, and C: high) based on their interaction with, or vulnerability to, dunal processes. Classification criteria are detailed in the text (Table 6).
Earth 06 00100 g013
Table 1. Illustration of dune morphodynamic motifs within the Elfeija Dune Field (EDF).
PatternsDescription
Earth 06 00100 i001Asymmetric “fat” barchan (c/a ≈ 1.15): form controlled by directional wind distribution; elongated leeward horn conforms to the dominant wind (DW).
Earth 06 00100 i002Convex sand formation under unidirectional wind regime: features an elongated dextral horn non-conformant with DW, likely due to gravitational effects; slightly asymmetrical.
Earth 06 00100 i003“Normal” barchanoid dihedral (a/c ≈ 0.68): symmetrical, often isolated in marginal interdune areas or at the Z1 front.
Earth 06 00100 i004Highly asymmetric barchan: frequently observed throughout the EDF, particularly in northern sections; the stoss slope is tightly arcuate, while the leeward horn elongates considerably (potentially up to 100 m) in the dominant wind direction.
Earth 06 00100 i005Elongate barchanoid dihedral (a/c ≈ 0.2): rarely present in the EDF landscape; often associated with sections where dunal passages are eroding.
Earth 06 00100 i006Isolated “fat” barchan (c/a ≈ 1.1): slightly asymmetrical, with obtuse and unequal horns in thickness and length; represents the most generalized barchan form.
Earth 06 00100 i007Dome dunes: subcircular to elongated elliptical sand mounds, rarely exceeding one meter in height and lacking slip faces; indicative of conditions with low sand supply.
Earth 06 00100 i008Linear dunes: sparsely observed within the EDF.
Table 2. Quantitative analysis of sand encroachment by zone in the EDF.
ZoneNumber of Grid Cells
(1 Km2 Each)
Total Sand Area
(Km2)
Mean Sand Area
(ha/Km2)
Z1124.3036
Z273.9657
Z381.3617
Table 3. Granulometric indicators of field sands.
VariableUnitObservationsMinimumMaximumAverageStandard Deviation
Meanµm55148.56442.82203.3757.76
Sorting-551.332.411.540.27
Skewness-55−0.540.22−0.140.13
Kurtosis-550.551.521.050.19
Mean grain size is reported in micrometers (µm). Sorting, Skewness, and Kurtosis are dimensionless indices derived from calculations on the phi (φ) scale.
Table 4. Morphometric parameters of the Feija of Zagora valley and implications for the Venturi effect.
ParameterDescriptive Values and Interpretation
Overall morphologyEarth 06 00100 i009
Form ratio (RF)Ratio of valley width to depth, decreasing from entrance to exit:
-
Valley Entrance RF = 0.2 (VM, 0.25) (VM: Mean valley);
-
Valley Exit RF = 0.06 (VM, 0.05);
-
RF < 0.1 indicates a pronounced funnel shape, enhancing the Venturi effect.
Flare angleAngle formed by the valley walls relative to the longitudinal axis, generally increasing from entrance to exit:
-
Valley Entrance: 2° degrees (VM, 5°);
-
Valley Exit: 9° degrees (VM, 15°).
A flare angle approaching 10° suggests rapid valley widening, which can amplify the Venturi effect.
Curvature (RC)Curvature of the valley walls, generally increasing from entrance to exit:
-
Mean RC = 1.8 km (VM, 1.5 km); RC > 1; moderately straight valley walls allow for more regular airflow and a stronger Venturi effect.
SymmetryAsymmetrical, with steeper slopes on the northern side of the valley. Valley wall asymmetry can create additional zones of wind convergence and divergence, reinforcing the Venturi effect.
LengthBird’s-eye length: 80 km. Sufficient valley length allows the Venturi effect to fully develop and intensify along the Feija.
Table 5. Comparative analysis of key characteristics of the Elfeija Dune Field (EDF) and other major Moroccan aeolian systems (H = height; W = width. RDP/DP is the Resultant Drift Potential to total Drift Potential ratio, an index of wind direction variability).
CharacteristicElfeija Dune Field (EDF)Tarfaya-Laâyoune FieldErg ChebbiErg Chigaga
Location and
Setting
SE Morocco; intracontinental plateau, topographically constrained.SW Morocco; Atlantic coastal plain.SE Morocco; unconstrained basin near Merzouga.SE Morocco; large depression south of Djebel Bani.
Dune TypesPredominantly barchans and coalescent barchanoid ridges.Barchan corridors and isolated barchans [41,43].Large complex star dunes and linear (Seif) dunes [16].Complex transverse, barchanoid, and likely star dunes.
Dominant Wind RegimeUnimodal (WSW-WNW). RDP/DP ≈ 0.78–0.85.Unimodal (NNW trade winds). RDP/DP ≈ 0.9.Bimodal (SW Sirocco and NE Chergui) [16].Complex/multimodal, influenced by regional winds and local topography.
Scale and
Dimensions
Field: ~30 km2. Dune H: ~2.5 m; W: ~30 m.Field: >100 km long. Dune W: 40–125 m.Field: ~150 km2. Dune H: up to 150 m.Field: ~300 km2. Dune H: up to 150 m.
GranulometryFine to medium sand (150–250 µm). Quartz-dominated with significant calcite.Fine sand, peak at 175 µm. Quartz and calcite [41,43].Not specified; likely well-sorted fine sand.1–2 mm (35%),125–250 µm (33%) [42]; likely well-sorted sand.
Primary
Natural Control
Topographic channeling enhancing a unidirectional wind.Strong, persistent unidirectional trade wind regime.Bimodal wind regime promoting vertical accretion.Large sediment supply and complex wind interactions.
Dominant
Anthropogenic Impact
Intensive agricultural expansion at dune margins, altering sediment budget.Limited due to remoteness; some localized infrastructure.High-impact tourism alters surfaces and local dynamics.Moderate tourism, less accessible.
Table 6. Significance of mobile dune extension classes and recommended actions.
ClassesSignificance and Recommended Actions
Class (A)
0–25%
-
The presence of mobile dunes represents a low direct impact on the immediate environment.
-
Monitoring the evolution of these zones is important, as drought and sand encroachment can favor their expansion.
-
Preventive measures against sand encroachment, such as the planting of adapted vegetation, should be prioritized.
Class (B)
25–50%
-
The presence of mobile dunes begins to have a notable impact on the environment.
-
Agricultural areas and infrastructure are threatened by erosion and sand encroachment.
-
Interventions are necessary to stabilize the dunes and limit their expansion.
Class (C)
50–75%
-
The impact of mobile dunes is significant.
-
Local ecosystems are threatened by sand encroachment.
-
Urgent protection interventions are required.
Class (D)
>75%
-
The impact of mobile dunes is major.
-
A risk of massive sand encroachment threatens inhabited areas and infrastructure.
-
Large-scale actions are necessary to stabilize the dunes and limit sand encroachment.
Disclaimer/Publisher’s Note: The statements, opinions and data contained in all publications are solely those of the individual author(s) and contributor(s) and not of MDPI and/or the editor(s). MDPI and/or the editor(s) disclaim responsibility for any injury to people or property resulting from any ideas, methods, instructions or products referred to in the content.