1. Introduction
Soil erosion is a pressing environmental issue that significantly undermines global land productivity, water quality, and ecosystem sustainability. It is a dynamic process influenced by natural factors such as rainfall intensity, topography, soil properties, and anthropogenic activities, including deforestation, overgrazing, and unsustainable agricultural practices. Runoff-induced soil loss presents a significant ecological challenge, impacting approximately 56% of the Earth’s surface, with human-induced soil degradation exacerbating the problem [
1]. Soil erosion takes various forms, with rill and inter-rill erosion being common types of water erosion, involving the detachment, transport, and relocation of soil particles into deposition areas. This process adversely affects soil quality and reduces the productivity of susceptible lands [
1]. Although geomorphological processes can contribute to soil erosion, human activities are the primary drivers of the process. Factors such as rapid population growth, deforestation, inappropriate land cultivation, and overgrazing have accelerated soil erosion, particularly in developing countries [
2]. The rapid transformation of land use due to intensive agricultural practices in the Ethiopian and Eritrean highlands has led to heightened soil erosion rates [
3]. Furthermore, a combination of factors, including slope length–steepness, climate change, land cover patterns, and soil intrinsic properties, renders soil particles more susceptible to erosion.
Like many other countries, Eritrea is particularly affected by soil erosion due to its geomorphological setting, arid and semiarid conditions, erodible soils, and torrential and irregular rainfall patterns [
4]. Ref. [
4] has examined causes, consequences, and mitigation strategies for dealing with soil erosion. The expansion of agriculture, deforestation, overgrazing, and improper land management practices are the primary drivers of soil erosion in the country. Agricultural expansion and over-cultivation of marginal lands directly affect agricultural productivity [
5]. Additionally, soil erosion contributes to the release of carbon from soils into the atmosphere, potentially affecting climate change [
6]. Hence, mitigating soil erosion in Eritrea requires urgent actions and specific implementation strategies. This requires government policies and incentives, including land use planning and soil conservation programs. Similarly, local knowledge and community participation play a crucial role in the success of such initiatives [
7].
Despite the widespread use of RUSLE for erosion assessment, its integration with field-based soil quality indicators, such as SOM, remains limited, particularly in data-scarce environments like Eritrea. This study aims to bridge this gap not only by modeling soil erosion spatially using RUSLE and GIS but also by exploring the relationship between modeled erosion risk and observed SOM content in the Mai Nefhi watershed. Accordingly, the study seeks to answer the research question: “How does the spatially estimated soil erosion relate to SOM across varying land uses and topographic conditions in the Mai Nefhi watershed, and how could this be linked to crop productivity?”
2. Materials and Methods
2.1. Why Use RUSLE?
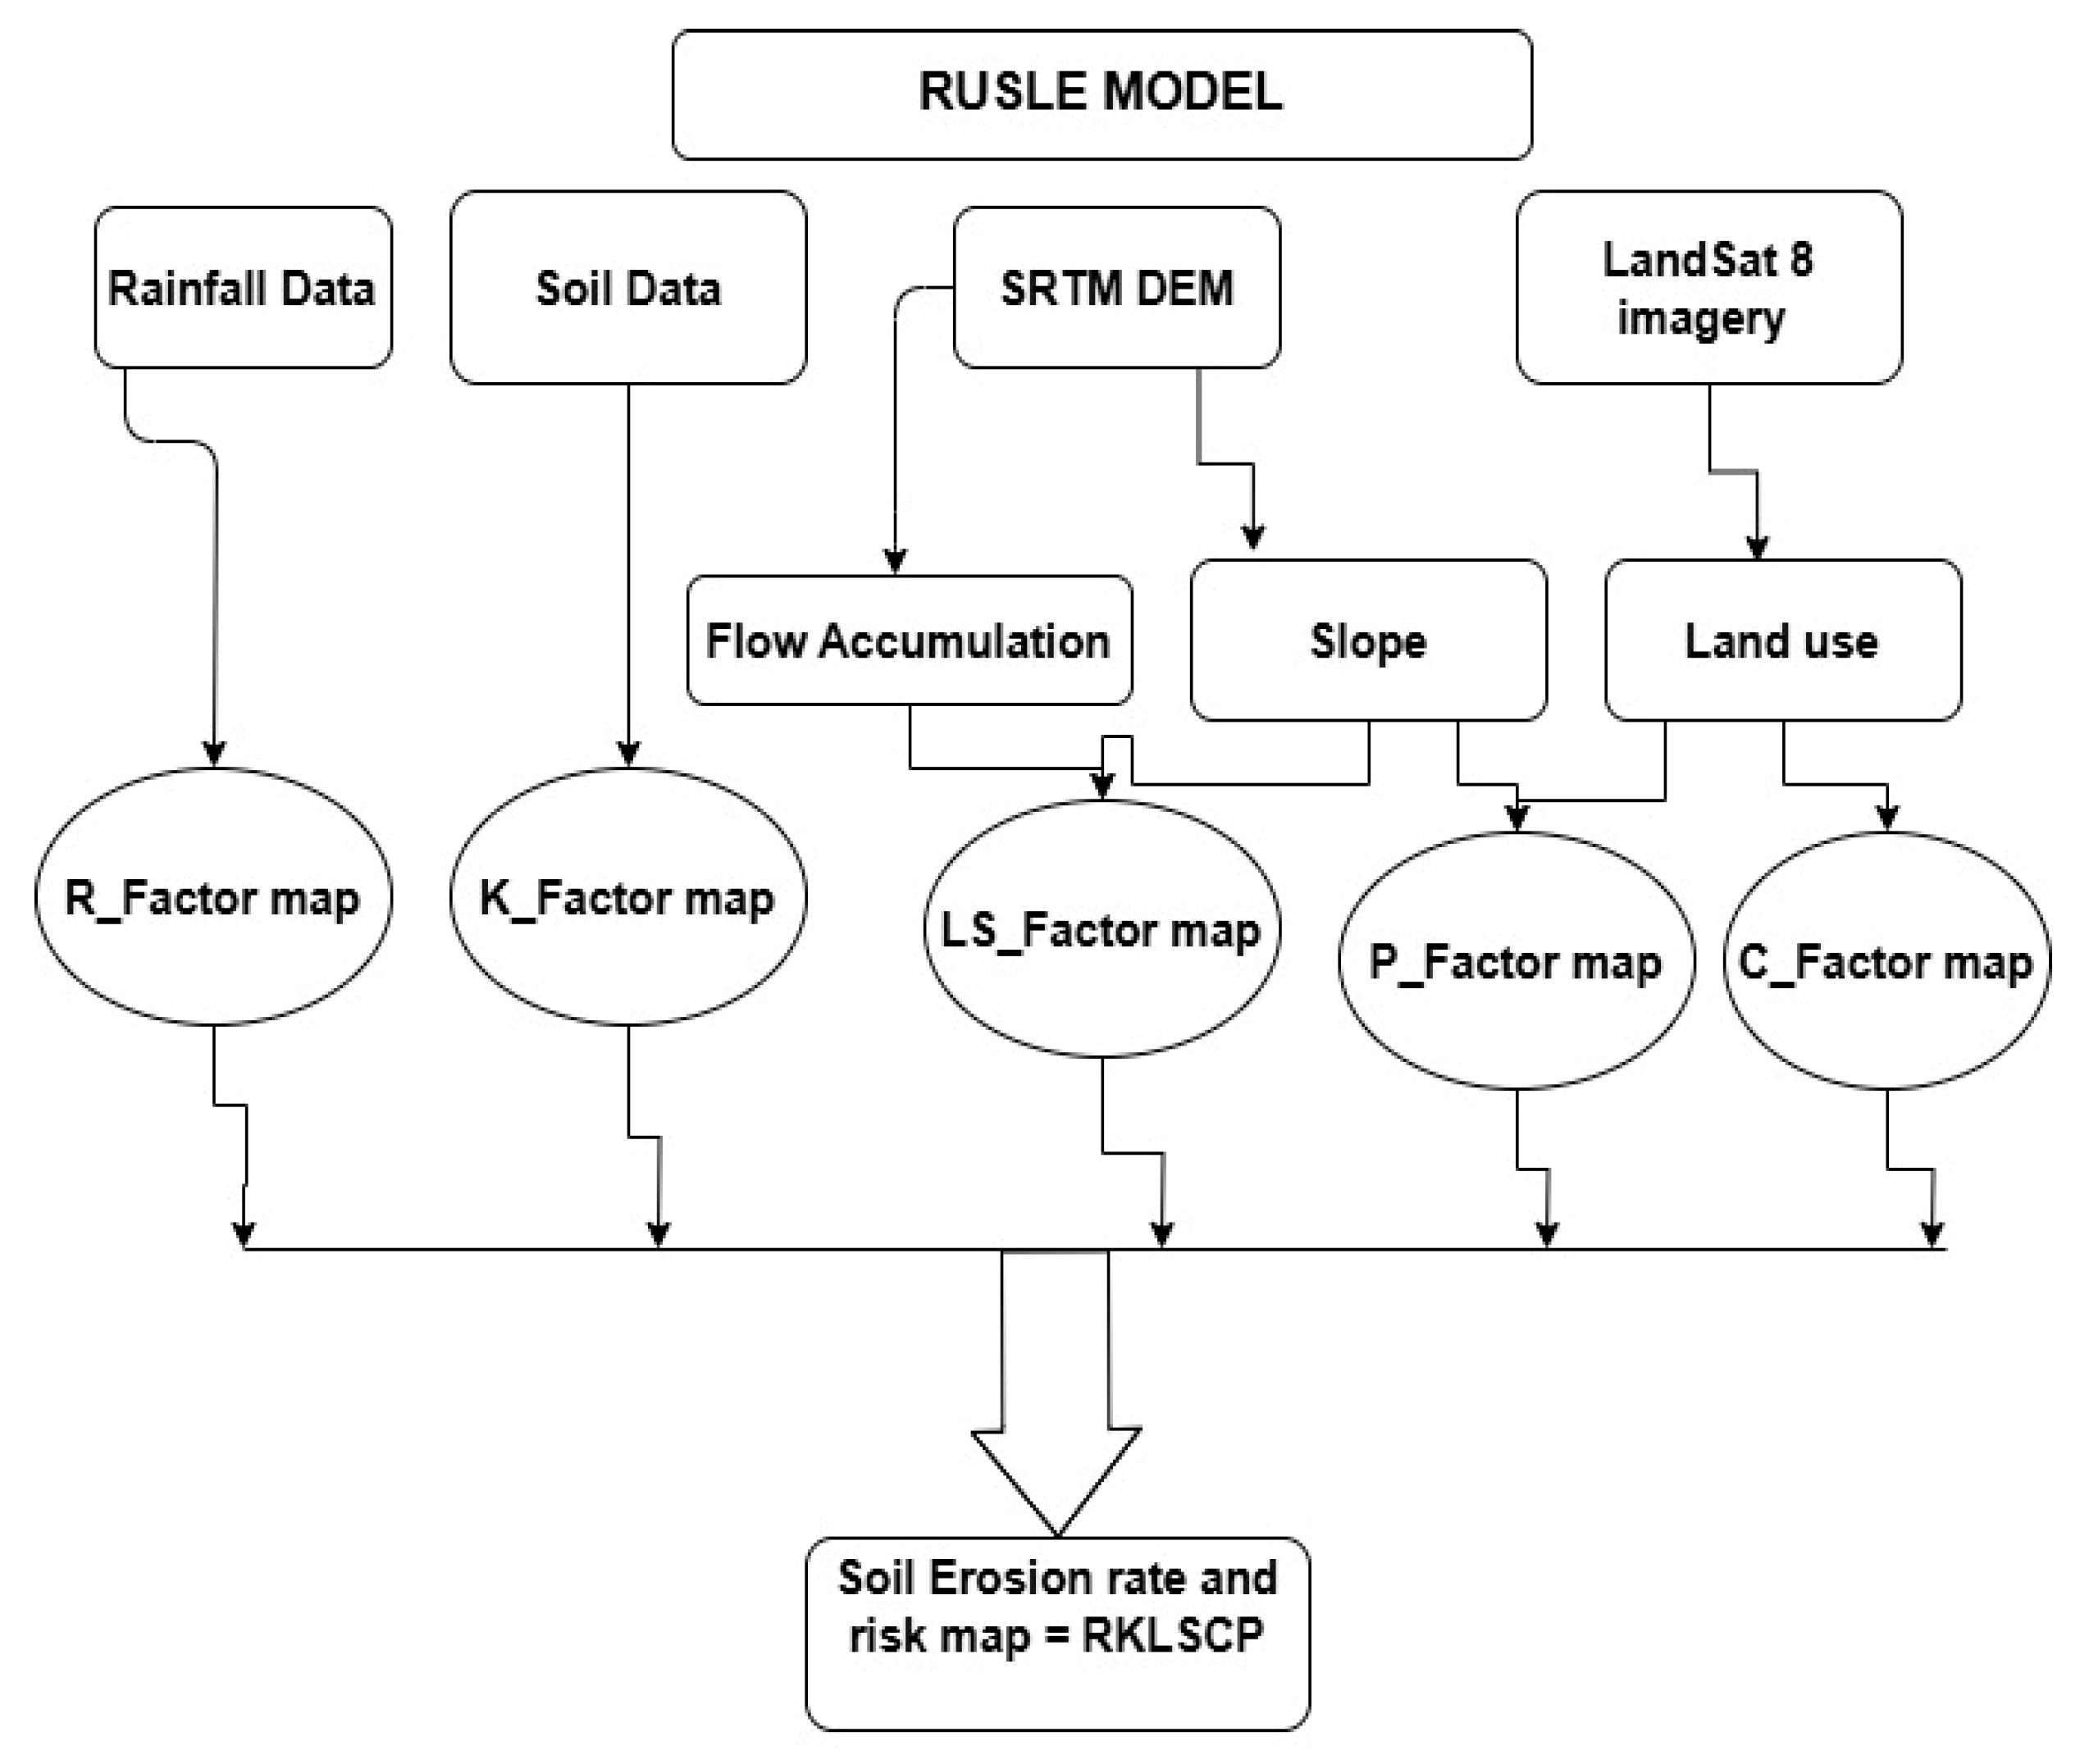
The Revised Universal Soil Loss Equation (RUSLE) model, integrated with Geographic Information System (GIS) and remote sensing (RS) techniques, has emerged as a powerful method for assessing soil erosion risks (SERs). This combination provides a cost-effective and spatially explicit alternative to field-based measurements, enabling comprehensive evaluations of soil erosion patterns at various scales [
8]. The RUSLE model estimates erosion based on rainfall erosivity (R), soil erodibility (K), slope length and slope steepness (LS), cover management (C), and conservation practices (P).
The applicability of the RUSLE–GIS technique in addressing soil erosion has been globally validated by numerous studies. For instance, Ref. [
9] applied the RUSLE model in the Blue Nile Basin, Ethiopia, estimating a soil loss rate of up to 125 t ha
−1 yr
−1 in vulnerable areas. Similarly, Ref. [
10] utilized this approach in Kenya’s Upper Tana Basin, identifying regions with soil loss rates exceeding 100 t ha
−1 yr
−1. Other notable studies, such as those conducted by [
10] in Kenya’s central highlands and [
11] in India’s Western Ghats, further highlight the model’s versatility in diverse topographical and climatic conditions. These studies underscore the effectiveness of RUSLE in guiding soil conservation efforts and mitigating erosion risks.
Soil erosion is a pressing concern in Eritrea, particularly in the study area, where agricultural productivity is crucial to meet food demand for the local population. However, very limited to no research combining GIS and RS with RUSLE has been conducted in the country, as there are hardly any studies available to demonstrate the intensity and impact on the livelihoods of local communities. This lack of research presents a significant gap in understanding the soil erosion dynamics within the country. This study, therefore, will fill for the first time a critical knowledge gap by providing a spatially explicit assessment of SERs in highly vulnerable areas. Additionally, this research introduces an innovative perspective by combining GIS and RS techniques with RUSLE in a data-scarce environment, showcasing the scalability and cost-effectiveness of these tools in regions where field-based soil erosion assessment is logistically and financially challenging (
Figure 1). Moreover, our findings have practical implications, as they provide baseline data that can be used to extend similar methodologies to other watersheds or national-scale assessments in Eritrea and beyond. This research also sets a precedent for the use of advanced geospatial techniques to inform evidence-based conservation planning and sustainable land management, making it a pioneering effort in this field. The study area was selected based on its variability, which is characteristic of Eritrean conditions, and was the target of the Ministry of Agriculture (MOA) for research using different techniques. The study also serves as a test case; if GIS-based RUSLE application SER assessment proves successful, the MOA intends to also apply it to other areas with similar conditions.
2.2. Study Area
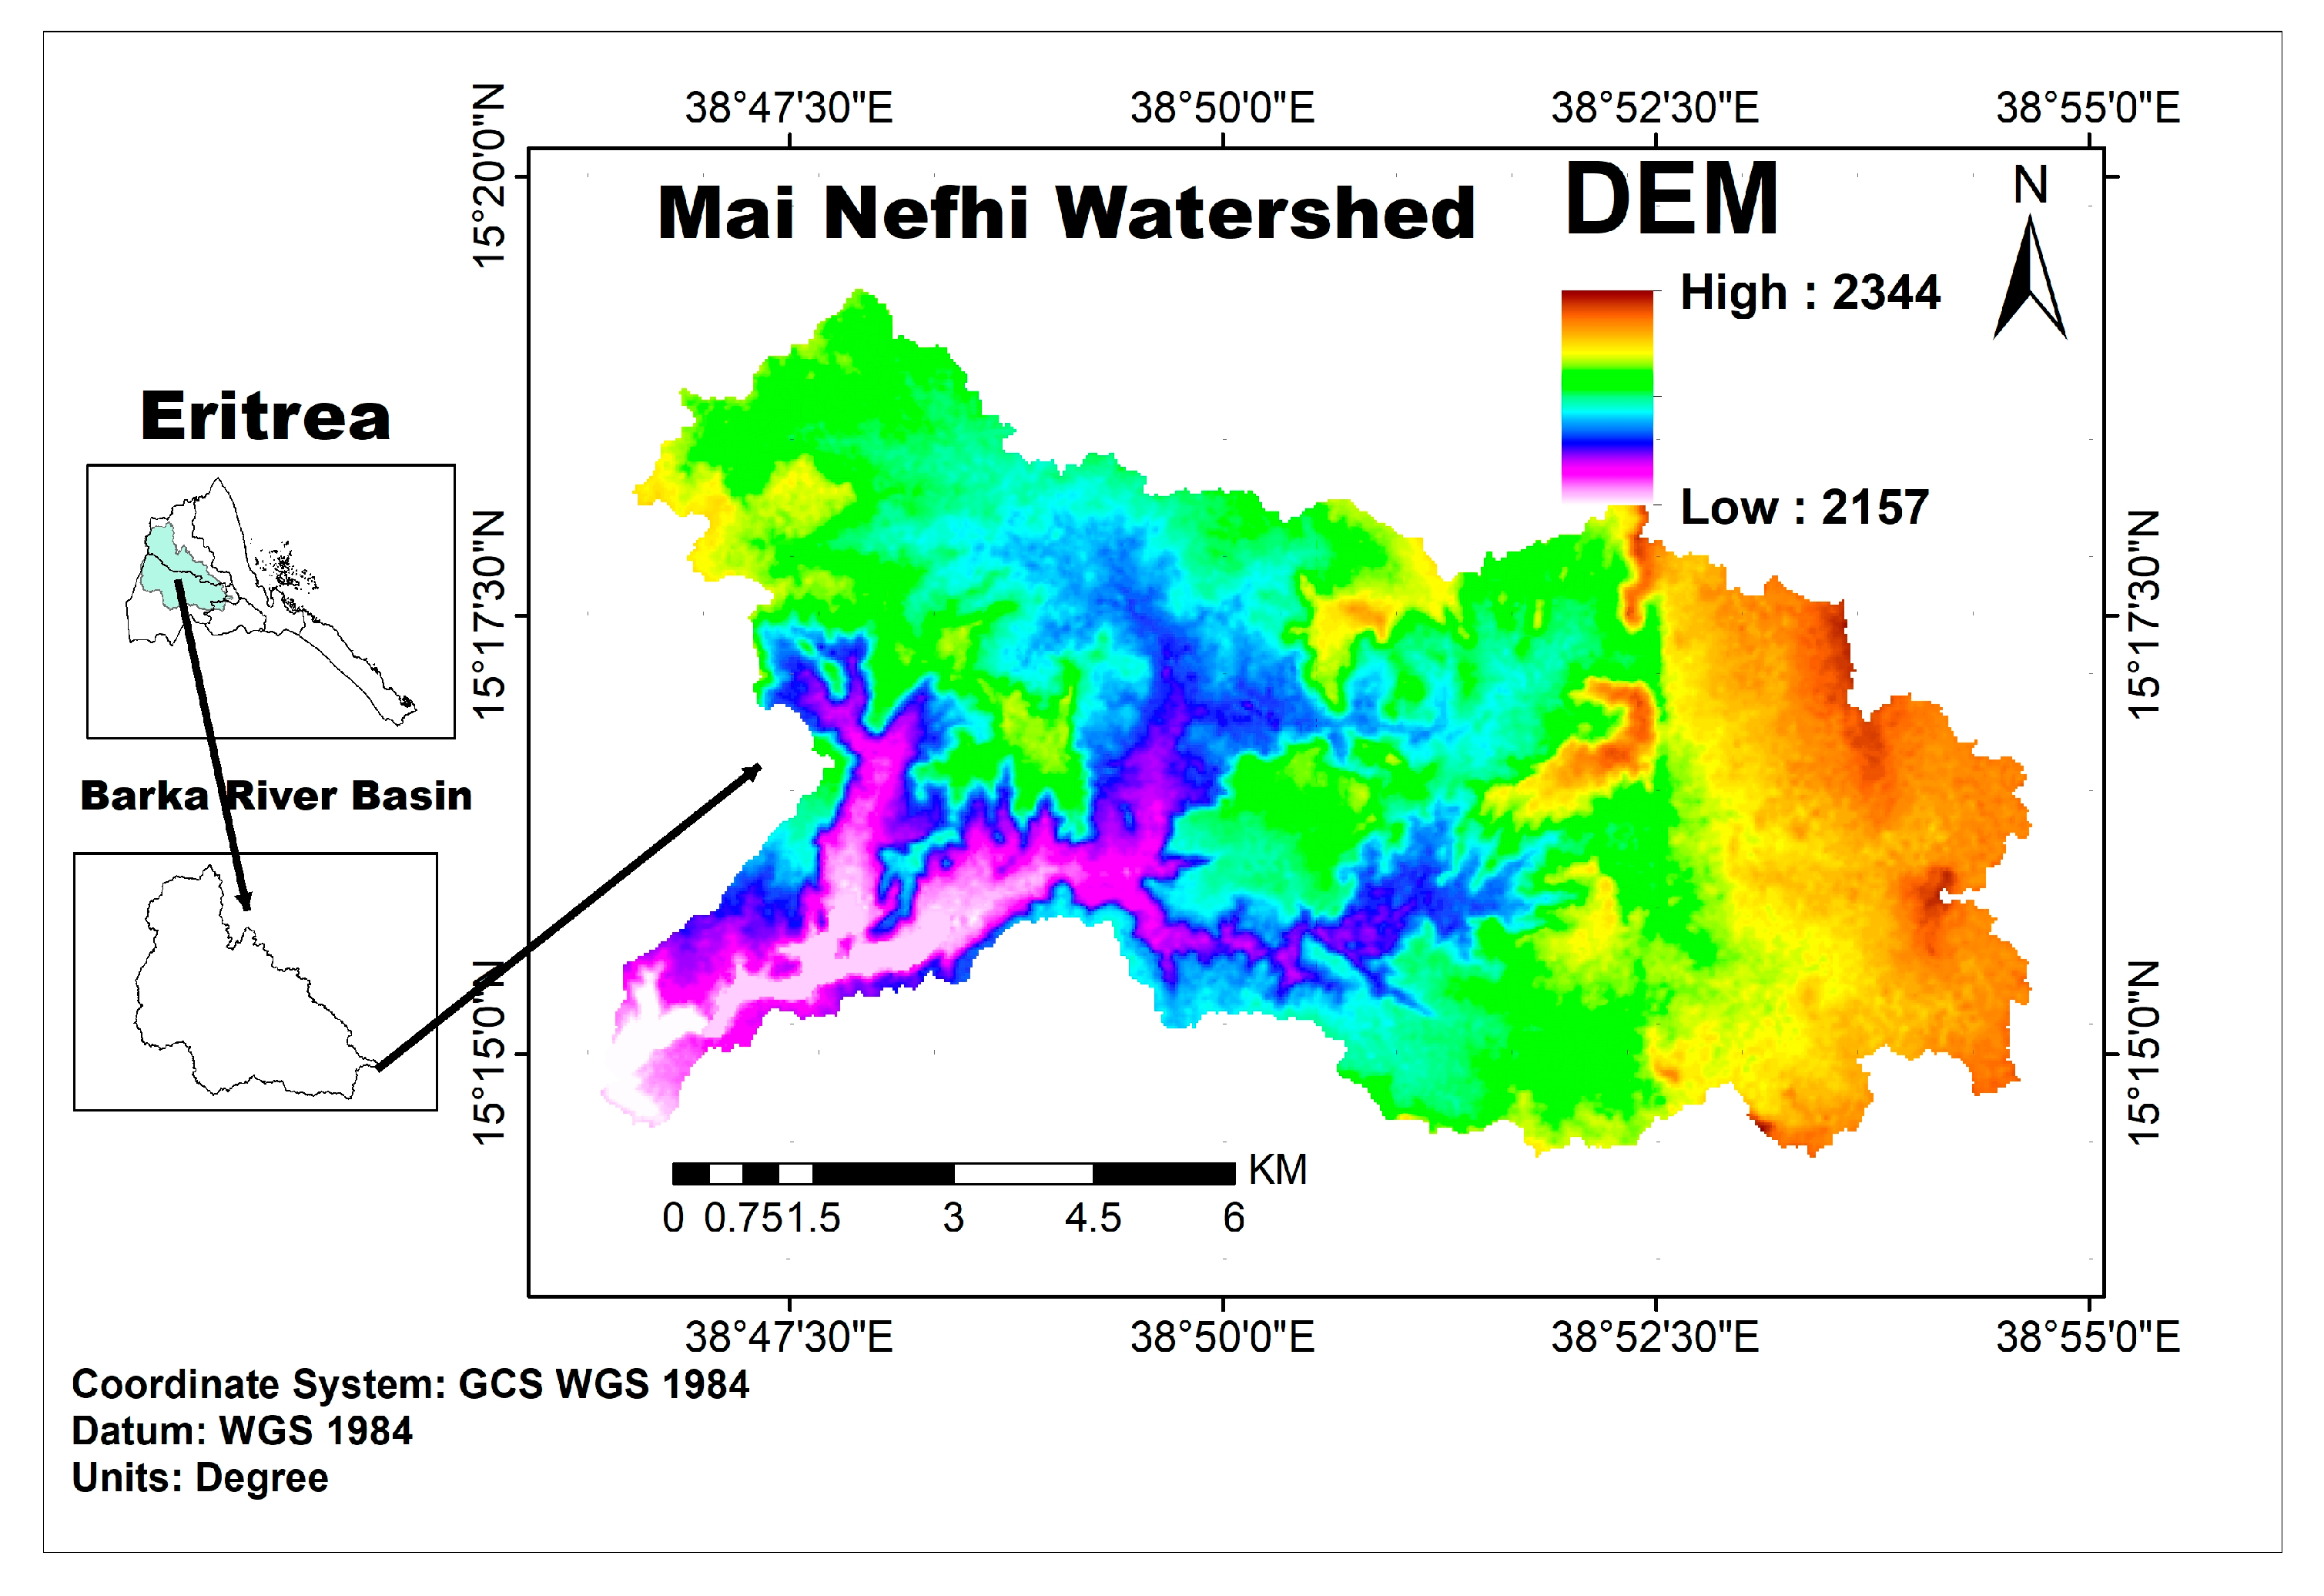
The study area is in the Mai Nefhi watershed, located in the central region of Eritrea, about 25 km southwest of Asmara (
Figure 2) at the starting point of the Barka River, one of the country’s largest rivers. The research area encompasses 7659 hectares with coordinates 38°44′ E to 38°55′ E longitude and 15°14′ N to 15°20′ N latitude. The study area was selected because it has been a target of the MOA for many years due to its location in the upper part of the Barka River Basin, its variability in topography (slope angle and length), rainfall, land use, and soil type.
It lies within a semi-arid climatic zone, characterized by distinct wet and dry seasons. The mean annual temperature in the watershed ranges between 17 °C and 23 °C, with relatively mild conditions due to its elevated topography. The area receives an average annual rainfall of approximately 400–450 mm according to a report by the MOA, most of which falls during a short rainy season between June and September. Rainfall is often intense and erratic, contributing significantly to surface runoff.
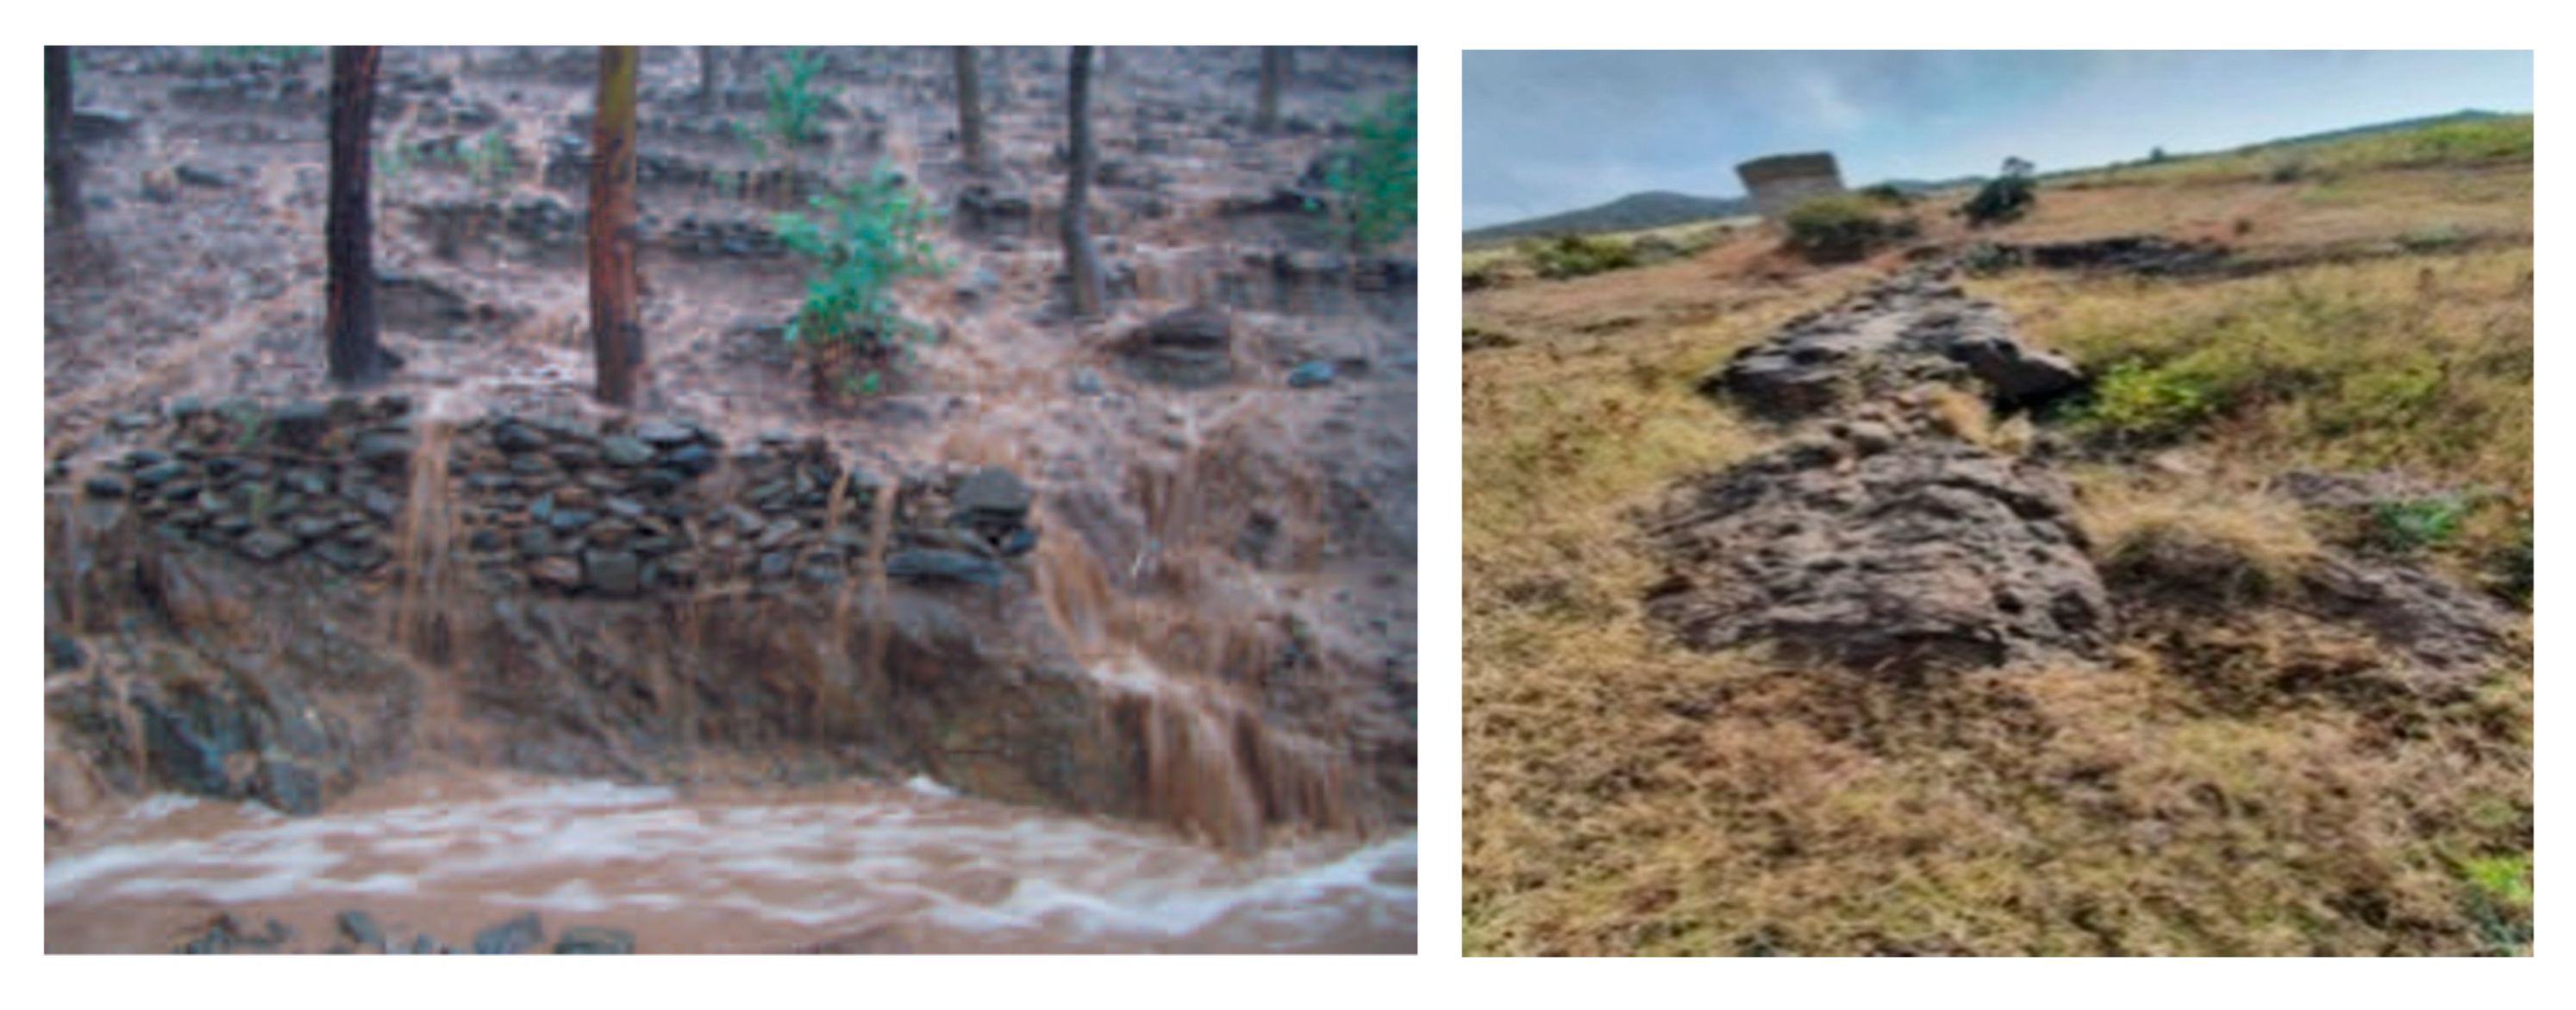
The watershed is characterized by a diverse geological background dominated by rocks such as granite, gneiss, and schist, contributing to its rugged topography (
Figure 3). The watershed features steep slopes and gentler terrain, influencing hydrology and erosion patterns, and allows high surface runoff (
Figure 3). Steeper regions are prone to higher runoff, while lower areas accumulate sediments. This combination of complex geology and varied terrain significantly affects soil erosion, land use potential, and the overall environmental dynamics of the area. Agricultural activities, primarily small-scale farming, are widespread in the area. However, poor land management practices, including overgrazing and cultivation on steep slopes, are common in the area. The soil textures in the study area are diverse, ranging from loamy sand and sandy loam on sloped areas to clay loam and silty clay in flatter valley sections. Shallow, gravelly soils are also common in rocky uplands. These textures influence both the K factor (soil erodibility) and runoff behavior, contributing to varying erosion risks across the watershed.
2.3. Data Types and Sources
This study utilized Landsat 8 OLI (Operational Land Imagery), from the year 2021, obtained from the USGS Earth platform (
http://earthexplorer.usgs.gov/, accessed on 9 June 2025) for land use and land cover classification [
12,
13]. To ensure accuracy, seven images with less than 10% cloud cover were selected, processed, and analyzed using ArcMap 10.4.1. Ground truthing data from Google Earth, along with focus group discussions, enhanced the reliability of the land use classification. A 30 m resolution Digital Elevation Model (DEM) from the SRTM tile downloader (
https://dwtkns.com/srtm30m/) was assessed on 24 April 2023, to derive the slope length and steepness (LS) factor.
Rainfall and soil data were collected from the Ministry of Agriculture (MOA) and the Eritrean Crop and Livestock Corporation (ECLC) to determine soil erodibility (K). These datasets were essential for assessing SERs. Conservation practices (P factor) were incorporated into the RUSLE model based on the satellite imagery analysis.
2.4. Soil Loss Estimation
We employed the RUSLE model in conjunction with the GIS and RS techniques to estimate soil erosion rates. This approach integrates multiple factors such as rainfall, slope, soil erodibility, land use, and conservation practices [
14]. RS, particularly satellite imagery and aerial photographs, played a pivotal role in monitoring land cover changes in the Eritrean landscape, a crucial parameter in RUSLE [
15]. GIS was used to process and analyze spatial data, calculate slopes, and manage the various input layers required for the RUSLE model [
16]. In addition to enabling a dynamic assessment of land cover changes, this thorough integration of RUSLE with GIS and RS improved our comprehension of soil erosion processes in the Eritrean setting by offering information about the spatial distribution of erosion risk [
17].
In the setting of the Eritrean highlands, an early effort was made to adapt the USLE and RUSLE models to local conditions [
8,
18]. To recognize the spatial patterns of potential soil loss rate in the study area, all considered erosion factors (R, K, LS, C, and P) were surveyed and calculated according to recommendations for Eritrea provided by [
19]. To estimate and map the spatial distribution of soil loss in the study area, all five parameter maps (with the same coordinate system) were discretized into a grid with a 30 m × 30 m cell size. The layers were then overlaid and multiplied pixel by pixel, using Equation (1) in the “Spatial Analysis Tool Map Algebra Raster calculator” geoprocessing tool in ArcGIS 10.4.1.
where A is the computed average annual soil loss in t ha
−1 yr
−1, R is the rainfall erosivity factor (MJ·mm·ha
−1·h
−1·yr
−1), K is the soil erodibility factor (t·ha·h·ha
−1·MJ
−1·mm
−1), LS is the topographic factor (dimensionless), C is the cropping management factor (dimensionless, ranging from zero to one), and P is the soil and water conservation practices factor (dimensionless, ranging from zero to one).
2.4.1. Rainfall Erosivity (R) Factor
The rainfall erosivity factor quantifies the impact of rainfall and reflects the amount and rate of runoff likely to be associated with precipitation events [
20]. The rainfall erosivity factor can be calculated for a single storm as a function of volume, intensity, and duration of rainfall. However, as these data are not always available, there are also methods to calculate it from annual rainfall. The long-term average annual rainfall was estimated; however, it was difficult to obtain, and in our work, we took a five-year (2017–2021) average rainfall. Rainfall data were collected from the Eritrean Meteorological Department.
The R factor was calculated using an equation that has been used in similar semi-arid regions. It is therefore reasonable to assume that the parameter reflects the intensity and distribution of rainfall specific to the study area. Since rainfall kinetic energy and intensity data were unavailable in the study area, the R factor was calculated using the equation found in [
18], which was derived from a spatial regression analysis of Ethiopian and Eritrean highland conditions. The model proposed by [
18] for Ethiopian and Eritrean circumstances is based on the available mean annual rainfall data (P), which are also used in this study. The erosivity map was created using ArcGIS 10.4.1 with R values obtained with Equation (2).
where R is the rainfall erosivity factor (MJ·mm·ha
−1·h
−1·yr
−1), and P is the annual rainfall in mm. The R factor was computed with the above formula and converted into a raster surface using the IDW (inverse distance weighting) interpolation method in ArcGIS.
2.4.2. Soil Erodibility (K) Factor
Soil erodibility (K) is an index of the inherent resistance of soil particles to the detaching and transporting power of rainfall [
19]. The K factor was derived using soil texture and organic matter content data from soil surveys conducted by the Ministry of Agriculture (MOA). Soil samples were collected and analyzed to estimate the erodibility of soil under local conditions. Soil erodibility was empirically determined for a particular soil type, reflecting the physical and chemical properties of the soil and contributing to its erodibility potential [
21].
We used an empirical formula to compute the K factor, helping to understand the erodibility of the studied area. Equations (3)–(6) [
22] show the empirical formula used to compute the K factor. K factor values ranged from 0 to 1, with 0 indicating low susceptibility to erosion and 1 indicating high susceptibility.
where Krusle is the soil erodibility factor, fcsand provides a high value for soil with little sand content while offering a low value for soil with coarse sand, forg is derived from the organic carbon content of the soil, fhisand is the factor that reduces soil erodibility in situations where the sand content is exceptionally high in soil, and fcl−si is derived from the clay and silt of the soil (silt to clay ratio). Ms is the % sand, Msilt is the % silt, Mc is the % clay, and Mo is the % organic matter.
2.4.3. Topographic Parameters (LS) Factor
The LS factor represents slope length and steepness and was calculated using a Digital Elevation Model (DEM) with a resolution of 30 m. The DEM data were processed in GIS to generate slope flow accumulation maps, ensuring that the topographic characteristics of the watershed were accurately represented. Equations (7) and (8) were used to obtain the LS factor with the upslope contributing area suggested by [
23,
24]. Flow accumulation and slope were multiplied using the Spatial Analysis Tool with an algebra raster calculator in ArcGIS to calculate and map slope length (LS factor) [
25].
where LS is the slope steepness–length factor; As is the specific catchment area, i.e., the upslope contributing area per unit width of contour drains to a specific point (flow accumulation × cell size); and B is the slope angle.
2.4.4. Cover Management (C) Factor
The cover management (C) factor reflects the effect of land use and land cover (LULC), cropping, and management practices on the rate of soil erosion. It is the ratio of soil loss from land covered by vegetation to the corresponding loss from continuous fallow [
20]. The C factor accounts for land cover and vegetation and was derived from classified land satellite imagery.
The maximum likelihood (ML) algorithm, a well-established method for supervised classification, was used to categorize images [
18,
26]. We employed ArcMap 10.4.1 for image analysis, classification, and area calculations. Microsoft
® Excel
® 2016 MSO (16.0.4266.1001) 64-bit) was used for data organization, calculation, and visualizing land use classifications. Image pre-processing is essential for satellite image analysis, involving tasks like distortion correction and cloud removal to improve data accuracy [
27]. Image classification utilizes a modified approach, employing supervised per-pixel classifiers, with the maximum likelihood algorithm as the primary tool [
28]. Based on various studies, the LULC values were assigned with the C factor value ranging between 0, implying very strong cover effects, and 1, indicating no cover, with the surface treated as barren land.
Table 1 is a reference for different C factor values of varying land use/land cover types.
2.4.5. Conservation Practice (P) Factor
The P factor reflects the effectiveness of practices such as terracing, contouring, stone walls, and grass margins [
33]. For conditions similar to those in Eritrea, the P factor is evaluated based on the slope and conservation practices, where the pieces of information are collected through interviews and observation, and then the values are given based on [
18]. P factor values range from 0 to 1, where 0 denotes extremely effective management techniques for erosion resistance, and 1 denotes no human-made erosion resistance efforts.
Table 2 displays the P factor values for the various scenarios that guided this investigation. The P factor spatial map was then prepared using ArcGIS.
2.5. Determination of Soil Organic Matter (SOM)
SOM content was determined using a modified Walkley and Black wet oxidation method [
34] at the laboratory of NARI, Halhale, Eritrea, for the soil samples collected from locations in the study area. A total of 161 soil samples were collected using a stratified approach based on topography and land use. Sampling locations were selected to represent different slope gradients, land cover types, and visible erosion levels. However, the data were not evenly distributed across the study area. In this procedure, approximately 1.0 g of air-dried, sieved (<2 mm) soil was placed in a conical flask and treated with 10 mL of 1 N potassium dichromate (k
2Cr
2O
7) solution, followed by the addition of 20 mL of concentrated sulfuric acid (H
2SO
4). The mixture was gently swirled and allowed to stand for 30 min at room temperature to ensure complete oxidation of organic carbon. After cooling, the excess dichromate was also prepared and titrated under identical conditions. The amount of oxidizable organic carbon was calculated and converted to SOM using the van Bemmelen factor (1.724). This modified approach provides reliable estimates of SOM, particularly in soils with varying organic matter content.
The relationship between soil erosion and SOM was analyzed using simple linear regression in R software (version 4.3.2), allowing for a statistical assessment of the degree of association between the two variables.
3. Results and Discussion
3.1. Land Use Classification
The study area was classified into seven land use types (
Figure 4). Agricultural land dominated the landscape, covering 54.18% of the watershed, followed by built-up areas at 15.3%, bare hilly areas at 16.05%, and forest land at 11.83%. Additionally, water bodies accounted for 1.84% of the area, while shrublands comprised 1.03% and 0.1% cover by grassland. These findings demonstrate the spatial distribution of land cover types and their potential impact on soil erosion dynamics within the watershed, guiding targeted conservation and management strategies to mitigate erosion risk.
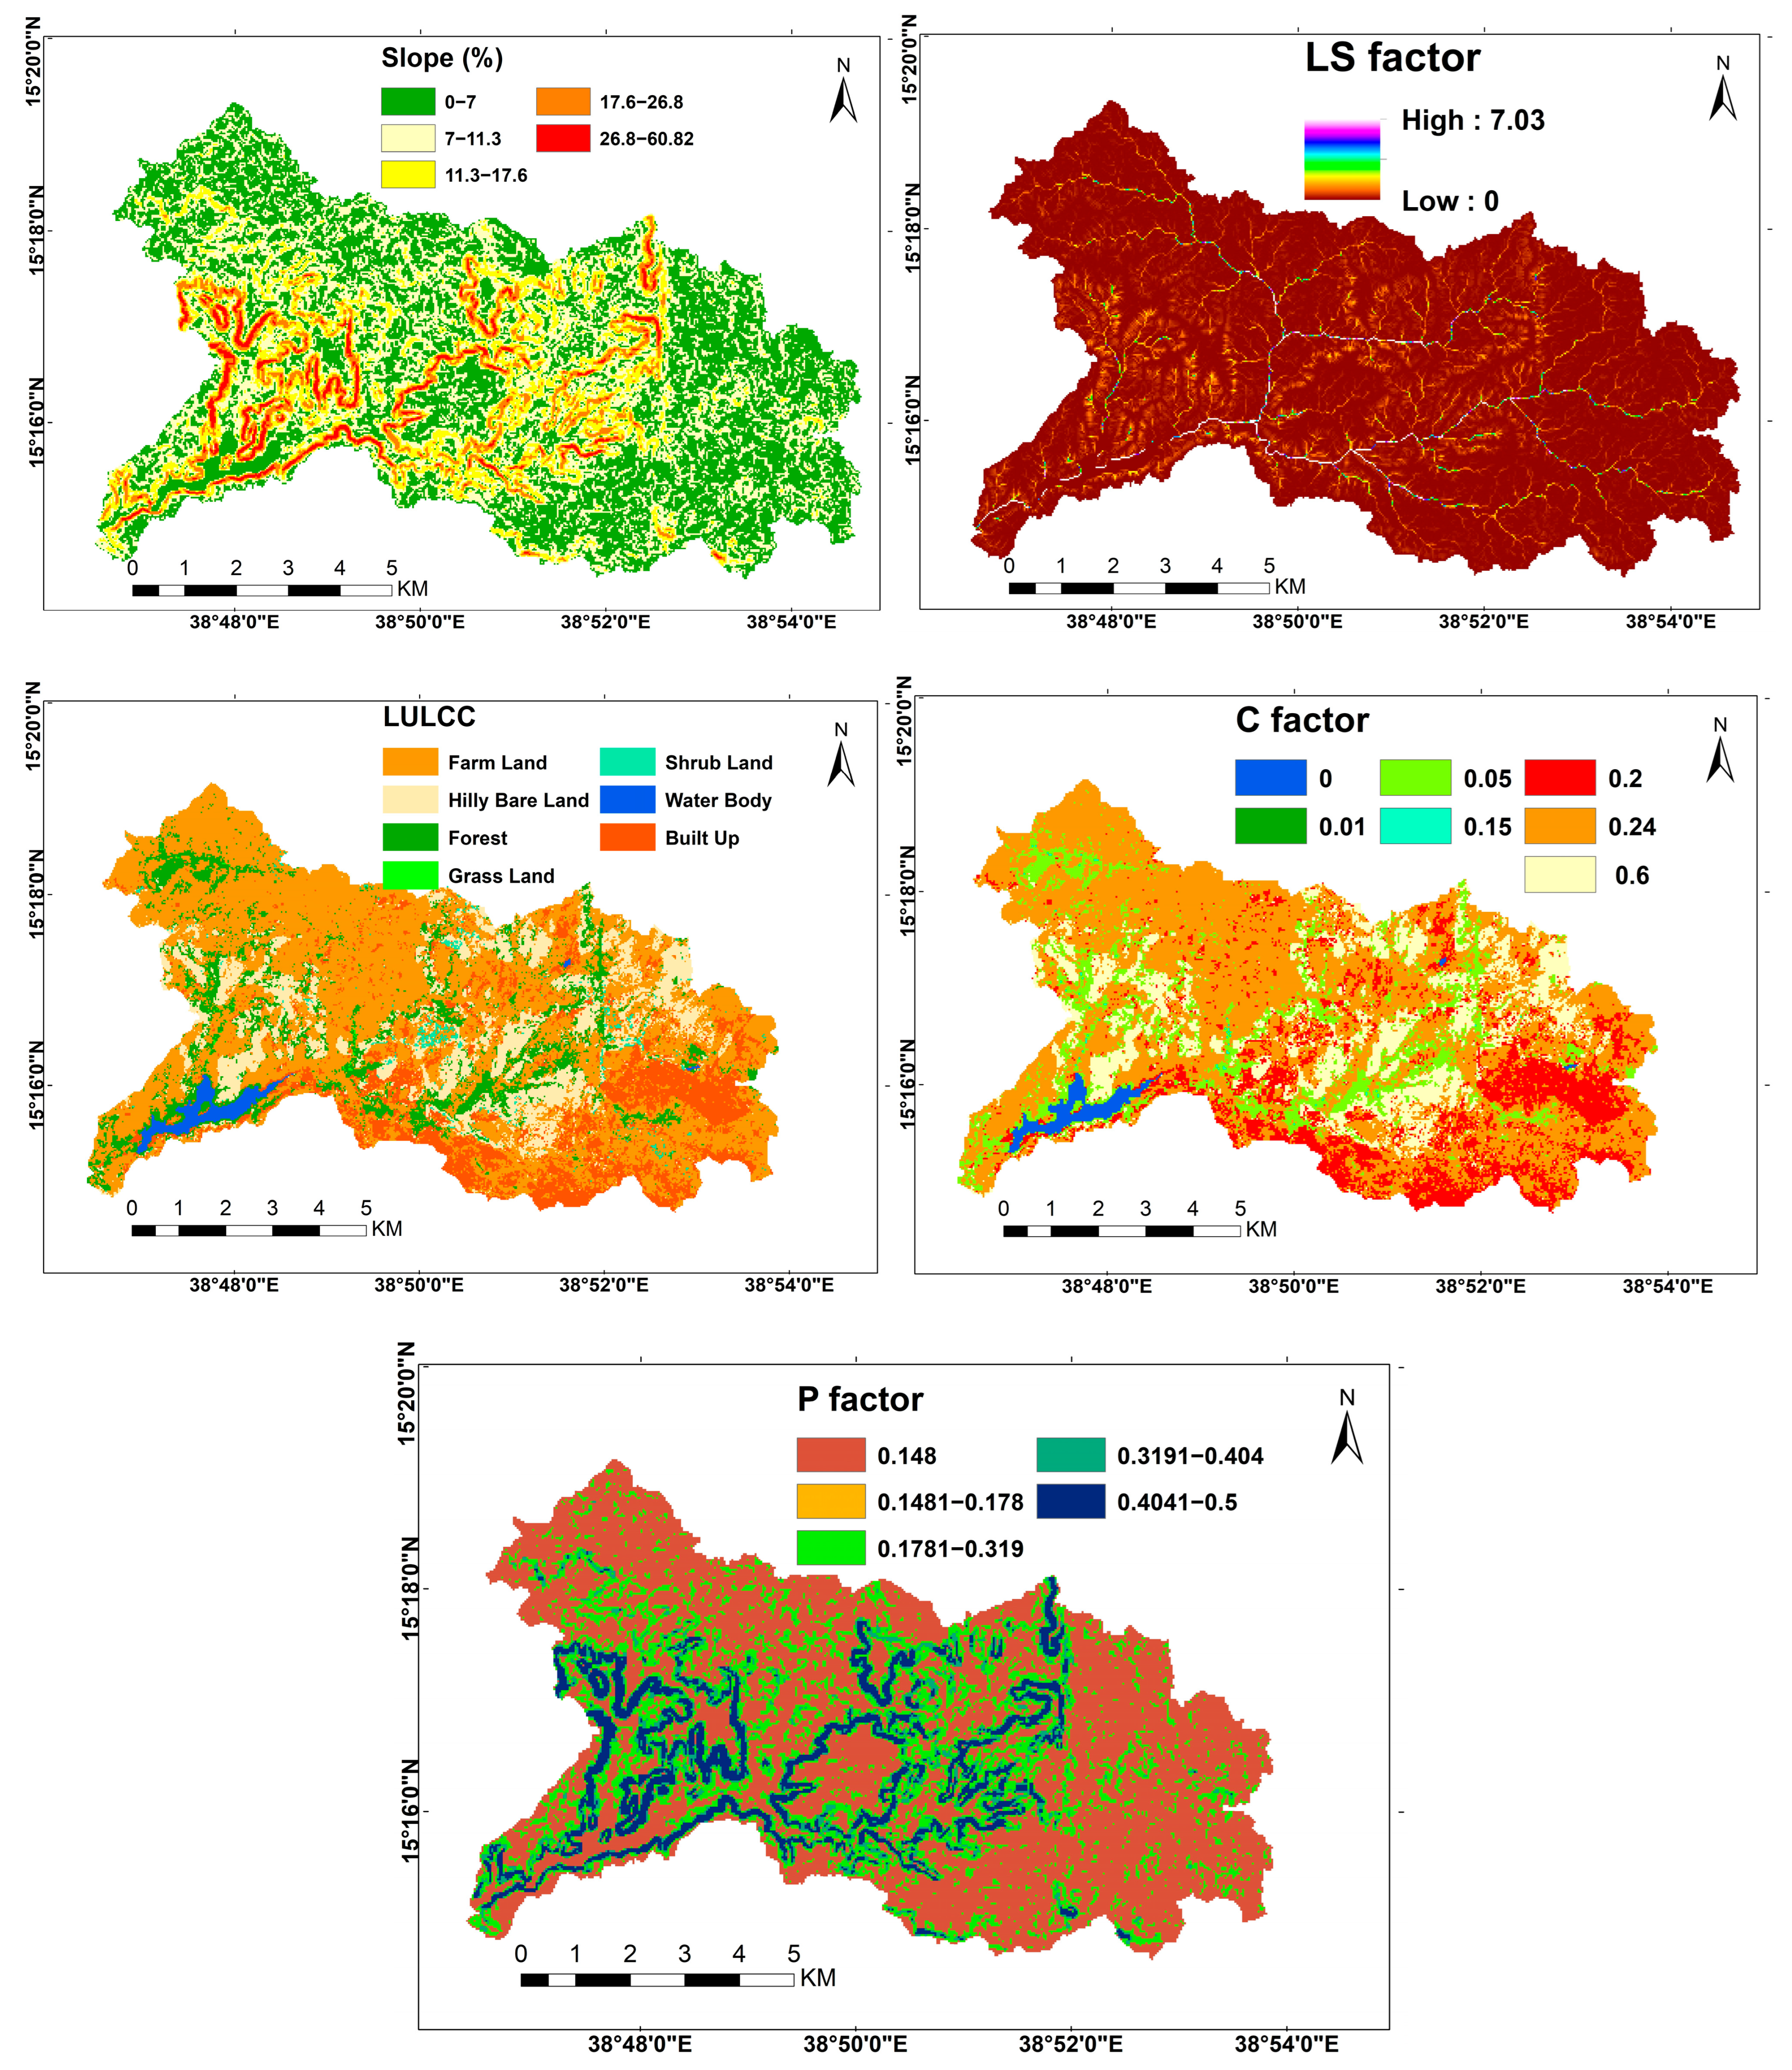
3.2. RUSLE Parameters
The spatial distribution of RUSLE parameters, as illustrated in the respective maps (
Figure 4), aligns strongly with variations in rainfall, topography, soil properties, land use, and conservation practices across the watershed. The K factor map shows high erodibility in sandy and silty upland soils, while more stable loamy soil in gentle slope and valley areas exhibits lower values. It can be observed that areas showed high erodibility where intense rainfall (high R) and steep terrain (high LS) coincide. Although R and LS do not define the K factor in the RUSLE model, they interact with soil over time, altering its physical condition and increasing its vulnerability to erosion (K). This justifies observed spatial correlations where higher K values coincide with higher R and LS zones, reflecting a dynamic interaction in the real landscape. The LS factor, reflecting slope length and steepness, shows the highest values in the central and southern parts of the watershed, where the slopes reach 60.8%. These areas appear as elongated zones on the map due to long, continuous lines along hills and valleys. In these regions, LS has a higher value due to the steep slopes extending over long distances, often aligned along hilly lines, escarpments, and valley sides. The C and P maps reflect the patterns visible in the land use and slope angle maps as they are reclassified from those maps.
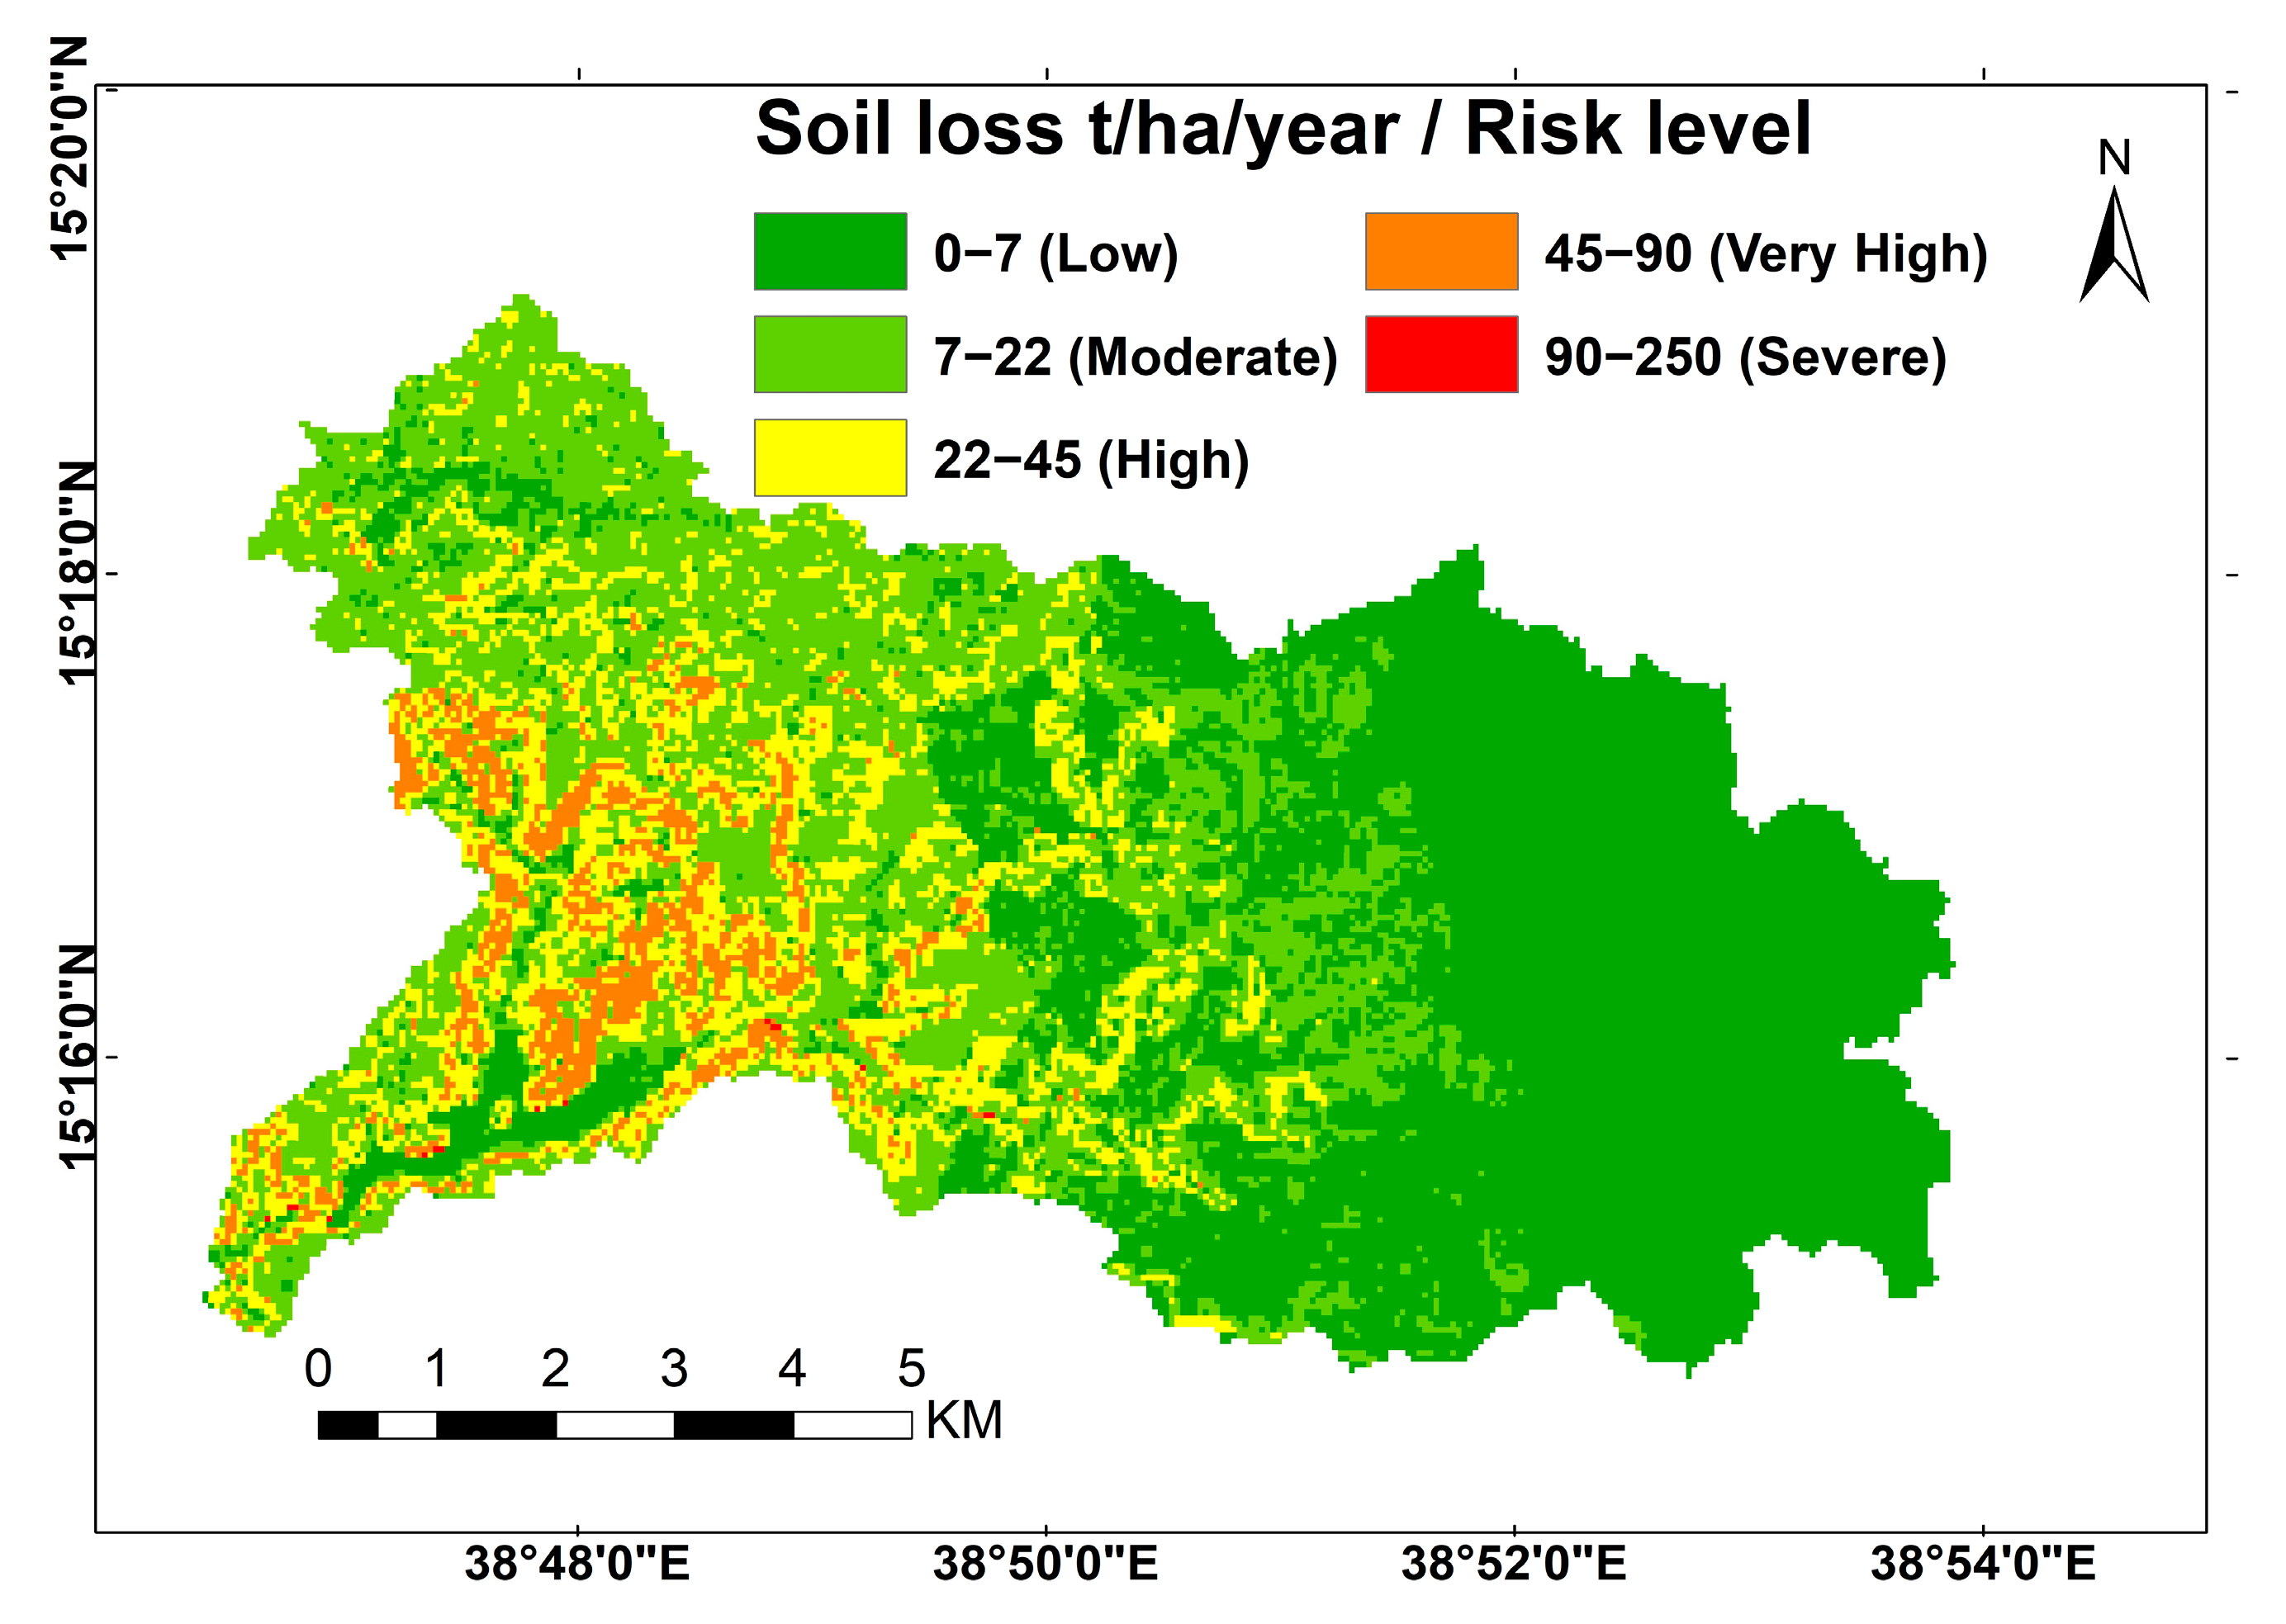
3.3. Soil Erosion Estimation
The spatial variability of soil erosion across the watershed, as estimated using RUSLE, showed clear associations with essential environmental and land management factors (
Figure 5). Higher erosion intensities were mainly observed in areas of steeper elevation gradients and on degraded hillslopes, especially in the western and central parts of the watershed. These areas also coincided with relatively sparse vegetation cover and intensive land use, particularly overgrazed rangelands and continuously tilled croplands, both of which are known to accelerate surface and sediment detachment.
Soil erosion severity was classified into five categories (
Figure 5 and
Table 3). The majority of the area (68.19%) falls under the “low” erosion class (0–7 t ha
−1 yr
−1), requiring minimal intervention. Moderate erosion (7−22 t ha
−1 yr
−1) affects 22.05% of the area, while 5.62% and 6.43% are classified as “high” (22−45 t ha
−1 yr
−1) and “very high” (45−90 t ha
−1 yr
−1), respectively. The most critical zone, classified as ‘’severe’’ (90−250 t ha
−1 yr
−1), covers 3.94% of the watershed and poses the highest conservation priority. Among all the parameters, the LS factor was identified as the dominant driver of soil loss, with erosion rates increasing sharply on slopes above 30%.
The extreme erosion rates up to 250 t ha
−1 yr
−1 exceeded those reported in similar semi-arid regions such as Ethiopia’s Blue Nile Basin (~120 t ha
−1 yr
−1) [
9] and Kenya’s Upper Tana Basin (>100 t ha
−1 yr
−1) [
10]. Particularly, they are also significantly higher than average rates reported across Europe, which typically range from 2 to 40 t ha
−1 yr
−1 in cultivated areas, with peak values rarely exceeding 100 t ha
−1 yr
−1 in mountainous regions [
33]. Erosion rates in the study area are comparable to the humid western part of India [
11], where monsoonal rainfall could be the main driver. While high erosion in India is primarily rainfall-induced, in the Eritrean watershed, which is characterized by a semi-arid climate and moderate rainfall, the severe erosion could be mainly due to steep slopes and sparse vegetation. In contrast, Europe benefits from long-standing conservation practices, regulated land use, and permanent ground cover, and even Kenya’s semi-arid zones often implement community-based conservation structures that reduce soil loss. This comparison indicates that slope management and land cover are the dominant factors in the study area, rather than rainfall intensity. Therefore, to mitigate erosion, interventions should focus on enhancing vegetation cover, restricting cultivation on steep slopes, and implementing structural measures such as terraces and check dams.
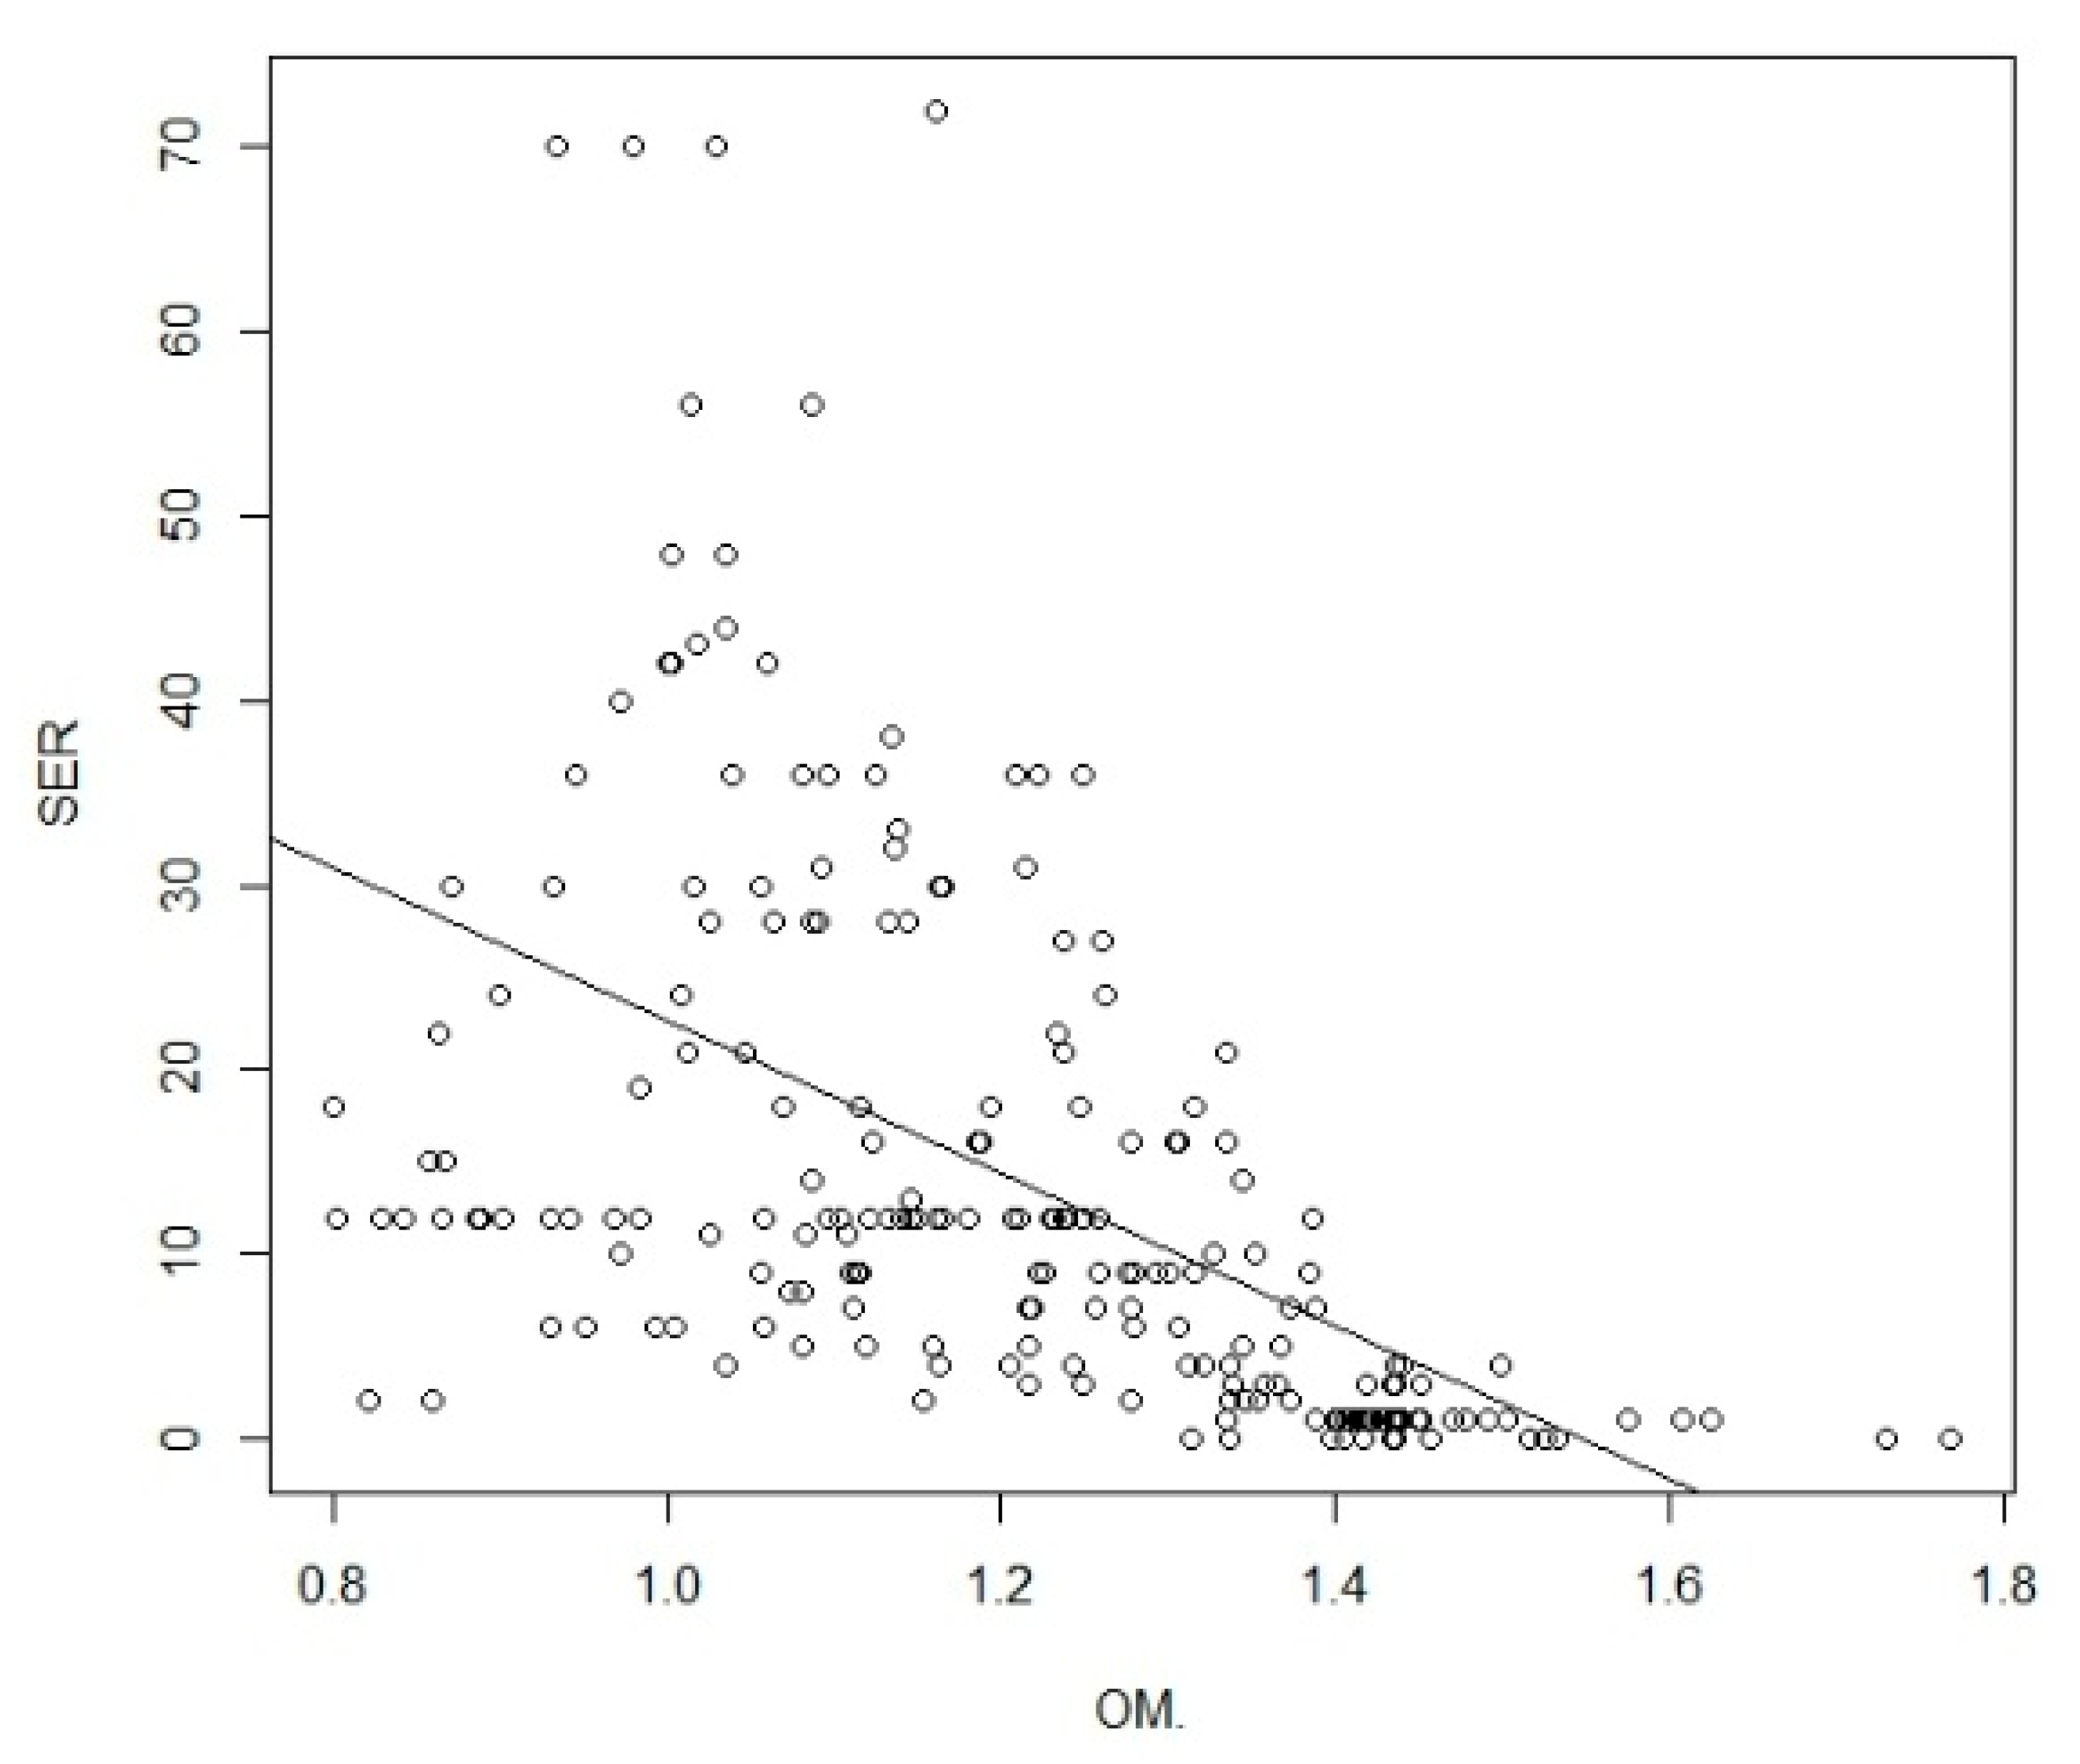
3.4. Relationship Between Soil Erosion and Organic Matter Content (OM%)
The regression analysis (
Figure 6) yielded an R
2 value of 0.279, indicating that only 27.9% of the variability in soil erosion rates can be explained by SOM content alone. This relationship suggests that while OM plays a role in erosion dynamics, other factors such as slope, rainfall, and land use are also significant contributors. The low R
2 value can be interpreted through two contrasting processes. Firstly, in areas with high erosion, the organic-rich topsoil may have been removed, resulting in low observed OM; conversely, areas with higher OM content likely reflect stronger soil structure and reduced erosion susceptibility, allowing the organic-rich horizon to remain unbroken. The regression plot further illustrates this by showing that samples with OM > 1.4% consistently exhibit low erosion, while samples with OM < 1.4% display a wider range of erosion rates. The wider range of erosion rates may reflect both sites with genuinely low OM and low erosion, and others where high erosion has depleted surface OM. It is concluded that OM cannot be used as straightforward validation for soil erosion, but it represents valuable information to understand the processes.
4. Conclusions
The application of the RUSLE model showed that soil erosion is the study area is highly variable, with annual soil loss ranging from 0 to 250 t ha−1 yr−1. Erosion is most severe in areas with steep slopes, sparse vegetation, and inadequate conservation measures, especially on cultivated and bare hilly lands. The LS factor (slope) was the dominant contributor to erosion risk, while the relationship between SOM and erosion was weak (R2 = 0.279), indicating that other factors, particularly topography and land cover, play a more significant role.
The highest rates in the study area exceed those reported in similar semi-arid regions of Kenya and most parts of Europe, where better land management has limited erosion intensity. Although comparable in magnitude to erosion in India’s monsoon-influenced Western Ghats, the causes differ, as rainfall is not the primary driver in this watershed.
Overall, the findings suggest that prioritized soil conservation efforts are urgently needed. Conservation measures should focus on steep-slope agricultural lands and bare hilly areas, which were identified as erosion hotspots. Strategies such as terracing, contour plowing, agroforestry, and establishment of vegetative buffer strips, as well as the restriction of agricultural practices in hilly slope areas, are essential to reduce runoff and soil loss. In areas with moderate erosion, cover cropping and mulching can help maintain surface protection and enhance organic matter. To ensure sustainability, these interventions must be integrated into watershed-scale land use planning, supported by community participation and continuous monitoring.
Author Contributions
Conceptualization, T.B.M.; methodology, T.B.M. and E.D.; software, T.B.M. and E.D.; validation, T.B.M. and P.Z.; formal analysis, T.B.M. and P.Z.; investigation, T.B.M.; resources, T.B.M. and E.D.; data curation, T.B.M.; writing—original draft preparation, T.B.M.; writing—review and editing, T.B.M., P.Z. and E.D.; visualization, T.B.M.; supervision, E.D. All authors have read and agreed to the published version of the manuscript.
Funding
This work was implemented by the National Multidisciplinary Laboratory for Climate Change Project (RRF-2.3.1-21-2022-00014) within the framework of Hungary’s National Recovery and Resilience Plan, supported by the Recovery and Resilience Facility of the European Union.
Institutional Review Board Statement
Not applicable.
Informed Consent Statement
Not applicable.
Data Availability Statement
The data are available upon request from the corresponding author.
Acknowledgments
The authors appreciate the comments and suggestions from the editorial board for Soil Systems and the five reviewers. We thank the Ministry of Agriculture of Eritrea for providing data, as well as the Eritrean Crop and Livestock Production Corporation for its support. We thank the National Agricultural Research Institute (NARI) of Eritrea for providing additional data and support. This work was supported by the Stipendium Hungaricum Scholarship program of the Hungarian government.
Conflicts of Interest
The authors declare that none of the work described in this study could have been influenced by any known competing financial interests or personal relationships.
References
- Fernandez, C.; Wu, J.Q.; McCool, D.K.; Stöckle, C.O. Estimating Water Erosion and Sediment Yield with GIS, RUSLE, and SEDD. J. Soil Water Conserv. 2003, 58, 128–136. [Google Scholar] [CrossRef]
- Tamene, L.; Adimassu, Z.; Aynekulu, E.; Yaekob, T. International Soil and Water Conservation Research Estimating Landscape Susceptibility to Soil Erosion Using a GIS-Based Approach in Northern Ethiopia. Int. Soil Water Conserv. Res. 2017, 5, 221–230. [Google Scholar] [CrossRef]
- Abebe, Z.D.; Sewnet, M.A. Adoption of Soil Conservation Practices in North Achefer District, Northwest Ethiopia. Chin. J. Popul. Resour. Environ. 2014, 12, 37–41. [Google Scholar] [CrossRef]
- Pimentel, D.; Kounang, N. Ecology of Soil Erosion in Ecosystems. Ecosystems 1998, 1, 416–426. [Google Scholar] [CrossRef]
- Ebabu, K.; Taye, G.; Tsunekawa, A.; Haregeweyn, N.; Sultan, D.; Aklog, D.; Admasu, T.; Wesemael, B.V.; Poesen, J. Land Use, Management and Climate Effects on Runoff and Soil Loss Responses in the Highlands of Ethiopia. J. Environ. Manag. 2023, 326, 116707. [Google Scholar] [CrossRef]
- Ghebrezgabher, M.G.; Yang, T.; Yang, X. Long-Term Trend of Climate Change and Drought Assessment in the Horn of Africa. Adv. Meteorol. 2016, 2016, 8057641. [Google Scholar] [CrossRef]
- Welderufael, W.A.; Woyessa, Y.E.; Edossa, D.C. Impact of Rainwater Harvesting on Water Resources of the Modder River Basin Central Region of South Africa. Agric. Water Manag. 2013, 116, 218–227. [Google Scholar] [CrossRef]
- Borrelli, P.; Alewell, C.; Alvarez, P.; Anache, J.A.A.; Baartman, J.; Ballabio, C.; Bezak, N.; Biddoccu, M.; Cerdà, A.; Chalise, D.; et al. Soil Erosion Modelling: A Global Review and Statistical Analysis. Sci. Total Environ. 2021, 780, 146494. [Google Scholar] [CrossRef] [PubMed]
- Haregeweyn, N.; Tsunekawa, A.; Poesen, J.; Tsubo, M.; Meshesha, D.T.; Fenta, A.A.; Nyssen, J.; Adgo, E. Comprehensive Assessment of Soil Erosion Risk for Better Land Use Planning in River Basins: Case Study of the Upper Blue Nile River. Sci. Total Environ. 2017, 574, 95–108. [Google Scholar] [CrossRef]
- Moges, D.M.; Bhat, H.G. Watershed Degradation and Management Practices in North-Western Highland Ethiopia. Environ. Monit. Assess. 2020, 192, 664. [Google Scholar] [CrossRef]
- Prasannakumar, V.; Vijith, H.; Abinod, S.; Geetha, N. Estimation of Soil Erosion Risk within a Small Mountainous Sub-Watershed in Kerala, India, Using Revised Universal Soil Loss Equation (RUSLE) and Geo-Information Technology. Geosci. Front. 2012, 3, 209–215. [Google Scholar] [CrossRef]
- Srivastava, P.K.; Han, D.; Rico-ramirez, M.A.; Bray, M. Selection of Classification Techniques for Land Use/Land Cover Change Investigation. Adv. Space Res. 2012, 50, 1250–1265. [Google Scholar] [CrossRef]
- Juliev, M.; Pulatov, A.; Fuchs, S.; Hübl, J. Analysis of Land Use Land Cover Change Detection of Bostanlik District, Uzbekistan. Pol. J. Environ. Stud. 2019, 28, 3235–3242. [Google Scholar] [CrossRef] [PubMed]
- Renard, K.G.; Foster, G.R.; Weesies, G.A.; Mccool, D.K.; Yoder, D.C. A Guide to Conservation Planning with the Revised Universal Soil Loss Equation (RUSLE); SSOP: Washington, DC, USA, 1997; ISBN 0160489385. [Google Scholar]
- Lu, D.; Weng, Q. A Survey of Image Classification Methods and Techniques for Improving Classification Performance. Int. J. Remote Sens. 2007, 28, 823–870. [Google Scholar] [CrossRef]
- DeFries, R.S.; Hansen, M.C.; Townshend, J.R.G.; Janetos, A.C.; Loveland, T.R. A New Global 1-Km Dataset of Percentage Tree Cover Derived from Remote Sensing. Glob. Change Biol. 2000, 6, 247–254. [Google Scholar] [CrossRef]
- Montgomery, D.R. Soil Erosion and Agricultural Sustainability. Proc. Natl. Acad. Sci. USA 2007, 104, 13268–13272. [Google Scholar] [CrossRef]
- Wischmeir, W.H.; Smith, D. Predicting Rainfall-Erosion Losses from Cropland East of the Rocky Mountains: A Guide to Conservation Planning Science and Education Administration; US Department of Agriculture: Washington, DC, USA, 1978; Volume 2, ISBN 3663537137. [Google Scholar]
- Hurni, H. Soil Conservation Manual for Ethiopia; Ministry of Agriculture: Addis Ababa, Ethiopia, 1985. [Google Scholar]
- Xu, Y.Q.; Shao, X.M.; Kong, X.B.; Jian, P.; Cai, Y.L. Adapting the RUSLE and GIS to Model Soil Erosion Risk in a Mountains Karst Watershed, Guizhou Province, China. Environ. Monit. Assess. 2008, 141, 275–286. [Google Scholar] [CrossRef]
- Shalini Tirkey, A.; Pandey, A.C.; Nathawat, M.S. Use of Satellite Data, GIS and RUSLE for Estimation of Average Annual Soil Loss in Daltonganj Watershed of Jharkhand (India). J. Remote Sens. Technol. 2013, 1, 20–30. [Google Scholar] [CrossRef]
- Williams, J.; Shaffer, J.; Renard, K.; Foster, G.; Laflen, J.; Lyles, L.; Onstad, C.; Sharpley, A.; Nicks, A.; Jones, C.; et al. EPIC-Erosion/Productivity Impact Calculator; USDA Technical Bulletin 1759; United States Department of Agriculture: Beitsviie, MD, USA, 1990. [Google Scholar]
- Desmet, P.J.J.; Govers, G. Two-Dimensional Modelling of the within-Field Variation in Rill and Gully Geometry and Location Related to Topography. Catena 1997, 29, 283–306. [Google Scholar] [CrossRef]
- Moore, I.A.N.D.; Burch, G.J. Physical Basis of the Length-Slope Factor in the Universal Soil Loss Equation. Soil Conserv. 1986, 50, 1294–1298. [Google Scholar] [CrossRef]
- Simms, A.D.; Woodroffe, C.D.; Jones, B.G. Application of RUSLE for Erosion Management in a Coastal Catchment, Southern NSW. Fac. Sci. Med. Health 2003, 2, 678–683. [Google Scholar]
- Hasan, M.; Haque, R.; Rahman, M. Case Studies in Chemical and Environmental Engineering Identifying the Land Use Land Cover ( LULC ) Changes Using Remote Sensing and GIS Approach: A Case Study at Bhaluka in Mymensingh, Bangladesh. Case Stud. Chem. Environ. Eng. 2023, 7, 100293. [Google Scholar] [CrossRef]
- Chuvieco, E.; Huete, A. Fundamentals of Satellite Remote Sensing, 3rd ed.; CRC Press: Boca Raton, FL, USA, 2020; ISBN 9781420021516. [Google Scholar]
- Bayarsaikhan, U.; Boldgiv, B.; Kim, K.R.; Park, K.A.; Lee, D. Change Detection and Classification of Land Cover at Hustai National Park in Mongolia. Int. J. Appl. Earth Obs. Geoinf. 2009, 11, 273–280. [Google Scholar] [CrossRef]
- Birhanu, L.; Tesfaw, B.; Bekele, T.; Demissew, S.; Lc, L.U. Remote Sensing Applications: Society and Environment Land Use/Land Cover Change along Elevation and Slope Gradient in Highlands of Ethiopia. Remote Sens. Appl. Soc. Environ. 2019, 16, 100260. [Google Scholar] [CrossRef]
- Tiruneh, G.A.; Alemayehu, T.Y.; Meshesha, D.T.; Vogelmann, E.S.; Reichert, J.M.; Haregeweyn, N. Spatial Variability of Soil Chemical Properties under Different Land-Uses in Northwest Ethiopia. PLoS ONE 2021, 16, e0253156. [Google Scholar] [CrossRef]
- Ewunetu, A.; Simane, B.; Teferi, E.; Zaitchik, B.F. Mapping and Quantifying Comprehensive Land Degradation Status Using Spatial Multicriteria Evaluation Technique in the Headwaters Area of Upper Blue Nile River. Sustainability 2021, 13, 2244. [Google Scholar] [CrossRef]
- Nut, N.; Mihara, M.; Jeong, J.; Ngo, B.; Sigua, G.; Prasad, P.V.V.; Reyes, M.R. Land Use and Land Cover Changes and Its Impact on Soil Erosion in Stung Sangkae Catchment of Cambodia. Sustainability 2021, 13, 9276. [Google Scholar] [CrossRef]
- Panagos, P.; Borrelli, P.; Meusburger, K.; Alewell, C.; Lugato, E.; Montanarella, L. Estimating the Soil Erosion Cover-Management Factor at the European Scale. Land Use policy 2015, 48, 38–50. [Google Scholar] [CrossRef]
- Ryan, J.; Estefan, G.; Rashid, A. Soil and Plant Analysis Laboratory Manual, 2nd ed; International Center for Agricultural Research in the Dry Areas (ICARDA) and the National Agricultural Research Center (NARC): Aleppo, Syria, 2001; Volume 11, x+172 pp. AGROVOC; ISBN 9788578110796. [Google Scholar]
| Disclaimer/Publisher’s Note: The statements, opinions and data contained in all publications are solely those of the individual author(s) and contributor(s) and not of MDPI and/or the editor(s). MDPI and/or the editor(s) disclaim responsibility for any injury to people or property resulting from any ideas, methods, instructions or products referred to in the content. |
© 2025 by the authors. Licensee MDPI, Basel, Switzerland. This article is an open access article distributed under the terms and conditions of the Creative Commons Attribution (CC BY) license (https://creativecommons.org/licenses/by/4.0/).


