Article

Changes in Timing and Precipitation of the East Asian Summer Monsoon over China Between 1960 and 2017

by
Zeyu Dou
1,
Binhui Liu
1,*,
Mark Henderson
2,
Wanying Zhou
1,
Rong Ma
1,
Mingyang Chen
1 and
Zhi Zhang
1
1
College of Forestry, The Northeast Forestry University, Harbin 150040, China
2
Mills College, Northeastern University, Oakland, CA 94613, USA
*
Author to whom correspondence should be addressed.
Earth 2025, 6(2), 24; https://doi.org/10.3390/earth6020024
Submission received: 7 March 2025 / Revised: 27 March 2025 / Accepted: 30 March 2025 / Published: 3 April 2025

Abstract

:
The East Asian Summer Monsoon (EASM) is a critical component of the Earth’s climate system that brings substantial seasonal precipitation to China, contributing over 30 percent of summer half-year’s precipitation. Agriculture critically depends on the monsoon’s timing and precipitation, but the effects of climate change on its regional configuration remain poorly understood. We analyzed daily precipitation time series from 145 observation stations in eastern China to quantify the initial and final dates of the rainband steady phase and detect regional variations in monsoon duration and intensity from 1960 to 2017. Monsoon rainband precipitation declined until the mid-1980s, increased from the mid-1980s to 1998, and generally stabilized after that. During the weakening period, the rainband tended to reach mainland China earlier and to take longer to progress from south to north; those changes reversed during the strengthening period. When the EASM weakened, precipitation decreased in the north and south but not in the lower Yangtze and Huaihe river basins of East-Central China. When the EASM strengthened, precipitation increased in all regions, with changes in extreme precipitation generally greater than the changes in overall precipitation. Overall, the moisture imbalance between regions has intensified, reinforcing the pattern of “southern floods, northern droughts” in China.

1. Introduction

Monsoon systems are crucial components of the Earth’s climate system, serving to redistribute moisture and heat, regulate the hydrological cycle, and sustain agriculture and natural ecosystems [1,2]. In monsoon-dominated climates, monsoons may account for three-quarters of the year’s precipitation [3]. Monsoon-related droughts and floods can have enormous social and economic impacts, affecting as much as 70% of the world’s population [4]. The timing and intensity of seasonal monsoons are influenced by both greenhouse gasses and anthropogenic aerosol emissions through changes in cloud properties and radiative forcing [5,6,7,8].
Monsoon systems, including the Indian Summer Monsoon and the East Asian Summer Monsoon (EASM), are leading determinants of environmental conditions over much of Asia, affecting the most densely populated regions on Earth [9]. Eastern China is mainly influenced by the EASM. While the Indian Summer Monsoon migrates from South to North India in only one to two weeks, the EASM takes about two months to progress from South to North China [10]. In China, while the winter monsoon has been characterized as “a burst of the cold waves”, the summer monsoon advances much more gradually [11]. Unlike other monsoon systems in which rainfall is concentrated in a single phase, the EASM progresses across eastern China from south to north in stages, with three steady rainfall phases punctuated by two sudden leaps [10]. Beginning in late spring, warm and moist air masses converge over Southeast Asia, creating a low-pressure system. This marks the onset of the EASM, which gradually progresses northward into South China, forming a monsoon trough (the first stage). As the monsoon intensifies, it advances from South China into the lower Yangtze and Huaihe river basins of East-Central China during early summer (the second stage), establishing a well-defined monsoon front called the meiyu rains. In this stage, the monsoon also leaps eastward, bringing heavy rainfall to the Korean Peninsula, where it is known as the changma, and Japan, where it is called the baiu; this study focuses on the monsoon on the Chinese mainland. Subsequently, the monsoon continues its advance into North China before it weakens and retreats (the third stage). During each steady phase, an area called the rainband receives nearly continuous precipitation [12,13]. Within the steady phase over a given region, persistent heavy precipitation may be interrupted by short breaks, but the phase is not complete until the system makes the leap to the next region. The intensity of monsoon precipitation throughout each steady phase is as important as the stage length [13].
The EASM supplies water to more than 1.6 billion people in eastern Asia, including most of China’s population [14]. Variations in the timing and spatial configuration of the monsoon rainband have long influenced the annual agricultural cycle, affecting conditions for planting, crop growth, and the emergence of rice pests, as well as the migration patterns of numerous species [15,16]. As the rainband stretches east to west, paralleling most of the major river basins in China, it accentuates the impacts of floods during heavy monsoon-related precipitation [17]. For centuries, Chinese authorities have tracked the arrival of monsoon rains and the occurrence of monsoon-related droughts or floods [18,19]. Severe flooding in 1998 in the Yangtze River Basin, which inundated about 1900 km2 of land and caused over USD 27.3 billion in direct economic losses [20], is but one example of the kind of major economic damage that can result from unusually strong monsoon precipitation [21].
While the typical annual structure of the EASM is well understood, there is substantial interannual variability in the monsoon’s timing, rate of movement, and intensity of precipitation. Prior studies disagree whether the EASM has intensified [22] or weakened during recent decades [1]; whether the steady phase in East-Central China has shortened [23] or lengthened [24]; whether the observed pattern of “southern floods, northern droughts” in China is persistent; and how aerosol concentrations contribute to observed changes [25]. In the context of global climate change, anthropogenic aerosols are implicated in differing model predictions of whether dry regions will become drier and wet regions will become wetter, or vice versa, and to the movement of the Earth’s thermal equator [26].
Understanding the historical dynamics of monsoon systems is important for estimating the shift of the monsoon rainband associated with past global warming, as well as predicting future hydroclimatic trends [5,9]. Compared with changes in the mean state of the hydrological cycle, variations in the distribution of precipitation intensities may be more relevant to understanding the future impacts of hydrological changes [27]. The extreme precipitation associated with monsoons may be particularly susceptible to the influence of anthropogenic or natural climate change, and increases in extreme rainfall events pose substantial social costs [28,29]. Current climate models are challenged in their ability to correctly simulate patterns, seasonal variations, and characteristics of precipitation; hence, it is necessary to conduct observational studies [29].
While previous studies relied on a priori definitions of the monsoon season or the regional rainband steady phases based on long-term averages [30], for this paper, we systematically quantify the initial and end dates of the EASM rainband for each year to detect changes in the date of arrival, steady phase duration, and movement of the summer monsoon rainband in different regions of China. We analyze temporal changes in regional frequency, duration, and intensity of rainfall during each steady phase from 1960 through 2017. By analyzing the temporal change in monsoon rainband precipitation during the past several decades, this study helps explain how the EASM’s role in moisture transport has evolved under conditions of global warming.

2. Materials and Methods

2.1. Data

The study area consists of the Chinese mainland east of 105° E and north of 20° N. Daily precipitation for this study was provided by the National Meteorological Information Center through the China Meteorological Data Sharing Service Center (CMDC) (http://data.cma.cn/en accessed on 25 May 2018). As there are more gaps in the time series prior to 1960, we excluded those years from this study and relied only on data reported from 1960 to 2017 [31]. We inspected the datasets for discontinuities that could represent data errors or measurement inconsistencies and excluded 10 stations with missing data for three or more consecutive days, leaving 145 stations [31]. None of the stations used had more than four missing observations or two consecutive missing observations [32]. The observable range of precipitation is ≥0.1 mm/day, but the occurrence of trace precipitation (<0.1 mm/day) is also recorded in the dataset [32,33]. As shown in Figure 1a, the date of occurrence in maximum precipitation at each station reveals a zonal character, progressing from South to North China.

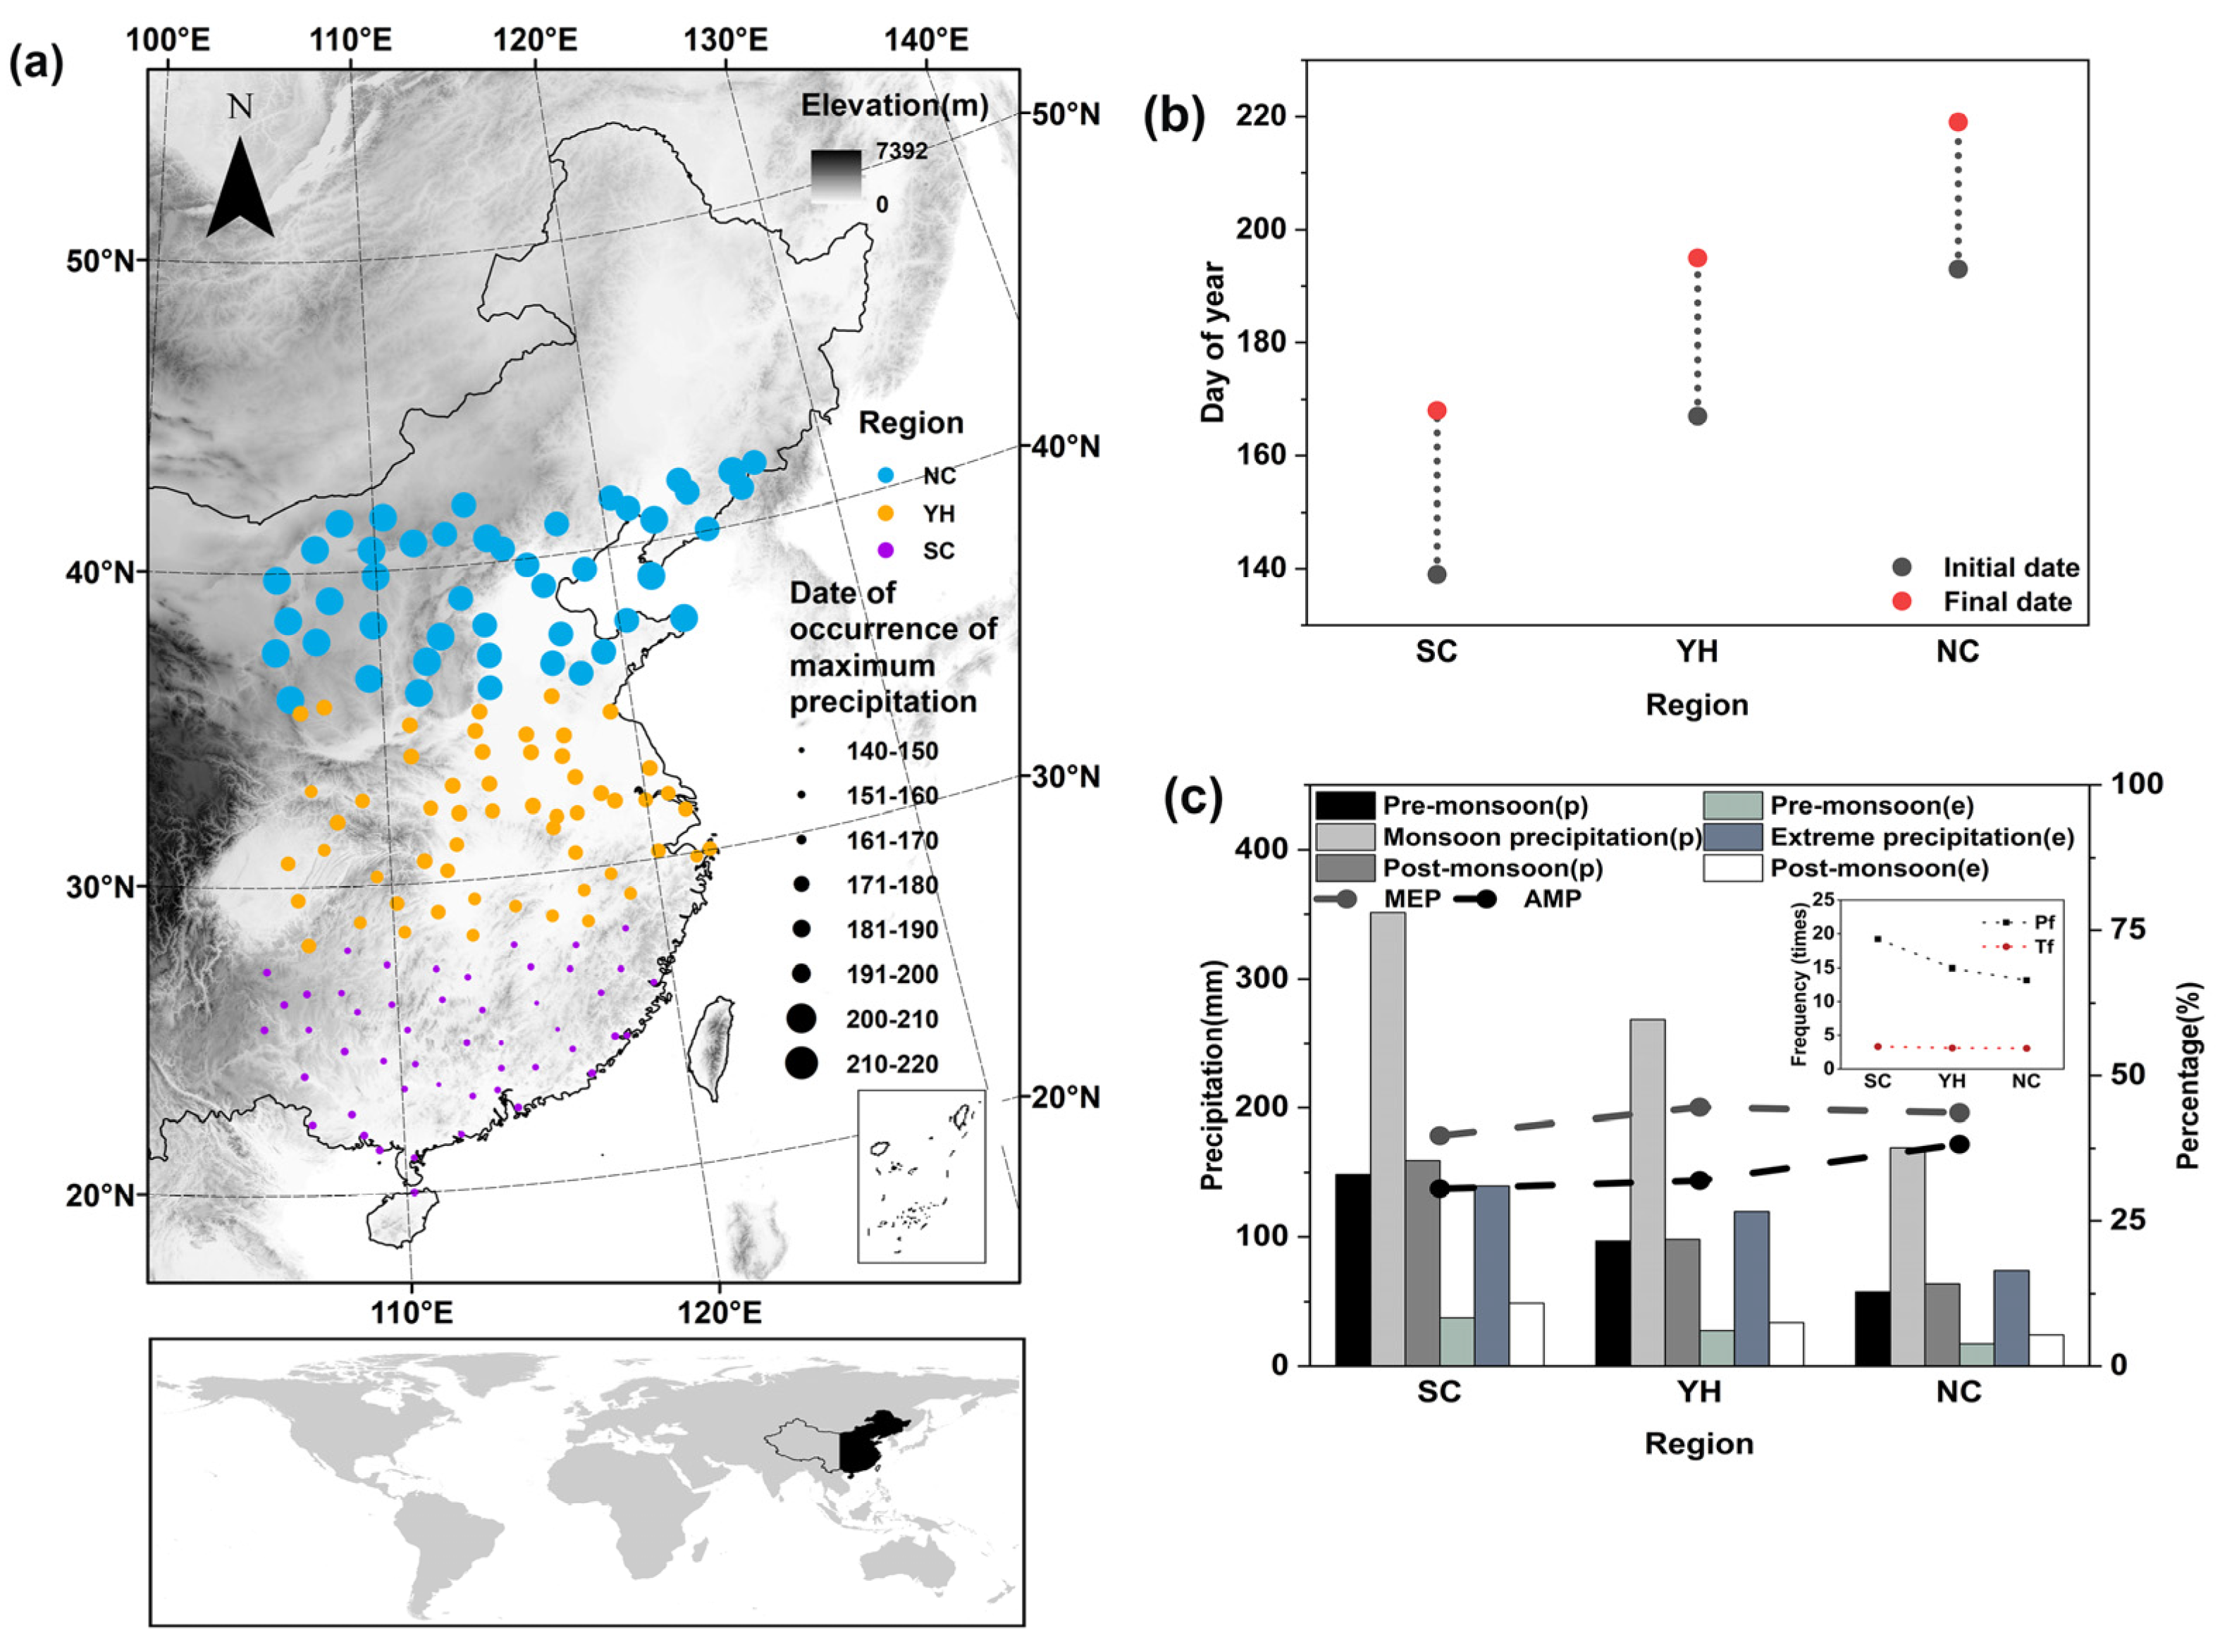
2.2. Definition of the Monsoon Rainband and Regionalization

In previous studies, monsoon steady periods have been identified based on subjective analyses [34] or have been assumed to occur over a fixed period [35], neither of which can consistently characterize the occurrence of the rainband in China. We follow Samel et al. [13] by defining the onset of the monsoon rainband at each station as the first occurrence of 6 or more days of persistent, heavy rainfall (>1.5% of the annual mean total) within a 25-day period that immediately follows 5 days of no measurable precipitation; similarly, the end date immediately precedes 5 consecutive days without precipitation.
As illustrated in Figure 1a, we analyzed three regions of China, classified by the study period average initial, final dates of the rainband steady phase, and date of occurrence maximum precipitation: South China (from 20° N to 28° N), the Yangtze–Huaihe region of East-Central China (28–35° N), and North China (35–42° N).

2.3. Methods of Analyzing Precipitation Characteristics

Daily precipitation totals ≥ 0.1 mm were treated as precipitation events (the precipitation amount for each event is defined as the accumulated total within a 24-h period, with multiple occurrences of precipitation on the same day aggregated into a single event). For extreme precipitation, there are several methods for defining extreme daily precipitation, including fixed thresholds, standard deviations, and percentile-based methods [36,37]. Given the large differences in water conditions across eastern China, this paper adopts the percentile-based threshold method to define extreme precipitation events: each station’s precipitation days (≥0.1 mm) during the study period are ranked, and then the value of the 95th percentile is taken as the threshold for extreme heavy precipitation events at the corresponding station. Precipitation indicator values for each region were calculated as the arithmetic average of all stations in the region. We calculated the trends based on the 1960–2017 time series for each region, including precipitation amount and frequency, trace frequency, and extreme precipitation amount and frequency. Precipitation frequency (or extreme precipitation frequency) is defined as the number of precipitation events (or extreme events) occurring during the stationary period of the monsoon rain belt; precipitation amount (or extreme precipitation amount) refers to the total precipitation accumulated from all precipitation events (or extreme events) within the same stationary period. Regression analysis was used to establish linear trends of precipitation events. We applied the t test to determine whether linear trends were significantly different from zero at various probability levels.
The Clausius–Clapeyron (C–C) relationship suggests that changes in precipitation depend on the climatology and are better analyzed as a percent change rather than in terms of absolute values or exceeding a particular threshold, so we express the trends as calculated both in absolute and percentage terms [29]. Precipitation rate refers to the average amount of precipitation per unit time, regardless of whether it rains only part of the time (that is, precipitation rate = total precipitation over a period of time/total number of days over a period of time) [38]. Similarly, precipitation frequency rate refers to the average number of days with any precipitation (≥0.1 mm) per unit time. The use of precipitation rate or precipitation frequency rate eliminates the influence of period length [38]. For the purpose of analyzing temporal variation in monsoon rainband precipitation, we applied a nine-point binomial filter, a method to smooth out the year-to-year variations in a time series and show the longer-term trend.

3. Results

3.1. Variation in the Monsoon Rainband Configuration

Over the 1960–2017 study period, the duration of the steady phase of the East Asian Summer Monsoon rainband over a given location is typically on the order of one month (Figure 1b). In South China (SC), the rainband steady period occurs on average from the 139th to the 168th day of the year; in the Yangtze–Huaihe region of East-Central China (YH), the meiyu rains occur from the 167th to the 195th day; and in North China (NC), the rainband period falls from the 193rd to the 219th day. These results are similar to the rainy season duration in China calculated by Wang et al. (2008) using climatic relative rainfall [39].
The advance of the monsoon air mass is usually associated with continuous heavy rainfall [40,41]. During the period that is not influenced by the monsoon, the rainfall tends to change gradually from day to day, but with the arrival of the summer monsoon, the increase in rainfall is much more conspicuous. The month of maximum rainfall usually occurs in the month when the monsoon air mass arrives. In China’s monsoon region, precipitation during the monsoon rainband steady phase accounts for more than twice as much rainfall as that during the periods of equivalent length before and after the rainband steady phase (Figure 1c). The disproportionality is even higher for extreme precipitation (Figure 1c). While the monsoon rainband contributed more than 30% of the summer half-year’s precipitation, the monsoon rainband extreme precipitation contributed more than 40% of the summer half-year’s extreme precipitation.
Over the 1960–2017 study period as a whole, the total monsoon rainband precipitation amount showed no significant change (Figure 2). But examining trends within the study period, we found a significant decline for the period of 1960 to 1985 (−0.474% per year, p < 0.05) and a significant increase from 1986 to 1998 (2.1% per year, p < 0.01), followed by an insignificant increase after 1998. These changes in monsoon rainband precipitation seem to correspond with the temporal character of climate change in continental land areas during this period, with temperature increases up to the mid-1980s mainly concentrated in winter and nighttime, then rapid warming in all seasons and during the daytime to end of the 20th century, followed by the so-called warming hiatus period of slower change in land temperatures in the early 2000s [42,43,44]. In order to better understand the connection between changes in the monsoon rainband configuration and precipitation character, here we examine the timing and intensity of the monsoon rainband and duration of the steady phase, mainly focusing on changes during periods of monsoon weakening and strengthening.
The seasonal march of the EASM rainband displays a distinctive stepwise advance northward across China. We first look at the temporal variability of the seasonal march of the EASM monsoon rainband (Figure 3). The time from the monsoon’s arrival on the Chinese mainland to its appearance in the northern increased significantly before 1985 (1.39% per year, p < 0.1) but decreased insignificantly during the period of 1986–1998 and increased insignificantly after 1998. The temporal change in the duration of the monsoon rainband’s march from South to North China is negatively correlated precipitation amount coming from the rainband (r = −0.43, p < 0.01). That is, the longer it took for the rainband to progress across China (including the transition and steady phases), the less monsoon rainband precipitation was recorded.
Regionally, we found high year-to-year variability in the initial date, final date, and duration of the monsoon rainband steady phases in SC and YH but less yearly variability in NC (Figure 4). The initial date of the monsoon rainband in SC trended earlier until around 1985 (−0.31% per year, p < 0.1) but reversed direction from 1986 to 1998 (delaying by 0.87% per year, p < 0.05) and remained relatively stable after 1998. The earlier arrival of the monsoon on the China mainland corresponded with lower monsoon rainband precipitation, while later arrival corresponded with higher monsoon rainband precipitation. The initial date of the monsoon in SC is highly correlated with the monsoon rainband precipitation amount (r = 0.43, p < 0.01).
For the period of 1960 to 2017, the duration of the monsoon rainband steady phase decreased in two regions at rates of −0.093% per year (p < 0.05) in YH and −0.099% per year (p < 0.05) in NC. Temporally, we found that SC and NC experienced parallel changes in the duration of the monsoon rainband steady phase, characterized by slight decreases during the weakening period and slight increases during the strengthening period, while changes in the YH duration were out of phase with those in the SC and NC. While the lengths of the transition periods from SC to YH and from YH to NC varied over the study period without a significant trend (Figure 5), the transition periods from SC to YH tended to follow the changes in the duration of the YH steady phase, increasing before 1985 and decreasing from 1986 to 1998 (the data filtering correlation coefficient is r = 0.36, p < 0.01, reflecting the consistency in the longer term temporal change).
Up to 1985, when trends favored the earlier arrival of the monsoon on the Chinese mainland, we observed that it took longer for the monsoon to progress from Southern to Northern China, but the monsoon rainband precipitation amount decreased. Then, when the trend shifted toward later monsoon arrival, the increased monsoon rainband precipitation amount was accompanied by a faster march from south to north. These patterns of strengthening or weakening EASM precipitation manifest one way in YH and a different way in SC and NC, with weakening monsoon rainband precipitation accompanied by longer YH to NC transition periods and vice versa.

3.2. Variation in the Monsoon Rainband Precipitation

From 1960 to 2017, total monsoon rainband precipitation for all three regions together did not show a significant change, but that finding masks asymmetrical regional changes. The monsoon rainband precipitation frequency, precipitation amount, and extreme precipitation amount are all highest in the south, though trace precipitation frequency is similar among regions (Figure 1c). Regionally, the amount of monsoon rainband precipitation over the entire study period showed significant decreasing trends of −0.448% (p < 0.01) per year in NC and nonsignificant increases in SC and YH (Figure 6a). Considering only the period to 1985, we found significant declines in NC (−1.41% per year, p < 0.10) and SC (−0.82% per year, p < 0.10) but nonsignificant increases in YH (0.63% per year, p = 0.21). All three regions show significant increases from 1986 to 1998 (2.20% per year in NC, p < 0.10; 2.08% per year in YH, p < 0.10; 3.04% per year in SC, p < 0.05). After 1998, we found no significant trends in regional monsoon rainband precipitation.
The weakening of the EASM rainband precipitation, characterized by a decrease in NC and SC but a slight increase in YH before 1985, is a kind of spatially tripole. Moreover, our findings show that during the strengthening period from the mid-1980s to the late 1990s, all three regions converged into a single pattern of significantly enhanced EASM rainband precipitation.
Considering the precipitation rate (the average amount of precipitation per unit time) during the steady phase of the monsoon rainband over the entire study period, we found a significant decrease in NC (−0.343% per year, p < 0.05) but a significant increase in YH (0.302% per year, p < 0.05) (Figure 6b). The increase in the monsoon rainband precipitation rate in SC is not significant. Within the study period, up to 1985, we found a significant decrease in NC but insignificant changes in YH and SC, then significant increases until the late 1990s in all regions. The initial decrease in NC corresponds to the monsoon weakening period, while the later increase across all regions corresponds to the strengthening period.
For the precipitation frequency rate (the number of days with precipitation per unit time), over the entire study period, we found significantly decreasing trends in NC (−0.363% per year, p < 0.01) and SC (−0.146% per year, p < 0.05) but a nonsignificant decrease in YH (Figure 6c). While NC shows a more or less steady decline in the precipitation frequency rate across the study period, the decline in SC occurs mainly from the mid-1970s to 1990.

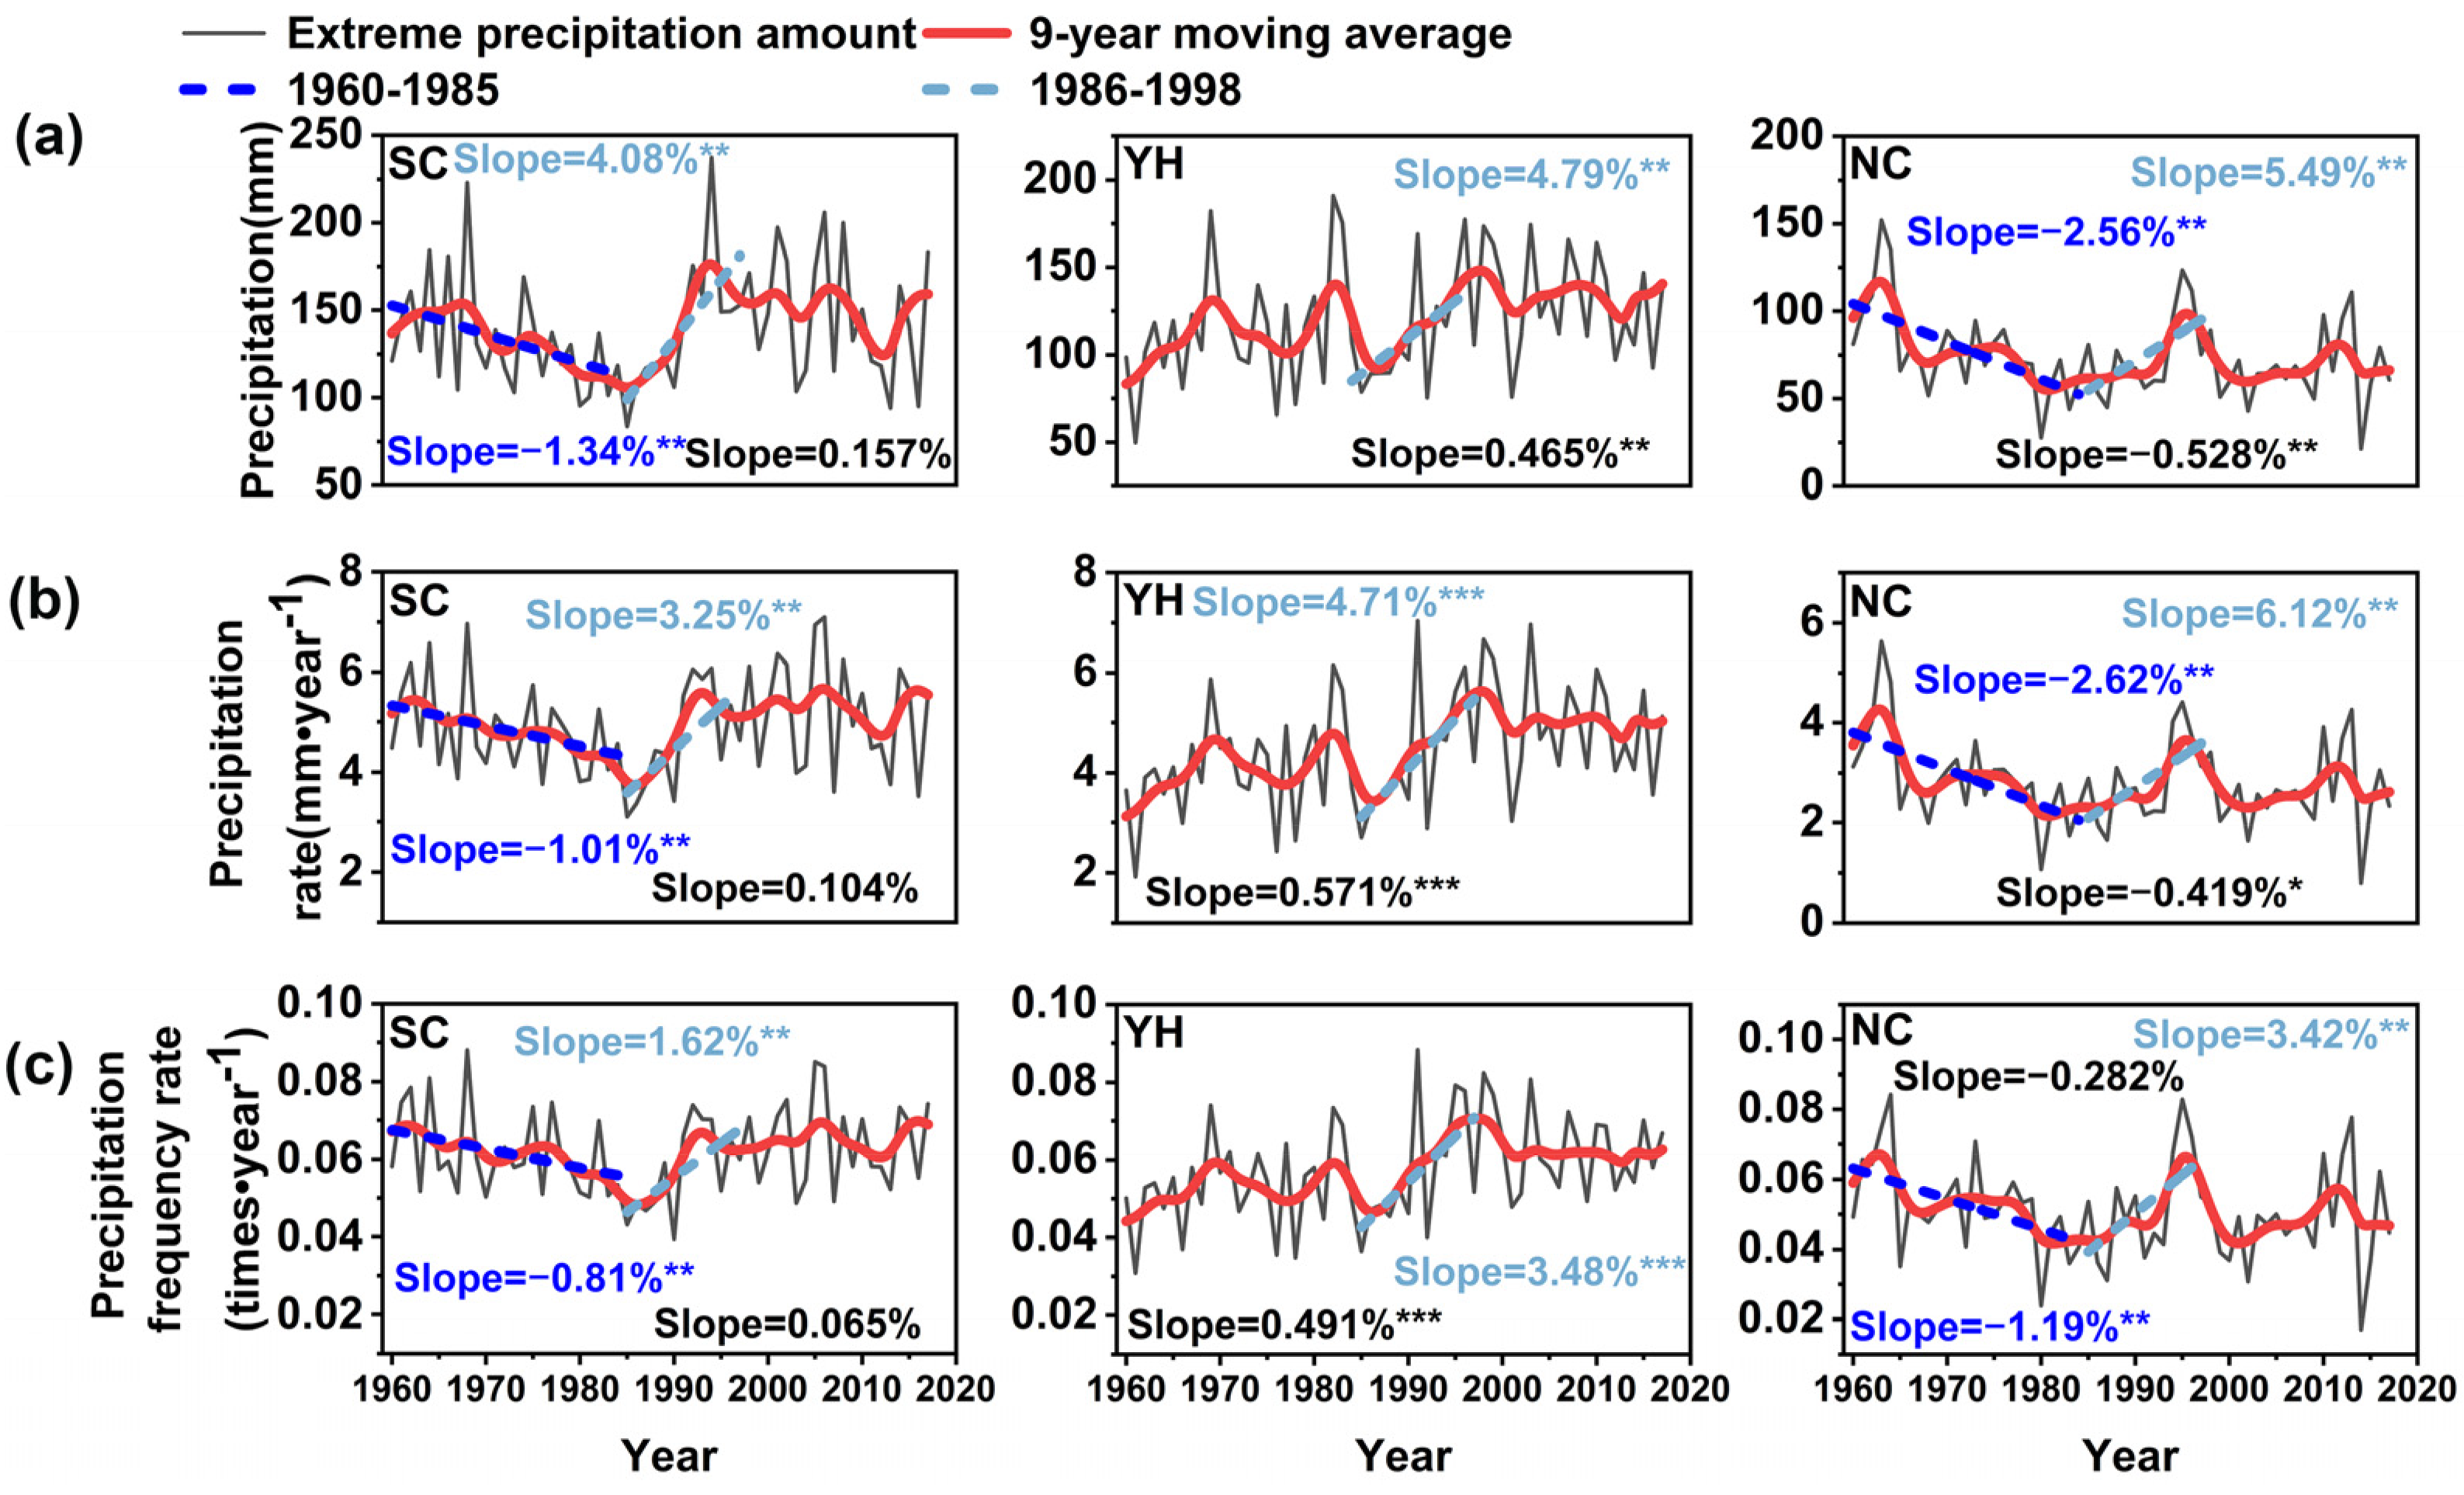
3.3. Variation in the Monsoon Rainband Extreme Precipitation

The amount of extreme monsoon rainband precipitation over the entire 1960–2017 study period showed a significant decreasing trend of −0.528% (p < 0.05) per year in NC and a significant increasing trend of 0.465% (p < 0.05) per year in YH but no significant trend in SC (Figure 7a). Within the study period, up to 1985, we found significant decreases in NC (−2.56% per year, p < 0.05) and SC (−1.34% per year, p < 0.05), followed by significant increases from 1986 to 1998 in all regions (NC: 5.49% per year, p < 0.05; YH: 4.79% per year, p < 0.05; SC: 4.08% per year, p < 0.05). Comparing the trends for extreme precipitation with those for all monsoon rainband precipitation (Section 3.2 above), we see that extreme precipitation increased faster in NC, about the same in YH, and slower in SC. Thus, the change in extreme precipitation contributed more to the overall change in monsoon precipitation in the north.
A comparison of the changes in total and extreme monsoon rainband precipitation reveals that, during the rapid warming period of 1985 to 1998, the magnitude of changes in extreme precipitation accounts for about 53% of the changes in total monsoon precipitation in SC in absolute terms. In YH and NC, the changes in extreme precipitation are actually greater than the changes in total monsoon precipitation (102% and 108%, respectively). In relative terms, the magnitude of change in monsoon rainband extreme precipitation surpasses that of monsoon rainband total precipitation in all regions by factors of 3.0, 2.0, and 1.2 times for NC, YH, and SC, respectively.
Within the study period, regional changes in the extreme precipitation rate and the extreme precipitation frequency rate generally correspond to the periods of monsoon weakening and strengthening previously noted, with three disparate regional patterns during the weakening phase to about 1985, followed by converging regional trends during the strengthening phase to 1998. We found generally similar results comparing the magnitudes of the changes in total precipitation rate and extreme precipitation rate, revealing that, during the period of rapid warming from 1985 to 1998, in relative terms, the extreme precipitation rate changed by a greater magnitude than the total precipitation rate in all regions, by factors of about 3.25, 2.24, and 1.39 times for NC, YH, and SC, respectively. The difference is slightly greater if we exclude the effect of changes in the duration of the steady phase. This indicates that changes in the duration of the steady phase have a limited effect on the change in monsoon rainband precipitation.

3.4. Asymmetrical Regional Changes in Precipitation Amount

Monsoon precipitation has behaved quite differently in Northern China compared with the regions to the south; the northern region has often been inversely correlated with the Yangtze–Huaihe in terms of climatic trends [45]. We found that the regional share of monsoon rainband precipitation increased significantly for YH (0.267% per year, p < 0.05) and decreased significantly in NC (−0.383% per year, p < 0.01) (Figure 8). That is, the decrease in the northern region was mostly offset by increases to the south (mainly in YH), further heightening the “southern floods, northern droughts” contrast. But these changes in the regional shares of monsoon rainband precipitation were mainly concentrated during the monsoon weakening period up to about 1985.
In SC, the regional share of monsoon rainband precipitation saw no significant change from the late 1960s to the mid-1980s. Then, from the mid-1980s to the late 1990s, NC saw lower rates of increase compared with SC and YH, so NC’s share of monsoon rainband precipitation continued to decrease through that period, albeit at a slower pace than before.
The decrease in precipitation amount in the north results from both the shortened duration of the steady phase and the decrease in extreme precipitation. By contrast, the significant increase in the precipitation rate in YH is partly masked by the shortened steady phase duration, resulting in an insignificant increase in the precipitation amount. Our results also show that NC and YH tend to behave in opposition to each other in terms of their shares of the monsoon rainband precipitation up to the year 1985, with contrasting precipitation patterns (Figure 8). In general, changes in both monsoon rainband configuration and precipitation contributed to the spatiotemporal changes in monsoon rainband precipitation. The contrast of “southern floods, northern droughts” is most obvious between YH and NC, especially during the period of monsoon weakening but continuing at a much slower rate during the monsoon strengthening period.

4. Discussion

How summer monsoons are responding to a warming climate is still an open question [25]. By most measures, the East Asian Summer Monsoon and the neighboring Indian Summer Monsoon have both weakened over the same time period [46]. Currently, most studies use wind speed to indicate the strength of the monsoon, while rainfall is commonly used to indicate the spatial and temporal characteristics of the monsoon. However, there is still a controversy over the type of indicator to be used to indicate the strength of the monsoon [47]. For example, some scholars directly define the strength of the monsoon by the amount of precipitation during the rainy season. As the meiyu front is the major rain-bearing system of the EASM, they argue that it is more meaningful to call a season with an abundant meiyu a strong monsoon season. In this interpretation, the causes responsible for the monsoon’s stepwise march and its interannual variation are fundamentally different [47].
Some scholars have contended that during weak monsoon periods, the movement of the monsoon rainband slows down and stays longer in the southern region, which would explain the phenomenon of flooding in the middle and lower reaches of the Yangtze River basin and leaving less moisture remaining for transport to the north [48], building on the prior consensus that a weakened EASM would induce a shortened duration of the steady phase in Northern China [49]. On a regional scale, reduced water vapor transport due to the weakening of the East Asian monsoon circulation can be seen in changes in the spatiotemporal configuration of the monsoon rainband, including the shortened duration of steady phases in NC, prolonged transitions between SC and YH and between YH and NC.
Our observations point to flaws in a recent model simulation showing significant reductions in Northern Hemisphere land monsoon precipitation over the past 120 years [50]. We found no significant change in total monsoon rainband precipitation over mainland China during the 1960–2017 study period. However, we added important spatiotemporal detail: the so-called “southern floods, northern droughts” pattern [51] is most obvious between the YH and NC regions and during the weakening monsoon period up to about 1985. Changes in extremes also support this interpretation: NC saw declines throughout the study period while YH increased.
Due to the close relationship between near-surface air temperature and precipitation, climate change is expected to lead to an increase in precipitation variability [52]. As shown in Figure 9a, air temperatures across the entire eastern region have increased significantly at a rate of 0.02 °C per year, most obviously during 1985–1998. Figure 9b reveals significant positive correlations of both the total precipitation and the extreme precipitation of the monsoon rainband with regional air temperatures, with the air temperature–extreme precipitation correlation being stronger than the air temperature–total precipitation relationship. This suggests that extreme precipitation is more sensitive to warming, as expected by the Clausius–Clapeyron relationship, which states that “climate warming enhances atmospheric moisture-holding capacity, thereby intensifying precipitation” [53].
Regionally, during the period of rapid warming between 1985 and 1998, monsoon rainband extreme precipitation increased significantly in all three study regions, with the rate of change surpassing that of monsoon rainband total precipitation. We note that changes in precipitation and extreme precipitation may not solely stem from warming but also involve dynamic effects [54,55]. Increased precipitation requires both elevated water vapor content and sustained updrafts linked to wind convergence [54]. Thermally driven moisture accumulation may amplify latent heat release during convection, which reinforces updrafts and further promotes precipitation through dynamic feedback mechanisms [56]. As demonstrated in previous studies, the rise in precipitation—particularly extreme precipitation—is driven jointly by thermodynamic effects (e.g., moisture increases) and dynamic effects (e.g., enhanced updrafts) [54,55]. Thus, enhanced humid air mass transportation and increased air temperatures may have jointly contributed to the results seen during the rapid warming period.
We have conducted a detailed analysis of the movement characteristics of the monsoon rainband and the trend changes in precipitation features. However, the underlying causes driving these changes in monsoon rainband characteristics require further investigation.

5. Conclusions

In conclusion, this study provides valuable insights into the changing dynamics of the EASM on the Chinese mainland and its regional implications for precipitation patterns. Monsoon systems are vital components of the Earth’s climate, with significant impacts on moisture redistribution, hydrological cycles, and agricultural sustainability. Our analysis of precipitation data spanning several decades leads to these main findings:
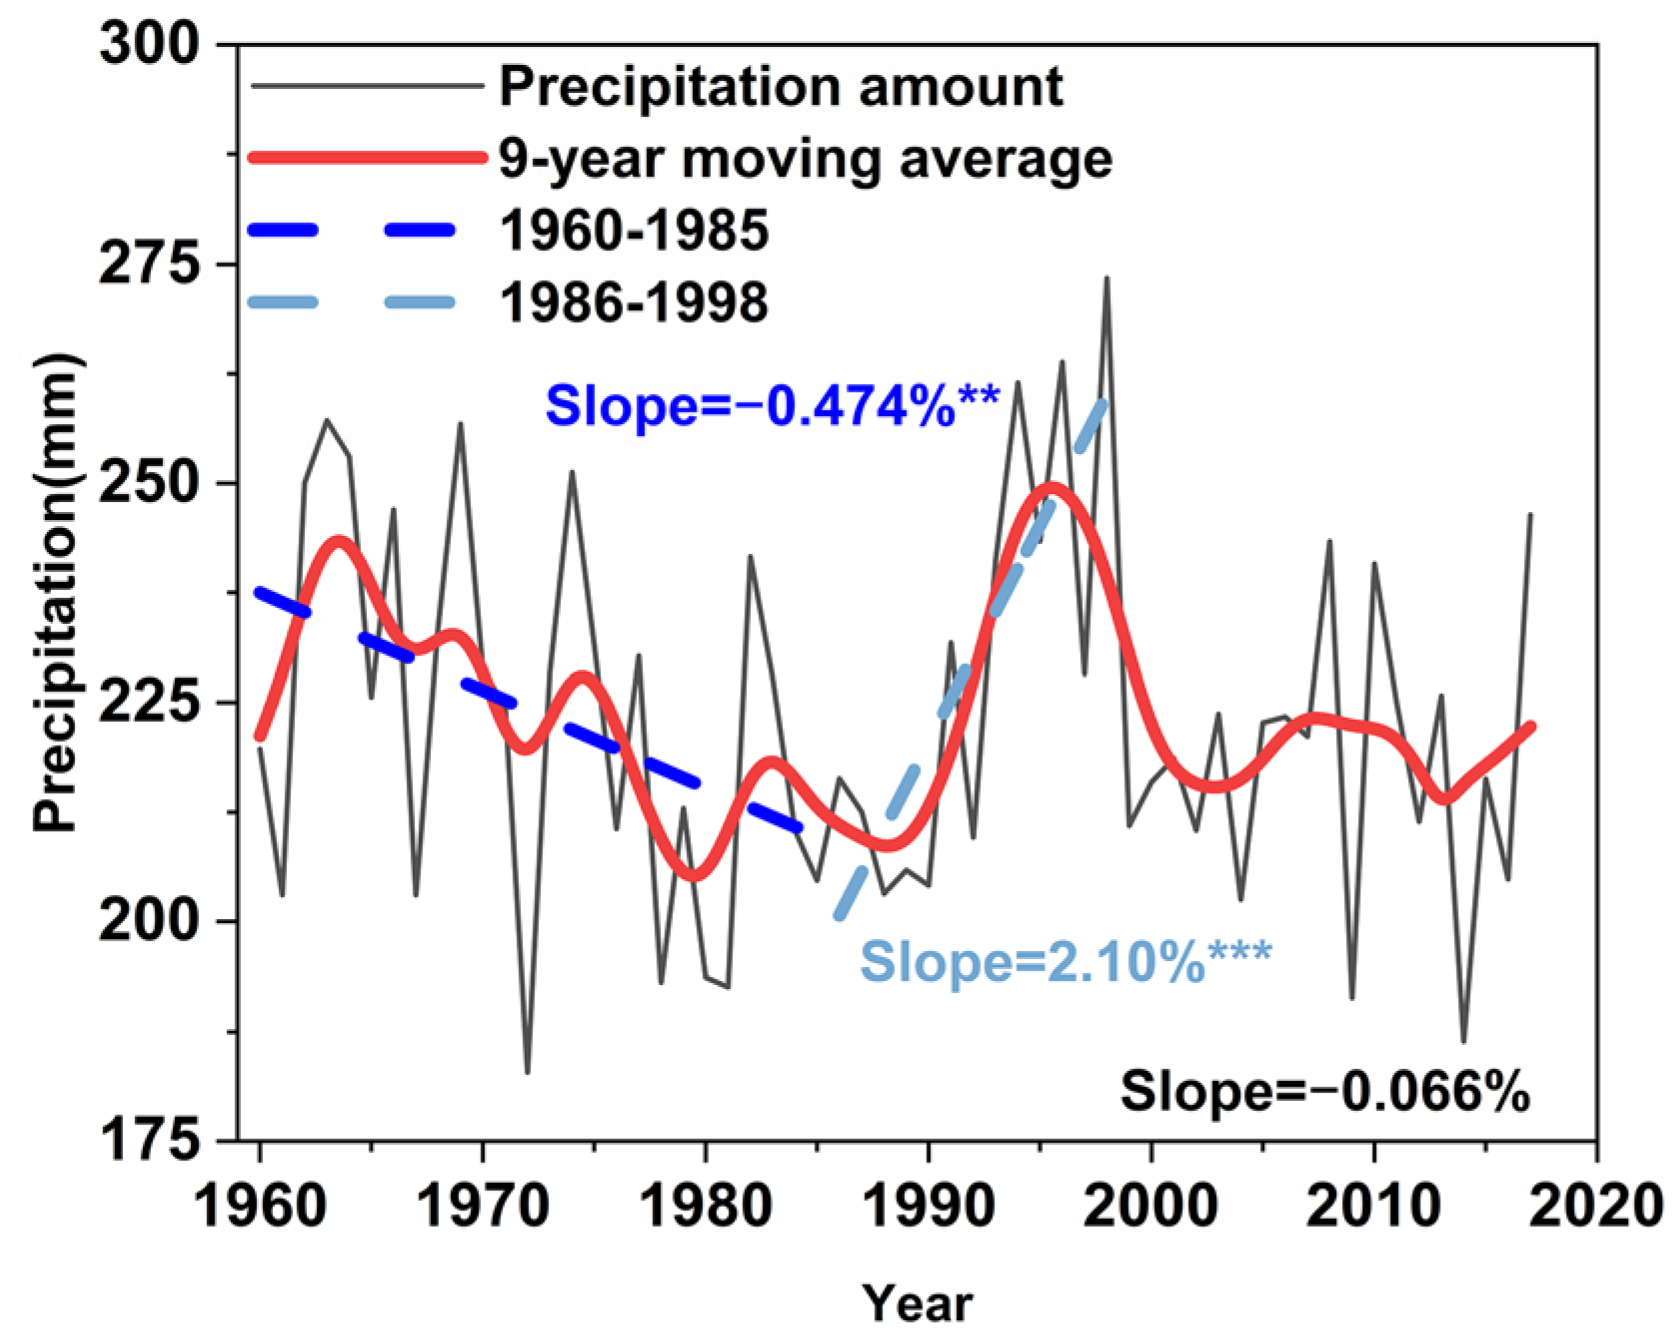
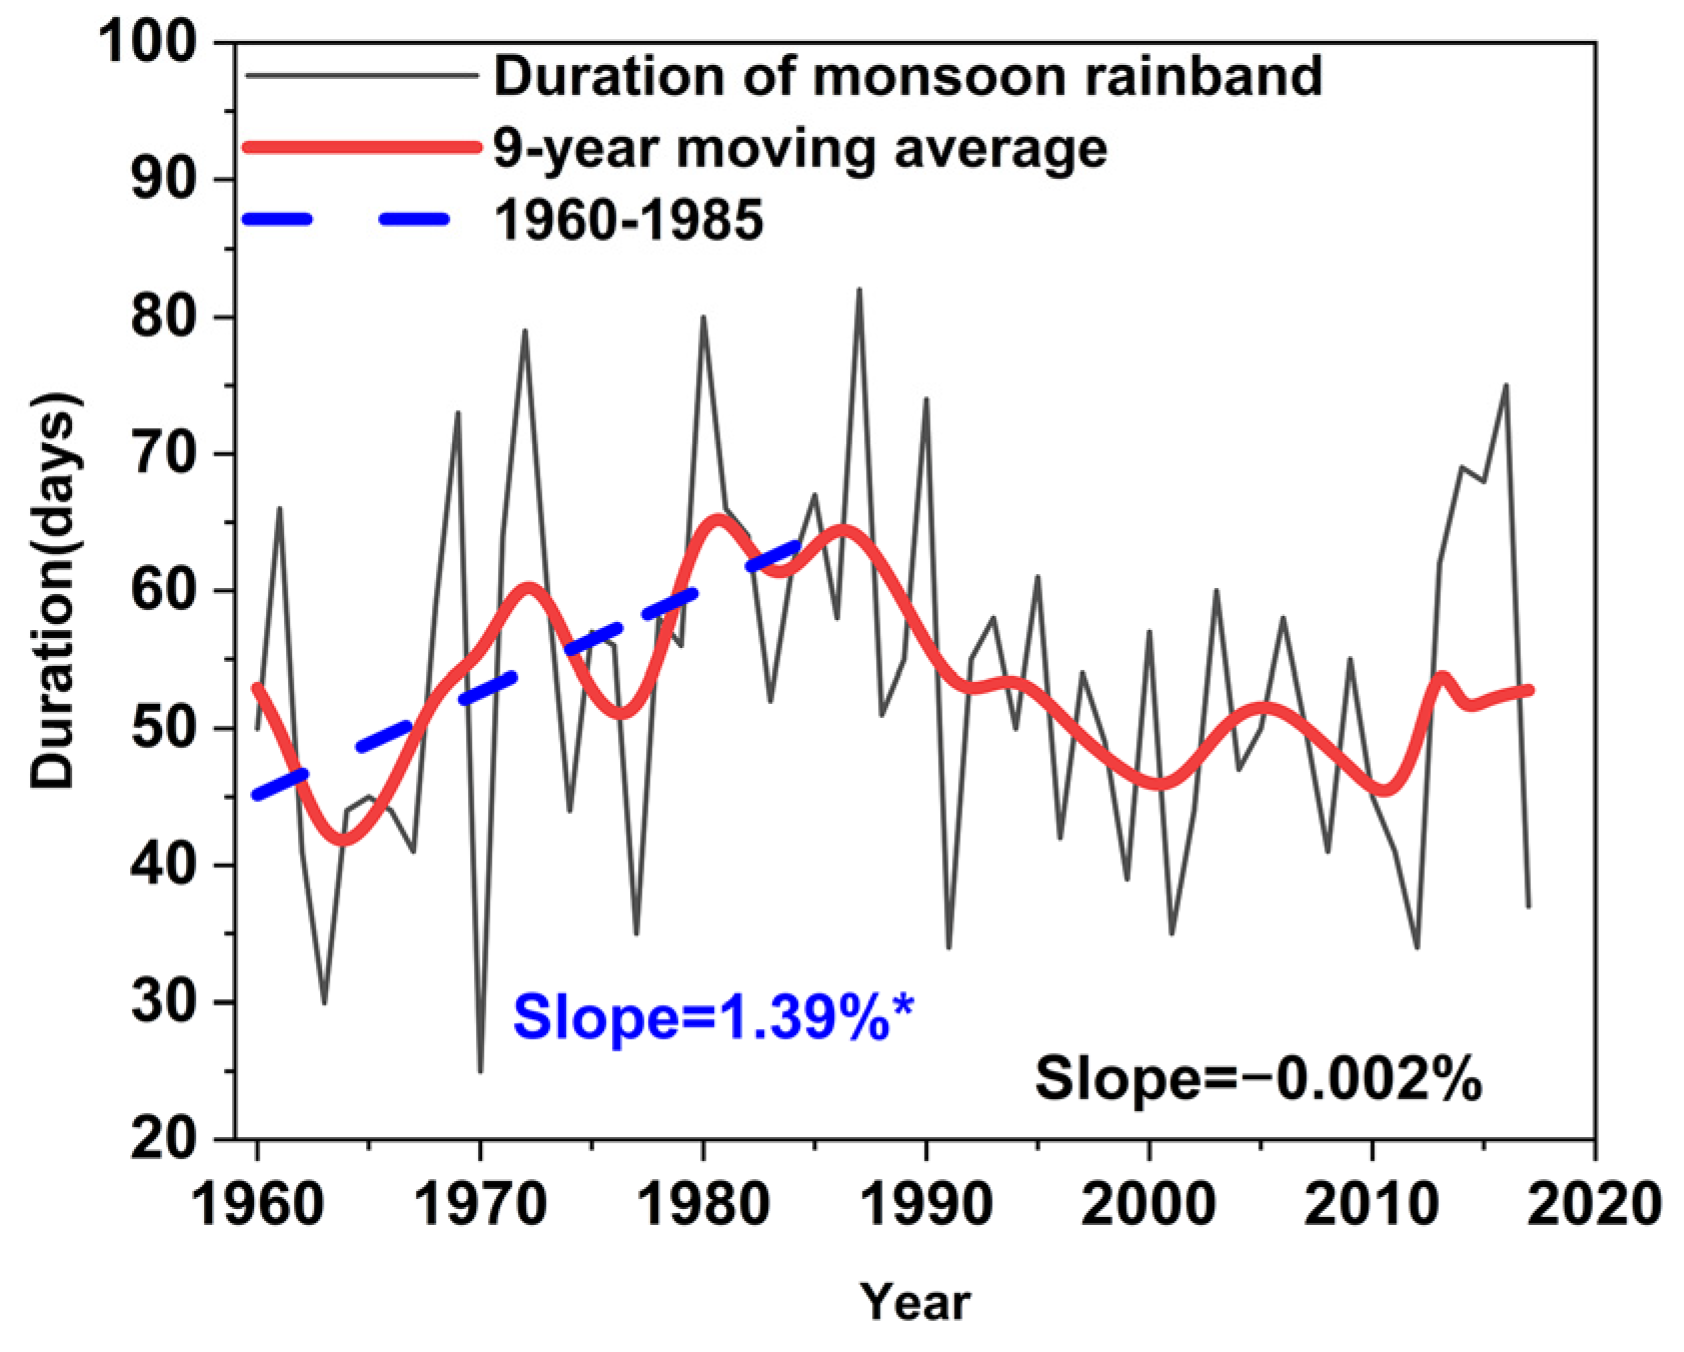
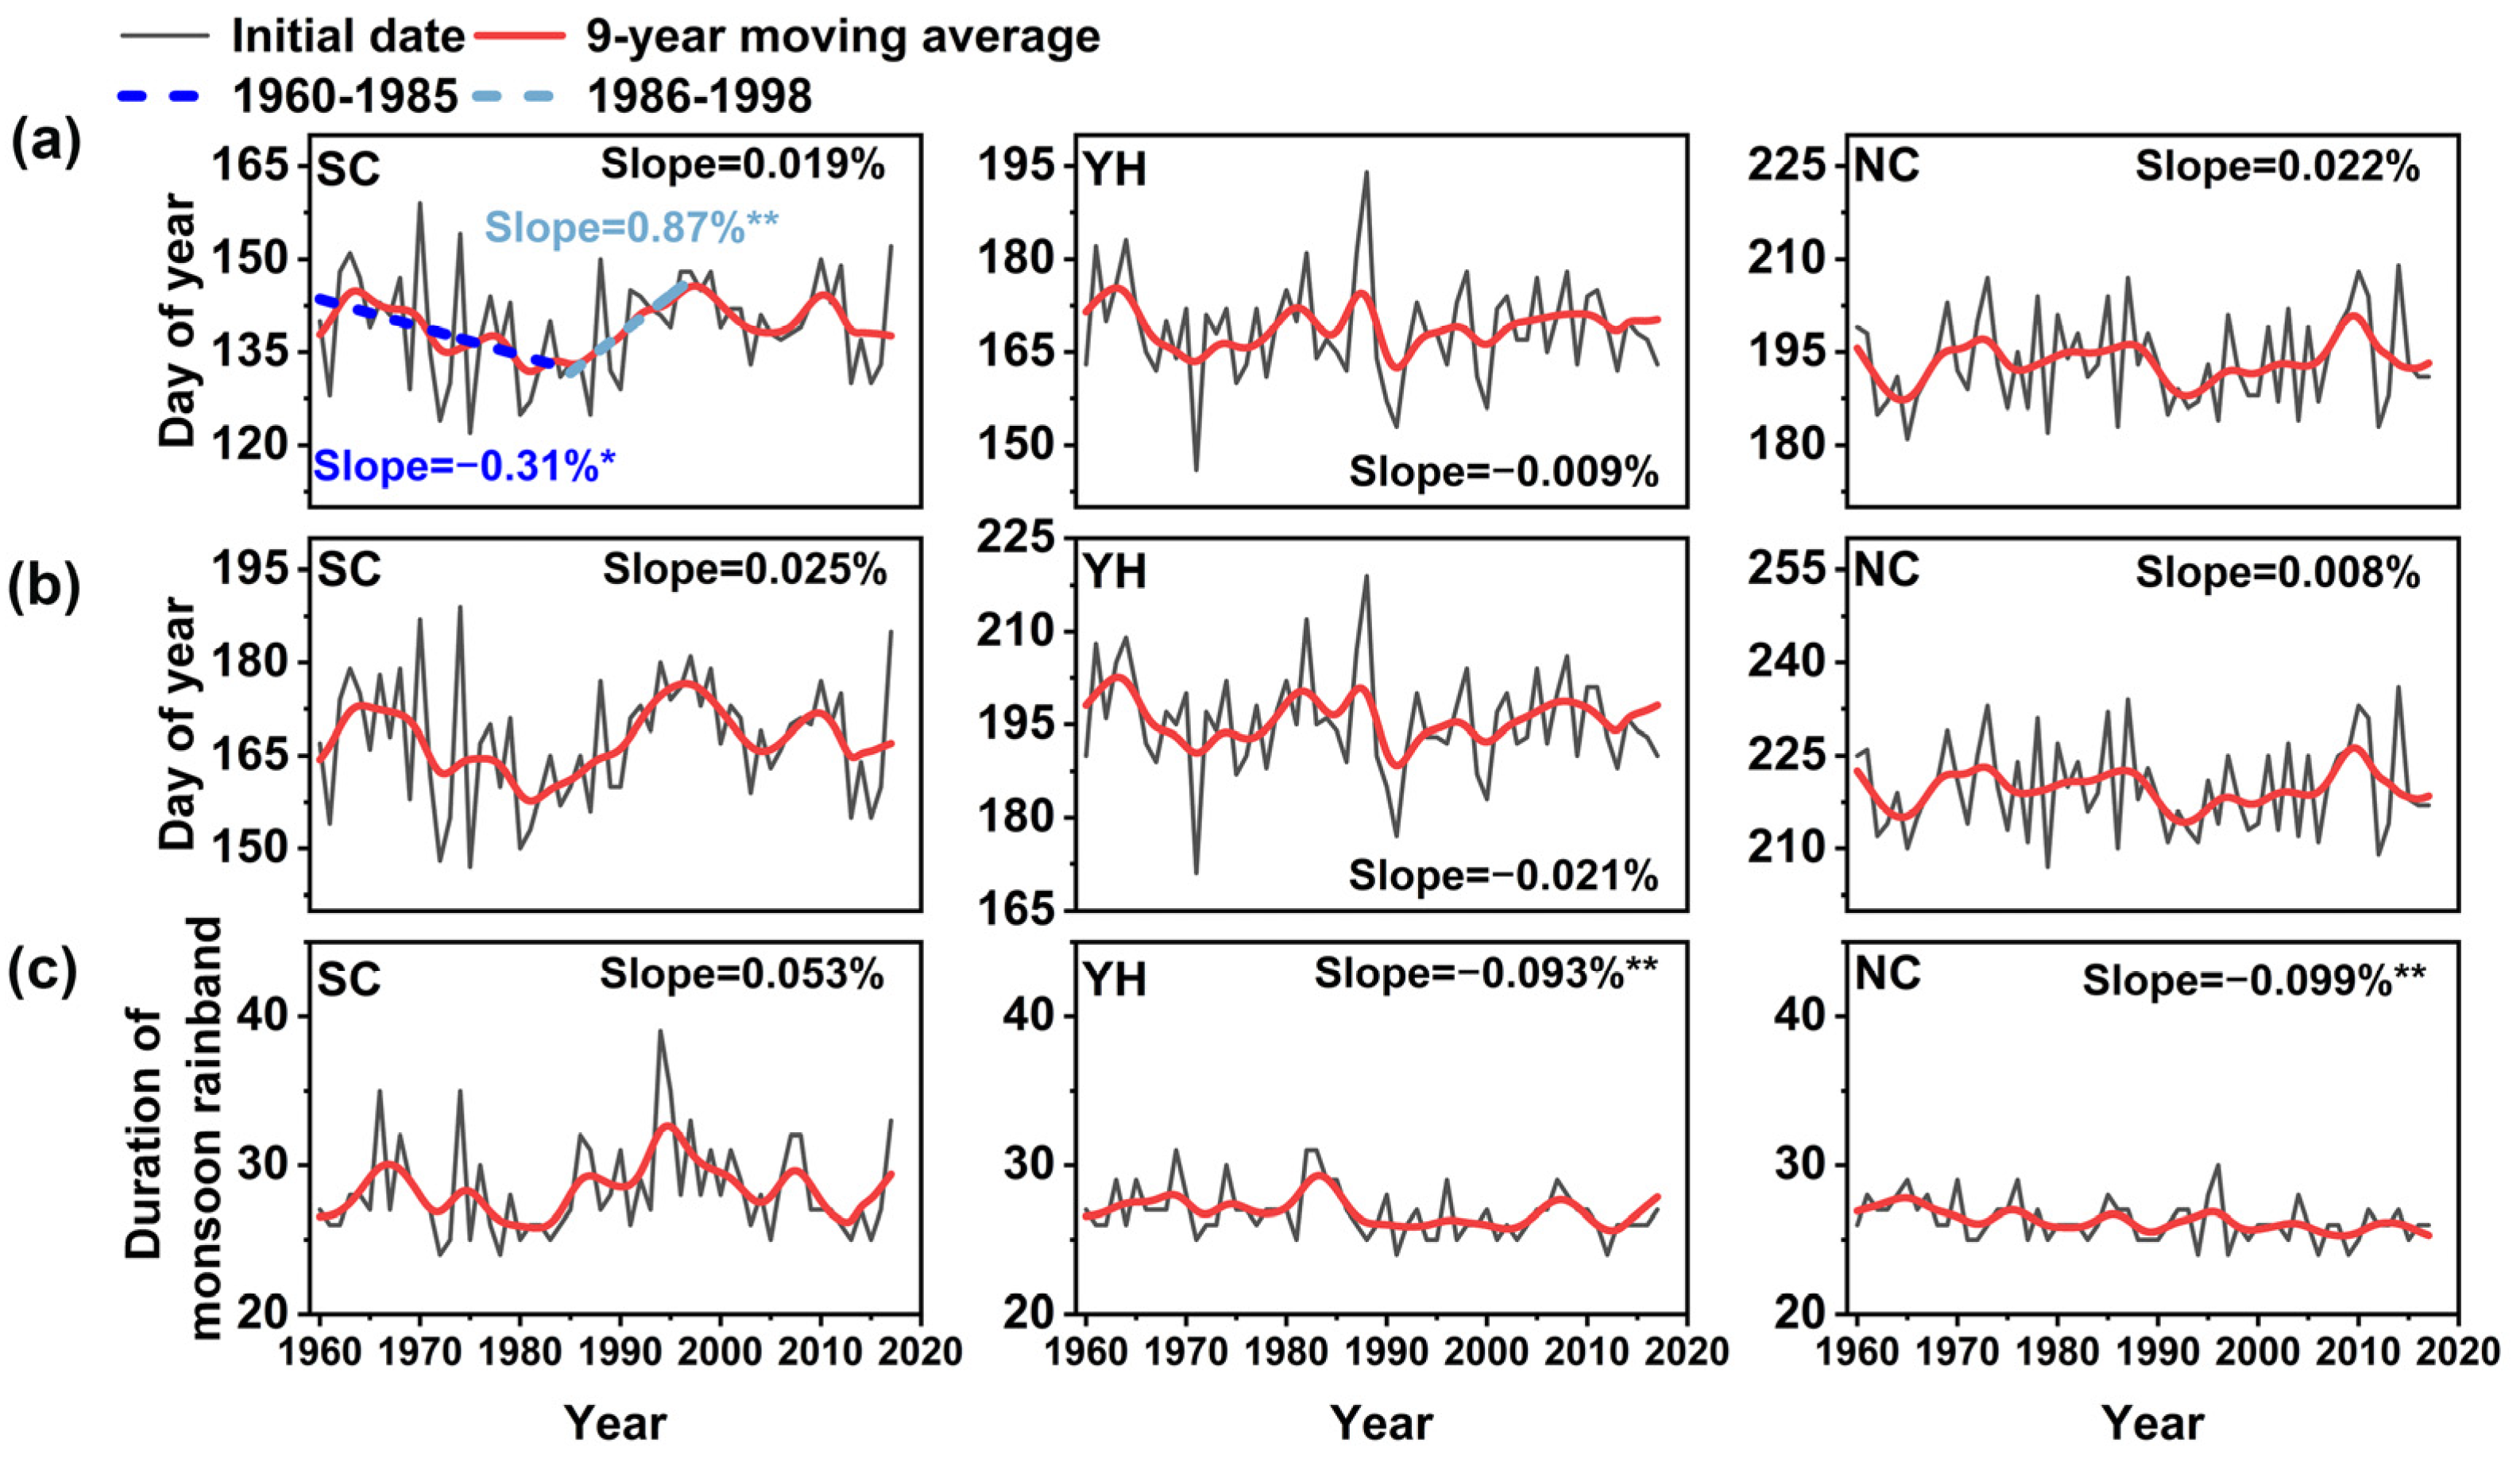
  • Monsoon rainband precipitation in eastern China decreased from 1960 to the mid-1980s (−0.47% per year), then increased to around 1998 (2.10% per year). This reflects the weakening and then strengthening of the monsoon. During the monsoon weakening period, the monsoon arrived earlier on the Chinese mainland (−0.31% per year), with a longer transition period from SC to YH and a longer duration of the monsoon rainband’s march from South to North China (1.39% per year). The opposite pattern characterized the strengthening period.
  • The monsoon rainband precipitation rate decreased significantly in NC (−1.09% per year) but showed no significant change in the other regions during the weakening monsoon period; all three regions showed significant increases in the strengthening monsoon period, with the greatest increases in the south (SC: 2.33% per year, YH: 2.10% per year, and NC: 1.87% per year).
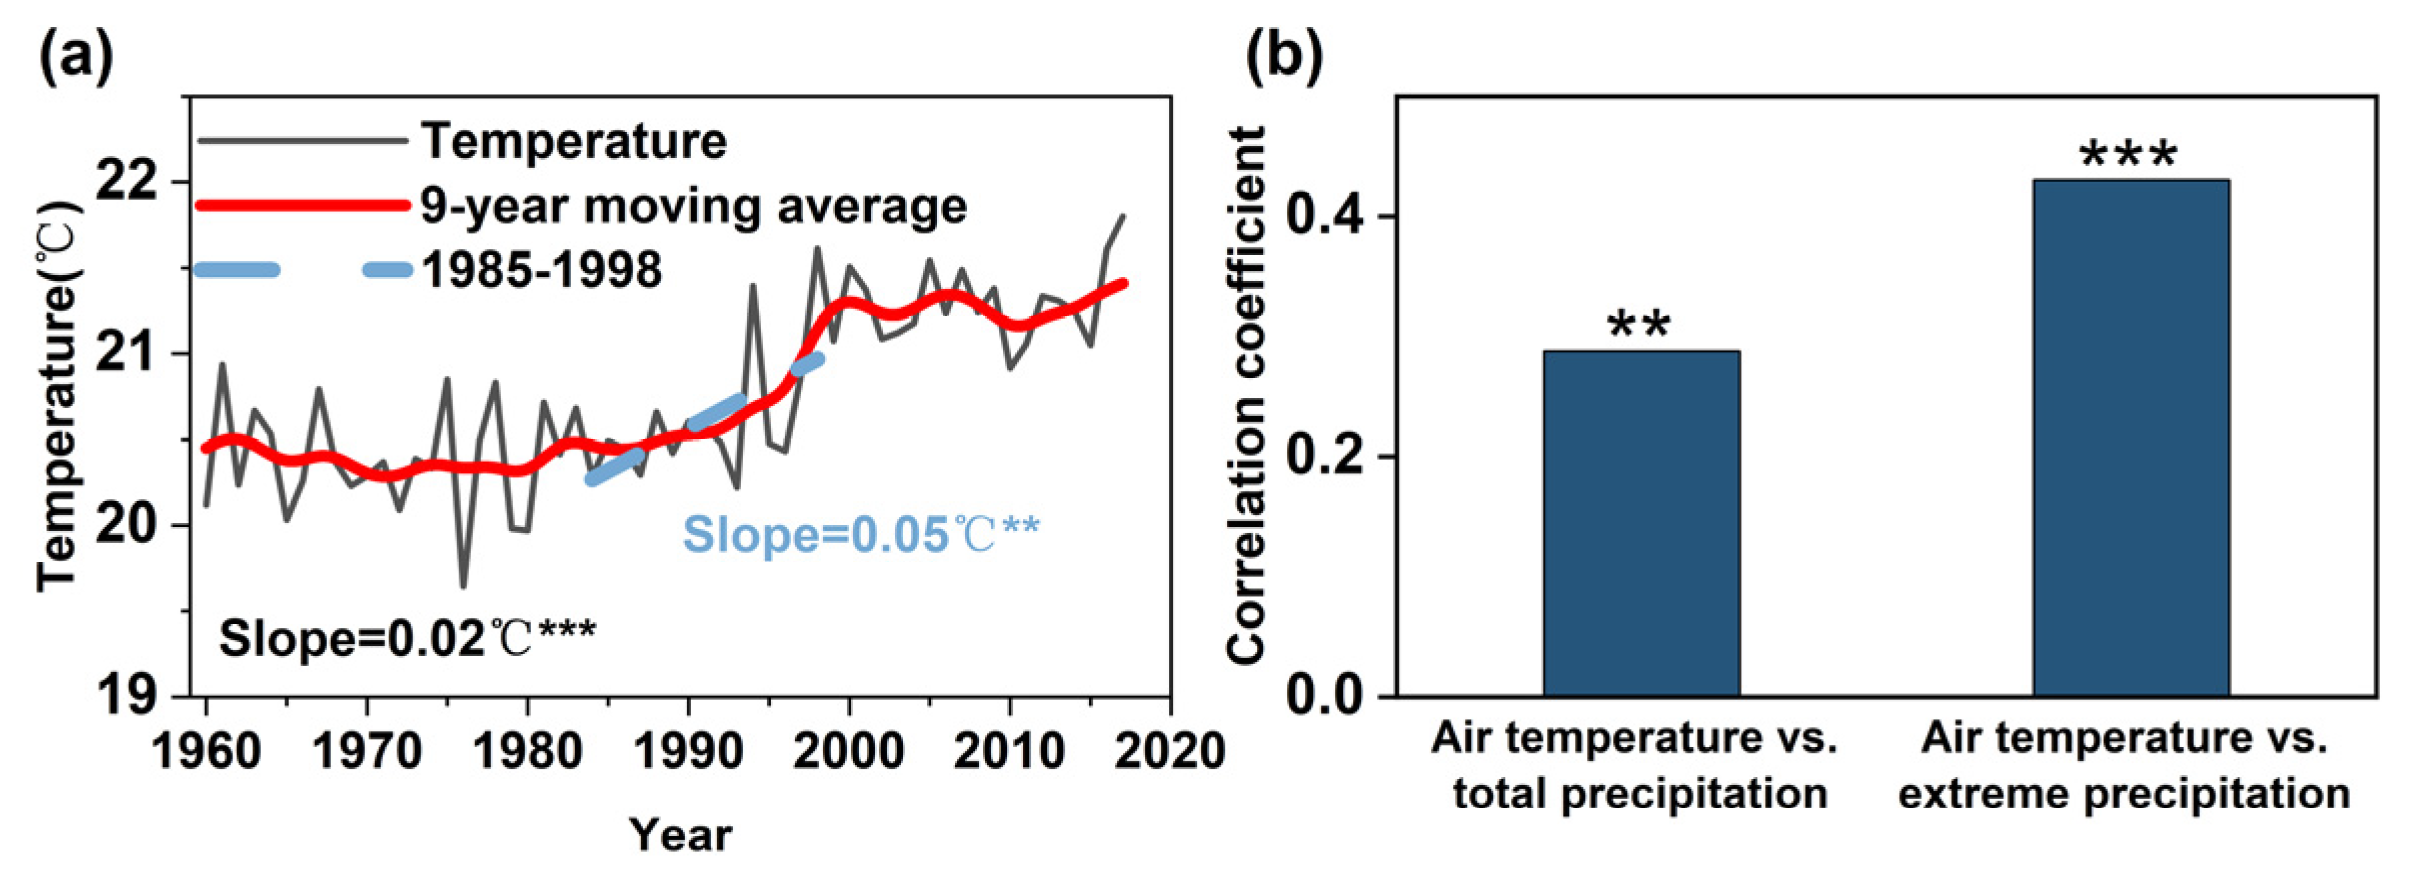
  • The extreme precipitation rate decreased significantly in NC (−1.01% per year) and SC (−2.62% per year) but showed no significant change in YH during the weakening monsoon period, then increased significantly in all three regions during the strengthening monsoon period, again with the greatest increases in the north (SC: 3.25% per year, YH: 4.71% per year, NC: 6.12% per year). Changes in extreme precipitation (95th percentile) contributed to most of the change in monsoon rainband precipitation, especially during the warming period.
Our results confirm that changes in both the configuration and precipitation character of the East Asian Summer Monsoon contribute to the pattern of “southern floods, northern droughts” in China. The pattern is most obvious between the YH and NC regions and during the weakening monsoon period up to about 1985. Furthermore, the rapid warming period from 1985 to 1998 only continued the “southern floods, northern droughts” pattern. These findings highlight the complex interplay between natural variability and anthropogenic influences, underscoring the need for integrated approaches to address the challenges posed by changing monsoon dynamics.

Author Contributions

Conceptualization, Z.D. and B.L.; methodology, Z.D.; software, M.C. and Z.Z.; validation, W.Z. and R.M.; formal analysis, Z.D.; resources, B.L.; data curation, W.Z.; writing—original draft preparation, Z.D.; writing—review and editing, B.L. and M.H.; visualization, M.H.; supervision, B.L.; project administration, B.L.; funding acquisition, B.L. All authors have read and agreed to the published version of the manuscript.

Funding

This research was funded by the National Natural Science Foundation of China, grant number 41877416.

Data Availability Statement

The “daily data set of surface climate data in China” from 1 January 1951 through 31 December 2017 was provided by the China Meteorological Data Service Centre (CMDC). Restrictions apply to the availability of these data. Data were obtained from http://data.cma.cn/en (accessed on 25 May 2018) and are available with the permission of the China Meteorological Data Service Centre.

Acknowledgments

We gratefully acknowledge the National Natural Science Foundation of China and the Youth Innovation Promotion Association, Chinese Academy of Sciences, for funding this work.

Conflicts of Interest

The authors declare no conflicts of interest.

Abbreviations

The following abbreviations are used in this manuscript:
EASMEast Asian Summer Monsoon
SCSouth China
YHthe lower Yangtze and Huaihe river basins of East-Central China
NCNorth China

References

  1. Xu, M.; Chang, C.-P.; Fu, C.; Qi, Y.; Robock, A.; Robinson, D.; Zhang, H.-m. Steady decline of east Asian monsoon winds, 1969–2000: Evidence from direct ground measurements of wind speed. J. Geophys. Res.-Atmos. 2006, 111, 24111. [Google Scholar] [CrossRef]
  2. Turner, A.G.; Annamalai, H. Climate change and the South Asian summer monsoon. Nat. Clim. Chang. 2012, 2, 587–595. [Google Scholar] [CrossRef]
  3. Chen, F.; Xu, Q.; Chen, J.; Birks, H.J.B.; Liu, J.; Zhang, S.; Jin, L.; An, C.; Telford, R.J.; Cao, X.; et al. East Asian summer monsoon precipitation variability since the last deglaciation. Sci. Rep. 2015, 5, 11186. [Google Scholar] [CrossRef]
  4. Mohtadi, M.; Prange, M.; Steinke, S. Palaeoclimatic insights into forcing and response of monsoon rainfall. Nature 2016, 533, 191–199. [Google Scholar] [CrossRef]
  5. Yang, S.; Ding, Z.; Li, Y.; Wang, X.; Jiang, W.; Huang, X. Warming-induced northwestward migration of the East Asian monsoon rain belt from the Last Glacial Maximum to the mid-Holocene. Proc. Natl. Acad. Sci. USA 2015, 112, 13178–13183. [Google Scholar] [CrossRef]
  6. Li, Z.; Lau, W.K.M.; Ramanathan, V.; Wu, G.; Ding, Y.; Manoj, M.G.; Liu, J.; Qian, Y.; Li, J.; Zhou, T.; et al. Aerosol and monsoon climate interactions over Asia. Rev. Geophys. 2016, 54, 866–929. [Google Scholar] [CrossRef]
  7. Xie, X.; Wang, H.; Liu, X.; Li, J.; Wang, Z.; Liu, Y. Distinct effects of anthropogenic aerosols on the East Asian summermonsoon between multidecadal strong and weakmonsoon stages. J. Geophys. Res.-Atmos. 2016, 121, 7026–7040. [Google Scholar] [CrossRef]
  8. Kumar, P. Seasonal rain changes. Nat. Clim. Chang. 2013, 3, 783–784. [Google Scholar] [CrossRef]
  9. Lau, K.-M.; Li, M.-T. The monsoon of East Asia and its global associations—A survey. Bull. Am. Meteorol. Soc. 1984, 65, 114–125. [Google Scholar] [CrossRef]
  10. T’u, C.-W.; Hwang, S.-S. The advance and retreat of the summer monsoon in China. Bull. Am. Meteorol. Soc. 1945, 26, 9–22. [Google Scholar] [CrossRef]
  11. Liu, J.; Fung, I.Y.; Chiang, J.C.H. East Asian Rainbands and Associated Circulation over the Tibetan Plateau Region. J. Clim. 2022, 35, 3211–3225. [Google Scholar] [CrossRef]
  12. Samel, A.N.; Wang, W.-C.; Liang, X.-Z. The monsoon rainband over China and relationships with the Eurasian circulation. J. Clim. 1999, 12, 115–131. [Google Scholar] [CrossRef]
  13. Lu, H.; Yi, S.; Liu, Z.; Mason, J.A.; Jiang, D.; Cheng, J.; Stevens, T.; Xu, Z.; Zhang, E.; Jin, L.; et al. Variation of East Asian monsoon precipitation during the past 21 k.y. and potential CO2 forcing. Geology 2013, 41, 1023–1026. [Google Scholar] [CrossRef]
  14. Lv, H.; Zhai, M.-Y.; Zeng, J.; Zhang, Y.-Y.; Zhu, F.; Shen, H.-M.; Qiu, K.; Gao, B.-Y.; Reynolds, D.R.; Chapman, J.W.; et al. Changing patterns of the East Asian monsoon drive shifts in migration and abundance of a globally important rice pest. Glob. Chang. Biol. 2023, 29, 2655–2668. [Google Scholar] [CrossRef]
  15. Bai, B.; Zhang, Q.; Shao, W.; Wang, Y.; Tan, D. The Response of the Aerosol Distribution to Monsoon Intensity Over the Summer Monsoon Transition Zone. Front. Earth Sci. 2020, 7, 356. [Google Scholar] [CrossRef]
  16. Chang, C.-P. East Asian Monsoon; World Scientific: Singapore, 2004; Volume 2. [Google Scholar]
  17. Chu, C.-C. Climatic pulsations during historic time in China. Geogr. Rev. 1926, 16, 274–282. [Google Scholar] [CrossRef]
  18. Ramage, C. Variation of rainfall over south China through the wet season. Bull. Am. Meteorol. Soc. 1952, 33, 308–311. [Google Scholar] [CrossRef]
  19. Gang, Z.; Xiang, K. A preliminary study on the causes of the two major floods of the Yangtze River in 1954 and 1998 and their prevention and control measures. J. Catastrophol. 1999, 14, 22–26. [Google Scholar] [CrossRef]
  20. Wang, J.; Tao, S. Structure and Formation of Mei-Yu Front in 1998. J. Appl. Meteorol. Sci. 2002, 13, 526–534. [Google Scholar] [CrossRef]
  21. Li, H.; Dai, A.; Zhou, T.; Lu, J. Responses of East Asian summer monsoon to historical SST and atmospheric forcing during 1950–2000. Clim. Dyn. 2010, 34, 501–514. [Google Scholar] [CrossRef]
  22. Chiang, J.C.H.; Swenson, L.M.; Kong, W. Role of seasonal transitions and the westerlies in the interannual variability of the East Asian summer monsoon precipitation. Geophys. Res. Lett. 2017, 44, 3788–3795. [Google Scholar] [CrossRef]
  23. Chang, C.; Zhang, Y.; Li, T. Interannual and interdecadal variations of the East Asian summer monsoon and tropical Pacific SSTs. Part I Roles Subtrop. Ridge. J. Clim. 2000, 13, 4310–4325. [Google Scholar] [CrossRef]
  24. Li, J.; Wu, Z.; Jiang, Z.; He, J. Can Global Warming Strengthen the East Asian Summer Monsoon? J. Clim. 2010, 23, 6696–6705. [Google Scholar] [CrossRef]
  25. Held, I.M.; Soden, B.J. Robust responses of the hydrological cycle to global warming. J. Clim. 2006, 19, 5686–5699. [Google Scholar] [CrossRef]
  26. Zahn, R. Global change—Monsoon linkages. Nature 2003, 421, 324–325. [Google Scholar] [CrossRef]
  27. Wang, Y.; Ma, P.-L.; Jiang, J.H.; Su, H.; Rasch, P.J. Toward reconciling the influence of atmospheric aerosols and greenhouse gases on light precipitation changes in Eastern China. J. Geophys. Res.-Atmos. 2016, 121, 5878–5887. [Google Scholar] [CrossRef]
  28. Thackeray, C.W.; Hall, A.; Norris, J.; Chen, D. Constraining the increased frequency of global precipitation extremes under warming. Nat. Clim. Chang. 2022, 12, 441–448. [Google Scholar] [CrossRef]
  29. Trenberth, K.E. Changes in precipitation with climate change. Clim. Res. 2011, 47, 123–138. [Google Scholar] [CrossRef]
  30. Liang, X.-Z.; Samel, A.N.; Wang, W.-C. Observed and GCM simulated decadal variability of monsoon rainfall in east China. Clim. Dyn. 1995, 11, 103–114. [Google Scholar] [CrossRef]
  31. Liu, B.; Henderson, M.; Xu, M.; Zhang, Y. Observed changes in precipitation on the wettest days of the year in China, 1960–2000. Int. J. Climatol. 2011, 31, 487–503. [Google Scholar] [CrossRef]
  32. Liu, B.; Xu, M.; Henderson, M. Where have all the showers gone? Regional declines in light precipitation events in China, 1960–2000. Int. J. Climatol. 2011, 31, 1177–1191. [Google Scholar] [CrossRef]
  33. Choi, Y.-S.; Ho, C.-H.; Kim, J.; Gong, D.-Y.; Park, R.J. The impact of aerosols on the summer rainfall frequency in China. J. Appl. Meteorol. Climatol. 2008, 47, 1802–1813. [Google Scholar] [CrossRef]
  34. Liu, Y.; Giorgi, F.; Washington, W.M. Simulation of summer monsoon climate over East Asia with an NCAR regional climate model. Mon. Weather Rev. 1994, 122, 2331–2348. [Google Scholar] [CrossRef]
  35. Nitta, T.; Hu, Z.-Z. Summer climate variability in China and its association with 500 hPa height and tropical convection. J. Meteorol. Soc. Jpn. Ser. II 1996, 74, 425–445. [Google Scholar] [CrossRef]
  36. Du, H.; Wu, Z.; Zong, S.; Meng, X.; Wang, L. Assessing the characteristics of extreme precipitation over northeast China using the multifractal detrended fluctuation analysis. J. Geophys. Res.-Atmos. 2013, 118, 6165–6174. [Google Scholar] [CrossRef]
  37. Li, J.; Yan, H.; Zhu, Z. Quantitative Analysis of Changes of Summer Extremes Temperature and Precipitation Days over China with Respect to the Mean Temperature Increase. Plateau Meteorol. 2020, 39, 532–542. [Google Scholar] [CrossRef]
  38. Trenberth, K.E.; Dai, A.; Rasmussen, R.M.; Parsons, D.B. The changing character of precipitation. Bull. Am. Meteorol. Soc. 2003, 84, 1205–1217. [Google Scholar] [CrossRef]
  39. Wang, Z.; Ding, Y. Climatic Characteristics of Rainy Seasons in China. Chin. J. Atmos. Sci. 2008, 32, 1–13. [Google Scholar] [CrossRef]
  40. Erxu, Z.; Gang, Z.; Jianhua, J.U.; Shuhui, Z. Impacts of activity of tropical monsoon air mass on the rainy season of Yunnan. J. Yunnan Univ. Nat. Sci. 2011, 33, 428–433,438. [Google Scholar]
  41. Nishimura, M.; Matsunaka, T.; Wang, J.; Matoba, S.; Tsushima, A.; Zhu, L.; Izutsu, Y. Sources and behavior of monsoon air masses in the lowest-latitude region on the Tibetan Plateau, and their paleoclimatic implications. Palaeogeogr. Palaeoclimatol. Palaeoecol. 2020, 554, 109750. [Google Scholar] [CrossRef]
  42. Liu, B.H.; Xu, M.; Henderson, M.; Qi, Y.; Li, Y.Q. Taking China’s temperature: Daily range, warming trends, and regional variations, 1955–2000. J. Clim. 2004, 17, 4453–4462. [Google Scholar] [CrossRef]
  43. Easterling, D.R.; Horton, B.; Jones, P.D.; Peterson, T.C.; Karl, T.R.; Parker, D.E.; Salinger, M.J.; Razuvayev, V.; Plummer, N.; Jamason, P. Maximum and minimum temperature trends for the globe. Science 1997, 277, 364–367. [Google Scholar] [CrossRef]
  44. Li, Q.; Yang, S.; Xu, W.; Wang, X.L.; Jones, P.; Parker, D.; Zhou, L.; Feng, Y.; Gao, Y. China experiencing the recent warming hiatus. Geophys. Res. Lett. 2015, 42, 889–898. [Google Scholar] [CrossRef]
  45. Clift, P.D.; Guedes, J.d.A. Monsoon Rains, Great Rivers and the Development of Farming Civilisations in Asia; Cambridge University Press: Cambridge, UK, 2021. [Google Scholar]
  46. Simpkins, G. Shorter monsoon season. Nat. Clim. Change 2017, 7, 388. [Google Scholar] [CrossRef]
  47. Wang, B.; Wu, Z.; Li, J.; Liu, J.; Chang, C.-P.; Ding, Y.; Wu, G. How to measure the strength of the East Asian summer monsoon. J. Clim. 2008, 21, 4449–4463. [Google Scholar] [CrossRef]
  48. Ding, Y.; Sun, Y.; Wang, Z.; Zhu, Y.; Song, Y. Inter-decadal variation of the summer precipitation in China and its association with decreasing Asian summer monsoon Part II: Possible causes. Int. J. Climatol. 2009, 29, 1926–1944. [Google Scholar] [CrossRef]
  49. Zhang, H.; Griffiths, M.L.; Chiang, J.C.H.; Kong, W.; Wu, S.; Atwood, A.; Huang, J.; Cheng, H.; Ning, Y.; Xie, S. East Asian hydroclimate modulated by the position of the westerlies during Termination I. Science 2018, 362, 580–583. [Google Scholar] [CrossRef]
  50. Cao, J.; Wang, H.; Wang, B.; Zhao, H.; Wang, C.; Zhu, X. Higher Sensitivity of Northern Hemisphere Monsoon to Anthropogenic Aerosol Than Greenhouse Gases. Geophys. Res. Lett. 2022, 49, e2022GL100270. [Google Scholar] [CrossRef]
  51. Ding, Y.; Wang, Z.; Sun, Y. Inter-decadal variation of the summer precipitation in East China and its association with decreasing Asian summer monsoon. Part I Obs. Evid. Int. J. Climatol. 2008, 28, 1139–1161. [Google Scholar] [CrossRef]
  52. Wang, B.; Biasutti, M.; Byrne, M.P.; Castro, C.; Chang, C.-P.; Cook, K.; Fu, R.; Grimm, A.M.; Ha, K.-J.; Hendon, H.; et al. Monsoons Climate Change Assessment. Bull. Am. Meteorol. Soc. 2021, 102, E1–E19. [Google Scholar] [CrossRef]
  53. Lenderink, G.; Fowler, H.J. Understanding rainfall extremes. Nat. Clim. Chang. 2017, 7, 391–393. [Google Scholar] [CrossRef]
  54. Tahara, R.; Hiraga, Y.; Kazama, S. Climate change effects on the localized heavy rainfall event in northern Japan in 2022: Uncertainties in a pseudo-global warming approach. Atmos. Res. 2025, 314, 107780. [Google Scholar] [CrossRef]
  55. Hiraga, Y.; Tahara, R.; Meza, J. A methodology to estimate Probable Maximum Precipitation (PMP) under climate change using a numerical weather model. J. Hydrol. 2025, 652, 132659. [Google Scholar] [CrossRef]
  56. Nakakita, E. An influence of atmospheric stabilization and water vapor invasion on characteristics of guerrilla-heavy rainfall under climate change. Kyoto Univ. Disaster Prev. Res. Inst. Annu. Rep. 2020, 63, 241. (In Japanese) [Google Scholar]
Figure 1. Spatial climatological characteristics of East Asian Summer Monsoon rainband. (a) Geographical distribution of the 145 weather stations used in this study by region: SC = South China, YH = the lower Yangtze and Huaihe river basins of East-Central China, and NC = North China. (b) The initial and final day of the year (DOY) of monsoon steady rainband by region. (c) Precipitation amount by region (p = all precipitation, e = extreme precipitation, AMP = monsoon rainband precipitation as a percentage of summer half-year total, and MEP = monsoon rainband extreme precipitation as a percentage of summer half-year extreme total); inset: multi-year average precipitation frequency by region during monsoon rainband steady phase (Pf = precipitation frequency, Tf = trace frequency).
Earth 06 00024 g001
Figure 2. Temporal change in monsoon rainband precipitation amount in eastern China. Dashed trend lines represent subperiods with significant linear trends (p < 0.10). Asterisks indicate significant trends: ** p < 0.05, *** p < 0.01.
Earth 06 00024 g002
Figure 3. The interval between the initial date of the monsoon rainband in South China and the initial date in North China. Dashed trend lines represent subperiods with a significant linear trend (p < 0.10). Asterisks indicate significant trends: * p < 0.10.
Earth 06 00024 g003
Figure 4. Temporal changes in the initial date, final date, and duration of the monsoon rainband, 1960–2017, by region. SC = South China, YH = the lower Yangtze and Huaihe river basins of East-Central China, and NC = North China. (a) Initial dates (day of the year); (b) final dates; (c) duration of monsoon rainband. The red line is the result of smoothing with a nine-point binomial filter with reflected ends. Asterisks indicate significant trends: * p < 0.10, ** p < 0.05.
Earth 06 00024 g004
Figure 5. Duration of the transition period of the monsoon rainband: (a) from SC to YH and (b) from YH to NC. The red line is the result of smoothing with a nine-point binomial filter with reflected ends. The dashed lines represent subperiods with significant trends (p < 0.10). Asterisks indicate significant trends: * p < 0.10, ** p < 0.05.
Earth 06 00024 g005
Figure 6. Monsoon rainband precipitation characteristics, 1960–2017, by region: SC = South China, YH = the lower Yangtze and Huaihe river basins of East-Central China, and NC = North China. (a) Precipitation amount; (b) precipitation rate; (c) precipitation frequency rate. The red line is the result of smoothing with a nine-point binomial filter with reflected ends. Asterisks indicate significant trends: * p < 0.10, ** p < 0.05, *** p < 0.01.
Earth 06 00024 g006
Figure 7. Extreme monsoon rainband precipitation characteristics, 1960–2017, by region: SC = South China, YH = the lower Yangtze and Huaihe river basins of East-Central China, and NC = North China. (a) Extreme precipitation amount; (b) extreme precipitation rate; (c) extreme precipitation frequency rate. The red line is the result of smoothing with a nine-point binomial filter with reflected ends. Asterisks indicate significant trends: * p < 0.10, ** p < 0.05, *** p < 0.01.
Earth 06 00024 g007
Figure 8. (a) Monsoon rainband precipitation in SC as a percentage of total monsoon rainband precipitation; (b) monsoon rainband precipitation in YH as a percentage of total monsoon rainband precipitation; (c)monsoon rainband precipitation in NC as a percentage of total monsoon rainband precipitation.SC = South China, YH = the lower Yangtze and Huaihe river basins of East-Central China, and NC = North China.The red lines are a nine-point binomial filter with reflected ends; the dashed trend indicates a subperiod with a significant trend (p < 0.10). Asterisks indicate significant trends: ** p < 0.05, *** p < 0.01.
Earth 06 00024 g008
Figure 9. (a) Eastern China air temperature characteristics during monsoon steady phase and (b) correlation coefficient between air temperature and total precipitation and correlation coefficient between air temperature and extreme precipitation. Asterisks indicate significant trends: ** p < 0.05, *** p < 0.01.
Earth 06 00024 g009
Disclaimer/Publisher’s Note: The statements, opinions and data contained in all publications are solely those of the individual author(s) and contributor(s) and not of MDPI and/or the editor(s). MDPI and/or the editor(s) disclaim responsibility for any injury to people or property resulting from any ideas, methods, instructions or products referred to in the content.

