
Human Comfort and Environmental Sustainability Through Wetland Management: A Case Study of the Nawabganj Wetland, India

 , , ,
, , ,  ,
,  ,
,  ,
,  ,
,  , and
, and 
Abstract
1. Introduction
2. Materials and Methods
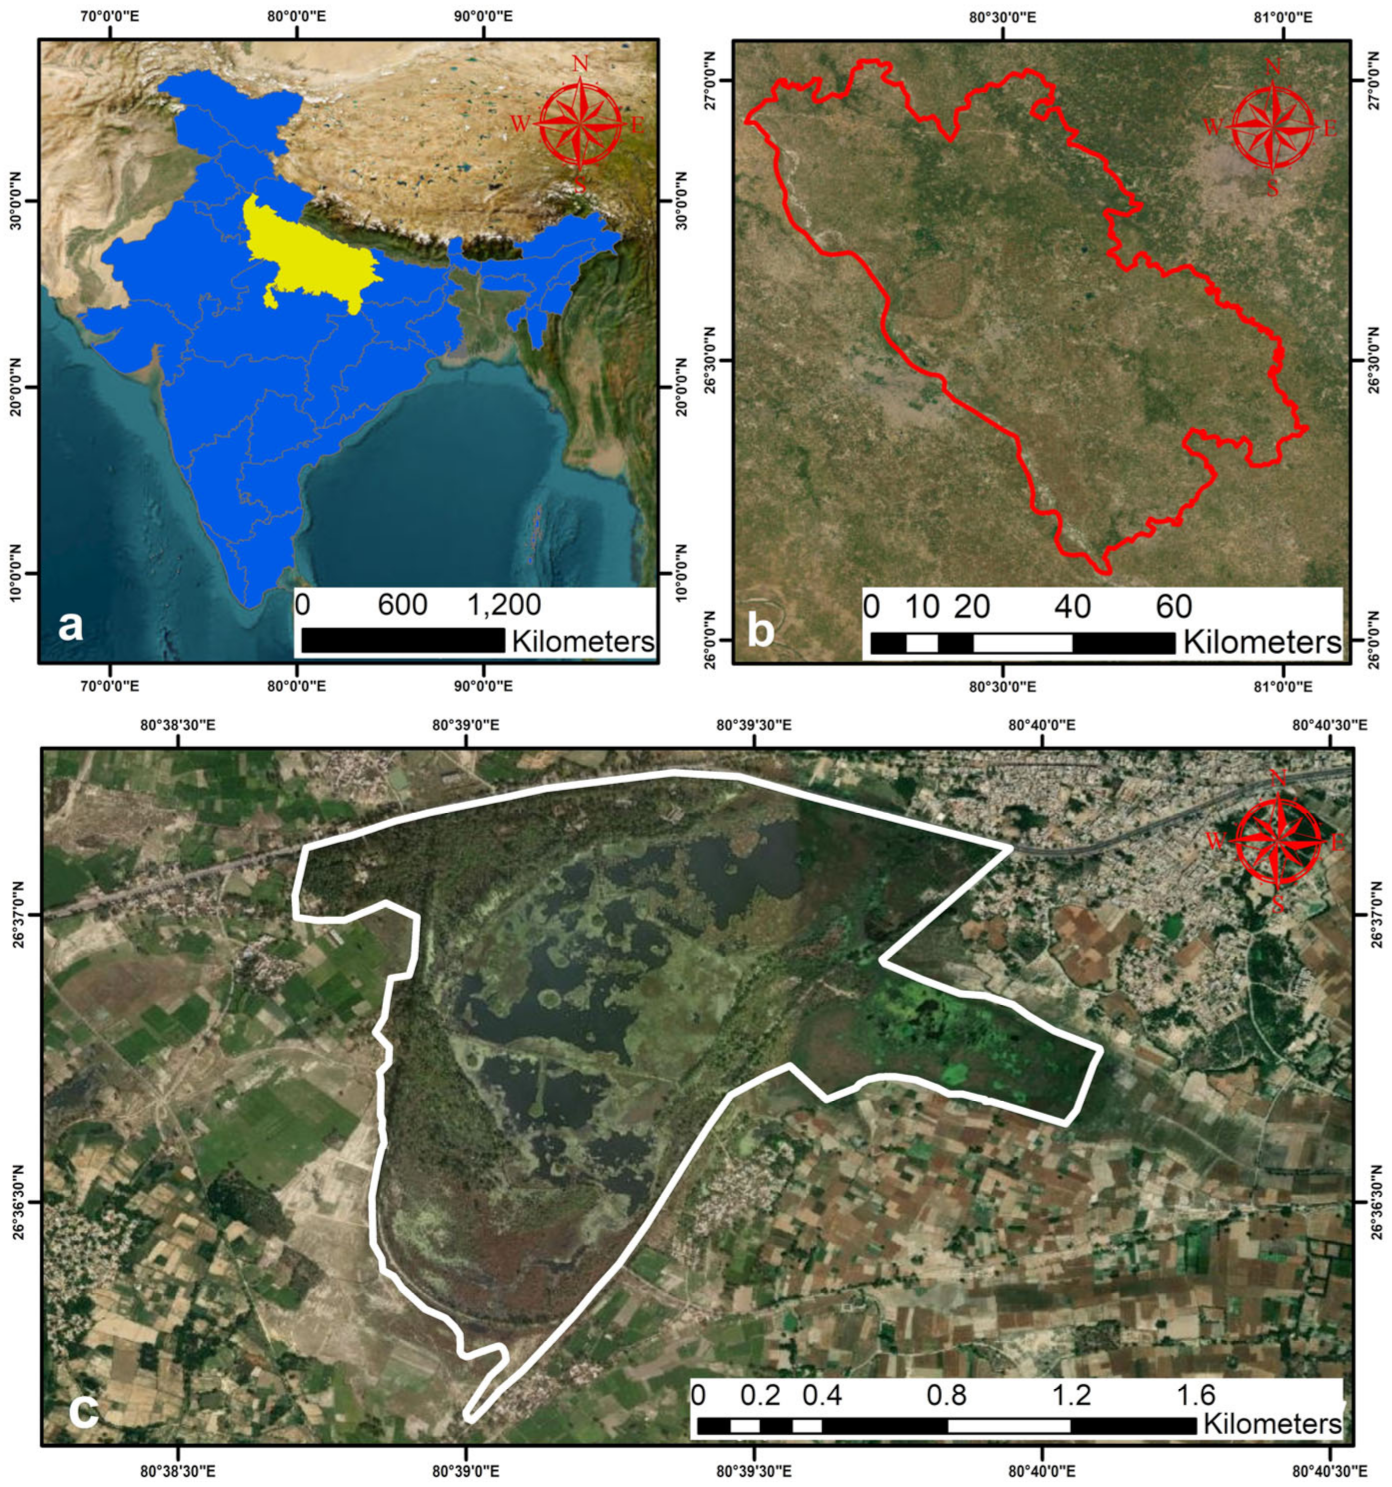
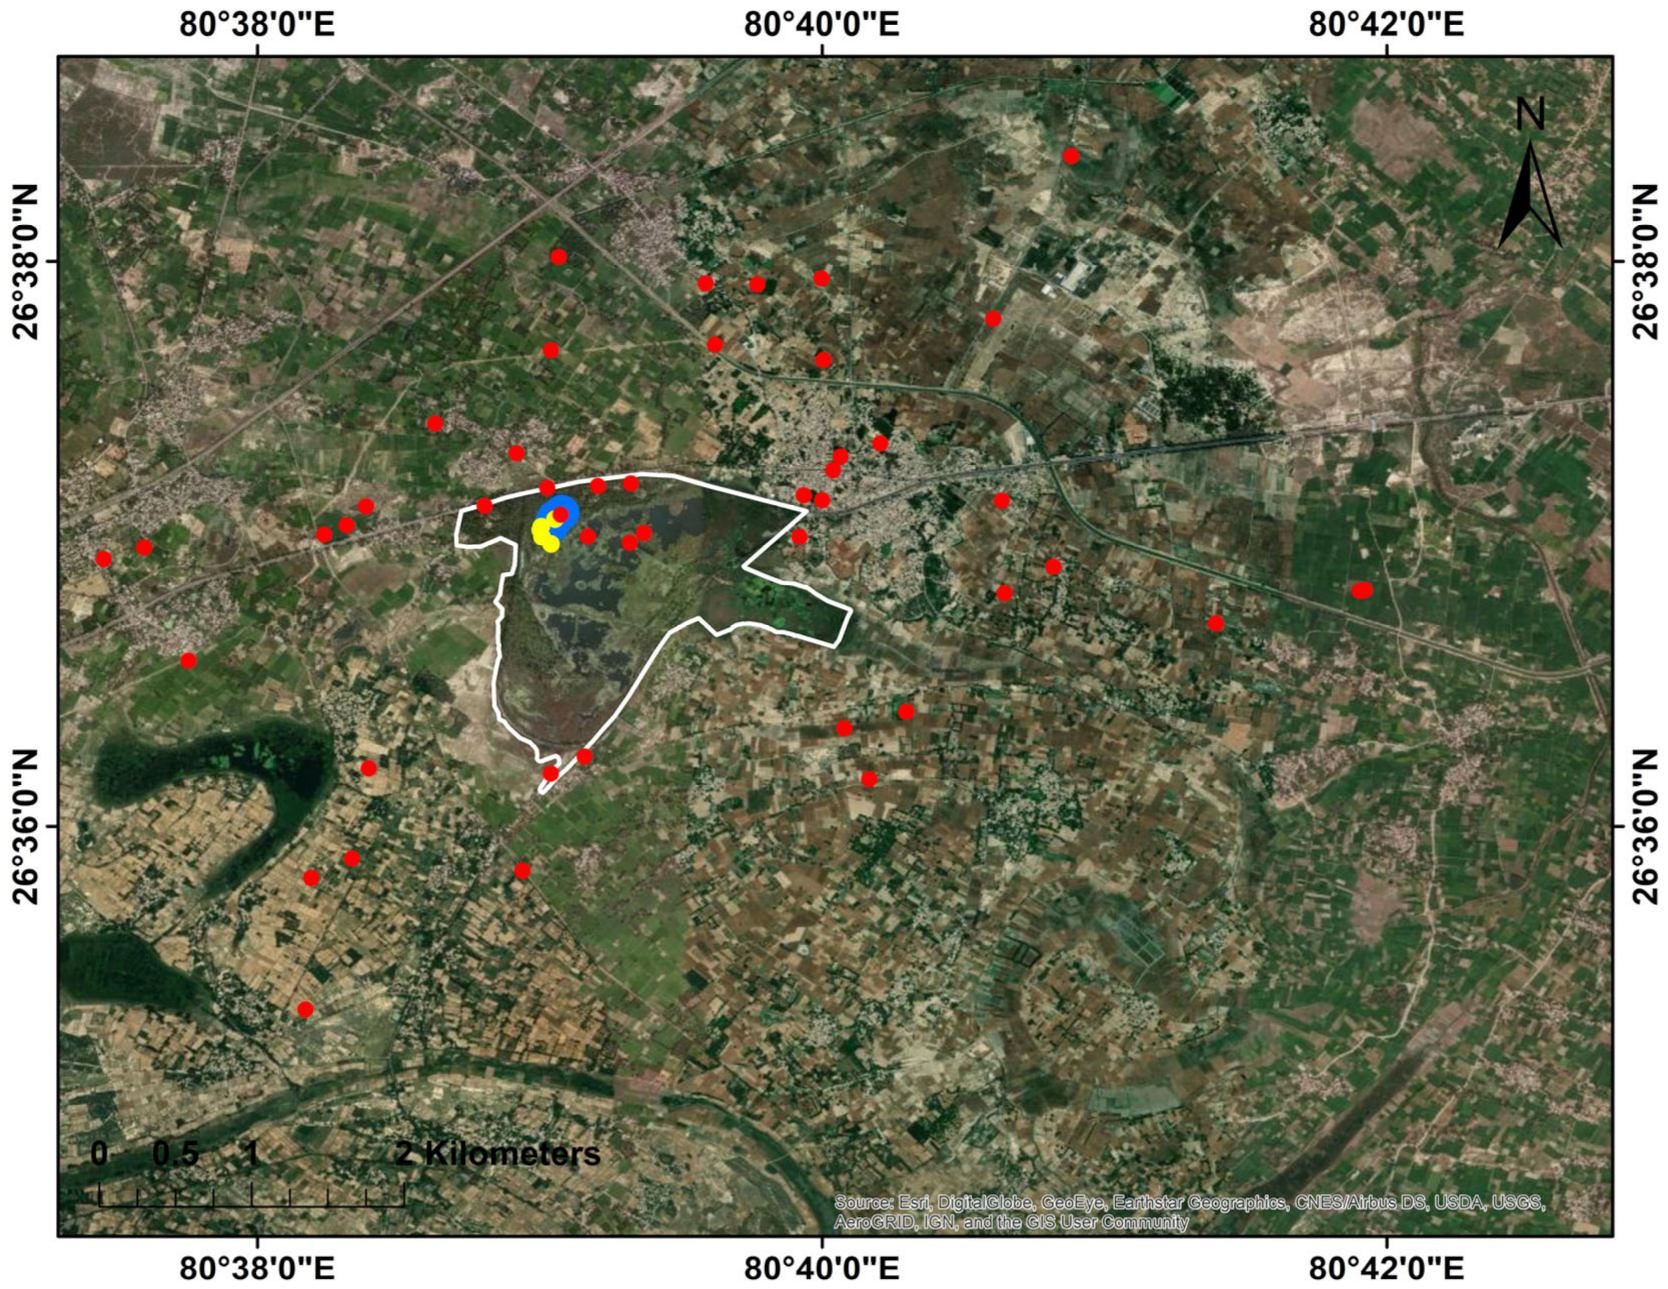
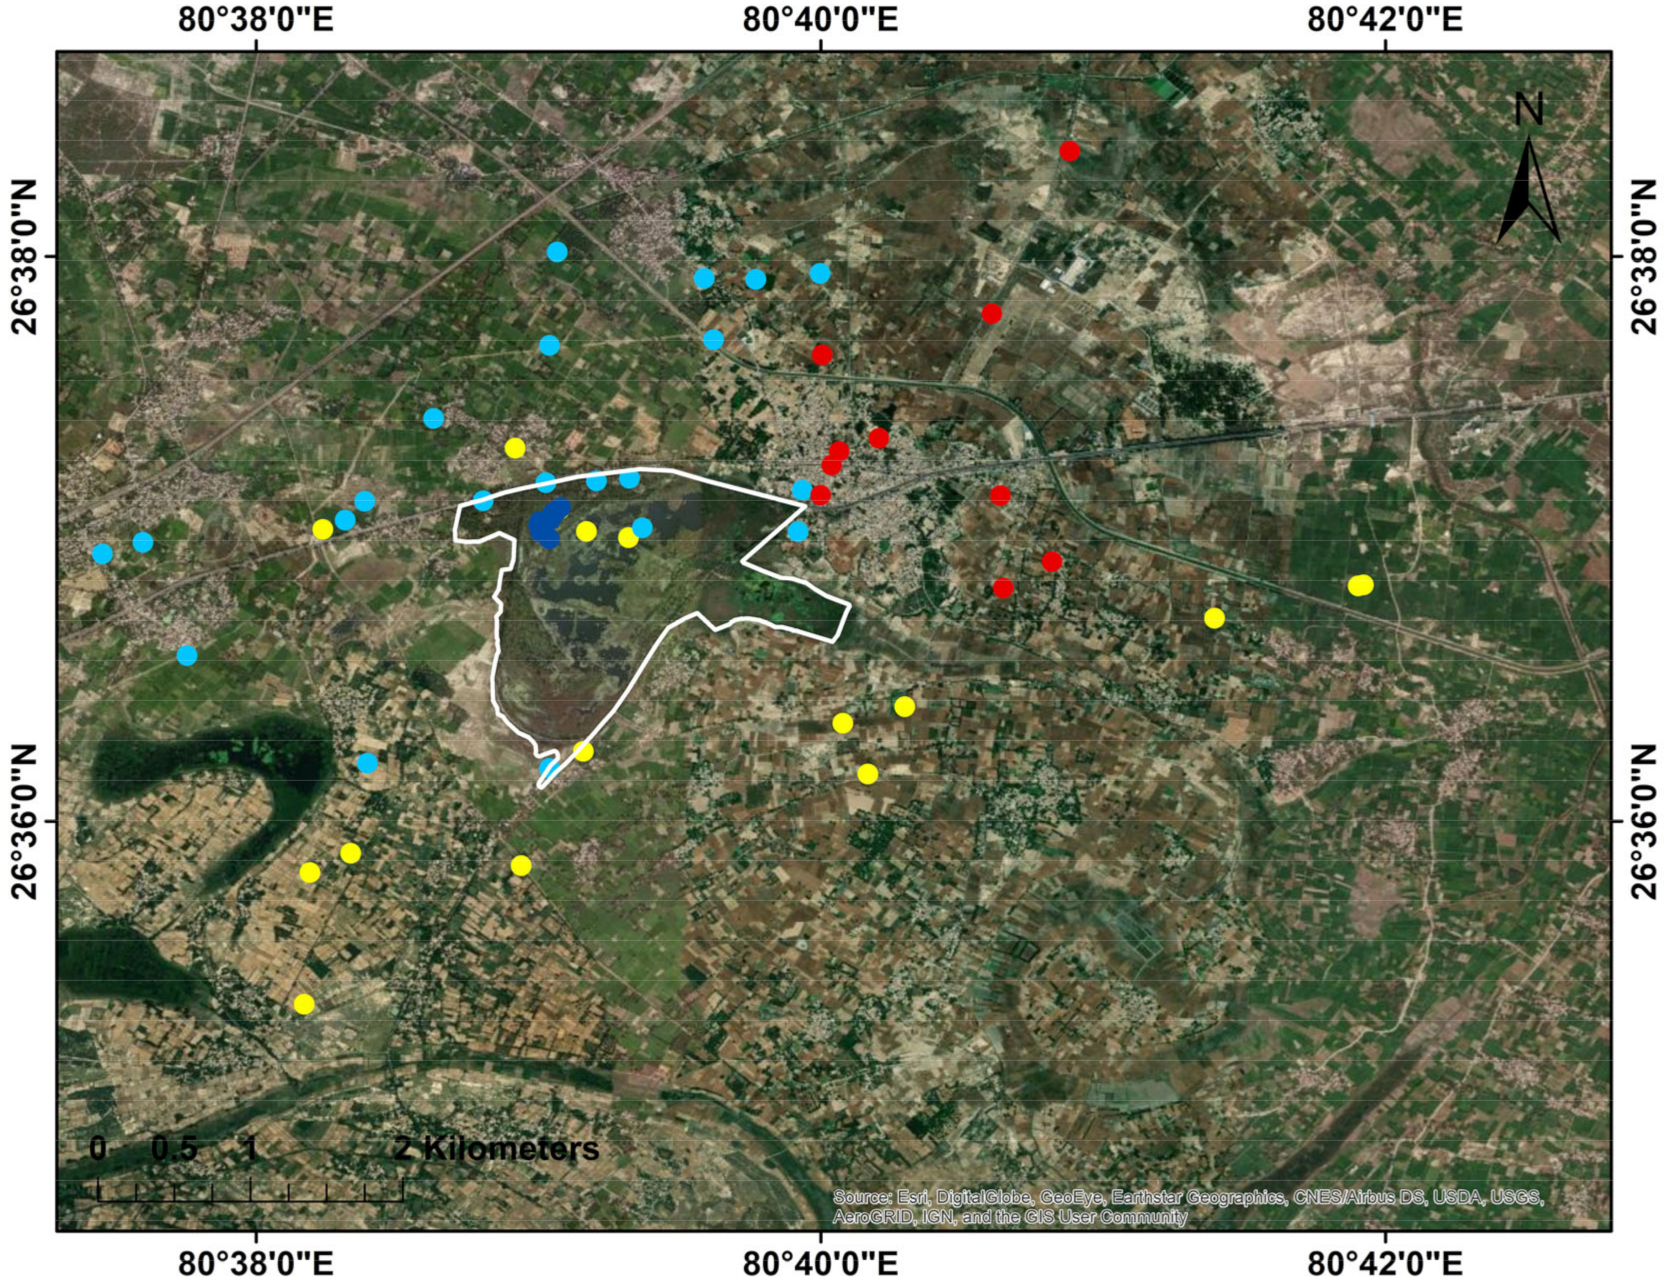
2.1. Study Area
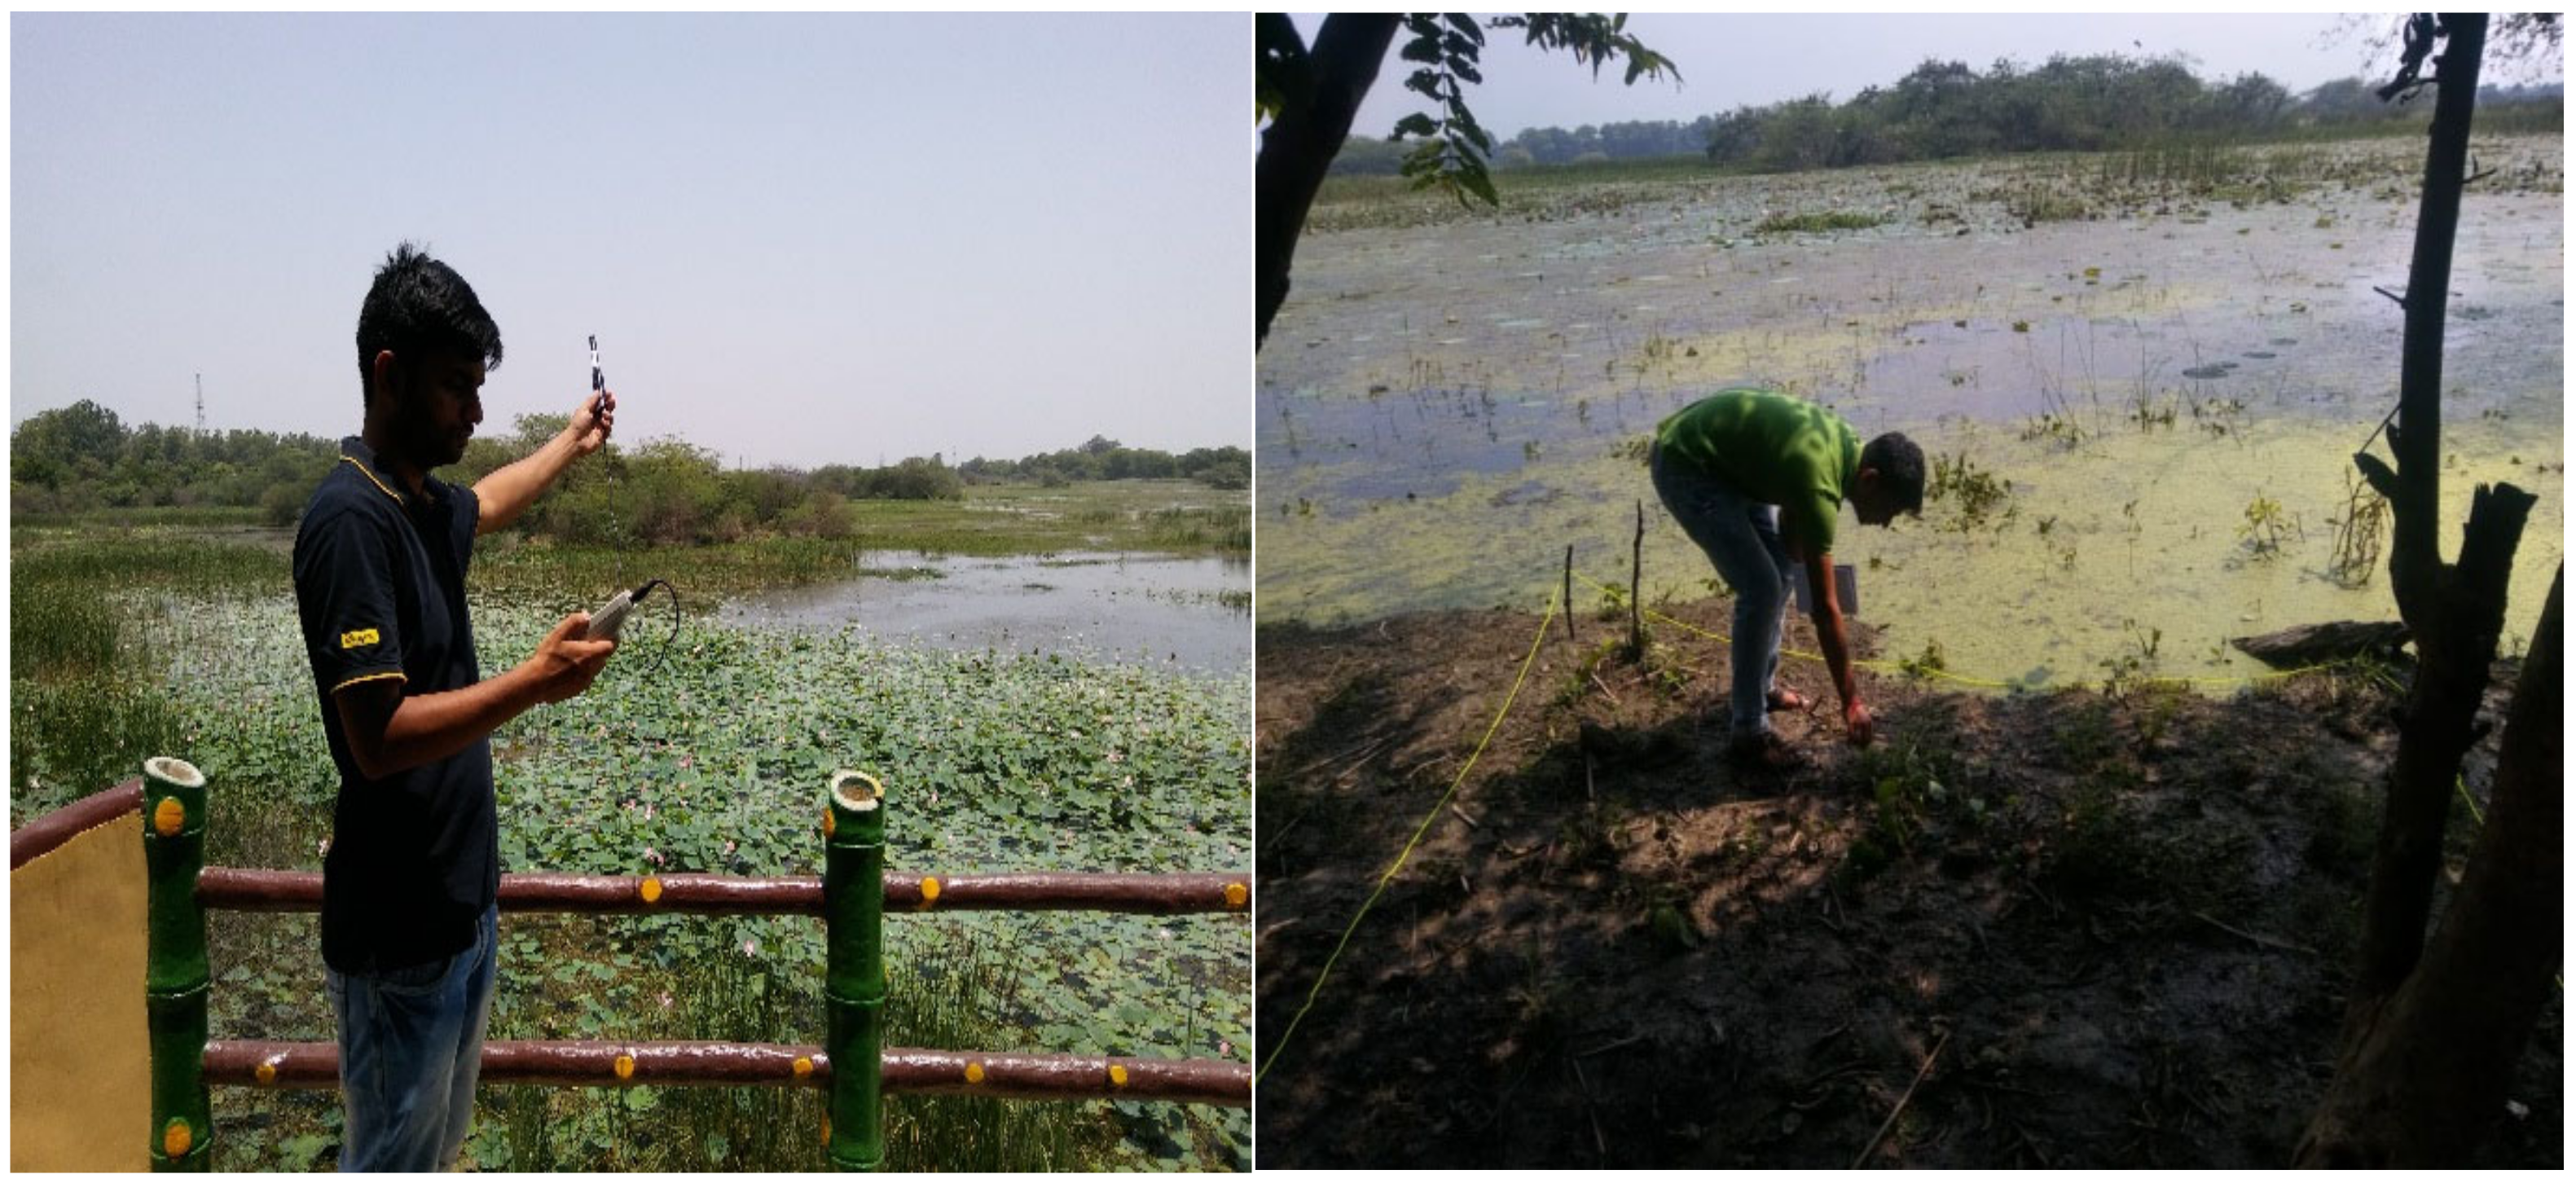
2.2. Field Investigation
2.3. Vegetation Sampling
2.4. Comfort Index
3. Results
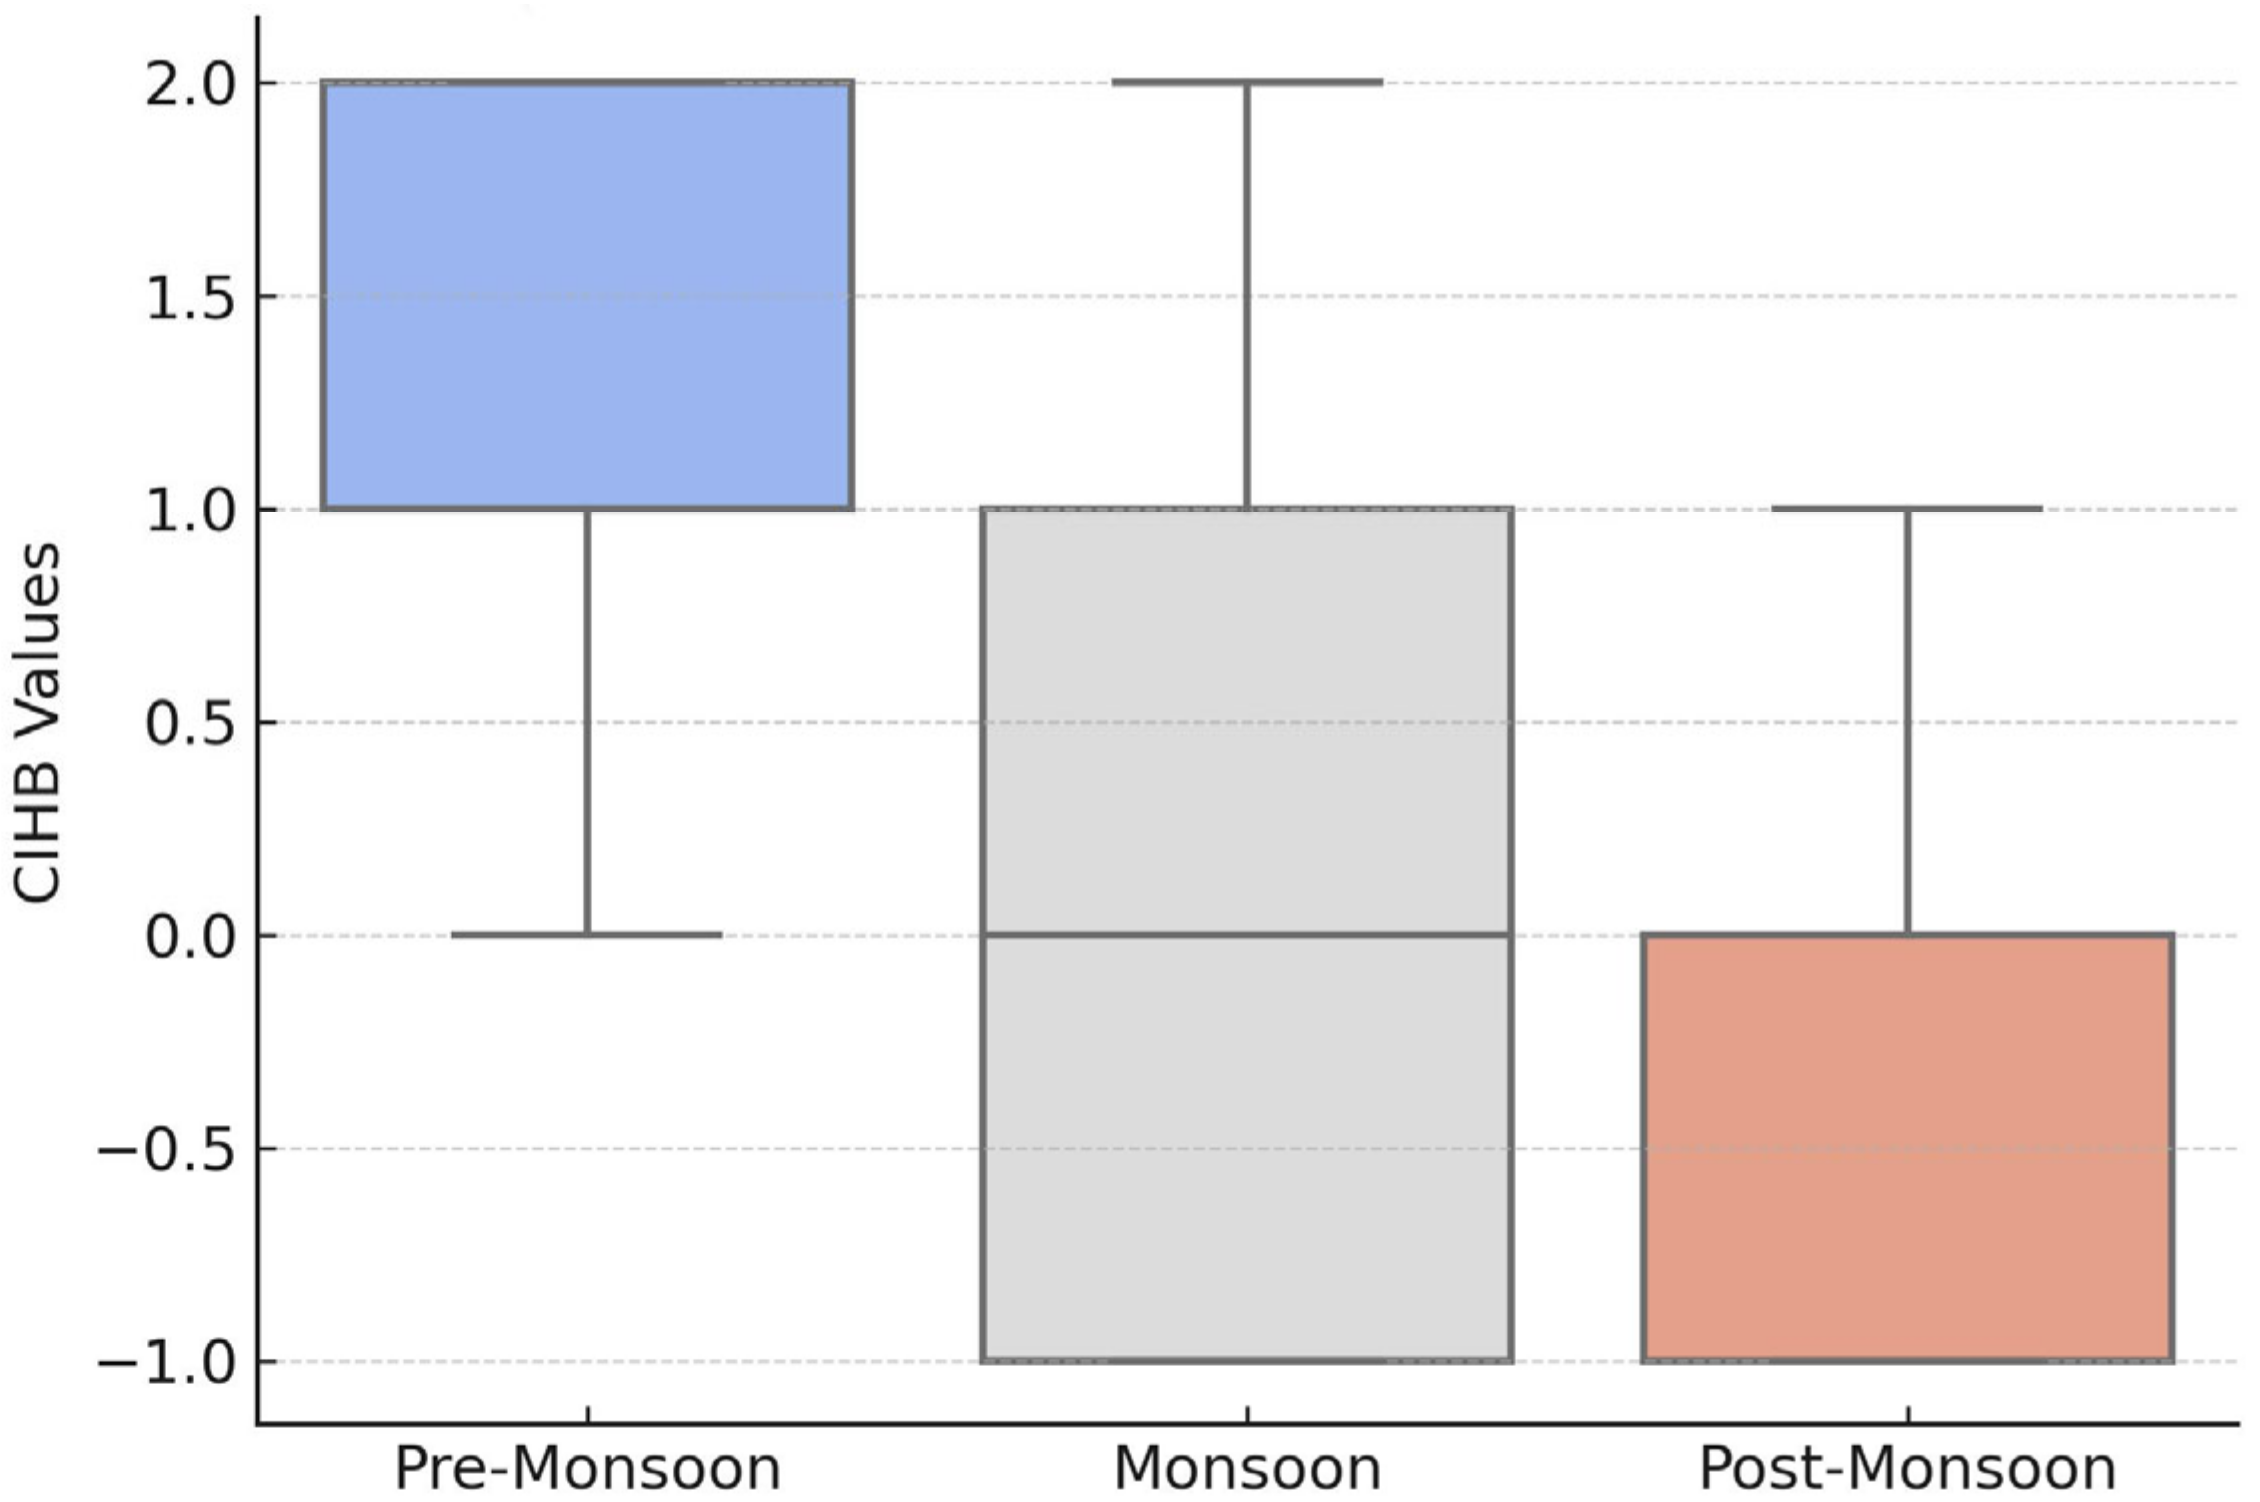
3.1. Seasonal and Spatial Variation in Human Comfort Index (CIHB)
3.2. Vegetation Study
3.2.1. Tree Species
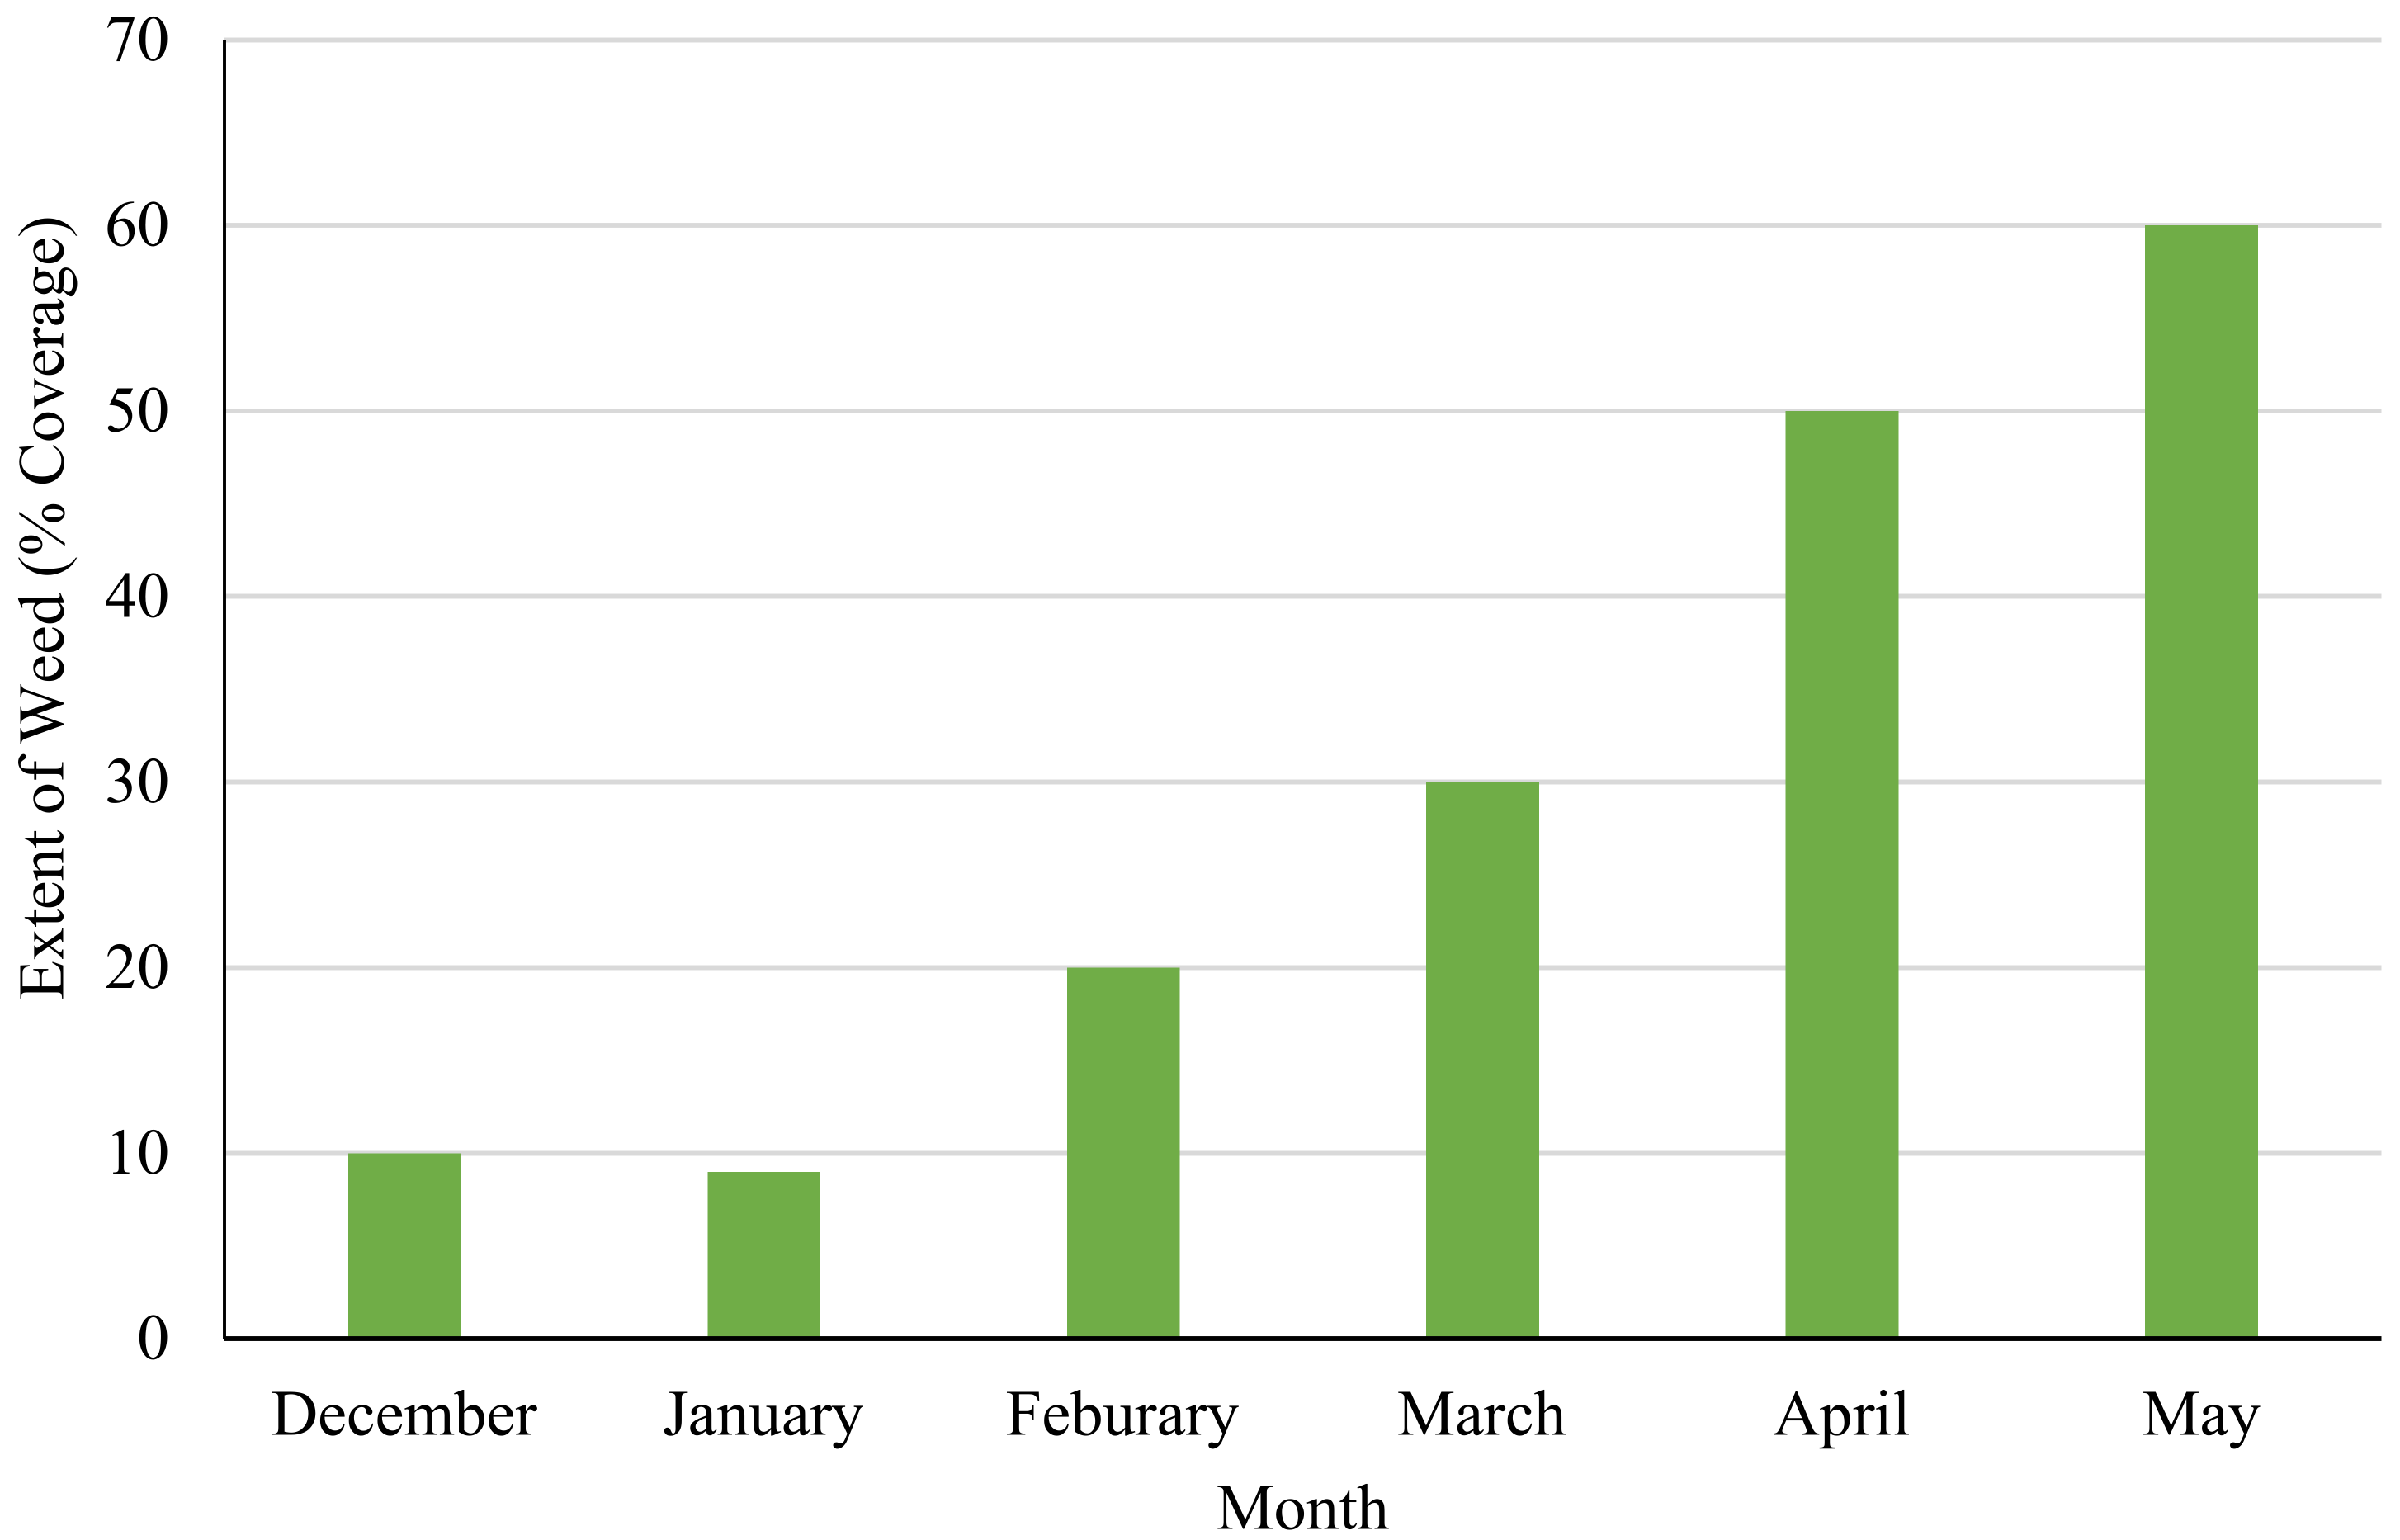
3.2.2. Invasive Plants and Weed Infestation
3.2.3. Influence of Environmental Variables on CIHB
3.2.4. Quantifying CIHB Determinants
4. Discussion
5. Conclusions
Author Contributions
Funding
Data Availability Statement
Acknowledgments
Conflicts of Interest
References
- Krasnostein, A.L.; Oldham, C.E. Predicting wetland water storage. Water Resour. Res. 2004, 40, 34. [Google Scholar] [CrossRef]
- Carlisle, T.J.; Mulamoottil, G. Artificial wetlands for the treatment of stormwater. Can. Water Resour. J. 1991, 16, 331–343. [Google Scholar] [CrossRef]
- Krompart, J.; Cockburn, J.M.; Villard, P.V. Pocket wetlands as additions to stormwater treatment train systems: A case study from a restored stream in Brampton, ON, Canada. Can. Water Resour. J. 2018, 43, 321–334. [Google Scholar] [CrossRef]
- Leon, A.S.; Tang, Y.; Chen, D.; Yolcu, A.; Glennie, C.; Pennings, S.C. Dynamic Management of Water Storage for Flood Control in a Wetland System: A Case Study in Texas. Water 2018, 10, 325. [Google Scholar] [CrossRef]
- Acreman, M.; Holden, J. How Wetlands Affect Floods. Wetlands 2013, 33, 773–786. [Google Scholar] [CrossRef]
- Chescheir, G.M.; Skaggs, R.W.; Gilliam, J.W.; Broadhead, R.G. Hydrology of two forested wetlands that receive pumped agricultural drainage water in Eastern North Carolina. Wetlands 1991, 11, 29–54. [Google Scholar] [CrossRef]
- Chung, E.G.; Bombardelli, F.A.; Schladow, S.G. Modeling linkages between sediment resuspension and water quality in a shallow, eutrophic, wind-exposed lake. Ecol. Model. 2009, 220, 1251–1265. [Google Scholar] [CrossRef]
- Anderson, D.M.; Glibert, P.M.; Burkholder, J.M. Harmful algal blooms and eutrophication: Nutrient sources, composition, and consequences. Estuaries 2002, 25, 704–726. [Google Scholar] [CrossRef]
- Zhang, W.; Zhu, Y.; Jiang, J. Effect of the Urbanization of Wetlands on Microclimate: A Case Study of Xixi Wetland, Hangzhou, China. Sustainability 2016, 8, 885. [Google Scholar] [CrossRef]
- Carrington, D.P.; Gallimore, R.G.; Kutzbach, J.E. Climate sensitivity to wetlands and wetland vegetation in mid-Holocene North Africa. Clim. Dyn. 2001, 17, 151–157. [Google Scholar] [CrossRef]
- Taylor, C.M.; Prigent, C.; Dadson, S.J. Mesoscale rainfall patterns observed around wetlands in sub-Saharan Africa. Q. J. R. Meteorol. Soc. 2018, 144, 2118–2132. [Google Scholar] [CrossRef]
- Bullock, A.; Acreman, M. The Role of Wetlands in the Hydrological Cycle. Hydrol. Earth Syst. Sci. 2003, 7, 358–389. [Google Scholar] [CrossRef]
- Peng, X.F.; Sun, X.; Yuan, S.X.; Sun, R.Y.; Chen, Z.H. Landscape characteristics and microclimatic effects of the urban wetlands in Guangzhou city. Ecol. Environ. 2008, 17, 2289–2296. (In Chinese) [Google Scholar]
- Cadenasso, M.; Traynor, M.; Pickett, S.; Schulte, L.A.; Mottl, E.C.; Palik, B.J.; Bond-Lamberty, B.; Brown, K.M.; Goranson, C.; Gower, S.T.; et al. Functional location of forest edges: Gradients of multiple physical factors. Can. J. For. Res. 1997, 27, 774–782. [Google Scholar] [CrossRef]
- Hou, P.; Chen, Y.; Qiao, W.; Cao, G.; Jiang, W.; Li, J. Near-surface air temperature retrieval from satellite images and influence by wetlands in urban region. Theor. Appl. Clim. 2013, 111, 109–118. [Google Scholar] [CrossRef]
- Mao, D.; Wang, Z.; Wu, J.; Wu, B.; Zeng, Y.; Song, K.; Yi, K.; Luo, L. China’s wetlands loss to urban expansion. Land Degrad. Dev. 2018, 29, 2644–2657. [Google Scholar] [CrossRef]
- Gao, J.; Liu, Y. Climate warming and land use change in Heilongjiang province, North East China. Appl. Geogr. 2011, 31, 476–482. [Google Scholar] [CrossRef]
- Şimşek, Ç.K.; Ödül, H. Investigation of the effect of wetland on micro-climate. Appl. Geogr. 2018, 97, 48–60. [Google Scholar] [CrossRef]
- Kadlec, R.H.; Knight, R.L. Water temperature and evapotranspiration in surface flow wetlands in hot and arid climates. Ecol. Eng. 2006, 26, 328–340. [Google Scholar] [CrossRef]
- Schuur, E.A.G. Productivity and global climate revisited: The sensitivity of tropical forest growth to precipitation. Ecology 2003, 84, 1165–1170. [Google Scholar] [CrossRef]
- Heisler-White, J.L.; Knapp, A.K.; Kelly, E.F. Increasing precipitation event size increases aboveground net primary productivity in a semi-arid grassland. Oecologia 2008, 158, 129–140. [Google Scholar] [CrossRef] [PubMed]
- Bartzen, B.A.; Dufour, K.W.; Clark, R.G.; Caswell, F.D. Trends in agricultural impact and recovery of wetlands in prairie Canada. Ecol. Appl. 2010, 20, 525–538. [Google Scholar] [CrossRef] [PubMed]
- Hartig, T.; Korpela, K.; Evans, G.W.; Gärling, T. A Measure of restorative quality in environments. Scand. Hous. Plan. Res. 1997, 14, 175–194. [Google Scholar] [CrossRef]
- McMichael, A.J.; Woodruff, R.E.; Hales, S. Climate change and human health: Present and future risks. Lancet 2006, 367, 859–869. [Google Scholar] [CrossRef] [PubMed]
- Li, X.; Mitra, C.; Dong, L.; Yang, Q. Understanding land use change impacts on microclimate using Weather Research and Forecasting (WRF) model. Phys. Chem. Earth Parts A/B/C 2017, 103, 115–126. [Google Scholar] [CrossRef]
- Bera, B.; Shit, P.K.; Saha, S.; Bhattacharjee, S. Exploratory analysis of cooling effect of urban wetlands on Kolkata metropolitan city region, eastern India. Curr. Res. Environ. Sustain. 2021, 3, 100066. [Google Scholar] [CrossRef]
- Wetland Info. Queensland Government. Available online: https://wetlandinfo.des.qld.gov.au/wetlands/management/rehabilitation/rehab-process/step-4/intervention-options/weeds/ (accessed on 31 January 2025).
- Romanowski, N. Wetland Weeds: Causes, Cures and Compromises; CSIRO Publishing: Clayton South, Australia, 2011; Available online: https://www.researchgate.net/publication/331068791_Wetland_Weeds_Causes_Cures_and_Compromises (accessed on 15 November 2024).
- Ramsar Information Sheet. Available online: https://rsis.ramsar.org/RISapp/files/RISrep/IN2412RIS_2002_en.pdf (accessed on 1 August 2024).
- Birdlife International. Available online: https://datazone.birdlife.org/site/factsheet/nawabganj-bird-sanctuary-iba-india#:~:text=The%20jheel%20is%20fed%20by,dries%20out%20by%20early%20summer (accessed on 15 November 2023).
- Census of India. 2011. Available online: https://www.census2011.co.in/data/subdistrict/788-nawabganj-bareilly-uttar-pradesh.html (accessed on 31 July 2021).
- Yu, G.K.; Xu, M.; Gao, P.; Huang, L.; Luo, Y.; Ling, Y. Study on physical background of comfort index of human body anomaly in winter and summer in Jiangsu province. Meteorol. Mon. 2012, 38, 593–600. (In Chinese) [Google Scholar]
- Giorio, M.; Paparella, R. Climate Mitigation Strategies: The Use of Cool Pavements. Sustainability 2023, 15, 7641. [Google Scholar] [CrossRef]
- Vázquez-González, C.; Moreno-Casasola, P.; Peláez, L.A.P.; Monroy, R.; Espejel, I. The value of coastal wetland flood prevention lost to urbanization on the coastal plain of the Gulf of Mexico: An analy-sis of flood damage by hurricane impacts. Int. J. Disaster Risk Reduct. 2019, 37, 101180. [Google Scholar] [CrossRef]
- Wali, E. Urbanization and Loss of Wetland in Port-Harcourt Metropolis, Nigeria. Master’s Thesis, University of Nigeria, Nsukka, Nigeria, 2015. [Google Scholar]
- Devi, T.; Sharma, P. Impacts of urbanization on the wetlands of bashistha and bahinibharalu river basins in guwahati, assam. In Harnessing Wetlands for Sustainable Livelihood; Notion Press: Chennai, India, 2019. [Google Scholar]
- Zheng, H.; Chen, Y.; Pan, W.; Cai, Y.; Chen, Z. Impact of land use/land cover changes on the thermal environment in urbanization: A case study of the natural wetlands distribution area in Minjiang River Estuary, China. Pol. J. Environ. Stud. 2019, 28, 3025–3041. [Google Scholar] [CrossRef]
- Liu, C.; Lu, S.; Tian, J.; Yin, L.; Wang, L.; Zheng, W. Research Overview on Urban Heat Islands Driven by Computational Intelligence. Land 2024, 13, 2176. [Google Scholar] [CrossRef]
- N’tambwe Nghonda, D.-d.; Khoji Muteya, H.; Kalenga Mupanda, G.; Duse Dukuku, F.; Kasanda Mukendi, N.; Esoma Okothomas, B.; Mpanda Mukenza, M.; Cabala Kaleba, S.; Malaisse, F.; Masengo Kalenga, W.; et al. Reforestation Initiatives in the Lubumbashi Charcoal Production Basin (DR Congo): Plant Diversity Selection, Management Practices, and Ecosystems Structure. Ecologies 2025, 6, 17. [Google Scholar] [CrossRef]
- Immanuel, R.R.; Elizabeth, L.L. Weeds in agroecosystems: A source of medicines for human healthcare. Int. J. Pharm. Technol. Res. 2009, 1, 375–385. [Google Scholar]
- Sarma, H.; Sarma, A.M.; Sarma, C.M. Traditional knowledge of weeds: A study of herbal medicines and vegetables used by the Assamese people [India]. HerbaPolonica 2008, 54, 80–88. [Google Scholar]
- Hassan, S. Positive aspects of weeds as herbal remedies and medicinal plants. J. Res. Weed Sci. 2020, 3, 57–70. [Google Scholar]
- Rizki, R.; Nursyahra, N.; Fernando, O. Study of weeds as traditional medicinal plants used by indigenous people of West Pasaman, Indonesia. J. Trop. Hortic. 2019, 2, 81–85. [Google Scholar] [CrossRef]
- Safdar, N.; Batool, S.; Tufail, S.; Masood, N.; Zehra, R.; Yasmin, A. Bioprospecting medicinal potential of three widespread weeds from Pakistan. Indian J. Weed Sci. 2016, 48, 53–59. [Google Scholar] [CrossRef]
- Swinton, S.M.; Van Deynze, B. Hoes to herbicides: Economics of evolving weed management in the United States. Eur. J. Dev. Res. 2017, 29, 560–574. [Google Scholar] [CrossRef]
- Tibugari, H.; Chiduza, C.; Mashingaidze, A.B. A survey of problem weeds of sorghum and their management in two sorghum-producing districts of Zimbabwe. Cogent Soc. Sci. 2020, 6, 1738840. [Google Scholar] [CrossRef]
- García-López, X.A.; Ortiz-Zayas, J.R.; Díaz, R.; Castro-Jiménez, A.; Wahl, C.F. Limnological Response of Las Curias Reservoir, San Juan, Puerto Rico: Successful Management of the Invasive Aquatic Fern, Salvinia molesta. Water 2023, 15, 3966. [Google Scholar] [CrossRef]
- Garg, A. Nest-Plant Correlation and Predator Preclusion in Asian Openbill Storks (Anastomu-sOscitans): A Case Study from Nawabgunj Bird Sanctuary, India. Indian For. 2016, 142, 179–186. [Google Scholar]
- Elliott, H.; Eon, C.; Breadsell, J.K. Improving City Vitality through Urban Heat Reduction with Green Infrastructure and Design Solutions: A Systematic Literature Review. Buildings 2020, 10, 219. [Google Scholar] [CrossRef]
- Xie, C.; Feng, T.; Hu, L. A Bibliometric Analysis of the Outdoor Thermal Environment Based on CiteSpace. Buildings 2024, 14, 1384. [Google Scholar] [CrossRef]
- Liu, Y.-S.; Yigitcanlar, T.; Guaralda, M.; Degirmenci, K.; Liu, A. Spatial Modelling of Urban Wind Characteristics: Review of Contributions to Sustainable Urban Development. Buildings 2024, 14, 737. [Google Scholar] [CrossRef]
- Maranho, L.T.; Gomes, M.P. Morphophysiological Adaptations of Aquatic Macrophytes in Wetland-Based Sewage Treatment Systems: Strategies for Resilience and Efficiency under Environmental Stress. Plants 2024, 13, 2870. [Google Scholar] [CrossRef]
- Meraj, G.; Kanga, S.; Kranjčić, N.; Đurin, B.; Singh, S.K. Role of Natural Capital Economics for Sustainable Management of Earth Resources. Earth 2021, 2, 622–634. [Google Scholar] [CrossRef]
- Ahmad, T.; Gupta, S.K.; Singh, S.K.; Meraj, G.; Kumar, P.; Kanga, S. Unveiling Nature’s Resilience: Exploring Vegetation Dynamics during the COVID-19 Era in Jharkhand, India, with the Google Earth Engine. Climate 2023, 11, 187. [Google Scholar] [CrossRef]


| CIHB | Grade | Body Feeling |
|---|---|---|
| <25 | −3 | chilly |
| 25–40 | −2 | cold |
| 40–60 | −1 | cool |
| 60–70 | 0 | comfortable |
| 70–80 | 1 | warm |
| 80–85 | 2 | hot |
| >85 | 3 | heat |
| Sites | Description | Coordinates | Grades: Comfort Index | Time of the Measurement | Length of the Measurement in Meter | ||
|---|---|---|---|---|---|---|---|
| Pre Monsoon | Monsoon | Post Monsoon | |||||
| 1 | Forest–Wetland edge | 26°37′06.67″ N 80°39′04.70″ E | 0 | −1 | −1 | 8:00–8:30 AM | 1.7 |
| 2 | Forest–Wetland edge | 26°37′06.50″ N 80°39′04.51″ E | 0 | −1 | −1 | 8:45–9:15 AM | 1.5 |
| 3 | Forest–Wetland edge | 26°37′06.11″ N 80°39′04.12″ E | 0 | −1 | −1 | 9:30–10:00 AM | 1.2 |
| 4 | Forest–Wetland edge | 26°37′05.65″ N 80°39′03.65″ E | 0 | −1 | −1 | 10:15–10:45 AM | 1.9 |
| 5 | Forest–Wetland edge | 26°37′05.47″ N 80°39′03.11″ E | 0 | −1 | −1 | 11:00–11:30 AM | 1.6 |
| 6 | Forest–Wetland edge | 26°37′04.09″ N 80°39′02.61″ E | 0 | −1 | −1 | 12:00–12:30 PM | 1.3 |
| 7 | Inside forest | 26°37′05.28″ N 80°39′03.17″ E | 1 | −1 | −1 | 12:45–1:15 PM | 1.8 |
| 8 | Inside forest | 26°37′03.68″ N 80°39′00.27″ E | 1 | −1 | −1 | 1:30–2:00 PM | 1.4 |
| 9 | Inside forest | 26°37′02.97″ N 80°39′0.05″ E | 1 | −1 | −1 | 2:15–2:45 PM | 1.5 |
| 10 | Inside forest | 26°37′00.00″ N 80°38′02.35″ E | 1 | −1 | −1 | 3:00–3:30 PM | 1.8 |
| 11 | Inside forest | 26°37′00.00″ N 80°38′02.35″ E | 1 | −1 | −1 | 4:00–4:30 PM | 1.7 |
| 12 | National highway | 26°37′11.93″ N 80°39′01.62″ E | 2 | 0 | −1 | 4:45–5:15 PM | 1.6 |
| 13 | National highway | 26°37′10.34″ N 80°38′56.10″ E | 2 | 0 | −1 | 5:30–6:00 PM | 1.9 |
| 14 | National highway | 26°37′08.13″ N 80°38′48.28″ E | 2 | 0 | −1 | 6:15–6:45 PM | 1.4 |
| 15 | National highway | 26°37′08.00″ N 80°38′23.12″ E | 2 | 0 | −1 | 7:00–7:30 PM | 1.3 |
| 16 | Inside forest | 26°37′04.00″ N 80°39′18.92″ E | 2 | 0 | −1 | 8:00–8:30 AM | 1.9 |
| 17 | Inside forest | 26°37′01.55″ N 80°39′55.21″ E | 2 | 0 | −1 | 8:45–9:15 AM | 1.7 |
| 18 | Inside forest | 26°37′02.36″ N 80°39′22.08″ E | 2 | 0 | −1 | 9:30–10:00 AM | 1.5 |
| 19 | National highway | 26°37′55.12″ N 80°39′46.21″ E | 2 | 0 | −1 | 10:15–10:45 AM | 1.3 |
| 11:00–11:30 AM | 1.6 | ||||||
| 20 | National highway | 26°37′41.11″ N 80°39′02.36″ E | 2 | 0 | −1 | 12:00–12:30 PM | 1.4 |
| 21 | Etbarpur village | 26°36′14.85″ N 80°39′09.57″ E | 2 | 1 | 0 | 12:45–1:15 PM | 1.7 |
| 22 | Etbarpur village | 26°37′06.23″ N 80°39′04.43″ E | 2 | 1 | 0 | 1:30–2:00 PM | 1.5 |
| 23 | Etbarpur village | 26°37′19.31″ N 80°38′55.08″ E | 2 | 1 | 0 | 2:15–2:45 PM | 1.8 |
| 24 | Etbarpur village | 26°35′50.58″ N 80°38′56.31″ E | 2 | 1 | 0 | 3:00–3:30 PM | 1.4 |
| 25 | Etbarpur village | 26°35′49.12″ N 80°38′11.45″ E | 2 | 1 | 0 | 8:00–8:30 AM | 1.6 |
| 8:45–9:15 AM | 1.4 | ||||||
| 26 | Etbarpur village | 26°35′21.12″ N 80°38′10.24″ E | 2 | 1 | 0 | 9:30–10:00 AM | 1.8 |
| 27 | Kewan village | 26°35′53.23″ N 80°38′20.07″ E | 2 | 1 | 0 | 10:15–10:45 AM | 1.5 |
| 28 | Khaijipur village | 26°37′02.00″ N 80°38′14.20″ E | 2 | 1 | 0 | 12:00–12:30 PM | 1.3 |
| 29 | Khaijipur village | 26°37′01.56″ N 80°39′10.23″ E | 2 | 1 | 0 | 12:45–1:15 PM | 1.6 |
| 30 | Khaijipur village | 26°37′00.24″ N 80°39′19.14″ E | 2 | 1 | 0 | 1:30–2:00 PM | 1.7 |
| 31 | Ajjgain village | 26°37′55.39″ N 80°39′35.26″ E | 2 | 0 | 0 | 2:15–2:45 PM | 1.9 |
| 32 | Ajjgain village | 26°36′59.29″ N 80°37′35.98″ E | 2 | 0 | 0 | 3:00–3:30 PM | 1.4 |
| 33 | Ajjgain village | 26°36′56.83″ N 80°37′27.36″ E | 2 | 0 | 0 | 4:00–4:30 PM | 1.6 |
| 34 | Amrethi village | 26°36′35.21″ N 80°37′45.32″ E | 2 | 0 | 0 | 4:45–5:15 PM | 1.5 |
| 35 | Amrethi village | 26°36′12.35″ N 80°38′23.65″ E | 2 | 0 | 0 | 5:30–6:00 PM | 1.3 |
| 36 | Amrethi village | 26°36′11.23″ N 80°39′02.35″ E | 2 | 0 | 0 | 6:15–6:45 PM | 1.8 |
| 37 | Prasandan village | 26°36′43.15″ N 80°41′23.68″ E | 2 | 1 | 0 | 7:00–7:30 PM | 1.7 |
| 38 | Prasandan village | 26°36′50.21″ N 80°41′55.32″ E | 2 | 1 | 0 | 7:45–8:15 PM | 1.6 |
| 39 | Prasandan village | 26°36′50.01″ N 80°41′54.21″ E | 2 | 1 | 0 | 8:30–9:00 PM | 1.4 |
| 40 | Outside the bird sanctuary | 26°37′12.85″ N 80°39′19.37″ E | 2 | 0 | 0 | 9:15–9:45 PM | 1.5 |
| 41 | Bhavanipur village | 26°37′25.62″ N 80°38′37.73″ E | 2 | 0 | 0 | 10:00–10:30 PM | 1.6 |
| 42 | Hindu kheda village | 26°37′42.32″ N 80°39′37.21″ E | 2 | 0 | 0 | 11:00–11:30 PM | 1.9 |
| 43 | Hindu kheda village | 26°37′12.35″ N 80°39′12.35″ E | 2 | 0 | 0 | 11:45–12:15 AM | 1.7 |
| 44 | Nawabganj town | 26°37′18.57″ N 80°40′03.95″ E | 2 | 2 | 1 | 12:30–1:00 AM | 1.5 |
| 1:15–1:45 AM | 1.8 | ||||||
| 45 | Nawabganj town | 26°37′15.69″ N 80°40′02.36″ E | 2 | 2 | 1 | 2:00–2:30 AM | 1.6 |
| 46 | Nawabganj town | 26°37′09.32″ N 80°40′00.00″ E | 2 | 2 | 1 | 2:45–3:15 AM | 1.4 |
| 47 | Nawabganj town | 26°37′09.21″ N 80°39′98.21″ E | 2 | 2 | 1 | 3:30–4:00 AM | 1.5 |
| 48 | Kushumbhi village | 26°38′00.93″ N 80°39′04.00″ E | 2 | 0 | 0 | 4:15–4:45 AM | 1.8 |
| 49 | Kushumbhi village | 26°37′56.41″ N 80°39′59.90″ E | 2 | 0 | 0 | 5:00–5:30 AM | 1.4 |
| 50 | Madookhera | 26°36′20.83″ N 80°40′04.68″ E | 2 | 1 | 0 | 5:45–6:15 AM | 1.7 |
| 51 | Madookhera | 26°36′24.36″ N 80°40′17.86″ E | 2 | 1 | 0 | 6:30–7:00 AM | 1.6 |
| 52 | Madookhera | 26°36′10.03″ N 80°40′10.4″ E | 2 | 1 | 0 | 7:15–7:45 AM | 1.5 |
| 53 | Makhdoompur | 26°37′49.46″ N 80°40′38.82″ E | 2 | 2 | 1 | 8:00–8:30 AM | 1.3 |
| 54 | Makhdoompur | 26°37′55.19″ N 80°40′49.16″ E | 2 | 2 | 1 | 8:45–9:15 AM | 1.7 |
| 55 | Makhdoompur | 26°38′22.39″ N 80°40′52.97″ E | 2 | 2 | 1 | 9:30–10:00 AM | 1.8 |
| 56 | Makhdoompur | 26°37′47.88″ N 80°40′36.78″ E | 2 | 2 | 1 | 10:15–10:45 AM | 1.7 |
| 57 | Makhdoompur | 26°37′21.36″ N 80°40′12.36″ E | 2 | 2 | 1 | 11:00–11:30 AM | 1.5 |
| 58 | Makhdoompur | 26°37′39.10″ N 80°40′00.32″ E | 2 | 2 | 1 | 12:00–12:30 PM | 1.2 |
| Season | Mean CIHB | Standard Deviation | Min CIHB | Max CIHB |
|---|---|---|---|---|
| Pre Monsoon | 1.66 | 0.68 | 0 | 2 |
| Monsoon | 0.34 | 0.98 | −1 | 2 |
| Post Monsoon | −0.25 | 0.62 | −1 | 1 |
| Family | Species | Frequency | Density |
|---|---|---|---|
| Mimosaceae | Leucaenaleucocephala | 80 | 200.8 |
| Fabaceae | Dalbergiasissoo | 75 | 90.7 |
| Moraceae | Morus alba | 70 | 68.1 |
| Rhamnaceae | Zizyphusmauritiana | 70 | 50.5 |
| Meliaceae | Azadirachtaindica | 65 | 49.2 |
| Caesalpiniaceae | Bauhinia purpurea | 40 | 38.5 |
| Bombacaceae | Bombaxceiba | 30 | 30 |
| Mimosaceae | Albizialebbeck | 30 | 25.5 |
| Mimosaceae | Pithecellobiumdulce | 25 | 16.5 |
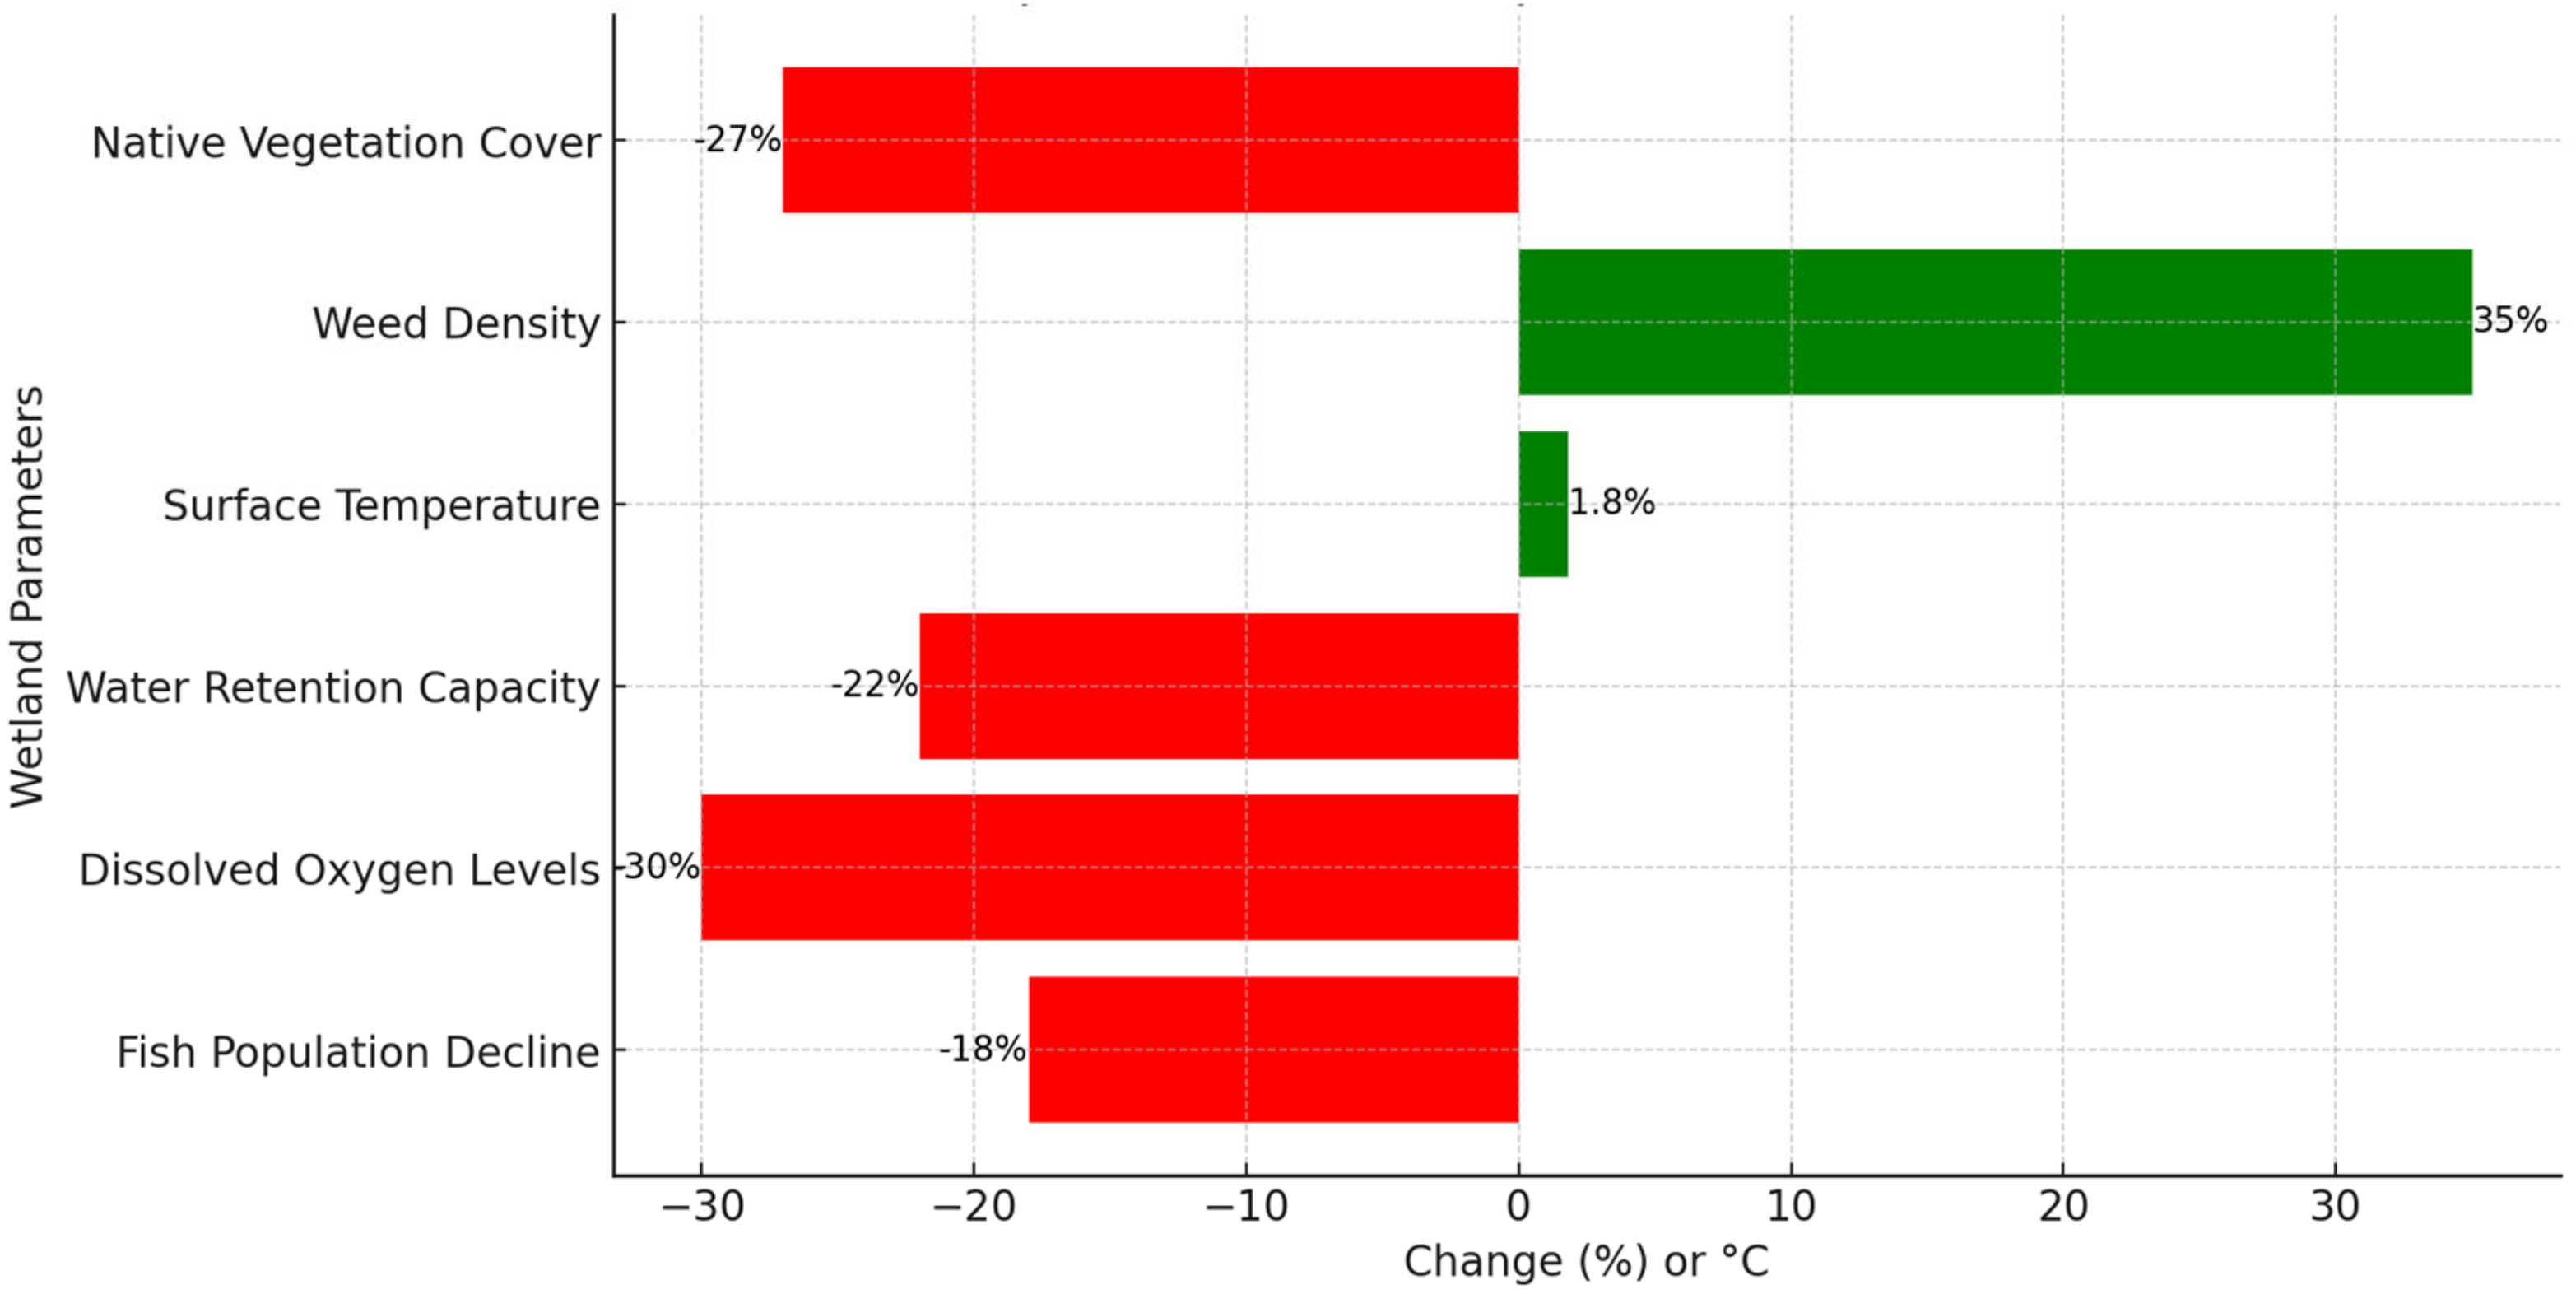
| Parameter | Change (%)/Value | Effect on Wetland Services |
|---|---|---|
| Native vegetation cover | −27% | Loss of biodiversity, reduced habitat quality |
| Weed density | +35% | Increased competition, disrupted nutrient cycle |
| Surface temperature | +1.8 °C | Altered hydrology, increased evaporation |
| Water retention capacity | −22% | Reduced flood and drought mitigation |
| Dissolved oxygen levels | −30% | Decline in aquatic biodiversity, fish loss |
| Fish population decline | −18% | Reduced food resources, habitat degradation |
| Variable | Pre-Monsoon CIHB | Monsoon CIHB | Post-Monsoon CIHB |
|---|---|---|---|
| Temperature | −0.06 | 0.1 | 0.08 |
| Humidity | 0.04 | 0.12 | −0.12 |
| Wind Speed | 0.07 | −0.05 | −0.16 |
| Variable | Pre-Monsoon β (p-Value) | Monsoon β (p-Value) | Post-Monsoon β (p-Value) |
|---|---|---|---|
| Intercept | 1.824 (p = 0.017) | −0.519 (NS) | −0.295 (NS) |
| Temperature | −0.0129 (NS) | +0.0173 (NS) | +0.0180 (NS) |
| Humidity | +0.0023 (NS) | +0.0076 (NS) | −0.0051 (NS) |
| Wind Speed | +0.0529 (NS) | −0.0901 (NS) | −0.1049 (NS) |
Disclaimer/Publisher’s Note: The statements, opinions and data contained in all publications are solely those of the individual author(s) and contributor(s) and not of MDPI and/or the editor(s). MDPI and/or the editor(s) disclaim responsibility for any injury to people or property resulting from any ideas, methods, instructions or products referred to in the content. |
© 2025 by the authors. Licensee MDPI, Basel, Switzerland. This article is an open access article distributed under the terms and conditions of the Creative Commons Attribution (CC BY) license (https://creativecommons.org/licenses/by/4.0/).
Share and Cite
Avishek, K.; Singh, P.D.; Kanungo, A.; Kumar, P.; Chakraborty, S.; Singh, S.K.; Kanga, S.; Meraj, G.; Sajan, B.; Gupta, S.K. Human Comfort and Environmental Sustainability Through Wetland Management: A Case Study of the Nawabganj Wetland, India. Earth 2025, 6, 14. https://doi.org/10.3390/earth6010014
Avishek K, Singh PD, Kanungo A, Kumar P, Chakraborty S, Singh SK, Kanga S, Meraj G, Sajan B, Gupta SK. Human Comfort and Environmental Sustainability Through Wetland Management: A Case Study of the Nawabganj Wetland, India. Earth. 2025; 6(1):14. https://doi.org/10.3390/earth6010014
Chicago/Turabian StyleAvishek, Kirti, Pranav Dev Singh, Abhrankash Kanungo, Pankaj Kumar, Shamik Chakraborty, Suraj Kumar Singh, Shruti Kanga, Gowhar Meraj, Bhartendu Sajan, and Saurabh Kumar Gupta. 2025. "Human Comfort and Environmental Sustainability Through Wetland Management: A Case Study of the Nawabganj Wetland, India" Earth 6, no. 1: 14. https://doi.org/10.3390/earth6010014
APA StyleAvishek, K., Singh, P. D., Kanungo, A., Kumar, P., Chakraborty, S., Singh, S. K., Kanga, S., Meraj, G., Sajan, B., & Gupta, S. K. (2025). Human Comfort and Environmental Sustainability Through Wetland Management: A Case Study of the Nawabganj Wetland, India. Earth, 6(1), 14. https://doi.org/10.3390/earth6010014