Abstract
With the aim of contributing to the knowledge of soil organic carbon stocks in dry areas, this work is based on a quantification of SOC stocks in gypsum-bearing soils whose vertical and spatial heterogeneity greatly limits inferring the total SOC stocks solely from soil surface information. Public databases of soil profiles were key to this quantification, through which it was estimated which amounts of organic carbon can potentially be excluded from calculations associated with soil C cycle models in the absence of information regarding deep soil horizons. These databases include two key factors in the quantification of SOC stocks, which are often excluded: the volume of coarse fragments and the thickness of all sampled soil horizons where SOC concentration was determined. The observed average value of SOC stocks in the studied subsurface horizons reaches 73% of the whole soil. Climate, relief, and land use influence the quantity and heterogeneity of SOC stocks in these soils. Information based on the mere surface of the soil is not relevant to quantify the total SOC; however, the calculation of stocks through soil pits of medium depth (30 cm) has proven to be potentially useful as a complementary approach to these stocks.
1. Introduction
In large regions of the Earth, low rainfall and low temperature conditions are associated with limited rates of organic matter mineralization. Certain soil physicochemical properties may additionally constitute favorable factors for long-term stabilization of soil organic carbon (SOC). This is the case with gypsum-bearing soils. Rowley et al. [] considered different environmental factors that contribute to SOC stabilization that can be applied in such soils: (i) interactions between SOC and cations such as Ca2+; (ii) the physical separation of substrates from decomposers (over macroscopic to microscopic scales); and (iii) the occurrence of limiting soil temperature and moisture conditions for microbial growth. Accordingly, dominant fine textures of gypsum-bearing soils (in both surface and subsurface horizons of the soil profile) contribute to SOC stabilization by means of spatial inaccessibility to microorganisms []. Ca2+, which is particularly abundant in gypsum-bearing soils by means of relatively high gypsum solubility, plays a key role in the stabilization of organic matter as a divalent cation bridge []. As a general case in soils, Gross and Harrison [] suggest subsurface C inputs from roots and microorganisms as the dominant source of both SOC and DOC; likewise, Ma et al. [] experimentally established the influence of rainfall events on the distribution of dissolved organic carbon at different soil depths. In the case of gypsum-bearing soils, it can be suggested that, as a consequence of the role of Ca2+ in stabilizing organic matter [,], the higher relative abundance of gypsum in the subsurface horizons (as a consequence of a movement downwards, following incomplete wetting []) may favor these relatively high deep carbon stocks. Moret-Fernández and Herrero [] indicated the highest water retention capacity in soils with high gypsum content, compared to other dryland soils. Since these attributes are present throughout the soil depth, significant amounts of stabilized organic C can be expected, even in subsurface soil horizons, to a greater extent than other dryland soils; therefore, they deserve particular attention in SOC inventories. Hoffmann et al. [] consider the scarcity of data regarding carbon distribution within the complete soil profile as one of the main knowledge gaps in soil science, particularly in the fragile ecosystems of drylands.
Temperature and moisture constraints for organic matter mineralization dominate in areas where gypseous soils (as defined by Herrero and Porta []) are widely developed, as in Central and Eastern Spain [,,], Turkey and the Middle East [,,,,], and the Central and Southwestern USA [,,]. In these regions, crops and soil biocenosis frequently face the double climatic stress of cold winters and hot, dry summers [,], with the result that plant growth conditions, as well as soil respiration, are favored only during relatively short, milder, and wetter periods.
Climate and vegetation cover are considered the main variables influencing SOC []; however, significant gaps in the role played by each environmental factor must be taken into account [,]. As a reference value, FAO [] establishes that gypsum-bearing soils occur in regions with an annual rainfall of less than 400 mm. Although most of these soils occur in arid and semi-arid climates, the average annual rainfall range is wide: between 100 and 660 mm·yr−1 in the Southwestern USA [], or, tentatively, from 250–600 mm in Eastern Spain. In the Southwestern USA, soils with gypsic horizons are mostly developed in an aridic soil-moisture regime (SMR), and a mesic soil-temperature regime (STR) []. In this regard, Doblas-Miranda et al. [] found positive relationships to annual rainfall values and negative relationships to mean annual temperature in an extensive analysis in Spain. Calvo de Anta et al. [], regarding peninsular Spain, indicate that the lowest C stocks, of 10–30 Mg ha−1 (samples at 0–30 cm and 30–50 cm), are in cropland soils of dry Spanish regions (mean annual rainfall < 400 mm). Aridic SMRs and thermic STRs are clearly dominant in regions of the Middle East where gypsum-bearing soils occur. Broadly speaking, there is a dominance of xeric SMRs in Eastern Spain as well as a certain balance of mesic–thermic STRs.
Land use is a key factor in SOC assessment in drylands; specifically, gypsum-bearing soils are often under rainfed marginal agriculture and affected by overgrazing, generally resulting in high erosion rates. According to FAO [], SOC concentration values in such soils (hereafter expressed as “oxidizable organic carbon determined by acid-dichromate digestion” []) generally ranges from 0.2 to 0.6% in surface horizons to less than 0.1% in subsurface layers. However, local studies show higher values, also in subsurface soil horizons; regarding Eastern Spain, soils from gypsiferous parent materials under xeric and aridic SMRs show mean SOC values slightly over 1% in surface A horizons of rainfed croplands [,]. Under shrublands, SOC values range from 1–3% in surface horizons and 0.2–0.3% in C horizons []. De la Torre and Alías [] provide similar contrasts in SOC values: 0.50% in cropland soils compared to 3.2% in dense shrublands. Similarly, values of 2.3% in A horizons and 0.8% in subsurface horizons were reported in gypseous soils in forested slopes of the Ebro Valley []. Dark, thick, and highly humified A horizons were identified in soils from gypsiferous parent materials in North-Central Spain, particularly when covered by natural vegetation, with SOC values of approximately 2%, even at a 70 cm depth [].
Although gypseous soils can be moderately productive with adequate management practices, they are especially vulnerable to degradation [], which is directly related to SOC decrease []. Erosion processes of gypseous soils can be serious because of poor aggregation, which is at least partially influenced by low organic matter. Furthermore, erosion is favored by hilly slopes and the scarce vegetation cover often associated with gypsiferous outcrops []. This leads to these soils becoming particularly vulnerable to climate change [] and encourages the need for increasing SOC levels []. In addition, relatively high SOC values suggest a particular role of gypsum-bearing soils as a carbon reservoir in severe moisture deficit conditions. This fact has been highlighted regarding arid soils [], but can be specified for gypseous soils in accordance with the physicochemical properties cited above.
In order to assess the soil organic carbon stock in a specific “carbon estimation area”, expressed in C mass per area units, this concept must be complemented with three parameters from the soil mass where SOC has been determined []: bulk density, percentage of coarse fragments (greater than 2 mm), and thickness. This soil mass may refer to previously defined depths or to individual horizons within a soil profile. Direct measurements of these three parameters are carried out in part from the estimates of SOC stocks; nevertheless, bulk density is often approximated by means of pedotransfer functions, some of which were developed for arid soils [,]. However, the coarse fragments fraction is often ignored in SOC stock calculations [,].
Thickness measurement poses two options: establish predefined depths or consider the dimensions of soil horizons. Sampling at predefined depths is useful for some comparative purposes with large amounts of data []. Soil horizons are discrete layers, recognized in the field according to a set of morphological characteristics and complemented by physicochemical analyses []. A soil horizon represents a mass of relative uniformity in a highly heterogeneous medium such as soil, and offers an efficient way to capture the maximum variation in soil properties using a low, although variable, number of sampling points [].
The lack of coarse fragments data is presented as the main constraint for SOC stock assessments worldwide []. Particularly, Poeplau et al. [] evaluate the significant role of the omission or underrating of coarse fragments in systematic overestimations of SOC stocks, as well as the influence of the different methods of determining bulk density in SOC stocks. In contrast, the accuracy of bulk density measurements in soil inventories at national and regional scales has been considered ‘low’ []. The application of pedotransfer functions provides a practical solution for estimating soil carbon storage values when faced with incomplete bulk density data []. However, the application of pedotransfer functions at the local level is recommended in similar types of soil, particularly considering the presence of coarse fragments [].
Observations regarding SOC concentration in gypseous soil profiles from databases [,] suggest that the vertical distribution of C is mostly irregular, relatively high compared to those of other types of dryland soils, and possibly favored by the abundance of Ca2+ and its role in the stabilization of organic carbon. This leads to the main hypothesis of this work, according to which, sampling focused on the topsoil excludes most of the total SOC stock. This may lead to significant underestimations of current stocks of SOC, which may affect models of the future evolution of SOC [,,] or soil carbon sequestration potential [], since the mineralization of the C stocks will be slower than other dryland soils in similar conditions. These constraints determine insufficient knowledge of C stocks in critical regions, such as agricultural drylands, regarding the effects of climate change on these regions [].
This work assumes that three out of four key parameters in the determination of SOC stocks, i.e., bulk density, coarse fragments, and thickness, can only be accurately determined by means of a complete soil profile description with clearly exposed soil horizons. Regarding this, open-access soil profile databases provide information that allows interpreting key environmental conditions in which the soil develops; a part of such information is implicit in the taxon’s name to which the soil profile is assigned []. However, given the technical difficulties inherent to soil surveys based on complete profile descriptions from deep enough sampling pits, the convenience of using supplementary data based on shallower sampling pits should be taken into account; these pits will provide data related to the key parameters of bulk density, horizon thickness, and coarse fragments content.
In this work, the influence of environmental factors such as land use and climate on gypseous soils, in relation to the amount and vertical distribution of C stocks, will also be assessed. When gypsum-bearing soils support natural or semi-natural vegetation, the surface horizons show, as is common, clearly higher SOC values with relation to the subsurface horizons (C, and less frequently, B horizons). In contrast, cultivated soils, by decreasing the contribution of organic matter, show lower SOC values in surface horizons, which increases the relative importance of SOC linked to deep soil horizons. In addition, an irregular decrease in SOC with depth, as a consequence of erosion–deposition processes, is frequent in low slope positions and alluvial plains; that is, surface horizons will not be those with the highest SOC concentrations.
Compared to soil sampling based on pre-established depths, the use of pedological criteria when soil sampling is aimed at calculating SOC stocks is consistent with the available soil mapping information; that is, it considers soil cartographic units as the spatial basis for estimating C stocks per surface unit. Soil profiles recorded in these databases, as well as any other soil profile made and described in the context of a soil survey, are intended to be representative of a soil unit rather than a specific location. This allows soil properties to be spatially represented by means of mapping units. Such spatial units make it possible to define on which surfaces the recommendations proposed in this study might eventually be applied; such recommendations are intended to improve the information provided to the global SOC models regarding gypsum-bearing soils.
This work aims to provide quantitative data regarding the existing C stocks in gypsum-bearing soils, based on the hypothesis that these characteristic dryland soils stand out for the importance of their deep C stocks. Specifically, this work contributes to specifying how much C is underestimated from SOC inventories when these are exclusively based on information from the most superficial horizons or predefined depths.
To specify these stocks, it is essential to include in the quantification the parameters of coarse fragments and horizon thickness, which are determinant of SOC stock values and cannot be extrapolated using information from the soil surface. In contrast, sampling based on predefined depths can lead to certain soil horizons with high C stocks going unnoticed. The aim of this work also includes assessing various criteria as predictors of SOC. On the one hand, parameters associated with the soil-forming factors “climate” and “land use/vegetation cover” may be related to SOC concentration in gypsum-bearing soils. On the other hand, this work aims to assess the predictive capacity of assumed soil samples for standard depths of 30 cm. These relationships are intended to provide objective criteria for situations in which site data and surface sampling can provide complementary information statistically correlated to the total SOC stock.
2. Materials and Methods
Fifty-four soil profiles were selected from databases and references meeting the following criteria: more than 1% gypsum in some horizons within 100 cm from the surface, a complete soil profile description, and enough and homogeneous analytical data. In these profiles, soil organic C stocks were estimated according to the recommendations of the Intergovernmental Panel on Climate Change, based on the concept of Soil Organic Carbon Density (SOCD), whose methodology is synthesized in FAO []. The expression used in this work is the following:
where:
SOCi stock (Mg C ha −1) = OCi x BD finei x (1 − vGi) x Ti x 0.1
SOCi = soil organic carbon stock (in Mg C ha −1) of the depth increment “i”;
OCi = organic carbon content (mg C g soil −1) of the fine soil fraction (<2 mm) in the depth increment “i”;
BDfinei = the mass of fine earth per volume of fine earth of the “i” soil horizon (g fine earth cm −3 fine earth = dry soil mass [g]—coarse mineral fragment mass [g])/(soil sample volume in cm 3—coarse mineral fragment volume in cm 3);
vGi = the volumetric coarse fragment content of the depth increment “i”;
Ti = thickness (depth, in cm) of the depth increment “i”;
0.1 = factor for converting “mg C cm −2“to “Mg C ha −1”.
The set of harmonized soil profile data from the ISRIC-WoSIS Soil Profile Database [], constitutes the main source of information for this work, as it used data from 34 soil profiles located in Eastern Europe, the Middle East, Eastern Africa, and the United States of America. Data from three soil profiles, corresponding to the Southwestern USA, were obtained using the National Cooperative Soil Survey (NCSS) Characterization Database []. Eight soil profiles in the southeast area of the Madrid Region (Central Spain) were studied in this work; field and laboratory data were kindly provided by Dr. Bienes from the IMIDRA (Instituto Madrileño de Investigación y Desarrollo Rural, Agrario y Alimentario) []. Data from seven other soil profiles in Northeastern Spain were from the works of Badía [] and Badía et al. []. Finally, two soil profiles were from information on the Spanish Soil Science Society website [].
The soil profiles listed in Table 1 were selected from those that include homogeneous data in all their horizons, at least for: (i) soil organic carbon using the wet oxidation method, (ii) thickness (cm) of all soil horizons, (iii) percentage of coarse fragments (by weight or directly as volume), and (iv) direct measurement of bulk density from fine-earth fraction, or enough harmonized parameters to apply appropriate pedotransfer functions.

Table 1.
Soil profiles used in this study. Basic location, depth data, and information sources.
The calculation of SOC stocks was applied to a set of soil horizons (277) of a total 54 profiles. Of these, 22 provide determinations of bulk density in all their horizons. The remaining 32 lack such measurements in at least some of their horizons; however, they do have SOC and texture data that allow an approximation of bulk density by means of the pedotransfer function below [], specifically developed for soils in dry climates:
BD = 1.398 − 0.138(SOC%) + 0.008 (Sand%)
For homogeneity within soil profiles, this function was applied to all the horizons, regardless of whether any of them had original bulk density data. An advantage of this function is that it includes “sand %” as the only textural parameter, which facilitates its application in soils with high gypsum content, as the textural analysis for silt and clay fractions in these soils poses technical difficulties due to the abundance of Ca2+ in the soil solution.
The ability of SOC stock values in surface horizons (genetic horizons defined as “A” in the soil profile description) as predictors of the SOC stock in the whole soil profile (including genetic horizons defined as “B” or “C”) was analyzed, taking both sets of values in a regression analysis. In contrast, an approach was also carried out to assess whether the realization of supplementary pits at a shallower depth can be highly related to the stock of the whole soil profile, as a supposed “soil pit 30 cm deep”, a depth equivalent to that used by FAO []. This estimation was carried out by means of the direct sum of i) the SOC stock of the horizons whose entire thickness was above 30 cm (for example: A1, 0–10; A2, 10–20 cm, and ii) the weighted fraction corresponding to the horizons that include such a depth of 30 cm (for example: C1, 20–40 cm). The foreseeable influence on the C stocks of soil forming factors “climate” and “organisms” [] (expressed in this work as soil moisture regime (SMR) and land use, respectively) was assessed by analyzing statistically significant differences comparing both data groups in terms of carbon stocks.
3. Results
The results of calculations of the SOC stocks using Equation (1) are summarized in Table 2. Data in this table correspond to stocks in whole soil profiles, as well as the results of an approach for supplementary soil pits 30 cm deep. Complete results, including soil horizons and pedotransfer function (Equation (2)), are provided in Table S1 (Supplementary Material).
Table 2.
SOC stocks in the studied soil profiles: (a) comparison of stocks from surface horizons and sum of stocks in subsurface horizons; (b) comparison of stocks assuming a 30 cm sampling and total SOC stocks of complete soil profiles.
The set of studied soil profiles presents an average SOC stock value (mean and standard deviation) of 75.0 ± 58.1 Mg ha−1. Analysis of the role of subsurface horizons as a carbon reservoir is a key part of this work. In 46 out of 54 soil profiles, an irregular decrease in SOC stocks with depth was observed; in 24 of these 46 cases, the irregularity refers to the base value of SOC concentration.
The results (Figure 1) show how the C stocks in the subsurface horizons (mean and standard deviation of 55.1 ± 45.1 Mg ha−1) are significantly higher than those in the more easily accessible soil surface horizons (19.9 ± 27.0 Mg ha−1). The average value of the estimations made at 30 cm is 27.7 ± 21.9 Mg ha−1.
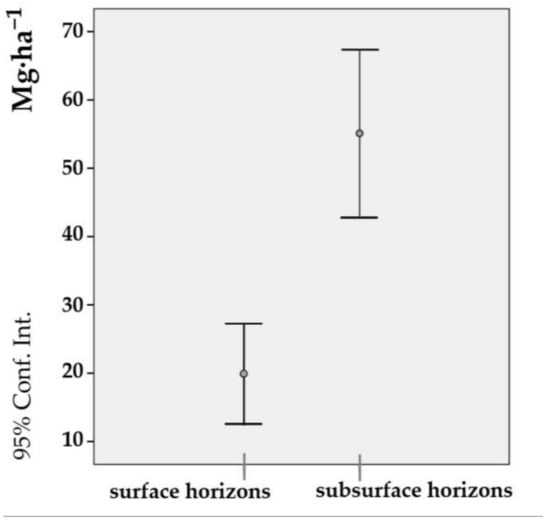
Figure 1.
Statistical analysis of the differences in the values of SOC stock in the superficial and subsurface horizons (95% confidence intervals). Software: IBM SPSS Statistics v.24.
Surface A horizons show a depth of 17 ± 11 cm, with respect to an average depth of 139 ± 43 cm in the complete soil profiles; that is, a ratio of approximately 1:8. SOC stock values are 19.9 ± 27.0 and 75.0 ± 58.1 Mg ha−1 in A horizons and total profiles, respectively; that is, a ratio of approximately 1:4.
The SOC stock corresponding to the A horizons represents an mean percentage of 26 ± 20%, while the estimate made on soil pits at 30 cm is 42 ± 19% of the total SOC stock, that is, notably higher and less variable.
The ability of SOC stock values in surface horizons as predictors of the total stock of the soil profile was analyzed, as was the ability of the approach for supplementary soil pits 30 cm deep, taking both sets of values in a regression analysis (Figure 2).
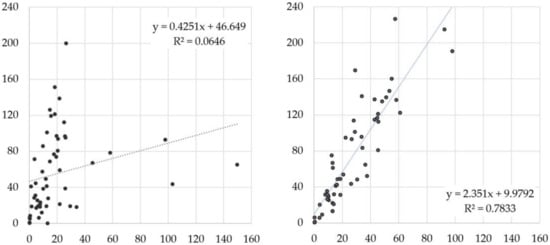
Figure 2.
Linear regression analysis for the variables “SOC stock in surface horizons” and “SOC stock in complete soil profile” (left); “SOC stock for a supposed 30 cm sampling” and “SOC stock in complete soil profile” (right).
The foreseeable influences of the forming factors “climate” and “organisms” (expressed as SMR and land use, respectively) on C stocks are shown in Figure 3.
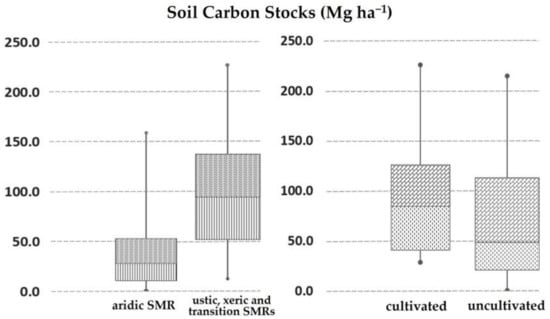
Figure 3.
Soil C stocks (Mg ha−1) in studied soil profiles considering: Soil Taxonomy’s moisture regimes (left); basic land use: agricultural vs. natural or semi-natural vegetation (right).
The influences of both factors are reflected in statistically significant differences in both data groups in terms of carbon stocks in the studied soil profiles (Figure 4).
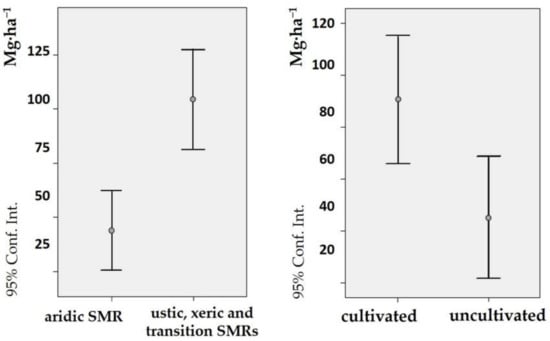
Figure 4.
Statistical analysis of the differences in the values of SOC stock considering soil moisture regimes (left) and basic land use (95% confidence intervals). Software: IBM SPSS Statistics v.24.
4. Discussion
The obtained results are broadly consistent (even clearly higher) with the global values of deep soil organic C indicated by Batjes [], according to which, the SOC stored below 20 cm depth exceeds 50% of the total. Based on the criteria used in this work, that is, A horizons with a similar average thickness of approximately 17 cm, the SOC stored under A horizons reaches 73% of the total soil profile.
FAO [] indicates values of 33 Mg ha−1 for SOC stocks of Gypsisols, a characteristic type of gypsum-bearing soils, using estimation models at 30 cm deep. This value is of similar magnitude to that obtained at the same depth using the approach in this work (28 Mg ha−1, part of them in the Gypsisols group) and may, therefore, be related to a foreseeable underestimation of such stocks.
Thus, the calculation of SOC stocks based exclusively on surface horizons implies leaving as much as three quarters of the total SOC out of the SOC models, and somewhat less than 60% if the calculation is based on information from the top 30 cm. In this regard, Sun et al. [] indicate currently existing inaccuracies, as the SOC stock models are essentially based on two dimensions; that is, they take only one value of the surface layer as representative of the soil as a whole without considering the vertical effect, and they lack the SOC estimation based on data measured at different depths.
The heterogeneity of the vertical distribution of partial stocks (referring to each horizon of the profile) is revealed by the high value of the standard deviation. This makes it difficult to apply predictive criteria to estimate the total SOC stocks. In this regard, the predictive capacity of surface horizons (“A horizons” in the soil profile descriptions) with respect to the soil profile is practically null for a linear model (R2 = 0.06) (Figure 2a). However, the predictive ability markedly increases (R2 = 0.78) in the tentative case of sampling to a depth of 30 cm from the surface (Figure 2b) (mean 27.7 ± 21.9 Mg ha−1), which typically comprises two or more complete A or B (or even C) genetic horizons. However, it should be considered that such an approximation covers an amount somewhat above 40% of the total soil C stock; the stock at 30 cm should not be used as direct data, but as a predictor, being of interest to improve the information on which such predictive ability is based.
Morphological features of cumulative soils play in favor of the uncertainties cited above in predicting deep soil carbon stocks. In this regard, geomorphological factors play a key role in soils under aridic, xeric, or ustic soil moisture regimes. Gypsum-bearing soil development is favored in foot-slope positions [] (in which cumulic features often occur) which can vertically determine relatively high SOC levels at certain depths, or even their irregular distribution. Erosion in head- and shoulder-slopes favor the presence of an irregular decrease in SOC with depth in soils developed in corresponding depositional forms of back-, foot-, and toe-slopes []. A similar consideration may be made with respect to gypsum-bearing alluvial soils. The factor “depth of the soil profile” presents a foreseeable positive correlation with SOC stocks; however, the predictive capacity regarding SOC stocks of this factor is low (R2 = 0.31). This can be interpreted as the influence of the cumulative characteristics of most of the studied profiles; in regions where the climate is excessively dry within the aridic SMR, cultivation under rainfed conditions is not possible regardless of whether the soil is deep enough.
The influence of land use is reflected in statistically significant differences in terms of total carbon stocks in the studied soil profiles. However, samplings in superficial horizons do not reflect significant differences in terms of the percentages of the total SOC that represent soils under cultivation (23 ± 15%) compared to soils under natural or semi-natural vegetation (25 ± 19%). However, [] found no significant differences below 40 cm depth in SOC concentration in relation to the land use factor. Results associated with land use in these soils present a situation that may not be consistent with other studies [], as the soils subjected to cultivation are the soils that show significantly higher carbon stocks. This situation, however, suggests the influence of moisture conditions on these stocks with respect to land use []. That is, soils are cultivated where rainfall is higher (xeric and ustic regimes), so that even under cultivation, the incorporation of organic matter is expected to be higher than in conditions of greater aridity, with the consequent scarcity of plant cover.
All these considerations suggest that soil sampling techniques based on soil profile description are key in the development of accurate predictive models of global soil C stocks []. Vertical soil coring is notably less time consuming than soil profile description, particularly in heterogeneous sites, but the latter is key to reducing uncertainties related to soil compression as well as accounting for coarse fragments [,]. In contrast, sampling at pre-established depths may not be consistent enough with existing information based on soil taxonomic and cartographic units. These units consider the soil horizon as a reflection of pedogenesis; consequently, the basis of soil sampling [], i.e., pre-established sampling intervals, do not necessarily have to coincide with the thickness of the soil layers affected by different pedogenetic processes, including melanization []. In this way, fixed sampling intervals can maximize or minimize the importance of such processes and their effects, or even completely obviate them.
Numerous authors have addressed the limitations that available soil information presents for an accurate calculation of SOC stocks [,,,,], commonly emphasizing aspects such as the lack of information regarding the content of coarse fragments. The results obtained in this work indicate, in a total of 277 soil horizons, that when the coarse fragments criterion is not used, some type of overestimation of SOC stocks occurs in two thirds of the samples. In 16% of horizons, an overestimation greater than 50% will occur, with an average overestimation of 29% of the SOC stock, with a median of 3%.
It should also be noted that the availability of BD values is notably limited, regardless of the method used, which increases sources of error, given the need to apply pedotransfer functions. Similarly, Batjes [] pointed out the inaccuracy of the wet oxidation method for SOC determination (associated with its incomplete oxidation), and the dry combustion method is being used with increasing frequency; however, the availability of SOC data is higher for the wet oxidation method. All of these considerations seem to relate in a similar way to any of the soil horizons, regardless of their depth. For example, the availability of data on bulk density, provided by databases, does not seem to be substantially greater in the higher and much more accessible soil horizons. These limitations should not influence consideration of the key role of subsurface horizons in accurately quantifying soil carbon.
5. Conclusions
The studied soil profiles, representative of gypsum-bearing soils in different climatic conditions within drylands, reflect a high vertical heterogeneity in the SOC stocks of their different soil horizons, which is related to landforms and land uses. This leads to great uncertainty in SOC quantification, limiting the precision of data provided from gypsum-bearing soils to the quantification models of the total SOC stock, which tend to underestimate it. The values obtained in this study indicate that, as an average value, 73% of the total SOC stock is stored in deep soil horizons. These soils tend to show contrasting values in three key parameters for SOC stock quantification: bulk density, coarse fragments, and horizon thickness. Coarse fragments are often overlooked in SOC stock models; thus, an overestimation may occur. In this work, it was observed that, on average, the SOC stock would be overestimated by almost 30% if the volume of coarse fragments was not considered.
The predictive capacity of SOC information solely from soil surface horizons has been observed as negligible in the studied soil profiles. According to the results obtained, calculations of soil C reserves based on soil pits at 30 cm depth can be recommended as complements to the realization of complete soil pits. This 30 cm approach covers, on average, approximately 40% of the total C reserve in the soil; it should not be used as direct data, but rather as a predictor. Therefore, it is of interest to improve the information about which such predictive capacity is based.
The use of soil horizons as a basis for the calculation of SOC stocks allows these calculations to be associated, through basic pedological criteria, with the available soil cartographic information.
Supplementary Materials
The following supporting information can be downloaded at: https://www.mdpi.com/article/10.3390/earth3030048/s1. Table S1: List of soil profiles and horizons, gypsum values, and Soil Organic Carbon calculations (including, where applicable, the pedotransfer function for calculating bulk densities).
Author Contributions
Conceptualization, M.R.-R.; methodology, M.R.-R.; investigation, M.R.-R. and A.O.-M.; data curation, M.R.-R. and A.O.-M.; writing—original draft preparation, M.R-R.; writing—review and editing, M.R.-R. and A.O.-M. All authors have read and agreed to the published version of the manuscript.
Funding
This research received no external funding.
Data Availability Statement
Not applicable.
Acknowledgments
We thank the anonymous reviewers for their constructive comments, which helped improve the quality of this paper.
Conflicts of Interest
The authors declare no conflict of interest.
References
- Rowley, M.C.; Grand, S.; Verrecchia, É.P. Calcium-mediated stabilisation of soil organic carbon. Biogeochemistry 2018, 137, 27–49. [Google Scholar] [CrossRef]
- Kahle, M.; Kleber, M.; Torn, M.S.; Jahn, R. Carbon storage in coarse and fine clay fractions of illitic soils. Soil Sci. Soc. Am. J. 2003, 67, 1732–1739. [Google Scholar] [CrossRef]
- Von Lützow, M.; Kögel-Knabner, I.; Ekschmitt, K.; Matzner, E.; Guggenberger, G.; Marschner, B.; Flessa, H. Stabilization of organic matter in temperate soils: Mechanisms and their relevance under different soil conditions—A review. Eur. J. Soil Sci. 2006, 57, 1–20. [Google Scholar] [CrossRef]
- Gross, C.D.; Harrison, R.B. The Case for Digging Deeper: Soil Organic Carbon Storage, Dynamics, and Controls in Our Changing World. Soil Syst. 2019, 3, 28. [Google Scholar] [CrossRef]
- Ma, W.; Li, Z.; Ding, K.; Huang, J.; Nie, X.; Zeng, G.; Wang, S.; Liu, G. Effect of soil erosion on dissolved organic carbon redistribution in subtropical red soil under rainfall simulation. Geomorphology 2016, 226, 217–225. [Google Scholar] [CrossRef]
- Jafarzadeh, A.A.; Burnham, C.P. Gypsum crystals in soils. Eur. J. Soil Sci. 1992, 43, 409–420. [Google Scholar] [CrossRef]
- Moret-Fernández, D.; Herrero, J. Effect of gypsum content on soil water retention. J. Hydrol. 2015, 528, 122–126. [Google Scholar] [CrossRef]
- Hoffmann, U.; Yair, A.; Hikel, H.; Kuhn, N.J. Soil organic carbon in the rocky desert of northern Negev (Israel). J. Soils Sediments. 2012, 12, 811–825. [Google Scholar] [CrossRef]
- Herrero, J.; Porta, J. The terminology and the concepts of gypsum-rich soils. Geoderma 2000, 96, 47–61. [Google Scholar] [CrossRef]
- Gumuzzio, J.; Casas, J. Accumulations of soluble salts and gypsum in soils of the Central Region, Spain. Cah.-ORSTOM. Pédologie 1988, 24, 215–226. [Google Scholar]
- Aznar, J.M.; Poch, R.M.; Badía, D. Soil catena along gypseous woodland in the middle Ebro Basin: Soil properties and micromorphology relationships. Span. J. Soil Sci. 2013, 3, 1. [Google Scholar] [CrossRef]
- Moret-Fernández, D.; Castañeda, C.; Pueyo, Y.; Bueno, C.G.; Herrero, J. Hydro-physical behaviour of gypseous soils under different soil management in a semiarid region of NE Spain. Arid Land Res. Manag. 2013, 27, 1–16. [Google Scholar] [CrossRef]
- Furley, P.A.; Zouzou, R. The origin and nature of gypsiferous soils in the Syrian mid-Euphrates. Scott. Geogr. Mag. 1989, 105, 30–37. [Google Scholar] [CrossRef]
- Florea, N.; Al-Joumaa, K. Genesis and classification of gypsiferous soils of the Middle Euphrates Floodplain, Syria. Geoderma 1998, 87, 67–85. [Google Scholar] [CrossRef]
- Khademi, H.; Mermut, A.R. Micromorphology and classification of Argids and associated gypsiferous Aridisols from Central Iran. Catena 2003, 54, 439–455. [Google Scholar] [CrossRef]
- Moghiseh, E.; Heidari, A. Polygenetic saline gypsiferous soils of the Bam region, Southeast Iran. J. Soil Sci. Plant Nutr. 2012, 12, 729–746. [Google Scholar] [CrossRef][Green Version]
- Sagliker, H.A.; Cenkseven, S.; Kizildag, N.; Kocak, B.; Ozdeniz, E.; Ozbey, B.G.; Bölükbası, A.; Kurte, L. Is parent material an important factor in soil carbon and nitrogen mineralization? Eur. J. Soil Biol. 2018, 89, 45–50. [Google Scholar] [CrossRef]
- Nettleton, W.D.; Nelson, R.E.; Brasher, B.R.; Derr, P.S. Gypsiferous Soils in the Western United States; Kittrick, J.A., Fanning, D.S., Hossner, L.R., Eds.; Soil Science Society of America Special Publications: Madison, WI, USA, 1982. [Google Scholar] [CrossRef]
- Carter, B.J.; Inskeep, W. Accumulation of Pedogenic Gypsum in Western Oklahoma Soils. Soil Sci. Soc. Am. J. 1988, 52, 1107–1113. [Google Scholar] [CrossRef]
- Bockheim, J.G. Gypsic and Petrogypsic Horizons. In Soil Geography of the USA. A Diagnostic-Horizon Approach; Springer: Dordrecht, The Netherlands, 2014; pp. 178–188. [Google Scholar] [CrossRef]
- Mitrakos, K.A. A theory for Mediterranean plant life. Acta Oecol. 1980, 1, 245–252. [Google Scholar]
- Camarero, J.J.; Olano, J.M.; Parras, A. Plastic bimodal xylogenesis in conifers from continental Mediterranean climates. New Phytol. 2010, 185, 471–480. [Google Scholar] [CrossRef]
- Doblas-Miranda, E.; Rovira, P.; Brotons, L.; Martínez-Vilalta, J.; Retana, J.; Pla, M.; Vayreda, J. Soil carbon stocks and their variability across the forests, shrublands and grasslands of peninsular Spain. Biogeosciences 2013, 10, 8353–8361. [Google Scholar] [CrossRef]
- Jobbágy, E.G.; Jackson, R.B. The vertical distribution of soil organic carbon and its relation to climate and vegetation. Ecol. Appl. 2000, 10, 423–436. [Google Scholar] [CrossRef]
- Albaladejo, J.; Ortiz, R.; García-Franco, N.; Ruiz-Navarro, A.; Almagro, M.; García-Pintado, J.; Martínez-Mena, M. Land use and climate change impacts on soil organic carbon stocks in semi-arid Spain. J. Soils Sediments 2013, 13, 265–277. [Google Scholar] [CrossRef]
- FAO; Management of Gypsiferous Soils; Soil Resources, Management and Conservation Service-FAO; Land and Water De-velopment Division. FAO Soils Bulletin; Food and Agriculture Organization of the United Nations: Rome, Italy, 1990; ISBN 92-5-102948-2. [Google Scholar]
- Soil Survey Staff. Keys to Soil Taxonomy, 12th ed.; USDA-Natural Resources Conservation Service: Washington, DC, USA, 2014; ISBN 9780160923210. [Google Scholar]
- Calvo de Anta, R.; Luís, E.; Febrero-Bande, M.; Galiñanes, J.; Macías, F.; Ortíz, R.; Casás, F. Soil organic carbon in peninsular Spain: Influence of environmental factors and spatial distribution. Geoderma 2020, 370, 114365. [Google Scholar] [CrossRef]
- CSIC-Consejo Superior de Investigaciones Científicas. Memoria del Mapa de Asociaciones de Suelos de la Comunidad de Madrid; Consejo Superior de Investigaciones Científicas y Consejería de Agricultura y Cooperación de la Comunidad de Madrid, Spain: Madrid, Spain, 1990; OCLC 431634720. (In Spanish) [Google Scholar]
- Marqués, M.J.; Álvarez, A.M.; Carral, P.; Esparza, I.; Sastre, B.; Bienes, R. Estimating Soil Organic Carbon in Agricultural Gypsiferous Soils by Diffuse Reflectance Spectroscopy. Int. Soil Water Conserv. Res. 2020, 8, 383–392. [Google Scholar] [CrossRef]
- De la Torre, A.; Alías-Pérez, L.J. Suelos y Vegetación en el Alto Vinalopó; Secretariado de Publicaciones, Universidad de Alicante, Spain: Alicante, Spain, 1996; ISBN 84-7908-271-2. (In Spanish) [Google Scholar]
- Badía, D.; Martí, C.; Aznar, J.M.; León, J. Influence of slope and parent rock on soil genesis and classification in semiarid mountainous environments. Geoderma 2013, 193–194, 13–21. [Google Scholar] [CrossRef]
- Jiménez-Ballesta, R.; Almendros, G.; Polo, A.; Martín de Vidales, J.L. Estudio de un perfil con caracteres isohúmicos en la comarca de la Bureba (Burgos). An. Edafol. Agrobiol. 1983, 11–12, 1821–1835. (In Spanish) [Google Scholar]
- Aguilera, E.; Guzmán, G.I.; Álvaro-Fuentes, J.; Infante-Amate, J.; García-Ruiz, R.; Carranza-Gallego, G.; Soto, D.; González-Molina, M. A historical perspective on soil organic carbon in Mediterranean cropland (Spain, 1900–2008). Sci. Total Environ. 2018, 621, 634–648. [Google Scholar] [CrossRef]
- Diacono, M.; Montemurro, F. Long-term effects of organic amendments on soil fertility. A review. Agron. Sustain. Dev. 2010, 30, 401–422. [Google Scholar] [CrossRef]
- Brahim, N.; Ibrahim, H.; Hatira, A. Tunisian Soil Organic Carbon Stock—Spatial and Vertical Variation. Procedia Eng. 2014, 69, 1549–1555. [Google Scholar] [CrossRef]
- FAO. 2019. Measuring and modelling soil carbon stocks and stock changes in livestock production systems: Guidelines for assessment (Version 1). In Livestock Environmental Assessment and Performance (LEAP) Partnership; FAO: Rome, Italy, 2019; 170p. [Google Scholar]
- Al-Qinna, M.I.; Jaber, S.M. Predicting soil bulk density using advanced pedotransfer functions in an arid environment. Trans. ASABE 2013, 56, 963–976. [Google Scholar] [CrossRef]
- Abdelbaki, A.M. Evaluation of pedotransfer functions for predicting soil bulk density for U.S. soils. Ain Shams Eng. J. 2018, 9, 1611–1619. [Google Scholar] [CrossRef]
- Wiesmeier, M.; Spörlein, P.; Geuβ, U.; Hangen, E.; Haug, S.; Reischl, A.; Schilling, B.; von Lützow, M.; Kögel-Knabner, I. Soil organic carbon stocks in southeast Germany (Bavaria) as affected by land use, soil type and sampling depth. Glob. Chang. Biol. 2012, 18, 2233–2245. [Google Scholar] [CrossRef]
- Vanguelova, E.I.; Bonifacio, E.; De Vos, B.; Hoosbeek, M.R.; Berger, T.W.; Vesterdal, L.; Armolaitis, K.; Celi, L.; Dinca, L.; Kjønaas, O.J.; et al. Sources of errors and uncertainties in the assessment of forest soil carbon stocks at different scales. Review and recommendations. Environ. Monit. Assess. 2016, 188, 630. [Google Scholar] [CrossRef]
- Davis, M.R.; Alves, B.J.R.; Karlen, D.L.; Kline, K.L.; Galdos, M.; Abulebdeh, D. Review of Soil Organic Carbon Measurement Protocols: A U.S. and Brazil Comparison and Recommendation. Sustainability 2018, 10, 53. [Google Scholar] [CrossRef]
- Soil Survey Staff. Soil Taxonomy: A basic System of Soil Classification for Making and Interpreting Soil Surveys, 2nd ed.; Natural Resources Conservation Service U.S. Department of Agriculture: Washington, DC, USA, 1999. Available online: https://www.nrcs.usda.gov/Internet/FSE_DOCUMENTS/nrcs142p2_051232.pdf (accessed on 2 May 2022).
- Jones, E.J.; MacBratney, A.B. Mapping homogeneous spectral response zones in a soil profile. Soil Discuss. 2018, 12, 1–20. [Google Scholar] [CrossRef]
- Poeplau, C.; Vos, C.; Don, A. Soil organic carbon stocks are systematically overestimated by misuse of the parameters bulk density and rock fragment content. Soil 2017, 3, 61–66. [Google Scholar] [CrossRef]
- Batjes, N.H.; Ribeiro, E.; van Oostrum, A. Standardised soil profile data to support global mapping and modelling (WoSIS snapshot 2019). Earth Syst. Sci. Data 2020, 12, 299–320. [Google Scholar] [CrossRef]
- Batjes, N.H. Soil carbon stocks of Jordan and projected changes upon improved management of croplands. Geoderma 2006, 132, 361–371. [Google Scholar] [CrossRef]
- Batjes, N.H.; Ribeiro, E.; van Oostrum, A.; Leenaars, J.; Hengl, T.; de Jesus, J.M. WoSIS: Providing standardised soil profile data for the world. Earth Syst. Sci. Data 2017, 9, 1–14. [Google Scholar] [CrossRef]
- NCSS, National Cooperative Soil Survey Soil Characterization Database. Available online: http://ncsslabdatamart.sc.egov.usda.gov/ (accessed on 14 April 2022).
- Wang, B.; Gray, J.M.; Waters, C.M.; Anwar, M.R.; Orgill, S.E.; Cowie, A.L.; Feng, P.; Liu, D.L. Modelling and mapping soil organic carbon stocks under future climate change in south-eastern Australia. Geoderma 2022, 405, 115442. [Google Scholar] [CrossRef]
- Lozano-García, B.; Muñoz-Rojas, M.; Parras-Alcántara, L. Climate and land use changes effects on soil organic carbon stocks in a Mediterranean semi-natural area. Sci. Total Environ. 2017, 579, 1249–1259. [Google Scholar] [CrossRef]
- Yigini, Y.; Panagos, P. Assessment of soil organic carbon stocks under future climate and land cover changes in Europe. Sci. Total Environ. 2016, 557–558, 838–850. [Google Scholar] [CrossRef]
- Sun, Z.; Bai, H.; Ye, H.; Zhuo, Z.; Huang, W. Three-dimensional modelling of soil organic carbon density and carbon sequestration potential estimation in a dryland farming region of China. J. Geogr. Sci. 2021, 31, 1453–1468. [Google Scholar] [CrossRef]
- Zhuo, Z.; Chen, Q.; Zhang, X.; Chen, S.; Gou, Y.; Sun, Z.; Huang, Y.; Shi, Z. Soil organic carbon storage, distribution, and influencing factors at different depths in the dryland farming regions of Northeast and North China. Catena 2022, 210, 105934. [Google Scholar] [CrossRef]
- Schimel, J.; Chadwick, O. What’s in a name? The importance of soil taxonomy for ecology and biogeochemistry. Front. Ecol. Environ. 2013, 11, 405–406. [Google Scholar] [CrossRef]
- Bienes, R.; Instituto Madrileño de Investigación y Desarrollo Rural, Agrario y Alimentario (IMIDRA), Madrid, Spain. Personal communication, 2022.
- Badía, D. (coord); Itinerarios edáficos por el Alto Aragón; Cuadernos Altoaragoneses de Trabajo; Institute of Alto Aragonese Studies: Huesca, Spain, 2009; Volume 28, 191p, ISBN 978-84-8127-210-9. (In Spanish) [Google Scholar]
- SECS. Sociedad Española de la Ciencia del Suelo. Suelos Representativos de España. Datos Normalizados y Ampliados por Saa, A. y Gallardo, J. Available online: https://www.secs.com.es/suelos-representativos/ (accessed on 17 April 2022).
- Bockheim, J.G.; Gennadiyev, A.N. The role of soil-forming processes in the definition of taxa in Soil Taxonomy and the World Soil Reference Base. Geoderma 2000, 95, 53–72. [Google Scholar] [CrossRef]
- Batjes, N.H. Total carbon and nitrogen in the soils of the world. Eur. J. Soil Sci. 1996, 47, 151–163. [Google Scholar] [CrossRef]
- FAO. Global Soil Organic Carbon Sequestration Potential Map—GSOCseq v.1.1.; Technical Report: Rome, Italy, 2022. [Google Scholar] [CrossRef]
- Gross, C.D.; Harrison, R.B. Quantifying and comparing soil carbon stocks: Underestimation with the core sampling method. Soil Sci. Soc. Am. J. 2018, 82, 949. [Google Scholar] [CrossRef]
Publisher’s Note: MDPI stays neutral with regard to jurisdictional claims in published maps and institutional affiliations. |
© 2022 by the authors. Licensee MDPI, Basel, Switzerland. This article is an open access article distributed under the terms and conditions of the Creative Commons Attribution (CC BY) license (https://creativecommons.org/licenses/by/4.0/).