Article

Characterization and Analysis of Household Solid Waste Composition to Identify the Optimal Waste Management Method: A Case Study in Hanoi City, Vietnam

Graduate School of Life and Environmental Sciences, University of Tsukuba, Tsukuba 305-8572, Japan
*
Author to whom correspondence should be addressed.
Earth 2021, 2(4), 1046-1058; https://doi.org/10.3390/earth2040062
Submission received: 29 September 2021 / Revised: 26 November 2021 / Accepted: 26 November 2021 / Published: 30 November 2021

Abstract

:
A survey on household solid waste generation and physical composition was conducted in Hanoi City, the capital of Vietnam. The study sampled 110 households in specific areas with different population density and household scale. Household solid waste was classified into 13 main categories and 25 sub-categories. The results showed that average generation rate of waste in Hanoi City is 0.63 kg per person per day with a slightly higher rate in rural areas than urban ones. The largest proportion was food and garden waste at 78.9% followed by plastic and paper. Plastic waste was segregated into plastic and nylon, and nylon was double that of plastics in household solid waste. Compared to previous studies, this study found a higher portion of organic matter in the waste characterization that could be attributed to the changes in lifestyle patterns associated with COVID-19. This situation provides challenges and opportunities for introducing biomass technology to recover energy.

1. Introduction

In order to improve municipal solid waste management (hereinafter referred to as “MSW”), it is crucial to identify the quality and quantity of municipal solid waste, of which households and commercial are major sources. This source of data is well managed in developed countries, but in developing countries, it is not clear and the reported data are assumed from small survey groups or reporting mechanisms provided by the central government. In Japan, every fiscal year, the Ministry of the Environment (MOE) publishes a report on municipal solid waste emissions and disposal with the state of (i) waste generation and disposal; (ii) waste incineration plants; (iii) landfill sites; and (iv) waste disposal expenses and compares with the data of the previous year [1]. In the Southeast Asia region, the National Environment Agency of Singapore also has official publications on waste statistics and overall recycling annually. In 2020, under the impact of COVID-19, this country recorded a higher disposal of packing waste as online shopping and home-delivered food gained a market share. Paper and cardboard accounted for 19.4% in total generated waste [2]. This country focuses on the recycling rate so that in the annual report, waste type, generated and recycled amounts, recycling rate, and total disposed are the five main indexes.
Waste generation and characterization are among the most important factors to consider when selecting the most appropriate collection method, treatment technology, and final disposal. Countries in the process of urbanization experience increasing population and lifestyle changes under the impact of massive immigration from rural to urban zones and higher income, which leads to considerable increase in urban waste generation. This situation causes a great burden at landfills, especially in big urban areas with very limited landfill disposal sites. Some studies have addressed this problem: Hara and Yabar (2012) discussed how the Japanese government quickly promoted proper technologies including the introduction of incineration facilities from the 1970s when Japan was dealing with the increasing amount of waste generation and then introduced more integral and proactive policies for sustainable resource management in the early 1990s [3]. Ikhlayel et al. (2016) and Singh et al. (2014) highlighted the importance to introduce integrated waste management thinking in cities experiencing increase in amount of urban waste generation in developing countries [4,5].
Recently, in the state-of-the-art technologies applied in MSW, being increasing well-known is waste to energy (WtE) including thermal pyrolysis/gasification process. These methods convert MSW into syngas by a thermal process and generate steam and/or electricity, generally called energy [6]. It is recognized as the best appropriate and economical approach for various kinds of waste such as rural waste, MSW, and industrial waste [6]. It is widely applicable in high income countries in parallel with the recycling industry for high value recyclables from waste such as plastics, paper, and metals because the fraction of food waste and garden waste is only at 32% of total waste, and dry waste that could be recycled reaches 51% on average. These processes are intermediate treatment and reduce more than 90% waste volume to final disposal/ landfill [7]. However, in contrast, low-and middle-income countries generate 56% and 53% food and garden waste, respectively, and in low-income countries, only 16% of the total waste stream could be recycled [7]. This results in another direction to select treatment option. Landfill, which buries waste with or without sanitary conditions, and composting, which recycles organic matter such as leftover foods and garden leaves into a valuable fertilizer that can enrich soil and plants, are the main methods for handling waste from daily life as well as commercial and agricultural waste in low-and middle-income countries for a long time. In recent years, there has been a trend to create improvements in standards of living, following this, combustible components of waste also increase in the proportion. Incineration technology has been introduced and applied in developing countries in recent years and has become a popular selection in many municipalities. Other advanced WtE options such as pyrolysis, gasification, plasma arc gasification, and industrialized recycling scale have not been properly realized due to several social and economic constraints, although they are very environmentally friendly and profitable [6].
In Vietnam, the amount of solid waste in 2019 has increased sharply by 46% compared to 2010 and it has become hard to find new final disposal sites in large cities due to rapid urbanization and industrialization. Ordinary solid waste occupies approximately 80% of the total solid waste. Mean collection service coverage over the nation is estimated at approximately 75%. There are 1322 waste disposal facilities nationwide including 381 incinerators, 37 composting plants, and 904 landfills, which are disposing of 13%, 16%, and 7% of the total collected amount, respectively. Most of final the disposal sites (70–80%) are inappropriately operated, that is, open dumping [8]. Therefore, it is currently urgent to construct engineered landfills and to minimize the waste amount by means of source separation, recycling, and intermediate treatment.
To improve the solid waste management including promotion of alternative disposal methods, the data of the amount of waste and waste characteristics are extremely essential. Chapter 9 of QCVN 07/2010/BXD issued by the Ministry of Construction of Vietnam stipulates the amount of domestic waste per capita per day up to the level of urbanization [9]. However, this QCVN does not consider the annual increase in terms of the amount of waste, and the method to determine the value. A study conducted by a JICA project reflected that the unit waste generation standard stipulated by the national technical regulation QCVN07:2010/BXD did not appropriately reflect the reality in localities. For example, according to the regulation, the unit waste generation standard for special cities and type I cities is 1.3 kg/person/day. However, under this study, data in Hue City was 0.6 kg/person/day and 0.8 kg/person/day for Da Nang City [10]. The un-realistically high standards would lead to wasteful investment, landfill capacity estimation, and miss-arrangement and recruitment of man-power for the operation of waste treatment facilities.
In addition, although existing at approximately 30% treatment capacity by incineration and compost all over the nation, the practical effectiveness was very low. Almost all composting plants have been closed due to poor fertilizer quality that cannot meet the requirement for fertilizer by the Ministry of Agriculture and Rural Development (MARD). In addition, this technology can only be applied for medium and small sizes and sales are not good, so it is very difficult to introduce this option in a big city such as Hanoi or Ho Chi Minh City. Furthermore, incineration plants have low capacity and are back dated applied technology mainly from China or domestic manufacturers. There are still some questions regarding the emissions from these incinerators. There are some incinerators in Hanoi, Ha Nam, Phu Tho provinces that do not operate well and stop working only in a short time due to high moisture content in input mixed waste [11]. So far, there are no waste to energy facilities in Vietnam because investment and operation costs are extremely high compared to conventional incineration, composting, and landfill. These advantages and difficulties in existing waste treatment technologies are more or less related to specific composition and characteristics of input waste. In every country, when developing a waste stream, the first step is to determine waste composition and generated volume to specify and apply suitable intermediate treatment technologies and final disposal appropriately.
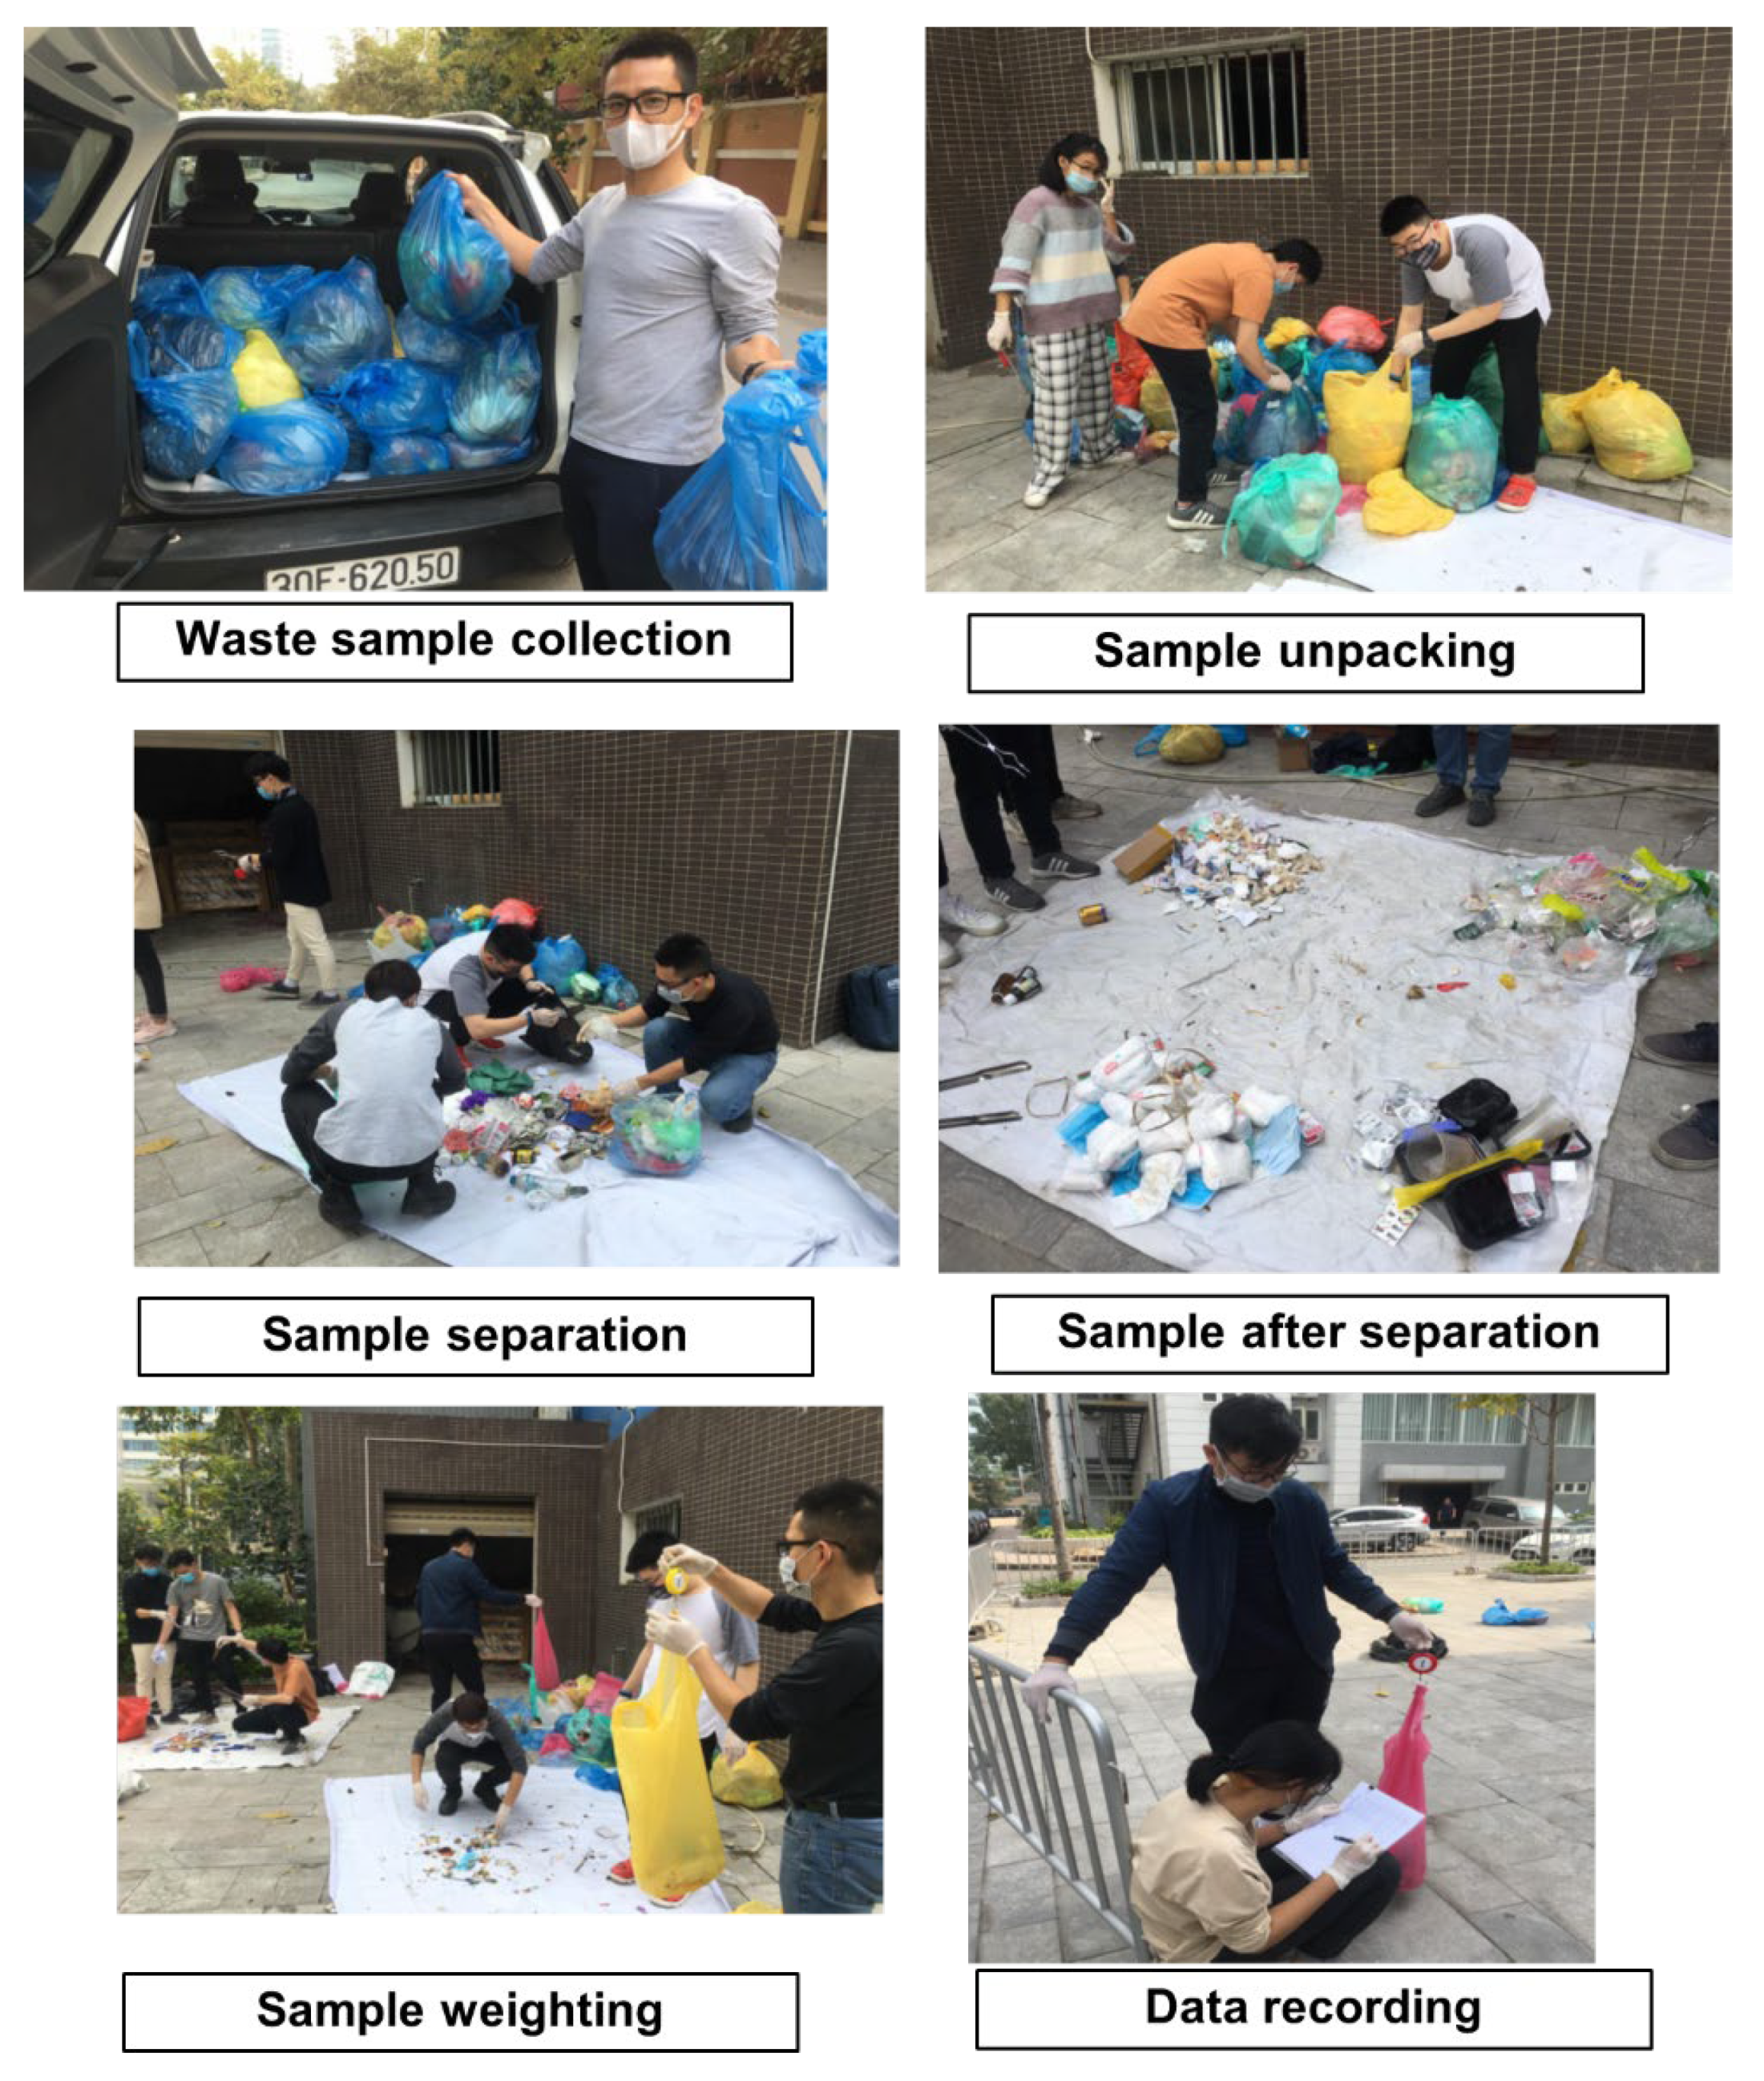
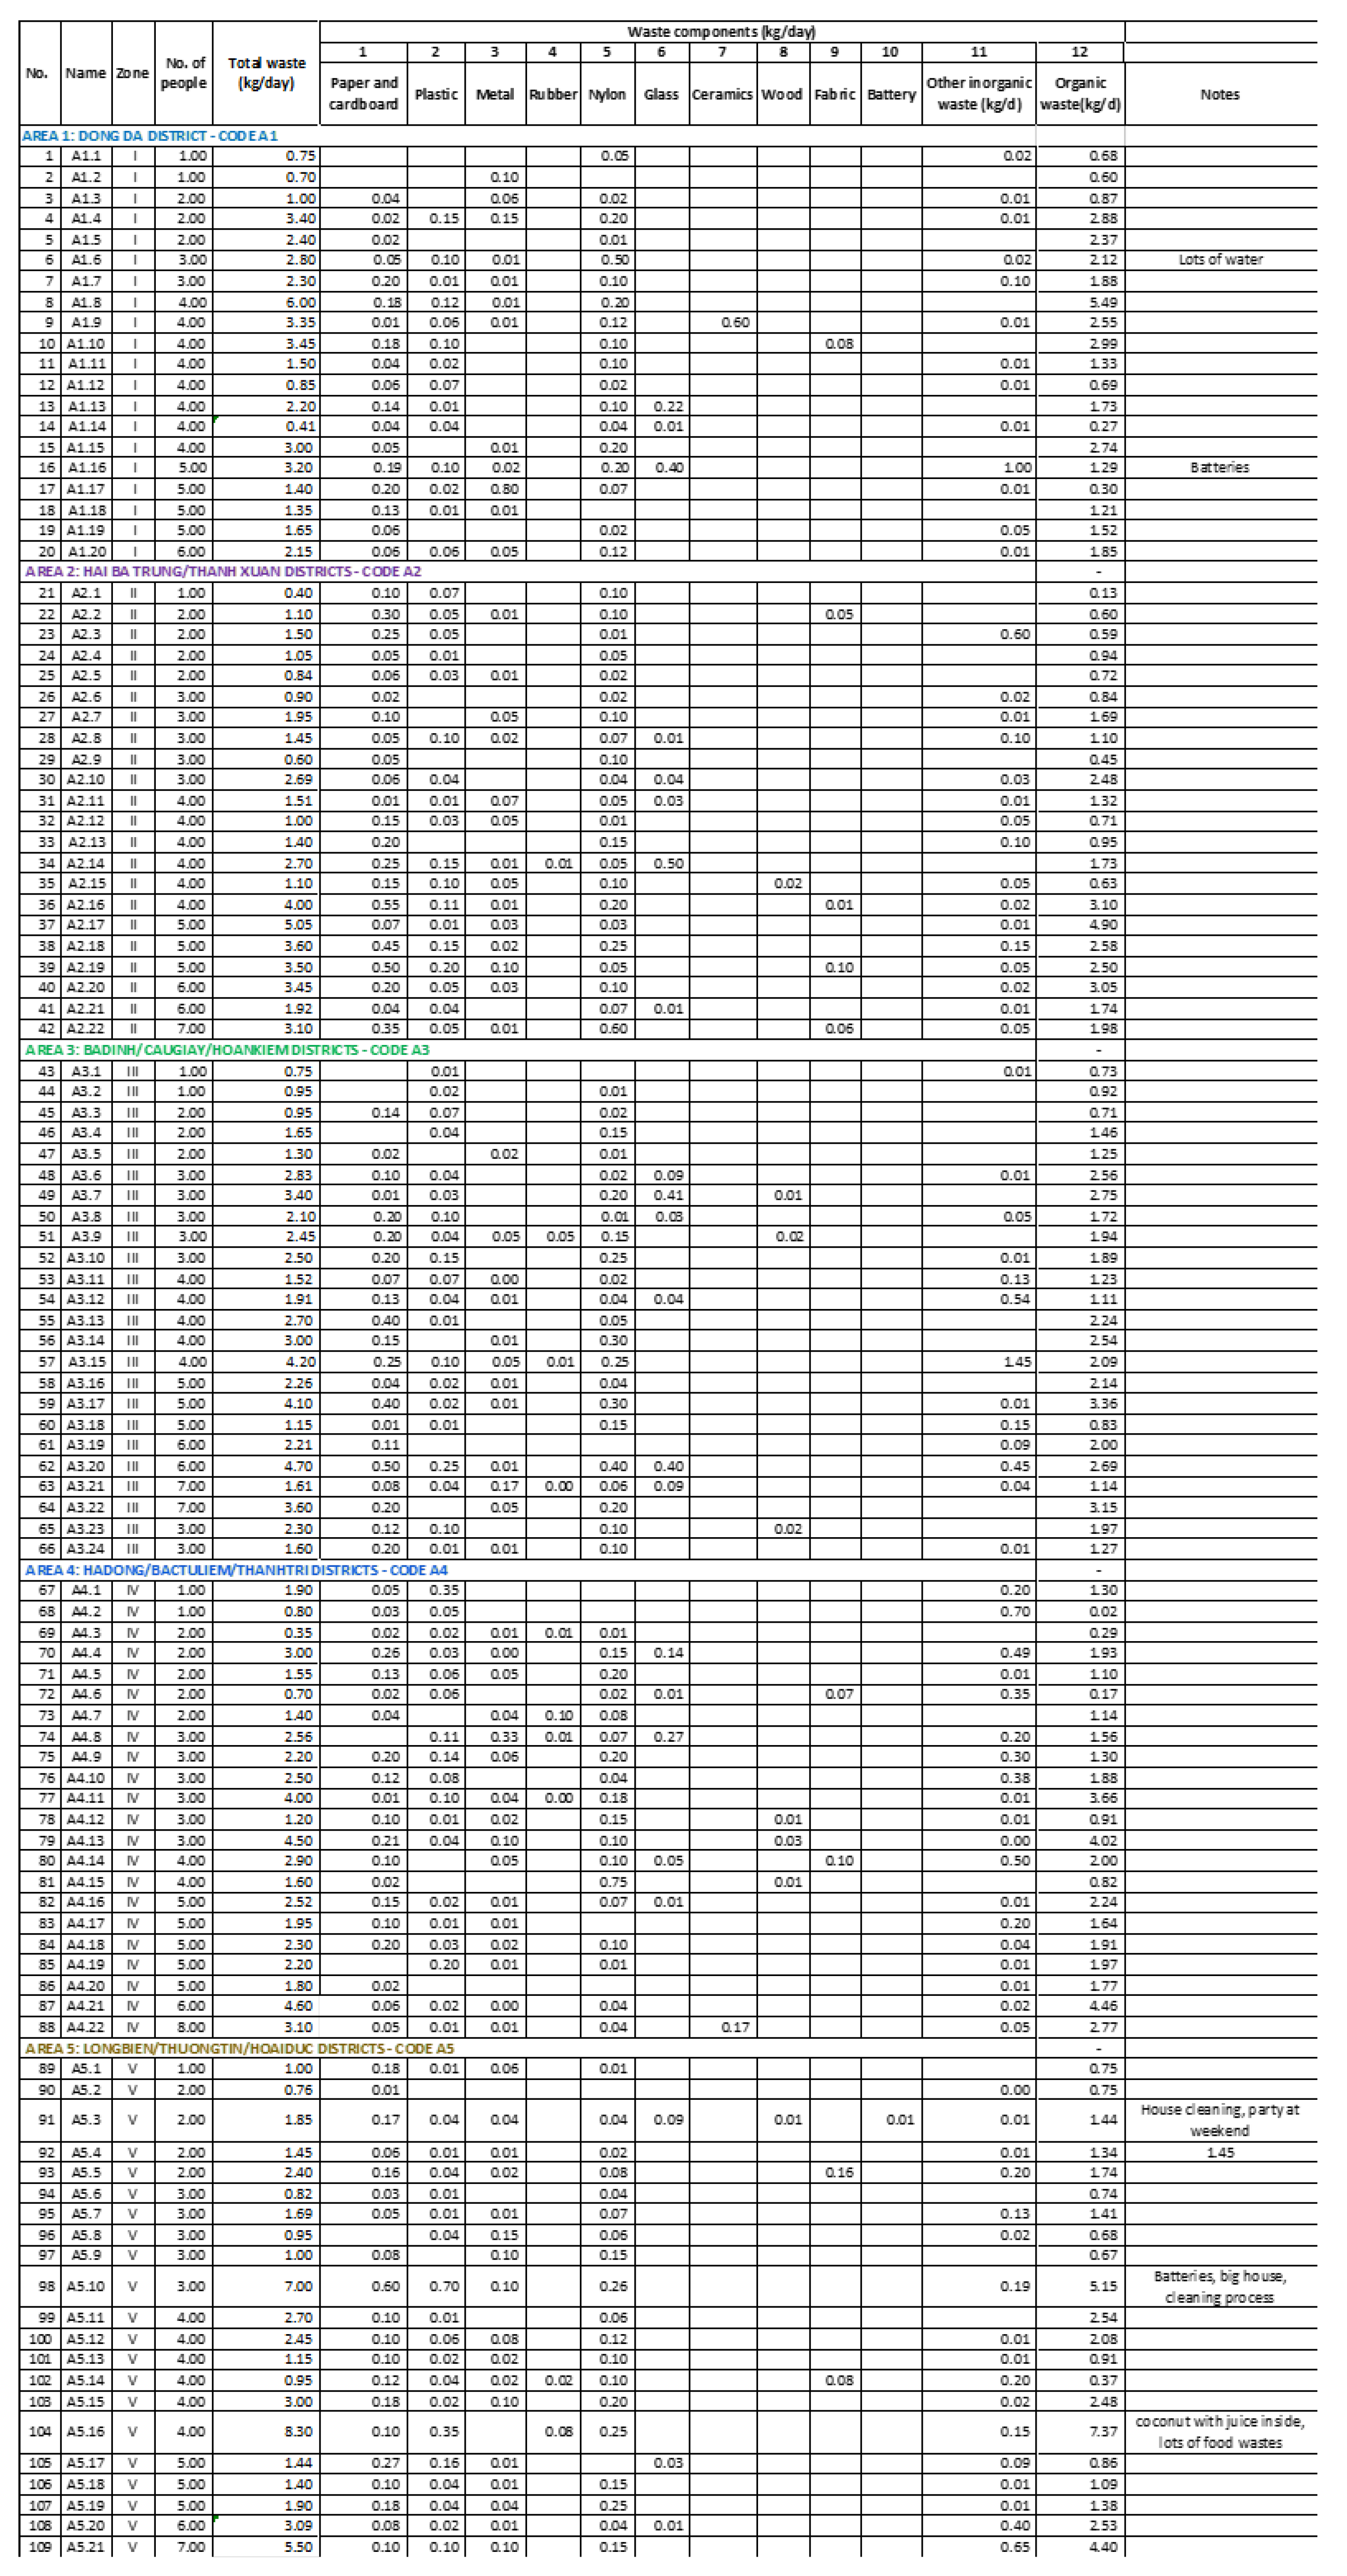
To specify the necessary tasks for an integrated MSW system to overcome the above difficulties, this study was carried out by a scientific method to obtain the in-depth and reliable data of household solid waste (HSW) generation and physical composition. Additionally, it analyzed the potential in material and energy recovery based on physical composition for the second large population city in Vietnam.

2. Materials and Methods

2.1. Study Area

Hanoi, the capital of Vietnam, has an area of 3344.7 km2 and a population of 8,053,663 people (as of 2019) including an urban city population of 3,962,310 people (49.2%) and suburban population of 4,091,353 people (50.8%) [12]. The big change in population structure in Hanoi City is the urban population increase significantly in 10 years from 41% (2009) to 49.2% (2019). In Hanoi, there are 29 districts including 10 urban districts, one town, and 18 suburban districts. Population density in the urban area is 9343 persons/km2 while in rural areas, it is only 1394 persons/km2, a gap of six to seven times. Dong Da, Thanh Xuan, Hai Ba Trung, and Cau Giay districts have the highest population densities in the city with 37,347 persons/km2, 32,291 persons/km2, 29,589 persons/km2, and 23,745 persons/km2, respectively [13]. Other new urban districts such as Hoang Mai, Bac Tu Liem, Nam Tu Liem, and Ha Dong have had high population concentrations in recent years. It can be seen that the population density in Hanoi is quite high, but its distribution is uneven. Population gaps between urban and rural areas and even suburban districts remain quite large with a tendency to continue to increase. In addition, there are a hundred thousand nonresidents and laborers from other provinces earning their living in Hanoi.
With this pressure from population increase, municipal solid waste has also dramatically been augmented. Currently, about 7000 tons of living waste is generated in Hanoi daily, which is discharged from households, restaurants, markets, and institutes. The increasing rate of waste volume collected in Hanoi is 10% per year due to the growing population and economy [14]. The two main landfills in Hanoi City are Nam Son and Xuan Son with a total designed capacity of 4500 and 700 tons a day, respectively. They are located outside of core areas of Hanoi with a transfer distance about 50–80 km from discharged sources. Additionally, the design capacity of waste treatment facilities and landfills has been over that capacity for two years because the actual waste volume received at the landfills are 5000 and 1300 tons a day, respectively. At the Xuan Son treatment complex, two incinerators with a total capacity at 950 tons a day were put into operation, but because of the applied low technology and greater time for maintenance, their capacity are very low and have been closed. Another treatment facility was located inside the city named the Cau Dien waste treatment facility (URENCO 7). It has one line for composting treatment for separated organic waste in some pilot wards and one line for medical waste. However, the waste in the pilot wards no longer has source separation and the composting line stopped working from 2015 [14]. With these practical issues, currently, Hanoi is facing a crisis in overloaded capacity landfill and alternative proper treatment technology.
The quantity and quality of MSW generated in Hanoi have changed dramatically due to the large concentrated population, and the effects of lifestyle changes brought about by economic development. In order to propose appropriate methods for MSW treatment for Hanoi City, it is necessary to investigate the characteristics of MSW in which the physical composition analysis is indispensable. Within the scope of this study, only solid waste generated from households and apartments was surveyed. In Vietnam, there are no legal documents to define the terminology “MSW” or “HSW”. Under the latest decree, number 09/VBHN-BTNMT issued on 25 October 2019, terminologies including “solid waste”, “ordinary solid waste”, and “domestic solid waste” are defined legally. “Domestic solid waste” is defined as solid waste generated from the daily life of people [15]. This means the domestic solid waste including waste from various sources: households and apartments; commercial centers such as outdoor markets, supermarkets, restaurants, hotels, etc.; institutes/offices/ schools; demolition waste; public areas and street sanitation waste; and ordinary waste from medical centers or industrial facilities. MSW in a broader meaning and common understanding is solid waste generated in urban areas, and not in rural areas. It means that MSW is domestic solid waste in urban zones that are specified in National Resolution No. 1210/2016/UBTVQH13 on urban classification [16]. Among the generated sources of MSW, households and apartments count for more than 70% of the total waste volume. Waste composition and characteristics from this source are more complicated than other sources due to the features of human living. In addition, HSW is discharged in a mixed way from every household without awareness of the value of separate materials, and households do not care about how it is disposed of after discharging. On the other hand, other generated sources such as commercial centers, restaurants, supermarkets, institutions, etc. have to pay higher fees for collecting waste under monthly contracts signed with authorized partners. Thus, they intend to separate recyclables to sell to gain revenue and reduce collection fees. Based on these definitions and expressions, this study’s scope focused on household and apartment waste sources (in short as household solid waste-HSW), which are still causing many difficulties for municipalities in terms of management.

2.1.1. MSW Collection and Transportation Process in Hanoi City

Due to the combination of various and interlaced transportation systems, especially in old quarter areas, the roads and alleys are small, thus Hanoi has different types of waste collection. Every day, waste from households and family-owned restaurants is discharged at a designated time and placed in 240 L to 360 L containers that are located in collecting points along streets and residential areas. In some places, waste is only put in front of houses or restaurants. After that, workers use hand carts to collect door to door up to the full capacity and then push them to the gathering point. One other collection method is applied in core areas of Hanoi using small trucks (less than 1 m3) to collect waste along big streets in working hours and big truck (three to five tons) to directly collect waste at designated places and times (from 8 p.m to 1 a.m). For the lanes and alleys, waste is collected by hand carts. Compactors are used to load waste from containers or hand carts at the collecting points. In 2020, Hanoi City put four transfer stations for four core districts into operation with a capacity from 100 to 300 tons. These are in the trial operation phase and show the effectiveness of waste collection at rush hours for some collecting points and reduce the environmental pollution in many places where waste is temporarily discharged. Finally, at waste gathering points or transfer stations, waste is loaded into large capacity compactors (eight to 12 tons) to move to the landfill site. The numbers from the authorities shows that only in core areas of Hanoi City are there more than 138 gathering points with more than 1000 waste bins.

2.1.2. MSW Cost and Revenue

The cost and revenue balance for domestic waste management is also a big issue in Hanoi. Collection and transportation cost accounts for 86.7% of total cost while the collected fees from residents and contracted services only cover 16% of the total revenue. The remaining costs are borne by the local government [17]. According to the Hanoi Urban Environment Company (URENCO), which is assigned to undertake almost all missions related to MSW in urban areas, where each household pays an average of 26,500 VND/month (USD 1.2). Compared with other countries in the same region, this rate is much lower and is not sufficient with the system [17].

2.1.3. Collected Amount and Collection Rate of MSW

According to the Department of Construction of Hanoi People’s Committee (DOC) and URENCO, the generated MSW amount in Hanoi is about 7200 tons/day, in which about 4000 tons are from the urban area (63%) while the population rate is less than 50% (46.6%). The amount of MSW that is collected and transported to the disposal areas is about 6280.6 tons, equal to 87% of total generation amount. In the urban areas, the collection rate is more than 80%. Particularly, at four core districts (Ba Dinh, Hoan Kiem, Hai Ba Trung, Dong Da), the collection rate is 100%, and 80–90% is for new districts such as Tay Ho, Cau Giay, Thanh Xuan, Hoang Mai, Long Bien, and Ha Dong.

2.2. Methods

A field study was conducted in five zones in Hanoi City, which were selected based on population density, a category representative for urbanization level under National Resolution No. 1210/2016/UBTVQH13 [16]. Following that, three zones (zone 1 to zone 3) are representative for core urban areas, zone 4 is a new urban area, and zone 5 is suburban and rural areas.
Based on the population density and average number of people per household, sample sizes and sampling points were proposed, as shown in Table 1. For each zone, based on the percentage of household scale, the number of samples was randomly selected, respectively. Twenty to 24 samples were selected in each zone and the total samples of five zones in this study was 109.
A global positioning system (GPS) device was used for tracking the location of targeted households. Sampling points for 109 collected samples are described in Figure 1.
From 25 February to 4 March 2021, waste discharged from targeted households was collected for seven consecutive days including weekends. The first day was for the preparation and distribution of different colored waste container bags with a survey code to households. Digital scales with a minimum of one gram (g) were used to record the weight of waste after collection from households at gathering points and inputted in the data sheet. Hand sorting was applied to separate HSW into twelve categories with details of each category defined in Table 2. The sampling activities are illustrated in Appendix A.

3. Results

3.1. Waste Generation Rate and Composition

The average generation of HSW in Hanoi City was 0.63 kg/person/day whereas the rate in urban areas was 0.62 kg/person/day, and in sub-urban and rural areas, it was 0.67 kg/person/day. The results in Table 3 show that the main portion of HSW was organic waste (78.95%) from the kitchen and garden waste. This was followed by plastic (7.4%), paper and cardboard (5.65%), metals (1.52%), and glass (1.18%). Nylon waste including thin plastic bags accounted for up to 4.79%. Other waste was 4.53% including burnable and non-burnable waste. There was also a small portion of hazardous waste mixed (0.004%) including batteries, lights, and medical waste, etc.
Waste components with their percentage and standard deviations are presented in Table 3. These results measure the dispersion of a dataset relative to its mean and is calculated as the square root of the variance. The highest standard deviation of the organic component means that the variance between the results of each sample to the mean is larger than the other components. The portion of hazardous waste in household waste is too small to calculate the equivalent standard deviation.

3.2. Comparison with Other Studies about MSW in Hanoi City and Vietnam

It is clear that in developing countries, the portion of organic waste is the highest and accounts for more than 50% of the total volume. In Vietnam, most studies have shown the same results. However, when comparing the results of this study with other studies and reports about SWM in Hanoi City, the portion of organic waste in this study was the highest. This was explained by targeted households that due to expansion of COVID-19, during the survey duration, Hanoi was locked down and most people ate at home for three meals a day instead of eating out for breakfast and lunch as per the normal custom of many people. Additionally, families in Hanoi helped the surrounding provinces such as Hai Duong, Hung Yen, etc. to consume a huge amount of fruits and vegetables, which cannot export to China as an impact of the pandemic.
Although Hanoi is the capital of Vietnam, there have not been many studies conducted on waste characteristics on a fully wide scale. Mai Huong et al. (2011) [19] and Kawai et al. (2007) [20] conducted a survey on 120 and 101 households, respectively, only in one district to carry out a physical composition analysis of the household waste and recyclable trend by collecting the samples directly. Another method was carried out at the landfill site where mean composition of MSW was specified by manual sorting over seven days in randomly selected transportation vehicles.
Other reports from the Ministry of Natural Resources and Environment (MONRE) (2019) [6] and the World Bank (WB) (2018) [17] collected data from local government departments in charge of solid waste management in Hanoi such as the DOC and Department of Natural Resources and Environment (DONRE). The portion of organic waste in the report of MONRE or WB and the study conducted at the landfill was lower than the remaining studies because the data of entire municipal solid waste including waste from commercial and institutional sources as well as waste collected from public areas and streets, not only from the household sources. Table 4 compares the results of recent studies on the waste characteristics of Hanoi City.
Compared with other studies that have determined the physical composition of MSW only from household sources conducted in other big cities of Vietnam such as Ho Chi Minh City, Hue City, Danang City, and Can Tho City, the organic portion from food waste and garden waste are the same with the result in this study as shown in Table 5. There is a high organic portion from household sources as waste is not separated at the source in Vietnam, which creates many difficulties for the local government to select proper technology in the effort to cut waste volume to the landfill.

3.3. Other Characteristics of HSW in Hanoi City in Specific and in Vietnam in General

The high organic portion from household sources because waste is not separated at the source in Vietnam has created many difficulties for the local government to select proper technology in the effort to cut waste volume to the landfill.
Nguyen et al. (2016) [21], through proximate analysis, determined the moisture content, volatile mater, ash content, and fixed carbon of MSW in Hanoi City and the results showed that the average of moisture content analysis was 52.2%, and the highest percentage of the moisture content (70.4%) was on food waste. Percentage of volatile content was relatively high in plastic (96%), paper (76%), and textiles, rubber, leather (65%). Food waste had the lowest volatile content (20%). The average volatile mater content was 30%. Ash content was mainly in metals, glass, and other waste coal (slag, soil, sand) as they are non-combustible. Percentage of the fixed carbon in waste materials such as textiles, rubber, and leather (11%) showed that this element requires a longer detention time on the surface of the furnace.
The elements of organic waste in MSW for bio transformation are given in Table 6 [25]. These indexes play an important role to ensure nutrition for microorganisms as well as requirements of bio transformation processes such as composting, methane, and ethanol production from MSW. Garden waste and food waste contain a high content of nitrogen, phosphorus, etc. with a major share in total waste volume. These factors of MSW suggest that the proper disposal technology for MSW in Hanoi City is biomass with energy recovery. This also requires that the organic portion from all sources should be sorted carefully to have a pure input source for this type of technology.
Combustible substances in HSW in Vietnam are analyzed in Table 7. From these physical compositions. by applying proximate or elemental analysis, the higher heating value (HHV) and lower heating value (LHV) can be defined. In Hanoi City, HHV were from 5.1 to 11 MJ/kg and LHW ranged between 1.2 to 4 MJ/kg [21]. The CCET guideline series on intermediate municipal solid waste treatment technologies: Waste-to-Energy Incineration also provides the results of a calorific value of MSW in Hanoi and Ho Chi Minh City from 3.352 KJ/kg to 6.285 KJ/kg [26]. Within this range, the application of incineration technology for MSW in Hanoi City with the option of with or without energy recovery depends on the amount of input waste and investment factors. It is discussed that organic composition with high moisture content should be sorted out of combustible fraction to have a higher effectiveness for incineration.

4. Conclusions

This study found that household solid waste generation rate in Hanoi City was on average 2.35 kg/household/day and 0.67 kg/person/day. Household waste accounts for 70% of total waste generated across the whole city. Organics from the kitchen and garden form the largest portion in physical composition of household waste (78.9%). This rate was higher than that in other studies conducted in Hanoi City, but in the same range with other studies in different provinces and cities in Vietnam such as Ho Chi Minh City, Danang, Hue, and Can Tho. Recyclable waste accounted for about 15% and this could be recovered as either materials or energy, if we introduce a proper recycling scheme.
Other sources of municipal solid waste such as offices, restaurants, hotels, commercial areas, open markets, supermarkets, clinics, education entities, and public areas were not included in this study. While wastes from these sources have higher potential for organic waste and recyclables recovery, they are not properly sorted at the source yet. These wastes are currently collected and disposed mixed with household wastes.
The results of the study also highlight the importance of introducing alternative intermediate treatment options to deal with the high volume of organic waste such as biogas or composting, and converting waste into resources to reduce the burden for landfill and environmental impacts. It also suggests introducing a source separation at source program on a wide scale to obtain a higher quality of waste characteristics such as moisture, calorific value, etc. to easily select a suitable treatment technology.
In general, the study results provided important information on waste management systems that define the waste generation rate and physical composition from household sources. This is a basis to determine other relevant factors for the whole MSW system. Policy makers will find this useful to develop a master plan and detailed plan for the collection, transportation system, and disposal facility. One of the limitations of the study is that the sampling was conducted in one month only and this may miss some seasonal variations in waste generation. It does not cover all the influencing factors of solid waste composition and generation rate from households. Therefore, in future works, it is recommended that research is conducted on a larger scale and other generated sources by both quantitative and qualitative methods.

Author Contributions

N.T.L.P. conceived and designed the study. N.T.L.P. and H.Y. conducted the research analysis, evaluation, and wrote the paper. H.Y. and T.M. advised throughout the research process. All authors have read and agreed to the published version of the manuscript.

Funding

No external funding was obtained for this research.

Data Availability Statement

All data are reported in this work.

Conflicts of Interest

The authors declare no conflict of interest.

Appendix A

Figure A1. Waste sampling and analysis images.
Earth 02 00062 g0a1

Appendix B

Figure A2. Detailed waste components for each sampling point.
Earth 02 00062 g0a2

References

  1. Ministry of Environment of Japan. Municipal Solid Waste Emissions and Disposal in FY2019. 2021. Available online: https://www.env.go.jp/press/files/en/884.pdf, (accessed on 10 August 2021).
  2. Singapore NEA. Waste Statistics and Overall Recycling. Singapore National Environment Agency, 2018. Available online: https://www.nea.gov.sg/our-services/waste-management/waste-statistics-and-overall-recycling (accessed on 12 August 2021).
  3. Hara, K.; Yabar, H. Historical evolution and development of waste management and recycling systems-analysis of Japan’s experiences. J. Environ. Stud. Sci. 2012, 2, 296–307. [Google Scholar] [CrossRef]
  4. Ikhlayel, M.; Higano, Y.; Yabar, H.; Mizunoya, T. Introducing an integrated municipal solid waste management system: Assessment in Jordan. J. Sustain. Dev. 2016, 9, 43–53. [Google Scholar] [CrossRef]
  5. Singh, R.K.; Yabar, H.; Mizunoya, T.; Higano, Y.; Rakwal, R. Potential benefits of introducing integrated solid waste management approach in developing countries: A case study in Kathmandu city. J. Sustain. Dev. 2014, 7, 70–83. [Google Scholar] [CrossRef] [Green Version]
  6. Young, G.C. Municipal Solid Waste to Energy Conversion Processes; Wiley: Hoboken, NJ, USA, 2010; ISBN 978-0-470-53967-5. [Google Scholar]
  7. Sipla Kaza, L.Y. What a Waste 2.0 A Global Snapshot of Solid Waste Management to 2050; World Bank Publications: Herndon, VA, USA, 2018. [Google Scholar] [CrossRef]
  8. Ministry of Natural Resources and Environment of Vietnam. State of National Environment—Household Waste Management; Ministry of Natural Resources and Environment of Vietnam: Ha Noi, Vietnam, 2020.
  9. Ministry of Construction of Vietnam. QCVN 07/2010/BXD; Ministry of Construction of Vietnam: Ha Noi, Vietnam, 2010.
  10. Wada, H. Proposal on the Legal Documents for Estimation of Waste Amount; Vietnam Waste Project: Hanoi, Vietnam, 2015. [Google Scholar]
  11. Dang Anh Thu, M.A. General Overview of Solid Waste Management in Vietnam. Available online: https://www.env.go.jp/recycle/circul/venous_industry/pdf/env/h27/11_2.pdf (accessed on 12 December 2020).
  12. General Statistics Office. Completed Results of the 2019 Vietnam Population and Housing Census; Statistics Publishing House: Ha Noi, Vietnam, 2019. [Google Scholar]
  13. Hanoi Statistics Office. Population and Labor of Hanoi; Hanoi Statistics Office: Ha Noi, Vietnam, 2018; pp. 43–108. [Google Scholar]
  14. Hanoi Department of Construction. Progress Report of SWM Facility Development in Hanoi; Hanoi Department of Construction: Ha Noi, Vietnam, 2019. [Google Scholar]
  15. Ministry of Natural Resources and Environment of Vietnam. Decree No. 09/VBHN-BTNMT; Ministry of Natural Resources and Environment of Vietnam: Ha Noi, Vietnam, 2019.
  16. National Assembly Standing Committee. Resolution No.1210-2016-UBTVQH13; National Assembly Standing Committee: Ha Noi, Vietnam, 2016. [Google Scholar]
  17. World Bank. Assessment of Domestic Waste and Hazardous Industrial Waste Management. 2018. Available online: http://documents1.worldbank.org/curated/en/504821559676898971/pdf/Solid-and-industrial-hazardous-waste-management-assessment-options-and-actions-areas.pdf (accessed on 24 June 2020).
  18. Hanoi Statistics Office. Population Investigation in Hanoi City; Hanoi Statistics Office: Ha Noi, Vietnam, 2019. [Google Scholar]
  19. Huong, L.T.M.; Kawai, K.; Thai, N.T.K. Physical Composition Analysis of Household Waste in Hanoi, Vietnam. 2012. Available online: http://www.gels.okayama-u.ac.jp/management/up_load_files/gakkan/2012_en/2012_en_3-14.pdf (accessed on 12 April 2021).
  20. Kawai, K.; Nguyen, T.K.; Matsui, S. Physical Compositions of Municipal Solid Waste and Recyclable Waste Discharged from Households in Hanoi, Vietnam. 2007. Available online: https://ir.library.osaka-u.ac.jp/ (accessed on 10 August 2020).
  21. Nguyen, N.T.T. Determination of the Municipal Solid Waste Characteristics of Hanoi City, Vietnam Nguyen. Notes Queries 1989, 36, 423. [Google Scholar] [CrossRef]
  22. Thanh, N.P.; Matsui, Y.; Fujiwara, T. Household solid waste generation and characteristic in a Mekong Delta city, Vietnam. J. Environ. Manag. 2010, 91, 2307–2321. [Google Scholar] [CrossRef] [PubMed]
  23. Otoma, S.; Hoang, H.; Hong, H.; Miyazaki, I.; Diaz, R. A survey on municipal solid waste and residents’ awareness in Da Nang city, Vietnam. J. Mater. Cycles Waste Manag. 2013, 15, 187–194. [Google Scholar] [CrossRef]
  24. Trang, D.T.T.; Matsui, Y.; Thanh, N.P.; Yen, N.T.M. Household Waste Generation and Relevant Factors in Hue City, Vietnam. In Proceedings of the 22nd Annual Conference of Japan Society of Material Cycles and Waste Management, Tokyo, Japan, 3–5 November 2011; Volume 22, pp. 1–2. [Google Scholar]
  25. Dieu, T.T.M.; Viet, N.T. Chapter 2. Generated Sources, Characteristics of Domestic Waste. 2012. Available online: http://www.gree-vn.com/tai-lieu-moi-truong (accessed on 20 August 2020).
  26. Kawai, K.; Liu, C.; Gamaralalage, P.J.D. CCET Guideline Series on Intermediate Municipal Solid Waste Treatment Technologies; United Nations Environment Programme: Nairobi, Kenya, 2020. [Google Scholar]
Figure 1. Location of sampling points.
Earth 02 00062 g001
Table 1. Number of samples in specified areas.
YearAverage No. of Person/HouseholdPercentage in Household Scale (%) [18]
As of 1 April 20193.501 person2 persons3–4 persons5–6 persons>7 persons
11.2017.6047.3020.303.60
Total number samples (sample)81952255
Zone 1 (Code A1) (Dong Da District)231050
Zone 2 (Code A2) (Hai Ba Trung/Thanh Xuan District)141151
Zone 3 (Code A3) (Ba Dinh/Cau Giay/Hoan Kiem District)231252
Zone 4 (Code A4) (Ha Dong/Bac Tu Liem/Thanh Tri District)25861
Zone 5 (Code A5) (Thuong Tin/Long Bien/Hoai Duc District)141141
Table 2. Description of HW categories and sub-categories.
No.CategoryDetail
1Food wastes (organic)Yard waste, food waste, leftovers and expired foods, straw, grass, plant leaves, flowers of all kinds, paper towels of all kinds that are easy to decompose, wood ash, rice husk ash.
2Paper and cardboardMixed paper, computer printout, newsprint, corrugate board.
3PlasticPET bottle, HDPE bottle, film, foam plastic packaging, etc.
4MetalsCan, metal packing, non-packing metal, aluminum, iron, ferrous metal, non-ferrous metal.
5RubberTires, shoes.
6NylonThin plastic bags.
7GlassBeer bottles, soft drinks, food bottles, glasses, broken glass, etc.
8CeramicsVase, decorations, kitchen wares.
9WoodCabinets, tables, chairs, materials made of bamboo (bamboo basket, bamboo basket, bamboo basket, bamboo tube, bamboo tree).
10FabricCloth, scrap, towel, etc.
11Hazardous wasteHazardous household waste (battery, light, etc.), medical waste, small chemical waste.
12OthersSoil, sand, dust from sweeping, house cleaning, planting soil, knife, blade, scissors, coal ash, coconut shell, durian shell, diapers, etc.
Table 3. Household solid waste composition in Hanoi City.
No.Waste CompositionPercentage (%)Standard Deviation
1Organic waste78.951.22
2Paper and cardboard5.650.12
3Plastic2.60.09
4Metals1.520.10
5Rubber0.120.03
6Nylon4.790.12
7Glass1.180.16
8Ceramics0.310.30
9Wood0.050.01
10Fabric0.290.04
11Hazardous0.004-
12Other waste4.530.25
Note: This table was calculated from 109 samples. Appendix B includes the details of every sample.
Table 4. Comparison of HSW composition among studies and reports.
No.Composition of HSW in Hanoi CityThis Study (2021)National Environmental Report (2019) [8]World Bank (2018) [17]Nguyen T.T.N (2016) [21]Huong L.T.M (2011) [19]Kosuke Kawai (2007) [20]
1Organic waste78.9551.951.948.861.764.5
2Paper and cardboard5.652.72.785.99.9
3Plastic2.63313.68.68.3
4Metals1.520.90.91.20.90.4
5Rubber and leather0.121.31.3 0.50.3
6Nylon4.79-----
7Glass1.180.50.52.12.40.7
8Ceramics0.31---0.60.7
9Wood0.05--2-0.9
10Fabric and textiles0.291.61.681.21.3
11Battery0.004-----
12Other waste4.53383815.81812.9
Table 5. Comparison of organic portion in other studies.
CityOrganic Portion (%)Source of ReferenceSample Size
Hanoi City79.0%This study109
Can Tho City84.0%Nguyen Phuc Thanh et al. [22]100
Da Nang City72.4%Suehiro Otoma et al. [23]50
Hue City80.55%Do Thi Thu Trang et al. [24]150
Ho Chi Minh City80.9–90%Dieu T.M. Tran et al. [25]90
Table 6. Element of organic waste in MSW for bio transformation in Vietnam (Source: Dieu T.M. Tran, [25].
IndicatorUnitInput Material (Dry Volume Base)
NewspaperOther PaperGarden WasteFood Waste
NH4-Nppm461149205.0
NO3-Nppm42184904278.0
Pppm4429535004900.0
PO4-Pppm2016422103200.0
K%0.350.292.274.2
SO4-Pppm159324882855.0
Ca%0.010.10.420.4
Mg%0.020.040.210.2
Na%0.741.050.060.2
Bppm14288817.0
Seppm−22-<1<1
Znppm491772021.0
Mnppm57155620.0
Feppm1239645148.0
Cuppm 147.76.9
Coppm 53.0
Moppm 1<1
Nippm 94.5
Wppm 43.3
Table 7. Combustible substances in HSW in Vietnam. Source: Dieu. T.M. Tran [25].
CompositionPercentage in Dry Volume (%)
CarbonHydroOxygenNitrogenSulfurAsh
Food waste486.437.62.60.45.0
Paper43.56440.30.26.0
Carton445.944.60.30.25.0
Plastic607.222.8--10.0
Textile556.631.24.60.22.5
Rubber7810-2.0-10.0
Leather60811.610.00.410.0
Garden waste47.86383.40.34.5
Wood49.5642.70.20.11.5
In-organic
Glass0.50.10.4<0.1-98.9
Metal4.50.64.3<0.1-90.5
Bottom and fly ash26.3320.50.268.0
Publisher’s Note: MDPI stays neutral with regard to jurisdictional claims in published maps and institutional affiliations.

