1. Introduction
Each year, disasters cause significant human and economic losses. Out of these disasters, earthquakes are one of the most catastrophic natural phenomena. These events have caused more than 23 million deaths between 1902 and 2011 [
1], substantial physical, social, economic [
2] and, occasionally, institutional, cultural and environmental losses. Following an earthquake, there is a substantial demand and need for spatial information [
1,
2] about population location [
3], evacuation routes, availability of resources [
4], size of the affected area and distribution of damage. Later, during the emergency phase, it is necessary to collect more detailed data about damages in the structural components of buildings [
5].
Earthquake reconnaissance enables collecting perishable data on building performance to prepare statistics, calibrate and validate engineering models, and identify the construction deficiencies that lead to inadequate structural performance. This paper aims to identify state-of-the-art data sources for building damage assessment and serve as a guide to make more efficient data collection based on the experiences in the last years. Damage is understood as a change in the mechanical, material and/or geometric properties of a building, affecting its performance and behaviour [
6]. Damage data is highly ‘perishable’, or ephemeral, since damaged structures may be altered or removed during rescue or early recovery [
7] activities [
8] or modified by aftershocks. A large earthquake produces extensive building damage and affects the operational conditions of other structures [
9] in and around an urban area [
10]. Additionally, economic and social consequences are usually related to the loss of buildings’ usability [
11,
12]. Buildings are essential places to live [
13], do business or carry out activities [
14]; this is why most of the losses [
15] and 75% of the casualties [
16] in disasters are due to building damage [
15]. Building damage assessment is a critical activity to secure the safety of the public [
5] and provide information for disaster relief, early recovery planning [
10] and later reconstruction [
17,
18,
19], especially due to the threat of aftershocks. Moreover, damage assessment is essential for assessing disasters’ social and economic impact [
18,
19,
20]. The effectiveness of post-disaster activities during the response and recovery phases depends on accurate and early damage estimation [
21].
In the past, conventional recording and measurement tools, such as photography, note-taking and surveying, were used by reconnaissance investigators to collect data and document field observations. Nowadays, the availability of state-of-the-art instrumentation, mobile data collection technologies, social media (SM), crowdsourcing platforms, training and field support services has increased the ability of field investigation teams to capture perishable data during post-disaster phases [
8]. Currently, there are two data sources in the disaster management cycle: sensor-generated, such as the data collected by remotes sensing (RS) tools, closed-circuit television videos (CCTV) or satellites, and user-generated content collected from SM and crowdsourcing platforms [
22,
23]. Quantitative assessment of damage determines the physical damage of the exposed elements in the affected area. The result of the damage assessment will be the aggregate quantities of damages for an exposure unit. This quantitative assessment is used to assess the direct economic loss as the basis for calculating the value of economic losses: the replacement cost [
18] or insurance payouts of value to international aid organisations, bi-lateral/multilateral donors and the insurance industry [
24]. During the emergency or relief phase, the quantitative assessment of damage starts with the structural component of the buildings due to its essential role in the safety of the population affected by earthquakes and the estimation of temporary shelter needed [
7]. Structural damage evaluation implies a visual inspection to establish whether the building structure components are damaged, the degree to which different elements may be damaged and the degree of damage that represents a risk to the occupants of the building. These data are necessary for understanding the trend of natural disaster impacts and existing planning and building practices [
25]. Earthquake reconnaissance enables collecting perishable data on building performance to prepare statistics, calibrate and validate engineering models and identify the construction deficiencies that lead to inadequate structural performance [
26]. Damage detection and characterization involve five closely related subjects [
9], i.e., structural health monitoring (SHM), condition monitoring (CM), non-destructive evaluation (NDE), statistical process control (SPC) and damage prognosis (DP) [
6].
This paper is divided into five sections. The introduction includes a brief background on the topic of earthquake reconnaissance and data sources over time. The second section, on methods, elaborates on the criteria for selecting the articles that comprise the literature review. The third section focuses on the results, including the data sources identified through the literature review. The fourth section discusses the interaction of data sources identified, and the fifth section contains the conclusions.
2. Methods
A literature review was conducted to identify state-of-the-art data sources for earthquake reconnaissance. Peer-reviewed research articles included in this literature review were identified from the Web of Science and in the framework of the project Learning from Earthquakes United Kingdom (LfE-UK), a joint project which started in 2017 and will finish in 2022. The LfE-UK project was undertaken jointly by Newcastle University, the University College of London (UCL) and Cambridge University. This paper aims to identify state-of-the-art data sources for building damage assessment and provide guidance for more efficient data collection. In 2019, this review was planned as a systematic review; however, only using the keywords ‘earthquakes’ AND ’damage’ excluded important references about innovative data sources, methods and tools for collecting building damage data employed in other natural phenomena, such as hurricanes. The result of the search using these two keywords was 34 references, which were reviewed. In 2021, we revisited the data sources, methods and tools identified in the first literature review to focus only on those references relevant to earthquake reconnaissance and/or addressed during the LfE-UK project. We then combined the keywords ‘earthquake reconnaissance’ and each of the data sources identified in the first literature review: fieldwork or ground surveys, omnidirectional imagery (OD), terrestrial laser scanning (TLS), satellite images, unmanned aerial vehicles (UAVs), light detection and ranging (LiDAR), high-resolution synthetic aperture radar (SAR), interferometric synthetic-aperture radar (InSAR), real aperture radar (RAR) and social media (SM) platforms to identify new references. The flow diagram of the methodology applied is depicted in
Figure 1. The grey block contains the project framework, blue blocks the parameters, and red contains the number of references reviewed.
The references were identified from the Web of Science in both literature reviews because we consider it the most comprehensive curated database available. While we reviewed and included the references published in 2014 and 2015 that were identified in the first literature review, we have not counted them because we aim to highlight the state-of-the-art (last five years). The search was conducted between February 2019 and June 2021. In the literature review undertaken at the beginning of the project, we reviewed references published between 2014 and 2019. At the end of the project, we reviewed references published between 2016 to 2021. Eventually, this literature review included references published between 2014 and 2021 or the last seven years. According to their relevance, older references were reviewed only when referred to by the authors of identified references; however, we have not counted them among the total number of references reviewed because we want to highlight only the most contemporary data sources. The final result, including the last search, was 39 references. Although the main focus was data sources for earthquake reconnaissance, data sources for damages assessment after other natural phenomena or anthropogenic events were reviewed but not counted in the review.
3. Results
This paper reviews more than 39 articles that indicate the sources used by different authors to collect data related to damages and post-disaster recovery progress after earthquakes between 2014 and 2021. The data collection sources and methods identified in our literature review have been grouped into seven categories: fieldwork or ground surveys, OD, TLS, RS, crowdsourcing and SM platforms, and CCTV. In the case of RS, we identified six sources: satellite images, unmanned aerial vehicles (UAVs) and small unmanned aerial vehicles (sUAV), light detection and ranging (LiDAR), high-resolution synthetic aperture radar (SAR), interferometric synthetic-aperture radar (InSAR) and real aperture radar (RAR). We identified seven crowdsourcing platforms (alphabetical order): Did You Feel It? (DYFI), Earthquake Network, LastQuake, MyShake, Raspberry Shake, QuickDeform and the Taiwan Scientific Earthquake Reporting (TSER) System. We identified three SM platforms as data sources for earthquake reconnaissance (alphabetical order): Earthquake Network, Facebook and Twitter. The schematic graph of the sources identified is depicted in
Figure 2, and the summary of the references reviewed is listed in
Table 1.
Missions deployed, or missions that have had their results published during the period covered by this literature review, are Albania [
38,
48], Puerto Rico [
36,
37], Mayotte [
43], Mexico [
27,
49,
50], Palu–North Sulawesi (Indonesia), Hualien (China) [
42], central Italy [
28], Muisne (Ecuador) [
28], Nepal [
15,
39], Napa—California (USA) [
45,
51], Haiti [
10] and L’Aquila (Italy) [
12,
30]. The location of major earthquakes epicentres from 2014–2019 included as case studies in this literature review is depicted in
Figure 3.
3.1. Fieldwork or Ground Surveys
Post-disaster structural damage assessment is typically based on ground surveying methods [
21]. The objective of these missions is to learn about the performance of infrastructure and structures under seismic loading, collect accurate damage data [
28] for further research [
49] and scientific understanding of their physical, socio-economic, environmental [
8], cultural and institutional consequences. In situ structural observations sometimes include records not limited to the mechanism of structural failure and observations of undamaged structures and the extent and scale of damage to structures at a global and component level [
28]. To develop a detailed building damage map after an earthquake or a hurricane, it is necessary to identify the damage using a building-by-building approach [
10,
44]; most building damage assessments reviewed relied on a foot-on-ground approach [
52]. This detailed inspection is the most reliable [
21] and generates invaluable information on the seismic performance of the affected building stock [
53]. However, the limited time the mission is deployed and the street level constraints on the extent of observations make it less reliable at collating damage statistics, which are particularly important for validating and developing fragility and vulnerability functions [
28].
Fieldwork or ground surveys are a traditional approach to estimating the spatial distribution of earthquake impacts to building clusters, performed by volunteer groups consisting of structural engineers, architects, researchers with experience in building instrumentation, geotechnical and seismological specialists [
49] and undergraduate students of these fields. These missions collect structural, geotechnical, seismological and damage information [
49]. Earthquake reconnaissance missions are undertaken by national or international organisations such as the Earthquake Engineering Field Investigation Team (EEFIT) [
8,
26] in the United Kingdom (UK), the Geotechnical Extreme Events Reconnaissance Association (GEER) [
8,
26,
54] and the Earthquake Engineering Research Institute (EERI) [
8] in the United States (US). The EERI, through its program, Learning from Earthquakes (LFE) established in 1973, was the first professional organization to organize reconnaissance missions to significant seismic events. This organization recently has formed a virtual earthquake reconnaissance team (VERT) to conduct ‘virtual’ (i.e., not on-site) assessment within 48 h after an earthquake [
8]. In Italy, the European Centre for Training and Research in Earthquake Engineering (EUCENTRE) and the Italian Network of University Laboratories for Earthquake Engineering (ReLUIS) have organized earthquake reconnaissance missions and conducted follow-on seismic policy analyses. For six decades, the New Zealand Society for Earthquake Engineering (NZSEE) has supported reconnaissance research of earthquakes and major tsunamis in the world [
8]. The Asian Technical Committee (ATC3) “Geotechnology for Natural Hazards”, the Building Research Institute of Japan and the Nepalese Engineering Society have conducted reconnaissance missions in Asia after natural phenomena. Another organization that has supported reconnaissance missions in the US is the American Society of Civil Engineers (ASCE). Additionally, sometimes, self-organized teams with a focused hypothesis-driven research question or inquiry are formed to collect data [
8]. In the 2017 Puebla–Morelos earthquake case, also known as the 2017 Puebla earthquake or the 2017 Mexico earthquake, the Applied Technology Council (ATC) from the US deployed a team to Mexico City sponsored by the ATC Endowment Fund. This team was joined by practising architects, engineers, professors and local agencies [
49]. The NZSEE, in collaboration with the Universidad Autonoma de Metropolitana (UAM) Azcapotzalco, the American Concrete Institute (ACI) Disaster Reconnaissance team, the Colegio de Ingenieros Civiles de Mexico (CICM) and the team of Stanford University’s John A. Blume Earthquake Engineering Center [
27] all deployed a team for the same earthquake in Mexico [
50].
In a foot-on-ground survey, as it is portrayed in
Figure 4, the assessment is conducted manually [
55], one building after another [
25]; each reconnaissance mission in the field takes approximately one week. Considering that, there is a preliminary data collection to limit the inspection area where the causes of failures of buildings can be observed within a safe environment. Earthquake reconnaissance missions’ members are usually trained volunteers affiliated with one of the organisations mentioned previously, who cannot spend more than one week away from their daily business. Even the ATC’s reconnaissance mission after the 2017 Puebla–Morelos earthquake lasted only three days [
49]. To maximize the area to inspect, three teams composed of three to four structural engineers were deployed each day in this specific mission. Each team involved one Spanish speaker to interact with residents and one local structural engineer [
49]. Usually, preliminary data collection before fieldwork includes seismic information, size of the affected area, building typologies, injuries and casualties, local institutions, accessibility, safety and security aspects, local traditions and any information supporting the fieldwork planning [
56]. Traditionally, paper forms were used, but increasingly, smart technologies are used, such as tools to complete investigation forms and collect multi-media data (e.g., photos, audios and videos) [
55]. One example was the damage assessment app used by the EEFIT mission team deployed to Albania to collect damage data after the earthquake in 2019 [
48]. The ATC reconnaissance mission for the 2017 Puebla–Morelos earthquake focused on buildings with not only significant but also minimal damage. No inspections were undertaken on collapsed buildings, considering that those buildings do not suggest where or why the failures occurred [
49]. This ATC’s reconnaissance mission collected damage and geotechnical data, earthquake ground motions from several suites and ambient vibration recordings from buildings instrumented by the team during the reconnaissance trip [
49]. This ATC mission instrumented seven of the inspected buildings with an array of accelerometers [
49]. The NZSEE and UAM team focused on extensive and widespread damage where local site effects could have contributed to the significant damage in buildings. At the same time, the team evaluated the performance of the repaired and retrofitted buildings after the 1985 Michoacán earthquake [
50]. Stanford’s John A. Blume Earthquake Engineering Center surveyed the affected area in Mexico on 24–29 September. It complemented the database of collapsed buildings with data collected from newspapers and SM until 1 November 2017 [
27].
The GEER deployed two teams in central Italy. The first team, integrated entirely by Italians, located potential landslide sites of interest. Later, a second team was deployed to collect data in the places identified by the first team [
56]. Manual inspection and documentation of landslides were done by the GEER team in central Italy using standard geologist’s tools: scale, measuring tape, clinometer, compass, rock hammers and total station. Key landslide dimensions were measured on each manually inspected point, i.e., length, wide, scarp height and slope inclination [
56]. Notes were taken about the slide mass or rockfall constituent materials, local geology, observed groundwater and seepage conditions and anthropogenic activity in the area. The width and height of the rockfall source were measured using total stations, while slope inclination below the rock source was either estimated or measured [
56]. The geologic hammer was utilized to infer the rock strength. Stratification, weathering, spacing, joint width and infill material were evaluated. Distances were estimated for most rockfalls, given that lateral and vertical distances of the rollout were too large to measure manually. Boulder fragments were inspected with measurements of boulder size [
56]. Parallel to the GEER mission, and with its support during the planning phase and the support of the Italian Department of Civil Protection (DPC by its acronym in Italian), EERI, EUCENTRE and ReLuis also deployed a mission in central Italy to study the effects of the earthquake sequence, not only on the built environment but also on the communities located in the affected areas. Another objective was to assess the retrofitting methodologies and evaluate their effectiveness in mitigating the damaging effects of ground shaking [
58]. These three organizations also deployed two missions. The first mission was deployed following the 2016 Amatrice earthquake, and the second mission after the earthquake sequence in 2017 when it was considered safe to enter the restricted zones [
58]. The mission teams were formed by engineers with expertise in lifelines and structures focused on bridges and buildings. Besides engineering aspects, the mission collected data related to emergency management and the performance of critical infrastructures (CI) such as hospitals and schools [
58].
3.2. Omnidirectional Imagery (OD)
The outcomes of the fieldwork or ground surveys can be improved by the unique viewpoints and perspectives delivered by the OD camera technology. Employing OD cameras enables the collection of chains of omnidirectional images. The development of online platforms to host the collected images makes it possible for those photo chains to be easily visualized to simulate an immersive ‘walk through’ of a landscape with a 360 degree view, ideal for comprehensive damage inspections in reduced access zones [
28]. One example of the visualisation obtained with this technology is presented in
Figure 5.
Previous studies have reported an acceptable level of accuracy of virtual surveys compared to street surveys [
28,
60,
61]. Chains of OD images could be utilized to increase sample sizes by improving statistical structural damage data, allowing robust sampling techniques to be used across an area impacted by an earthquake [
28]. EEFIT tested this data source in two different post-earthquake contexts: the 2016 Muisne earthquake in Ecuador and the 2016 earthquake in central Italy. In both cases, the same camera equipment was used: a Ricoh Theta S. The imagery was visualized employing the Mapillary platform to assess construction typologies, number of stories and degree of damage [
28]. The context of the two EEFIT missions is different in the scale of the damage, the buildings affected, the urban context, the local topography and the earthquake’s characteristics.
In the 2016 Muisne earthquake in Ecuador, damage data collected through a series of rapid visual surveys (RVS) conducted in the field were compared to the data collected virtually along the same routes using chains of OD images. This mission validated the utilization of OD imagery with RVS data to compare virtual surveys, later using OD imagery on the damage data extracted from satellite imagery [
28]. In 2016 in central Italy, the work was focused on testing OD imagery’s ability, collected during the walk-through, to better understand damage regarding the damage maps provided by the European Copernicus Emergency Management Service. These maps were delineated based on the timely geospatial information derived from RS and completed with available open data sources in situ for emergency response [
28].
3.3. Terrestrial Laser Scanning (TLS)
Detailed structural and geotechnical surveys can be performed to obtain high-resolution digital elevation models (DEM) using TLS [
8]. This method managed to capture the entire geometry of the Baptistery of San Giovanni in Florence, Italy, with the level of detail required to identify and measure cracks (see
Figure 6), settlement, displacement, missing mosaic tiles and other types of damages [
29]. This data collection method uses a scanner that reflects a laser off a rotating mirror to acquire a sphere of measurements from one central point of view. Terrestrial laser scanning uses a time of flight measurement technique that calculates distance based on the time it takes for the laser to return from a surface or by a phase shift method that compares the emitted and received phases of the laser [
29,
62]. TLS provides accurate 3D geometry with millimetres [
63] and range, reducing the effort involved in measuring and post-processing [
64]. The laser scanner integrates a global positioning system (GPS) and correlates individual scans in post-processing, making it suitable for surveying-based damage assessment. Another technique for a detailed survey is Structure from Motion (SfM); this photogrammetric technique uses two-dimensional images taken from multiple viewpoints to compute a 3D representation of the scene being surveyed. Both TLS and SfM are line-of-sight (LOS) techniques, which means that the device only records measurements from the first surface it sees and nothing beyond that. In the case of 3D environments, multiple imaging positions are therefore required to perform a complete digital 3D representation [
29].
3.4. Remote Sensing (RS)
The building-by-building inspection may not be possible in areas with significantly damaged structures. Therefore, it is necessary to consider alternative contactless, non-invasive RS techniques and means to safely inspect and report affected buildings’ operative conditions and structural health [
9] and do this over a wide area. Imaging technology has increased rapidly as data gathering tools boost mission capabilities and ensure safe deployment in areas affected by earthquakes [
28]. For about the last decade, high-resolution optical satellite and aerial images have been increasingly used for a rapid building-damage survey after an earthquake [
24]; they have become an important tool for rapid and reliable structural damage assessment (SDA) [
21]. We identified in our literature review six RS data sources used for earthquake reconnaissance. Those sources are satellite images, UAVs, sUAV, LiDAR, high-resolution synthetic aperture radar (SAR) and InSAR. The RS data sources are organized below according to the complexity to extract and process the data collected.
3.4.1. Satellite Images
Aerial photography was the source of damage data used to estimate the size of the impact area quickly before the availability of very high resolution (VHR) satellite images. The spatial extent of building damage after earthquakes can be detected by combining pre and post-disaster very high spatial resolution (VHR) satellite images, such as QuickBird [
30]. Images are compared for change detection (CD) [
31] using approaches such as Pixel or object-based image analysis (OBIA) and visual or manual interpretation with the support of geographic information systems (GIS) software [
18,
30]. Damages to buildings are detected according to changes detected in relational (borders), spectral (ratio, mean, Gray Level Co-occurrence Matrix1-GLCM texture, brightness), and spatial (compactness, volume, shape) features [
30]. A heat map based on buildings changes location between 2009 and 2011, following the earthquake in L’Aquila, is depicted in
Figure 7. Very high-resolution satellite images can also be used to reference historical data compared with VHR images acquired by UAVs for CD [
31]. Satellite imagery accurately captures the higher damage levels However, it is coarser in capturing lower damage degrees due to technical limitations of the distance and the atmospheric conditions when an image is captured and the satellite optical radius, affecting levels of the output accuracy. Then, in building damage assessment, further data is required, given that the level of detail provided by satellite images is not satisfactory [
28]. Satellite images are also valuable for generating accurate digital elevation models (DEM) [
54], which are later used to detect and monitor ground and structural deformations [
30].
3.4.2. Unmanned Aerial Vehicles (UAVs) and Small Unmanned Aerial Vehicles (sUAV)
After earthquakes, overflights with aeroplanes and helicopters are initially done to identify the extent of the affected area. However, a new source of post-disaster aerial data has matured with UAVs [
8,
21]. This method can be effectively used to acquire images of a target region quickly. It is even more effective when the UAV images are sent immediately for processing to an operational ground control station. The spectral information is a crucial aspect of the change detection problem under study, depending on the sensor loaded on the UAV platform and less on the reference image that can be selected later to be compared to the images produced by the UAV sensor [
31]. UAVs capture multi-perspective high-resolution imagery, are easy to transport, deploy and fly, can easily access destroyed areas and are more cost-effective than traditional airborne approaches [
31,
32]. The GEER mission for the central Italy case selected UAVs as one of the principal data collection tools to take images for assessing potential landslides based on their portability, rapidity in data collection and superior field of view [
56].
The GEER team utilised three UAV platforms, two commercial off-the-shelf (COTS) UAV platforms and one customized/modified for aerial photography: DJI Phantom 4, Sensefly eBee, and Align TRex 800e, respectively [
56]. The first UAV platform was employed to collect high-resolution imagery from a sloped or vertical surface, where vertical control was required. The second UAV platform captured nadir images of places over large areas, given their superior speed and flight endurance. The third platform was employed in only one location, considering constant heavy winds in that specific place. The onboard camera of the UAV is the governing factor that determines the quality of the data collected. Speed and altitude can be adjusted mid-flight, while minimal adjustments can be made for improving camera performance. Digital single-lens reflex (DSLR) or DSLR-equivalent cameras are chosen over point-and-shoot cameras, but they require larger UAV platforms to carry them [
56].
Automated sUAV (0.6 kg of platform weight) acquired images of damages in the mountain village of Pescara del Tronto after the earthquake in 2016. Later, automated sUAVs were also used to collect images of the progress of the reconstruction efforts in 2018 [
65]. The imagery data was used for 3D reconstruction using SfM. The sequential 3D reconstructed models enabled building identification, movement detection, volumetric measurements and document recovery progress [
65]. The 3D models were developed using Bentley
TM ContextCapture. This software establishes the 3D point locations in a scene using camera metadata and GPS. The photos contain the data utilized to calculate inter-spatial intersections [
65]. A view-planning algorithm delineated optimized angles and photo locations through ‘greedy heuristics’ to capture better orthogonal views of Pescara del Tronto and solve the drawbacks of the nadir grid approach. This view-planning algorithm identifies the best sensor location for observing a site or an object by planning oblique images for optimized SfM [
65]. These computational tools together produce photogrammetric outcomes that look down vertically and at several oblique angles. In 2018, two new algorithms were applied to capture the images during the return mission: optimized view and flight path, which increased the completeness of the 3D models by providing additional oblique angles, allowing the generation of textured mesh models and dense point clouds. Automated sUAV enabled data collection on the city’s reconstruction, geotechnical background and the surrounding countryside [
65]. The advantages of utilising sUAV in earthquake reconnaissance are that it makes it unnecessary for the missions to enter damaged areas and, therefore, reduces the inspection time for data collection [
47]. They collect physical, social and economic data by looking at the number of urban facilities reopened after an earthquake and counting the number of pedestrians and vehicles in streets at specific hours and days in the week. One of the constraints to obtaining data through this source is the increasing regulation for the operation of UAVs and the rapidity with which these regulations are evolving. Nevertheless, UAVs’ valuable role for impact estimation after natural phenomena is acknowledged by most regulatory agencies, favouring the acquisition of the flight permit [
56].
3.4.3. Light Detection and Ranging (LiDAR)
The LiDAR approach has been used to estimate the damage after earthquakes [
66] and hurricanes [
8], along with other disasters. One approach consists of laser-generated point cloud data containing three-dimensional (3D) coordinate information and reflection intensity of a building, which are integrated into an algorithm used for the structural assessment using photogrammetric techniques [
66]. Another approach consists of a density-based algorithm to extract building clusters. Then, a cluster-matching algorithm is developed to match post-event and pre-event building clusters using multi-temporal datasets. Roof features involving changes in the area, volume, orientation and shape are identified as indicators of building damage [
67]. High-rise or median-rise buildings are relatively easy to detect in airborne point cloud data, as they have large footprints compared to residential homes [
67]. Although LiDAR is significantly slower than UAV-based inspections, it was still faster than manual inspection of large areas and its accuracy higher than UAV-based remote sensing [
56].
Detailed structural surveys can be done using terrestrial light detection, and LiDAR and the GEER team used it at landslide locations during the reconnaissance mission in central Italy [
56]. Light Detection and Ranging can cover large areas and be highly accurate, but shadows cast by changes in hillsides and slopes can block critical areas of view. In this case, additional surveys from alternative directions are necessary for fusing with a UAV-based SfM point cloud model [
56].
3.4.4. High-Resolution Synthetic Aperture Radar (SAR)
This technique is a sort of radar used to generate two-dimensional images or three-dimensional reconstructions of landscapes. To generate a SAR image, successive pulses of radio waves are sent to ‘illuminate’ a target, and the echo of each pulse is received and recorded. The pulses are transmitted, and the echoes are received using a single beam-forming antenna, whose location changes as the SAR device on board the spacecraft or aircraft moves [
68]. Synthetic aperture radar is essential for obtaining disaster information given its strong penetrability through tree canopies, speediness, comprehensive coverage and all-time/all-weather imaging capabilities. It is often used not only to detect building damage but also to monitor ground and structural deformations [
41]. In 2010, after the earthquake in Haiti, heavily damaged urban areas were assessed using SAR intensity images and building footprints [
10]. Pre- and post-event high-resolution SAR images and their characteristics are depicted in
Figure 8. The backscattering coefficient between pre- and post-earthquake images changes more in collapsed buildings than in less damaged ones, because the rubble has a stronger reflection. This analysis has managed to detect almost 75% of the damaged buildings correctly [
12].
Post-event dual polarimetric SAR images for earthquake damage assessment were used for the 2015 Nepal earthquake. Polarimetry refers to the vector nature of electromagnetic waves. Radar polarimetry is the science of acquiring, processing and analysing the polarization state of an electromagnetic wave in radar applications [
69].
In radar physics, the backscattering coefficient signifies the portion of the outgoing radar signal that the targets scattered redirects directly back towards the radar antenna. According to polarization, there are three typical scattering types: surface, double-bounce and volume. Undamaged buildings present a high backscattering coefficient given the double-bounce scattering, whereas damaged buildings present a low coefficient. The radar scattering characteristics of undamaged and damaged urban areas are compared using polarimetric features derived from PALSAR-2 and Sentinel 1 images [
33]. Supervised classification, feature selection and split-based image analysis were utilized on the images [
33]. Pearson’s correlation coefficient was adopted as a criterion to select high correlation features utilized to construct classifiers. The outcome of this process indicated that texture features derived from the backscattering coefficient were the most appropriate to identify the building damage. Higher correlations were found between the damaged and texture features derived from the intensity cross-polarization than other features considered [
33]. Support vector machine (SVM) and K-Nearest Neighbor (KNN) classifiers were applied for supervised classification. Employing 30% of data for testing and 70% of the data for training, the support vector machine (SVM) classifier reached an accuracy of 80.5%. Earthquake Damage Visualization (EDV) uses SAR data for the rapid detection of earthquake damage, considering three parameters. The first parameter is the normalized difference between preseismic and coseismic coherences, and vice versa, to calculate the forward (from preseismic to coseismic) and backward (from coseismic to preseismic) change parameters, correspondingly [
15]. The second parameter is the backward change added to visualize the changes not caused by the earthquake. The third parameter is the average values of the preseismic and coseismic coherence maps. These three parameters were eventually merged into the EDV as red, green and blue (RGB) composite imagery [
15]. The earthquake damage is visualized efficiently through the EDV employing horizontal transmit and horizontal receive (HH) and horizontal transmit and vertical receive (HV) polarizations data from the Advanced Land Observing Satellite-2 (ALOS-2) [
15]. The performance of the EDV was tested in the Kathmandu Valley, which was struck by the 2015 Nepal earthquake [
70]. The cross-validation results indicated that the EDV is more sensitive to building damage than other methods, and its utilization for other earthquakes is feasible [
15]. In the last years, SAR based techniques have also been applied to recognize earthquake-related surface deformation and ruptures, massive landslides and subsidence [
54]. High-resolution synthetic aperture radar data from Sentinel-1 and near-field GPS data from four stations were utilised to investigate the coseismic and post-seismic surface displacement associated with the Gorkha earthquake [
71]. The deformation map generated revealed an upliftment of about 1 m near Kathmandu and a subsidence of about 0.8 m toward the north [
71].
3.4.5. Interferometric Synthetic-Aperture Radar (InSAR)
This technique uses SAR images of the same area obtained at different times [
72] to map ground deformation [
73]. Comparing InSAR coherence maps before and after an extreme event can produce damage proxy maps (DPM) [
56,
74]. Radar and optical images were combined to measure ground displacements and determine the kinematics and geometry of thrust faulting for the Himalayas after the M
W7.8 earthquake in Gorkha, Nepal. The InSAR data from the European Space Agency (ESA) were processed to derive surface offsets and surface LOS ground motion from the correlation of amplitude images from Landsat-8 and SAR [
75]. These observations were complemented with other published surface displacements from ALOS-2 SAR satellite and GPS coseismic offsets. Up to 2 m of south–southwest motion and almost 1 m of uplift in Kathmandu basin and the surrounding Lesser Himalaya were observed, whereas, north of this, a large region of the Higher Himalaya subsided by about 0.6 m [
75]. Nevertheless, a triggered near-surface slip was found with the Sentinel-1 co-seismic interferograms along 26 km-long discontinuity, 10 km north of the MFT. Broadly consistent surface offsets, peaking 60 mm of surface motion towards the radar, were shown by independent interferograms on two overlapping descending tracks [
75].
Interferometric Synthetic-Aperture Radar and GPS were utilised to study co-seismic and early post-seismic deformation associated with the Gorkha earthquake by mapping performed by different groups of researchers [
71]. The analysis of the data collected found co-seismic and early post-seismic (4–88 days) surface displacement. The same geodetic data was inverted for co-seismic and post-seismic slip on the Main Himalaya Thrust (MHT), providing a detailed slip distribution pattern on the causative fault. The post-seismic GPS displacement supports the InSAR observations, and the inverted co-seismic deformation closely matches the observed InSAR and GPS deformations. The InSAR data pair (29 April 2015–11 May 2015), along with the GPS-derived velocity for a window time of 13 days, was chosen for afterslip inversion, as it represents early post-seismic movements (4–16 days after the Gorkha earthquake) [
71].
3.4.6. Real Aperture Radar (RAR)
The RAR technology can be used for rapid building condition screening to provide almost real-time, trustworthy information about its condition and performance. The radar device can detect and range objects by acquiring echoes from different targets in its antenna field of view (FOV). This RAR and other pieces can be observed in
Figure 9a). A radar observation utilises the time elapsed between the transmission and reception of an electromagnetic waveform to provide a signal called range profile. This signal consists of different amplitudes’ peaks that identify the observed structure’s main reflecting parts [
6]. When a good signal-to-noise ratio (SNR) is obtained, an interferometric algorithm can be used to look at the changes in the phase of the reflected signal so that the time-shift can be extracted, hence the vibration within the damaged building can be estimated.
Numerical modelling and RAR were used to record the displacement response of a selected building severely damaged due to the M
W5.1 2011 Lorca earthquake (Spain), as portrayed in
Figure 9b. The IBIS-S, a radar device with interferometric capability, a sensor module, a control PC, a power supply and data procession software, was employed to monitor the displacement time history of the vibration of the surveyed building [
6]. The objective of this test was to determine the feasibility of the RAR-based method to identify the safe state of a damaged building after an earthquake, avoiding access to unsafe structures [
6]. The result showed good consistency between the experimental and numerical approaches and the observed damage, demonstrating that RAR is a supplementary RS method to safely report a building’s operative conditions and structural health after an earthquake [
6].
3.5. Crowdsourcing Platforms
Eyewitness reports have always been part of seismology, and large volumes of eyewitnesses observations can boost rapid situational awareness [
38]. Online tools offer the possibility for ‘citizen engineers’ and volunteers to analyse large amounts of data to quickly provide a qualitative assessment of the post-earthquake degree of damage to different types of buildings [
28]. Our literature review identified seven crowdsourcing platforms used for earthquake reconnaissance: DYFI, Earthquake Network, LastQuake, MyShake, Raspberry Shake, QuickDeform and The TSERSystem. The crowdsourcing platforms identified are listed below in alphabetical order.
3.5.1. Did You Feel It? (DYFI)
The United States Geological Survey (USGS) developed DYFI in 1999. ‘Did You Feel It?’ is an online system to collect macro-seismic intensity (MI) data, shaking and damage reports from earthquakes eyewitnesses and process them automatically [
38] for generating intensity maps right after an earthquake [
36]. This system distributes questionnaires after earthquakes to collect information about their impacts [
42]. In the case of earthquakes outside the United States, DYFI data rapidly confirm their occurrence for seismic analysis, and scientists at the USGS National Earthquake Information Center (NEIC) can use this to indicate the impact of shaking effects. Intensity data collected through DYFI are utilized to provide shaking constraints input for the USGS Global ShakeMap system. This information allows the USGS to alert agencies and users worldwide of significant earthquakes and their likely impact [
36].
Incoming entries from multiple web servers are processed and aggregated over postal ZIP codes (in the US), and 1 km and 10 km aggregated boxes for each earthquake to make interactive maps and plots served via the USGS Earthquake Program web pages [
36]. The DYFI is a program for community internet intensity maps (CIIM) developed based on the questionnaires that assign average intensity levels to each ZIP code [
45]. Two relevant questionnaire indices are combined with other users within their community to produce an intensity calculation [
36]. Did You Feel It? contributors usually select the most recent earthquake when contributing or searching for information [
36,
38]. Some of them still contribute for months after an earthquake; therefore, DYFI maps result from aggregated MI models that change over time. The DYFI questionnaire includes questions about users’ situations, experiences and behaviours, going beyond the calculation of MI. This data makes the DYFI database the repository of millions of comments relevant to social sciences [
36]. Essentially, DYFI depends on entries from the general public, being citizen-based science. Shakemap and DYFI have significantly facilitated the use of MI in the US, training citizens to think in terms of varying intensities produced by an earthquake [
36].
3.5.2. Earthquake Network
Earthquake Network is a citizen science research project implementing an earthquake early warning system (EEW) based on smartphone crowdsourcing [
43]. People install this smartphone application and receive real-time alerts when the smartphone network detects earthquakes [
37]. The Earthquake Network app is, at the same time, an instrument to detect earthquakes. When the smartphone is unused and charging, the app monitors the accelerometer for detecting vibrations that are likely due to an earthquake. If a seismic movement is detected, a signal is sent to a server that collects signals from smartphones [
37,
43]. Following the algorithm, the server decides in real-time if an earthquake is happening. If confirmed, the server infrastructure sends an EEW to the users located in the affected area. Hence, the Earthquake Network makes an early warning service available to users interested in making their smartphones available for detection when their smartphone is not in use [
37]. The Earthquake Network app interface is depicted in
Figure 10.
For real-time detection of earthquakes, the Earthquake Network sends signals to a server located in Europe. The infrastructure is currently based on nine servers that receive a large number of signals from the network and the numerous users opening the app when they experience the earthquake. Whenever the server infrastructure receives a signal, it activates a statistical algorithm that determines if an earthquake is happening. Then, the analysis is done at a global scale and in real-time [
37]. Users can report the impact of an earthquake by pushing a button in the app interface, reporting the earthquake’s impact considering only three levels: mild, strong and very strong, to make it fast. Spatial coordinates of the smartphones are automatically sent with the felt report. If several reports are received from a specific area simultaneously, a notification is sent to the smartphone users through the Firebase Cloud Messaging (FCM) platform. Usually, users first receive the EEW activated by smartphones, and within one minute, they receive the notification activated by users. The user is redirected to a map showing all felt reports by clicking on the notifications. For example, reports were collected in Puerto Rico within 60 s after the 3.6 magnitude earthquake; thus, users were aware of the low impact of the earthquake before any official information was released [
37]. The Earthquake Network app has a second strategy to send smartphone coordinates by SMS or email to a list of trusted contacts when an EEW is received. The aim is that SMS/e-mail will be sent before lifelines (phone network/Internet) are affected, and the EEW is received before the shaking starts. However, the smartphone must be on at the time of the earthquake. After receiving the SMS/e-mail, users can report their status by pressing a button in the app’s user interface indicating: ‘I am fine’ or ‘I need help’ [
37].
3.5.3. LastQuake App
The European Mediterranean Seismological Centre (EMSC) developed a multichannel rapid information system consisting of websites, a Twitter quakebot called LastQuake and an eponym smartphone app [
36,
38,
43] at the interface between global users looking for information from the EMSC. Components of this multichannel rapid information system are presented in
Figure 11. This multichannel has two objectives: to offer practical information in regions where an earthquake is felt and to collect reports from users containing direct and indirect observation related to the intensity and damages caused by the earthquake [
16]. The LastQuake app also monitors people’s activity soon after the earthquake [
37]. The LastQuake app users’ engagement is built on the rapid provision of tremor detection. Users’ behaviour is similar to real-time seismic sensors when they enter the EMSC websites or the smartphone app. An earthquake can generate several automatic tweets published by the quakebot and updates on the website. These tweets and updates describe earthquake parameters, epicentral plots, maps, felt reports, historical seismicity, tsunami information and links to the user’s comments [
16].
There are two kinds of data collected from users: crowdsourced data (felt reports, geotagged pictures, videos and open comments) and crowdsourced detections (users’ reactions and experiences on the ground) [
16,
38]. Then, it is only necessary to identify the geographic origin of the website visitors through their Internet Protocol (IP) to determine where the earthquake was felt, without the need for any seismological data [
16]. There are two other complementary crowdsourced earthquake detection methods in operation. The first is Twitter Earthquake Detection (TED). This approach identifies a surge in tweets, including the keyword ‘earthquake’ in various languages and the traffic analysis generated by LastQuake app launches, which works the same as website traffic analysis. If many people in the same area open the app simultaneously, there is a high probability of an earthquake, and hence an alert is sent [
37]. A push notification is submitted to LastQuake app users once the crowdsourced detection has been confirmed. Felt reports are collected through a multilingual online macro-seismic questionnaire available on the EMS website, or by using the 12 cartoons depicting different shaking and damage levels [
42]. Each cartoon represents an intensity level of the European Macroseismic Scale in 1988 [
38]. These cartoons have made the collection of reports on a global scale more efficient [
16]. By plotting the location of the LastQuake app’s launches, it is possible to map the affected area automatically.
3.5.4. MyShake Project
The MyShake project aims to build a global smartphone seismic network to develop a large-scale EEW and other applications to boost the power of crowdsourcing [
37,
38,
39]. This project, implemented by UC Berkeley’s Seismological Laboratory [
37], is based on the MyShake mobile application, which first detects an earthquake shaking on a single phone. Then, this detection is confirmed on the MyShake servers using a ‘network detection’ algorithm activated by multiple single-phone detections [
39]. This app is utilised to continuously monitor the smartphone accelerometer to measure earthquakes and send alerts [
37]. It is assumed that 0.1% of the population in each region has the MyShake mobile application installed on their smartphone. The system works better (alerts generated between 4 and 6 s, errors are within to 0:5 magnitude units and epicentres are typically within 10 km of true locations) in high-density populations and onshore regions with an upper crustal earthquake with a magnitude higher than M
W7.0. In the opposite case, alerts are slower in low-density populated regions and offshore areas, and the uncertainty in magnitude and location soars. The system still works where only 0.01% of the population uses the MyShake app and in highly populated regions and for earthquakes higher than M
W5.5 [
39].
3.5.5. Raspberry Shake
Raspberry Shake is a crowdsourcing operation based on affordable seismic sensors that can be easily installed in houses or schools and used in several citizen seismology projects [
43]. After the 2015 magnitude 7.8 Ghorka earthquake in Nepal, it was found that the population was not aware of their country’s high seismic hazard. Hence, an initiative to introduce seismology in schools, focusing on education and citizen seismology, was implemented in Nepal [
40]. Considering its performance in a laboratory test, suitability for the field conditions of the seismic sensor installed in schools was a Raspberry Shake 1D (RS1D). Additional criteria used to select this sensor were low cost (below 500 USD), easily applicable for educational purposes, high sensitivity to detect local earthquakes, ease to handle and the possibility of recording data without an additional computer. These seismometers, installed in 22 schools, developed the Nepal School Seismology Network, delivering online data openly [
40]. This program started in western Nepal because people there have limited opportunities to learn about earthquakes. There has been no significant earthquake for 500 years in this region [
48], unlike the rest of Nepal. There is an acceptable travel time by vehicle or short walk between different sites where seismometers were installed. Facebook and Twitter were used in Nepal to spread information about the Nepal School Seismology Network and ask interested schools to fill out the request form [
40]. The criteria to select the 22 schools among the 100 that submitted the request form were: number of students, motivation, feasibility to install the seismometer on the ground floor, 200 m minimum distance to a road or highway to avoid anthropogenic noise, own internet connection, alternate power supply and reachability of the school [
40]. Each seismometer installed in a school informs students about earthquakes, waveforms, distance and magnitude of the event. Thus, the network is used to share locally recorded data openly and for teaching [
40].
3.5.6. QuickDeform
Near real-time ground deformation maps generated after earthquakes are essential for hazard assessment and usually take a couple of hours or longer to be generated by conventional means. Zhao, Liu and Xu have developed a near-real-time co-seismic ground deformation map generation system to assist emergency response [
41]. This system adopts source parameters published by the USGS–NEIC and empirical equations to generate the real-time (within seconds) co-seismic ground deformation maps [
41]. This method integrates seismic deformation maps into WebGIS for real-time disaster evaluation and emergency response. The seismic ground deformation maps are integrated as self-adapting spatial data fusion using the Okada rectangular dislocation model [
76] and empirical equations of fault [
41]. Later, the result is visualised on an interactive WebGIS platform named QuickDeform. This GIS user-oriented platform provides real-time evaluation and emergency response information by viewing, searching and customizing the seismic deformation [
41].
3.5.7. The Taiwan Scientific Earthquake Reporting (TSER) System
The TSER is a crowdsourcing system designed for acquiring quantitative data collected by trained volunteers for earthquake-triggered surface damages [
42]. This TSER is an experimental program launched by the Institute of Earth Sciences, Academia Sinica and Taiwan’s Seismological Centre in 2016. These institutions incorporated into the program: (1) a computer-aided volunteer management system (VMS), (2) an educational training course and (3) an online report and mapping platform [
42]. Additionally, volunteers were trained to ensure the quantity, completeness, quality and reliability of the data collected when they report the damages produced by earthquakes. The TSER was developed on the framework of a citizen seismology program that includes training courses and VMS with the web GIS-based platform to crowdsource scientific user’s reports for earthquake-triggered surface natural damages [
42]. The on-site field reports complement the ground observations with real-time instrumental data and results to better understand the surface damages and geohazards produced by earthquakes and support SAR activities and later social impacts [
42]. The TSER system was constructed by adopting the pre-existing Ushahidi mapping platform, which was widely used successfully for several purposes [
42]. Ushahidi platform is an open-source software application and an integrated data crowdsourcing and mapping tool that allows people to collect, manage and analyse data from their communities [
77]. The VMS notifies a trained volunteer of a potentially damaging earthquake through email. These notifications indicate the epicentral area to carry out field surveys. Volunteers must log into the TSER platform. To report earthquake-induced surface damages, they must identify the ground damage category from a menu, describe it, locate it and upload the corresponding picture [
42]. The information collected is made available to the public after being checked by the on-duty scientist. The TSER platform was tested after the 2018 M
W6.4 Hualien earthquake, and it provided the distribution of the surface ruptures, rupture orientation, type of faulting and offset dimension [
42].
3.6. Social Media (SM)
Social platforms and smartphone apps are playing an increasing role during disasters [
78]. They not only offer public participation but also constitute backchannel communication. Considering that the internet and SM have become the digital nervous system of our planet [
16], various forms of SM are valuable tools for quickly collecting large amounts of data relating to disasters. SM offers first-hand data, observations, sentiments and perspectives [
79]. These data can range from photos and videos to comments uploaded to various internet platforms such as Facebook, Twitter, Instagram and YouTube.
The first fieldwork or ground survey that reported on extracted data from SM was the mission deployed by Stanford’s John A. Blume Earthquake Engineering Center for the 2017 Puebla–Morelos earthquake. This mission complemented the collapsed building’s database with data from newspapers and SM [
27]. Nowadays, SM platforms have become another medium to share early scientific analysis, forming collaboration bases among multidisciplinary teams. We identified in our literature review three SM platforms used for earthquake reconnaissance: Earthquake Network, Facebook and Twitter. The SM platforms identified are organized below in alphabetical order.
3.6.1. Earthquake Network
Probably the first social network about earthquakes was Earthquake Network. This platform has chatrooms in 10 languages, where users can share information right after an earthquake, either in private messages or in the public space. Chat moderators in the public space keep the discussion focused on relevant issues and block users that misbehave [
37]. Earthquake Network supports people after they have experienced an earthquake by enabling discussions with others to reduce the anxiety and fear caused by it. Those users active in the chatrooms tend to keep the app installed for months to years [
37].
3.6.2. Facebook
Facebook is the most popular SM platform [
43,
44] for user-generated content. LastQuake app users have the option to share their comments on their Facebook account [
16]. In May 2018, the French Island of Mayotte in the Indian Ocean between Madagascar and the coast of Mozambique was struck by a series of earthquakes. At the beginning of the seismic swarm, there was a gap in seismic data and explanations of the phenomenon and a mistrust of the scientific community. Residents using the LastQuake app [
16] created their citizen seismology network based on a Facebook group named Mayotte Earthquake Support (STTM by its acronym in French) [
43]. The members of this group on Facebook expressed their scepticism about the lack of information from the seismologist community. After the first earthquake, they started to discuss its effects on the road traffic group. Following this, one group administrator decided to create a group dedicated to earthquakes [
43]. Citizens created this group for citizens to exchange knowledge and feelings about earthquakes. Generally, after an earthquake, citizens post messages indicating when and where they felt it and, in some cases, ask for additional information, such as magnitude. They also show and ask for emotional support, commenting on each other’s’ posts and questions, uploading pictures of cracks or trees on the roads and discussing the earthquakes’ potential causes [
43]. Over time, this group took a more scientific direction, and some of the members shared reliable seismic information in an understandable way for their fellow citizens. The information shared was about seismology in general, seismological concepts (magnitude and intensity), felt earthquakes, earthquake causes, comparisons with other earthquakes swarms, historical seismic data and safety measures to take [
43]. These citizens collected data, reviewed scientific literature and produced collated forms of knowledge, listing all felt earthquakes mentioned in the group and comparing them to the French Geological Survey’s (BRGM’s by its acronym in French) seismic reports. Furthermore, a few months after the earthquakes, one of the users suggested equipping the island with a Raspberry Shake seismometer [
40,
43].
3.6.3. Twitter
The Palu M
W7.5 earthquake and tsunami in Indonesia and other events have demonstrated how Twitter quickly generates knowledge in the minutes to hours and days following an event, developing an efficient exchange of information and active discussion between the public and scientists, and between scientists themselves [
44]. In the aftermath of an earthquake, it is essential to promptly establish its geological and geophysical characteristics, to be able to explain it to the media and stakeholders and evaluate the risk of secondary effects [
44]. In Hurricane Sandy, the Twitter activity was correlated with damage and, therefore, useful for impact assessment and response [
16,
80]. Correlation between the number of tweets and the intensity of an earthquake was observed for the first time in 2010. During the Tohoku earthquake, researchers observed a high correlation between the number of tweets and the earthquake’s intensity in some locations [
81,
82]. Informative tweets about geophysical data were published for the 2018 earthquake on Palu–Sulawesi Island, Indonesia. Based on these tweets, a timeline was built of the rapid progress of understanding the earthquake rupture and its effects. Published papers, maps about the seismotectonic context in Indonesia, teleseismic data, local seismic waveforms, high-resolution optical satellite images, SAR, tide gauge records and field observations from both science groups and residents were shared on Twitter, getting rapid and varied feedback from fellow researchers [
44]. The correlation between activity on Twitter and Mercalli intensity was demonstrated in Napa, California [
45], Japan and Chile [
51]. The activity on Twitter related to recent earthquakes is plotted in
Figure 12.
3.7. Closed Circuit Television Videos (CCTV)
This source of data continuously records images at a given location. By definition, the video record should be temporally comprehensive (ignoring recording failures), although, in some instances, recording may start when a change in the image is detected. Either way, CCTV videos can provide good quality data about how the image at a given location changed, depending on the camera’s resolution. As the camera is static, it is relatively easier to use automated techniques to detect changes in the background image and to potentially automatically relate that to an earthquake impact. One of the issues with using CCTV images for CD due to an earthquake is that the cameras are generally privately owned. Therefore, discovering useful images or gaining permission to view those images is not assured.
The collection of 38 amateur videos and CCTV’s at 14 sites around Palu Bay were used [
46] to estimate tsunami arrival times, amplitude and wave periods around different locations where more damage was reported after the M
W7.5 2018 Palu earthquake. The Pantoloan tide gauge data was complemented with an innovative approach that combines the analysis of video footage and post-tsunami surveys. The video images captured the formation, propagation and inundation of the tsunami. Timed waveforms were constructed from the quantitative interpretation of video footage [
83,
84] by tracking sea-level changes from image pixels in subsequent frames. The quality and the quantity of the videos determined the richness of the tsunami data. While several CCTV cameras precisely captured tsunami scenes, others were captured by amateur videos. This analysis provides temporal data that is not possible to recover in field surveys. The video footage combined with post-tsunami surveys indicated potential locations of submarine landslides as tsunami sources that would correspond with the arrival times of the waves [
46].
An image-based disaster damage assessment system, named IDEAS, has been developed to evaluate damage assessment inside buildings. This system first compares images taken inside a building before and after an earthquake. Later, these images are used to map the damage according to a Mercalli intensity scale [
47]. To perform the earthquake intensity scale assessment, IDEAS adopts scale-invariant feature transformation (SIFT) to extract the information of non-structural objects moved. Afterwards, IDEA uses the information and the size variants of non-structural objects that have moved for damage assessment of the buildings [
47]. To extract the movement information of each object, IDEAS performs multiple objects tracking to assess the damage and map it according to the MMI scale. Later, IDEAS submits the damage assessment report to the relevant audience, such as institutions in charge of emergency response. The working scenario of IDEAS is depicted in
Figure 13. To determine the accuracy of IDEAS, 40 pairs of CCTV images from the YouTube website were collected. The test reports an accuracy of 97.6% in mapping the Mercalli intensity scale [
47].
4. Discussion
Building-by-building foot-on-ground surveys collect highly detailed data that can be used forensically to validate RS data or models such as structural models or fragility curves [
85]. However, they are expensive and time-consuming [
52], and the duration of these inspections can last for months [
44], depending on the availability of volunteers [
53], to reach a good understanding of the event’s characteristics [
44]. Nevertheless, it is necessary to differentiate between a rapid building damage survey [
86], which is focused on buildings’ safety during the emergency phase, and a detailed damage survey oriented to assessing the performance of building structures or the restoration of historic buildings [
29]. This second kind of damage survey can support early recovery planning and help to accomplish build-back-better and built-to-last. Now, smartphones allow quicker and more rigorous structural evaluations by filling in forms in apps containing all the necessary items to evaluate the damage to a building and collecting multimedia data. The collected photos can be indexed by their locations using GPS coordinates [
87] or what3words. Eventually, post-earthquake investigation data can be quickly uploaded to servers through the network of smartphones so that seismic damage data can be quickly shared to support decision making for post-disaster recovery [
55].
Omnidirectional imagery shows significant capabilities in identifying aggregated ‘low’ and ‘high’ damage grades, failure modes, number of stories and construction typologies. There are some potential issues with properly identifying disaggregated lower damage (e.g., damage grades 0–3 according to the European Macroseismic Scale-98) [
28]. The comparison of RVS and OD based post-earthquake survey data identified challenges to overcome. Those challenges are poor image quality; insufficient photosphere captures related to the extent of its overlap, lack of photos close enough to each other and obstructions such as trees, walls or vehicles [
28]. More advanced cameras could improve the image quality, and the gaps between pictures can be solved by reducing the distance between images (between 10 and 12 m) [
28], especially on obstructed streets (e.g., tree-lined). Moreover uncertainties related to the validity of the information inferred using this method and the challenges associated with collecting detailed data still need to be addressed. The TLS capture of the entire geometry of the Baptistery of San Giovanni in Florence, Italy, was not used in the context of an earthquake reconnaissance mission. However, we decided to include this reference for the suitability of this method in reconnaissance missions when they need to focus on the forensic analysis of world heritage (WH) buildings. Terrestrial laser scanning can collect highly detailed data of cracks, settlements, displacements and other damages in structural and nonstructural elements, the latter being especially important in these kinds of buildings. However, time to collect the data and training to operate this tool correctly is necessary.
The main advantage of using RS for building damage assessment is that large damaged areas can be surveyed rapidly without being hampered by the emergency operation on the ground [
24]. However, VHR satellite images useful for CD could be expensive, not be up-to-date, not match each other and contain clouds, making them useless for CD. An accurate damage detection can take some time while the objects in the images are classified, and the software algorithm in software is trained to detect changes related to damage [
30]. Smaller and particularly complex urban disaster scenes, multi-perspective aerial imagery obtained with UAVs and sUAV and derived dense colour 3-D models are increasingly employed to gather data. Hence, it would be interesting to investigate how the regulation for the operation of sUAVs affects the data collection rate and its delineation of areas affected by the earthquakes, and sUAV’s effectiveness as a detailed reference source for the tracking of recovery efforts during return missions. These data sources are an alternative to CD in satellite images in identifying damage, and they also remove challenges such as the images not matching [
31]. Currently, satellites are equipped with several RS payloads to complement airborne remote sensing and other UAVs. The result is a collaborative operated network involving multiple satellite observations, airborne RS and ground operations [
18].
Crowdsourcing information can be a cost-effective option to form a dense real-time accelerometric network, reducing uncertainties of rapid earthquake scenarios [
38]. Despite the intrinsic variability of felt reports, based on 20 years of DYFI experience [
36], it is possible to observe how felt reports have contributed to earthquake response and science and behaviour studies [
36,
38]. Integrating DYFI data in ShakeMaps improves shaking estimates and the rapid assessment of an earthquake’s impact [
36,
38]. The Earthquake Network app and MyShake app are similar. The main difference between these apps is that the data recorded by the accelerometer in the Earthquake Network app are not used to make any seismological analysis, and EEWs are sent only when several smartphones in the same area detect accelerations above a specified threshold [
37]. Currently, the main limitations of the EEW system implemented by the Earthquake Network are the lack of accuracy in the information of the earthquake intensity and that the geometry of the location of the smartphone network is not optimized regarding known faults [
37]. Among these apps, the EMSC was the first to consider the behaviour of users and their associated digital footprints to detect a widely-felt earthquake in an intersection between seismology, citizen science and digital communication. This approach was also compared with the manually and independently derived macroseismic datasets from DYFI [
38]. However, when looking at intensity levels reported by users, it is necessary to keep in mind that those living in low seismic zones tend to report an earthquake, regardless of the magnitude and/or impact displayed in the app user interface [
37]. Another common problem among citizen science projects is user retention, which could be solved by encouraging interaction with the app and other users to boost user lifetime value [
37]. In the case of Mayotte (2018), it was observed that while scientists were gathering on Twitter [
44], citizens were debating on Facebook about the same seismic phenomenon. The answers to the questions formulated on the STTM group were available on Twitter. This situation can be explained by the socio-technical design of the platforms and the technological culture. People use Facebook for daily and personal uses. Instead, Twitter has become a handy platform for researchers to exchange ideas, collaborate and share preliminary outcomes [
43].
Crowdsourcing and SM platforms tend to be the new data sources. Given the travel restrictions imposed by the COVID-19 pandemic, we started using them to collect data for the earthquake reconnaissance missions of the 2020 Zagreb earthquake [
88,
89,
90] and 2020 Aegean earthquake [
91,
92], and even before the 2019 Albanian earthquake [
93] and earthquake reconnaissance missions in the long-term for the tenth anniversaries of the earthquakes in L’Aquila (Italy) [
94,
95,
96], Maule (Chile) [
94,
97] and Port-au-Prince (Haiti) [
94]. We did not focus the review on SM platforms because there was already a literature review on this topic [
98]. The ubiquity of smartphones and SM has opened new opportunities for fast crowdsourcing and two-way communication between affected people and institutions/authorities [
38]. In some cases, one geotagged picture, an individual observation or objective comments on SM platforms can substantially reduce uncertainties regarding impacts [
38]. However, the scientific community still casts doubts on the utility and reliability of data collected in the framework of citizen science projects. Text and image data collected from SM are unstructured data that need a lot of cleaning [
99]. Then pre-processing and translation to English (in case of text data), which is time-consuming, before being useful for a supervised and/or an accurate unsupervised classification to extract meaningful information from them. Training users to post more objective and less emotional messages is necessary to obtain more useful damage and needs assessment data. The Institute of Earth Sciences, Academia Sinica in Taiwan, trained volunteer users among high school or junior high school teachers to ensure the quality of data collected through the crowdsourcing TERS system. These volunteers are trained in natural sciences, geology, historical earthquakes and associated surface damages, geohazards, TERS and volunteer reporting system, citizen seismology and field geology excursion with on-site practices [
42].
Earthquake reconnaissance missions can also take advantage of images uploaded on SM platforms such as Instagram and Flickr. However, we did not find any literature reference in the last five years that mentioned the use of Instagram, a fact that could be explained, based on our experience, because pictures published on Instagram are accessed through Twitter. Flickr is an American image and video hosting platform which has been used in military defence [
100] to monitor and evaluate post-disaster tourism recovery after typhoon Haiyan [
101] and to prioritize the collection of RS imagery as a filtering tool after the Colorado floods [
102]. However, at the time of writing, Flickr has not been used yet in earthquake reconnaissance and could also be another suitable data source. We accept that neither crowdsourcing platforms nor SM constitutes groundbreaking science; instead, the process of automating the extraction of meaningful information from the text and image data they provide to support earthquake reconnaissance missions could be the future direction of research. Closed Circuit Television Videos can record the collapse pattern in buildings, which is essential information for earthquake reconnaissance. In the future, the data collected can be used to monitor socio-economic recovery, counting pedestrian traffic during the early recovery, recovery and development phases [
7]; however, protocols for obtaining relevant CCTV images need to be developed.
5. Conclusions
This literature review was beneficial by examining the most used data sources in the last five years and recalling the most significant seismic events during the same period. Considering an initial literature review undertaken in 2019, plus the experience gained in the project LfE-UK, we conclude that the current data collection sources can be grouped into seven categories: fieldwork or ground surveys, OD, TLS, RS, crowdsourcing platforms, SM and CCTV.
We know that data sources based on fieldwork missions and RS have been used for decades; however, they are still evolving in terms of their capabilities and their use. Nowadays, fieldwork missions use apps to record the building damage assessments instead of paper forms and increasingly include RS methods with more functionalities and devices with higher resolutions, precision and accuracy. Something similar happens with crowdsourcing platforms; DYFI has existed since 1999 [
36], the Earthquake Network started in 2012 [
37], the LastQuake app existed before 2015 [
16], Raspberry Shake [
40,
103] and the TSER system [
42] were launched in 2016, the MyShake network detection algorithm was tested in 2018 [
39], and the first reference to QuickDeform dates from 2020 [
41]. Although Facebook and Twitter were launched in 2004 and 2006, respectively, these SM platforms have evolved in response to the feedback from their users and their ability to generate income for owners. For this reason, and their expanding use in providing data from disasters, we argue that they can be considered to be part of state-of-the-art.
The most detailed and reliable data are collected through fieldwork or ground surveys that last between three days to one week on-site [
49]. There must be at least one week beforehand to collect information on the affected area, searching for local contacts and logistic preparation (team members selection, flight tickets purchasing, hotel booking, equipment preparation, visas, etc.). After the mission, it is necessary to process the data to produce a final report. The partnerships between visiting earthquake reconnaissance teams (who have reconnaissance experience) and local institutions (who have local knowledge) are essential for efficient and effective data collection and interpretation. The fieldwork or ground surveys usually rely on traditional methods for data collection. However, the earthquake reconnaissance missions in the period covered by this literature review started to incorporate new technologies and sources, e.g., the app customized in the framework of the LfE-UK project tested by EEFIT mission for the 2019 Albania earthquake, the omnidirectional imagery for the 2016 Muisne earthquake and central Italy, the data extracted from SM by the Stanford’s John A. Blume Earthquake Engineering Center for the 2017 Puebla–Morelos earthquake and the ambient vibration recordings taken by the ATC mission for the same event. Smartphones have already replaced paper forms, although issues such as the battery’s charge duration and technical compatibilities remain unsolved. Omnidirectional imagery represents a significant improvement in damage assessment accuracy over satellite imagery, especially for lower damage grades [
28]. Terrestrial laser scanning is the data collection method suitable for historic structures affected by earthquakes that need a precise restoration to keep their WH condition and precisely estimate the cost and time needed for their reparation or reconstruction [
104].
The RS data sources are satellite images, UAVs, sUAV, LiDAR, SAR, InSAR, and their interactions. Satellite images are suitable for CD to identify damages to buildings and infrastructure, while SAR and InSAR techniques are more suitable for CD in land-surface altitude. The Building Safety Evaluation (BSE) teams conducted the field survey on behalf of Christchurch City Council in the weeks following the 22 February 2011 earthquake to validate findings from RS images [
24]. The GEER fieldwork mission in central Italy integrated data from several sources of satellite-based interferometric DPM and published reports about landslides in the case study area, digital imagery from UAV, manual observations and TLS. Good agreement was found between the UAV images and the zones of the significant ground surface changes detected by DPMs [
56]. Observations on steep terrain relied on UAV and LiDAR to collect data. The combined use of UAV and targeted terrestrial imagery allowed a large dataset of images to be built, with the outcome of various two-dimensional (2-D) and three-dimensional (3-D) scaled representations of the observed landslides [
56]. Terrestrial LiDAR point cloud models were demonstrated to be handy intermediaries between manual inspections and UAV [
56]. There is no unique RS method to obtain the accuracy and coverage expected in a post-earthquake reconnaissance mission, and so a number of different technologies should be considered. It is recommended to start the collection of data with coarse RS methods, such as optical image correlation and satellite-based interferometry, to detect surface deformations and later deploy more accurate RS data sources such as UAV-based SfM and/or terrestrial LiDAR to specific points of interest [
56]. The inclusion of ground control points (GCP) and checkpoints (CPs) in the UAV-based reconnaissance landslide sites increased the accuracy of the resulting products [
26] significantly. The GEER Association believes that data collection in the future should rely more upon UAV-based SfM and terrestrial LiDAR RS methods than on traditional manual observations. At the same time, they conclude that to increase the efficiency of a data collection task, earthquake reconnaissance missions must incorporate a phased reconnaissance approach where traditional measurements are only performed on valuable and essential places [
26].
The crowdsourcing platforms used for earthquake reconnaissance are DYFI, Earthquake Network, LastQuake, MyShake, Raspberry Shake, QuickDeform and the TSER System. Crowdsourced detections are an efficient filter to identify earthquakes that attract public attention [
16]. Social media platforms used for earthquake reconnaissance are Earthquake Network, Facebook and Twitter. Crowdsourcing and SM interact, complementing each other. Social media is a complementary data source of damage in buildings and lifelines, post-disaster needs, emergency response and post-disaster recovery and situation awareness, in general. However, it is still necessary to train citizens to provide more helpful information. The main aim of using SM is to extract information from image and text data is to support data-driven decisions in earthquake reconnaissance. Crowdsourcing and SM are efficient sources of interdisciplinary data collection, considering that they are within reach of everyone and interact with each other, allowing users to share information, attract new users, and boost information and dissemination. Crowdsources, such as the LastQuake system, has evolved, elaborating on the earliest crowdsource experience, such as DYFI. Additionally, crowdsourcing and SM collect relevant data regarding damage descriptions as interpreted by users, emergency response actions and users’ fears related to their vulnerable condition. Currently, the information contained in these data has not been sufficiently explored. It is necessary to encourage citizens to retain these smartphones apps, such as Earthquake Network, LastQuake and MyShake. In this way, it is possible to ensure earthquake detection, receive EEW and collect first-hand data about building damages, tsunami and geotechnical effects, emergency response actions taken and level of preparedness among users. To the best of our knowledge, the less explored data source is CCTV. This data source has been helpful in tsunami-prone areas such as Chile, Japan and the south Asian coast.
We conclude that the criteria to select a data source for earthquake reconnaissance include the time after the event (usually the post-disaster phase to carry out inspection), the size and topography of the area to survey, the time window to collect data, the estimated degree of damage, the type of assets damaged (e.g., structural vs non-structural elements) and the specific character of the inspection area. It is necessary to collect data at different scales for different levels of detail according to the assets damaged and each post-disaster phase’s needs, and to consider several data sources, to have comprehensive information of the event. Currently, no reconnaissance mission can rely on a single source of data. It is necessary to combine different sources to complement and validate the data collected [
30], especially in large survey areas, to quantify the damage comprehensively.
Data regarding physical damage and reconstruction can be collected through field surveys, OD and TLS, whose inspection areas or points have been previously delimited according to data collected through RS, crowdsourcing, SM platforms and CCTV. The socio-economic, institutional and cultural impact can be derived from SM platforms and CCTV right after the event, during the post-disaster phases. The increase in the number of crowdsourcing and SM platforms as data sources indicates the tendency of data sources in the future. Currently, data do not exclusively come from scientists and/or authorities but also citizens. These citizens as sensors [
105] are the group to be trained in earthquake reconnaissance. Thus, researchers might obtain from citizens meaningful data to understand the characteristics of the earthquake and its impact on the social, economic, institutional, cultural and environmental dimensions, avoiding gaps in knowledge and information that give space to rumours and fake news.


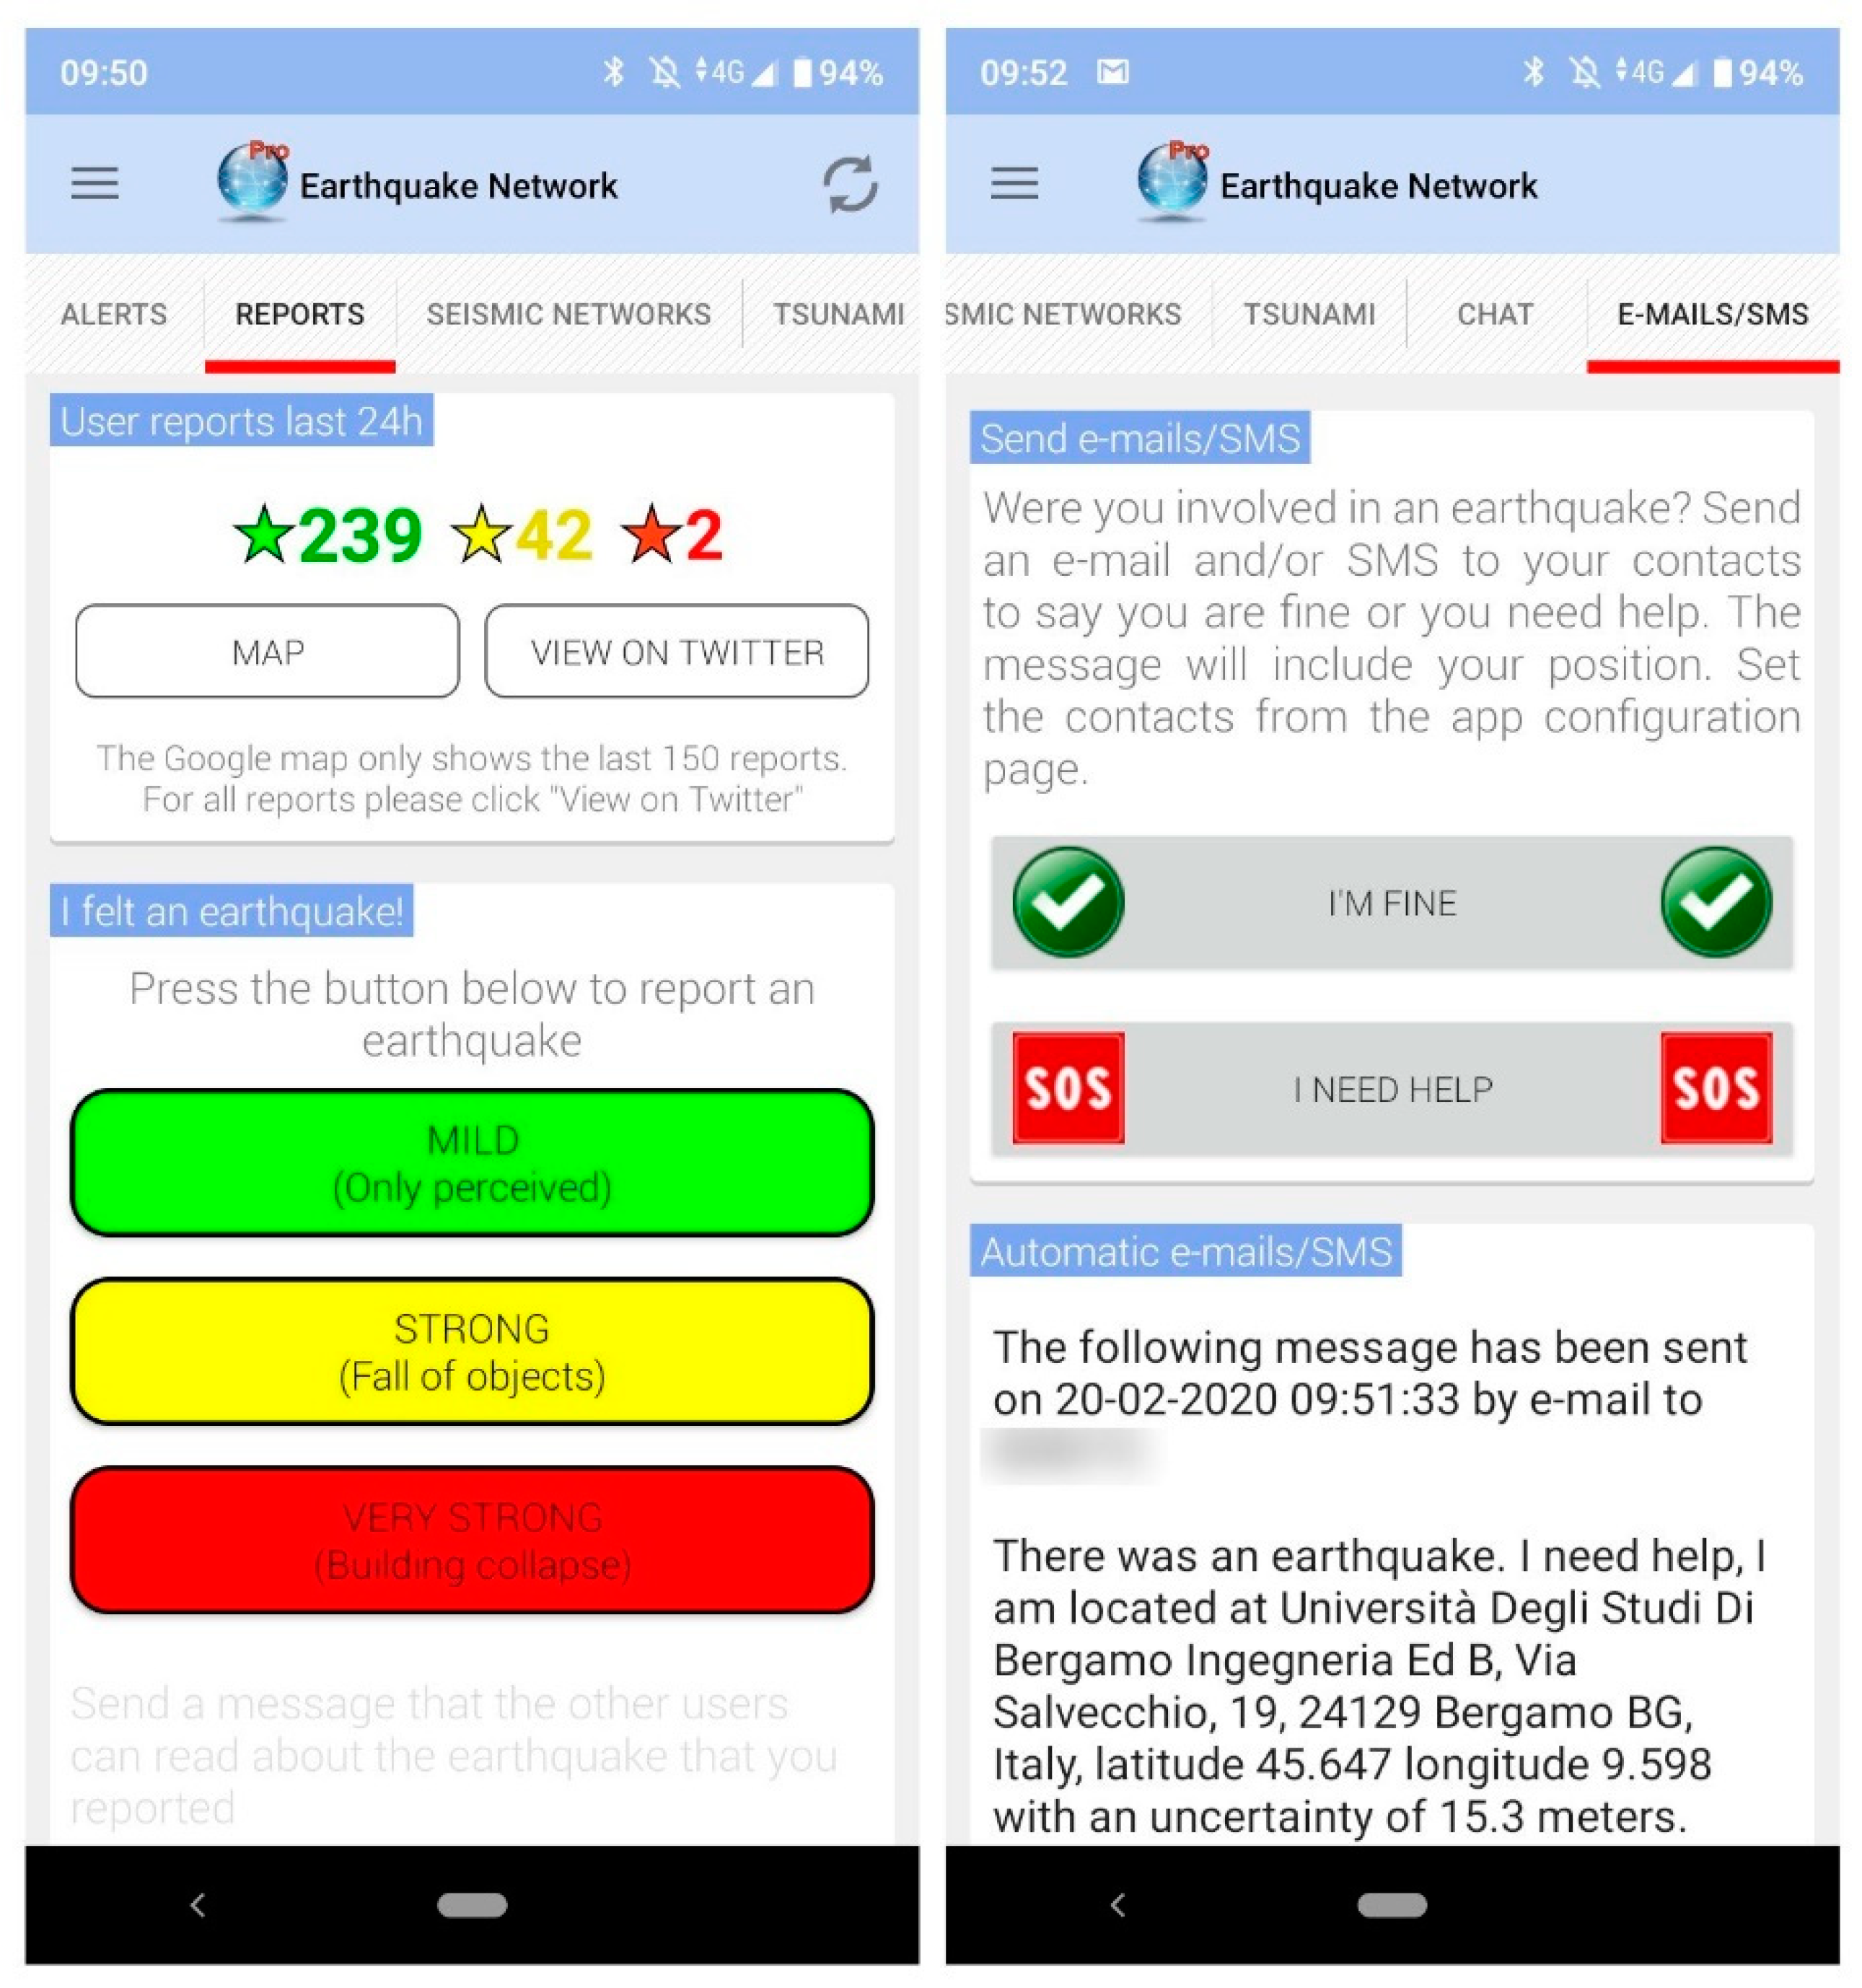


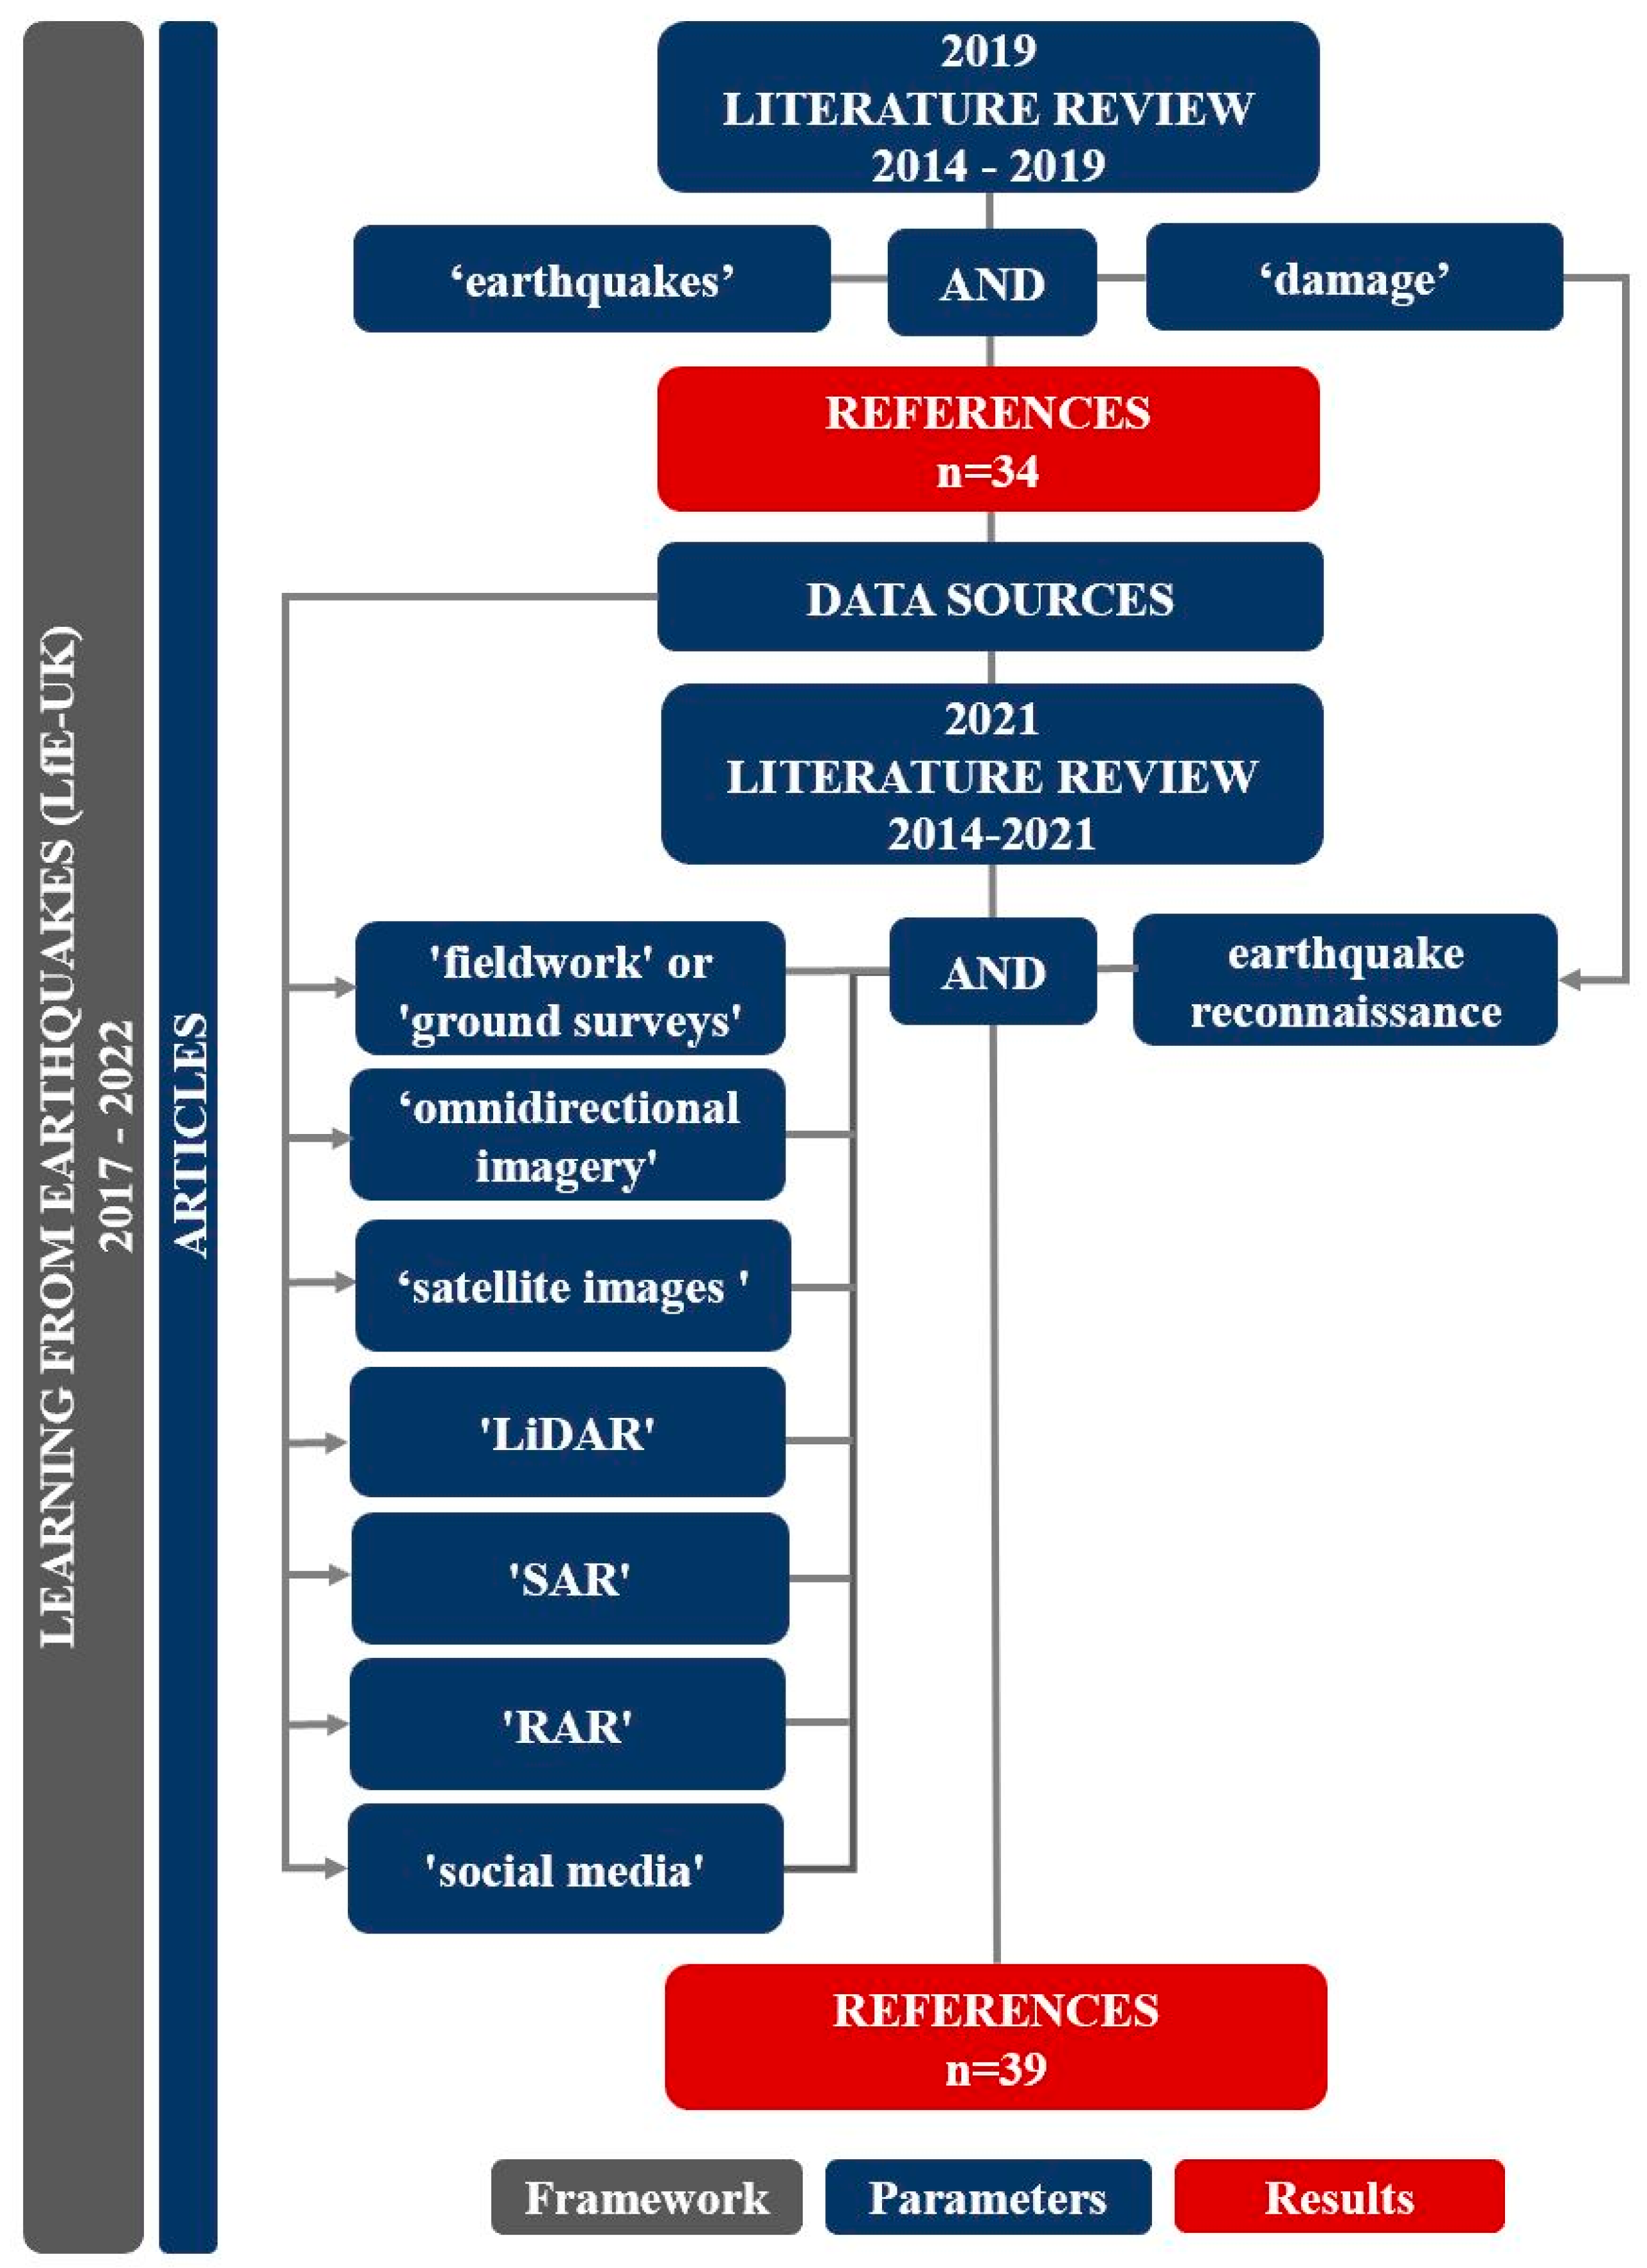
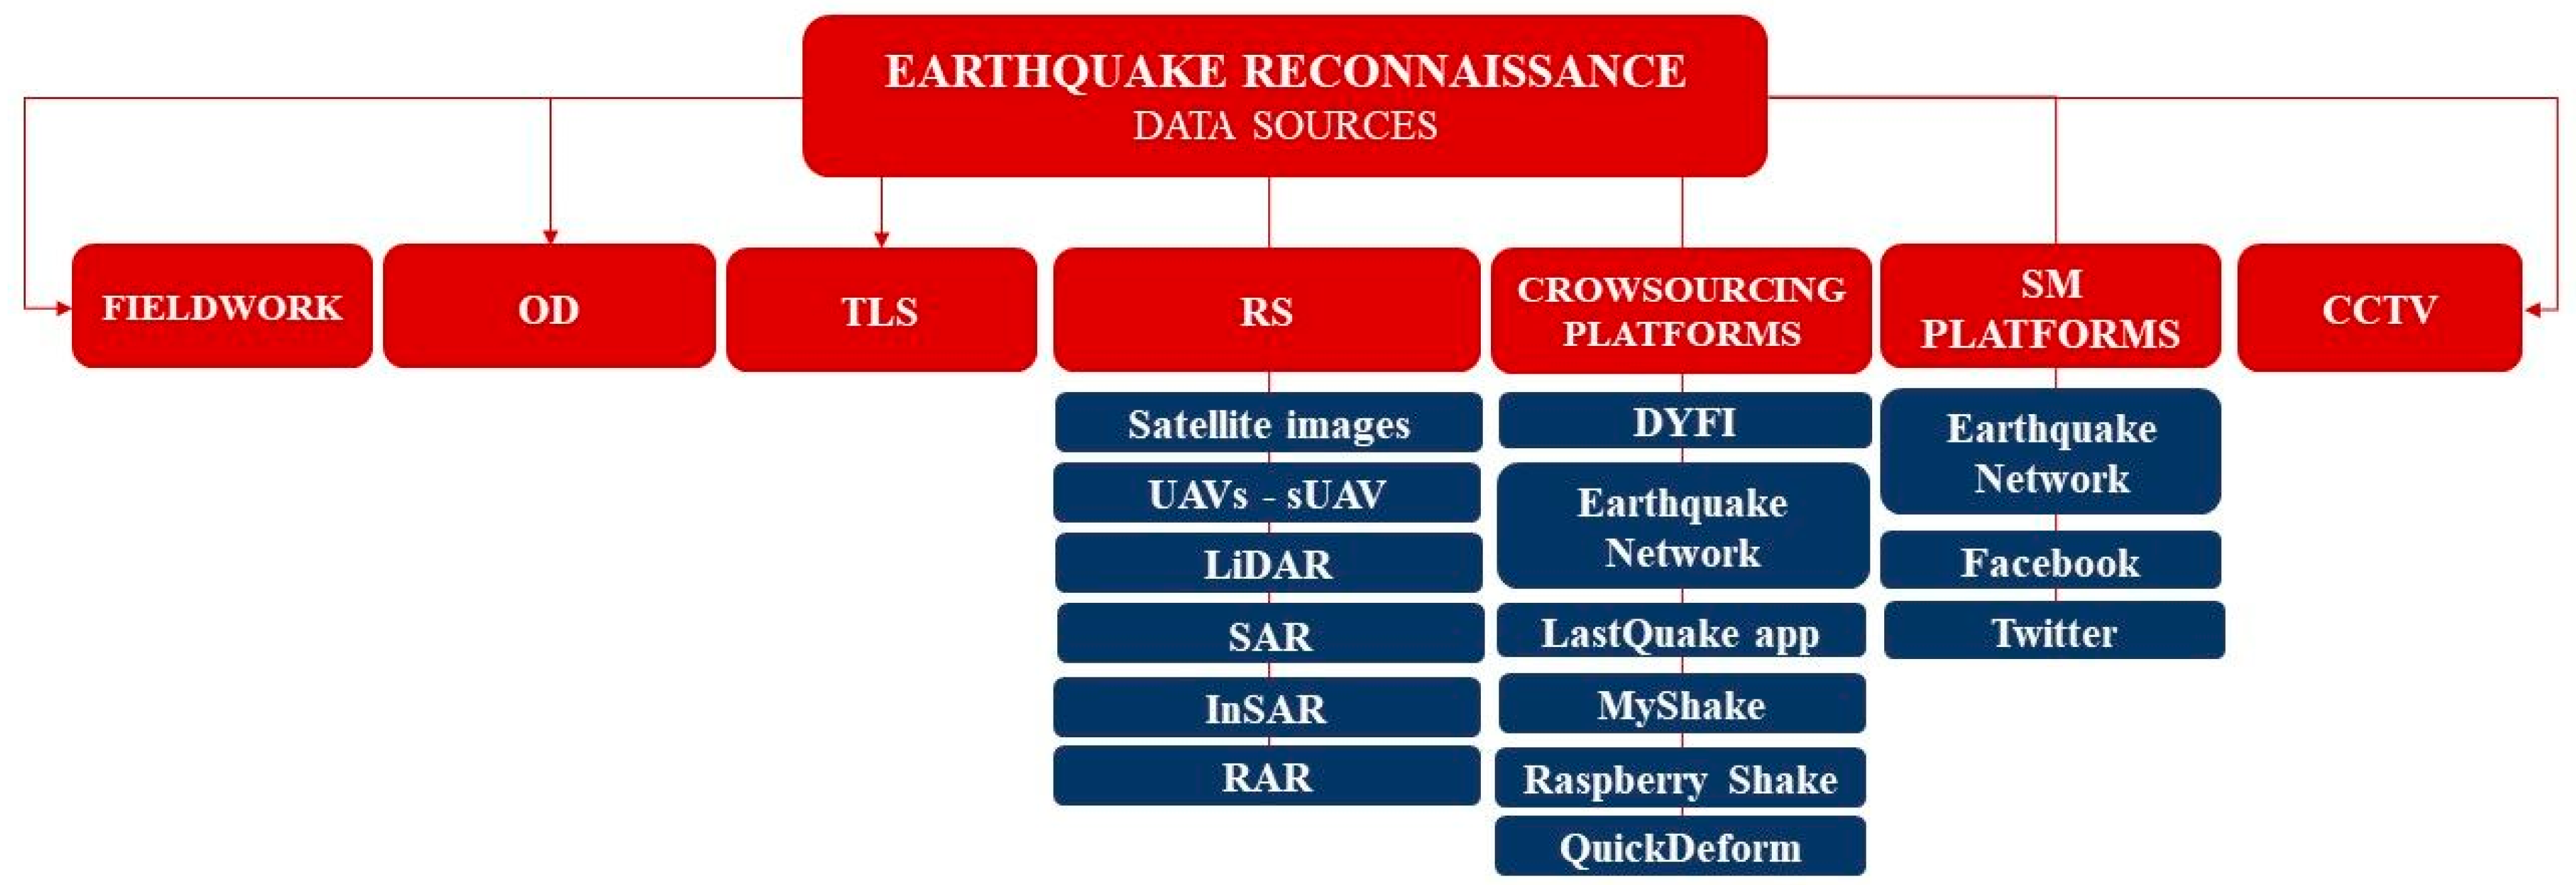
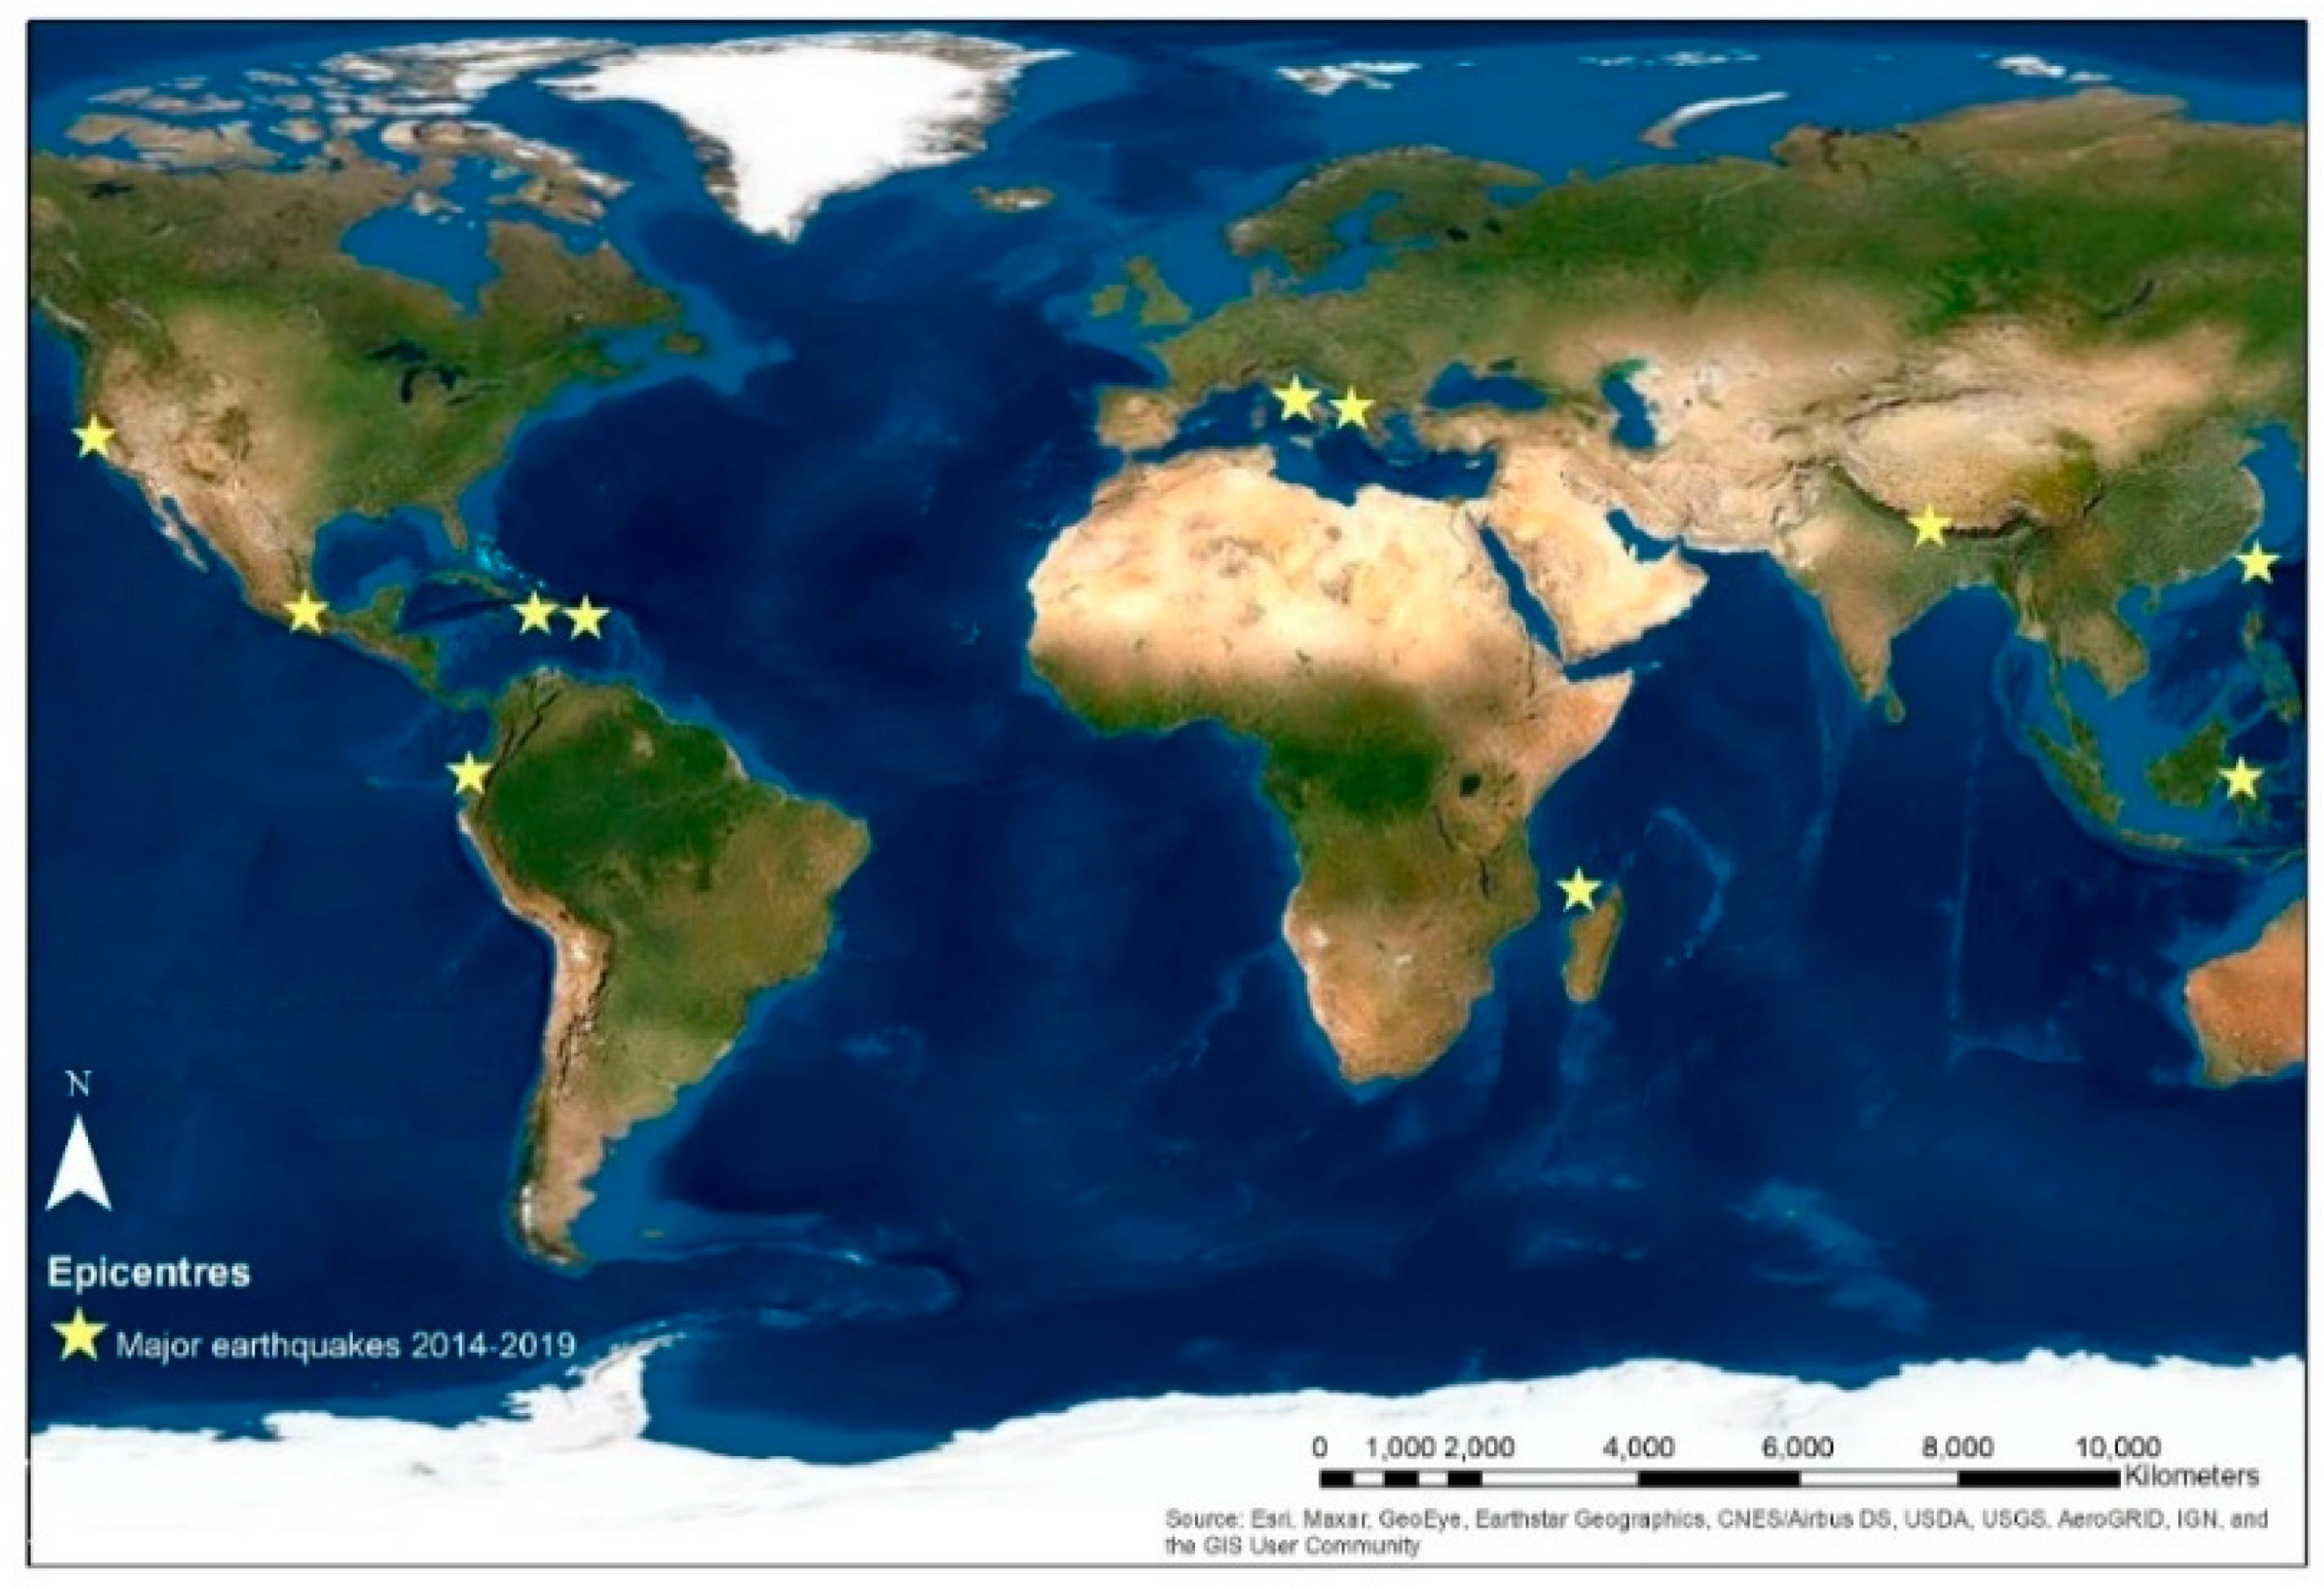
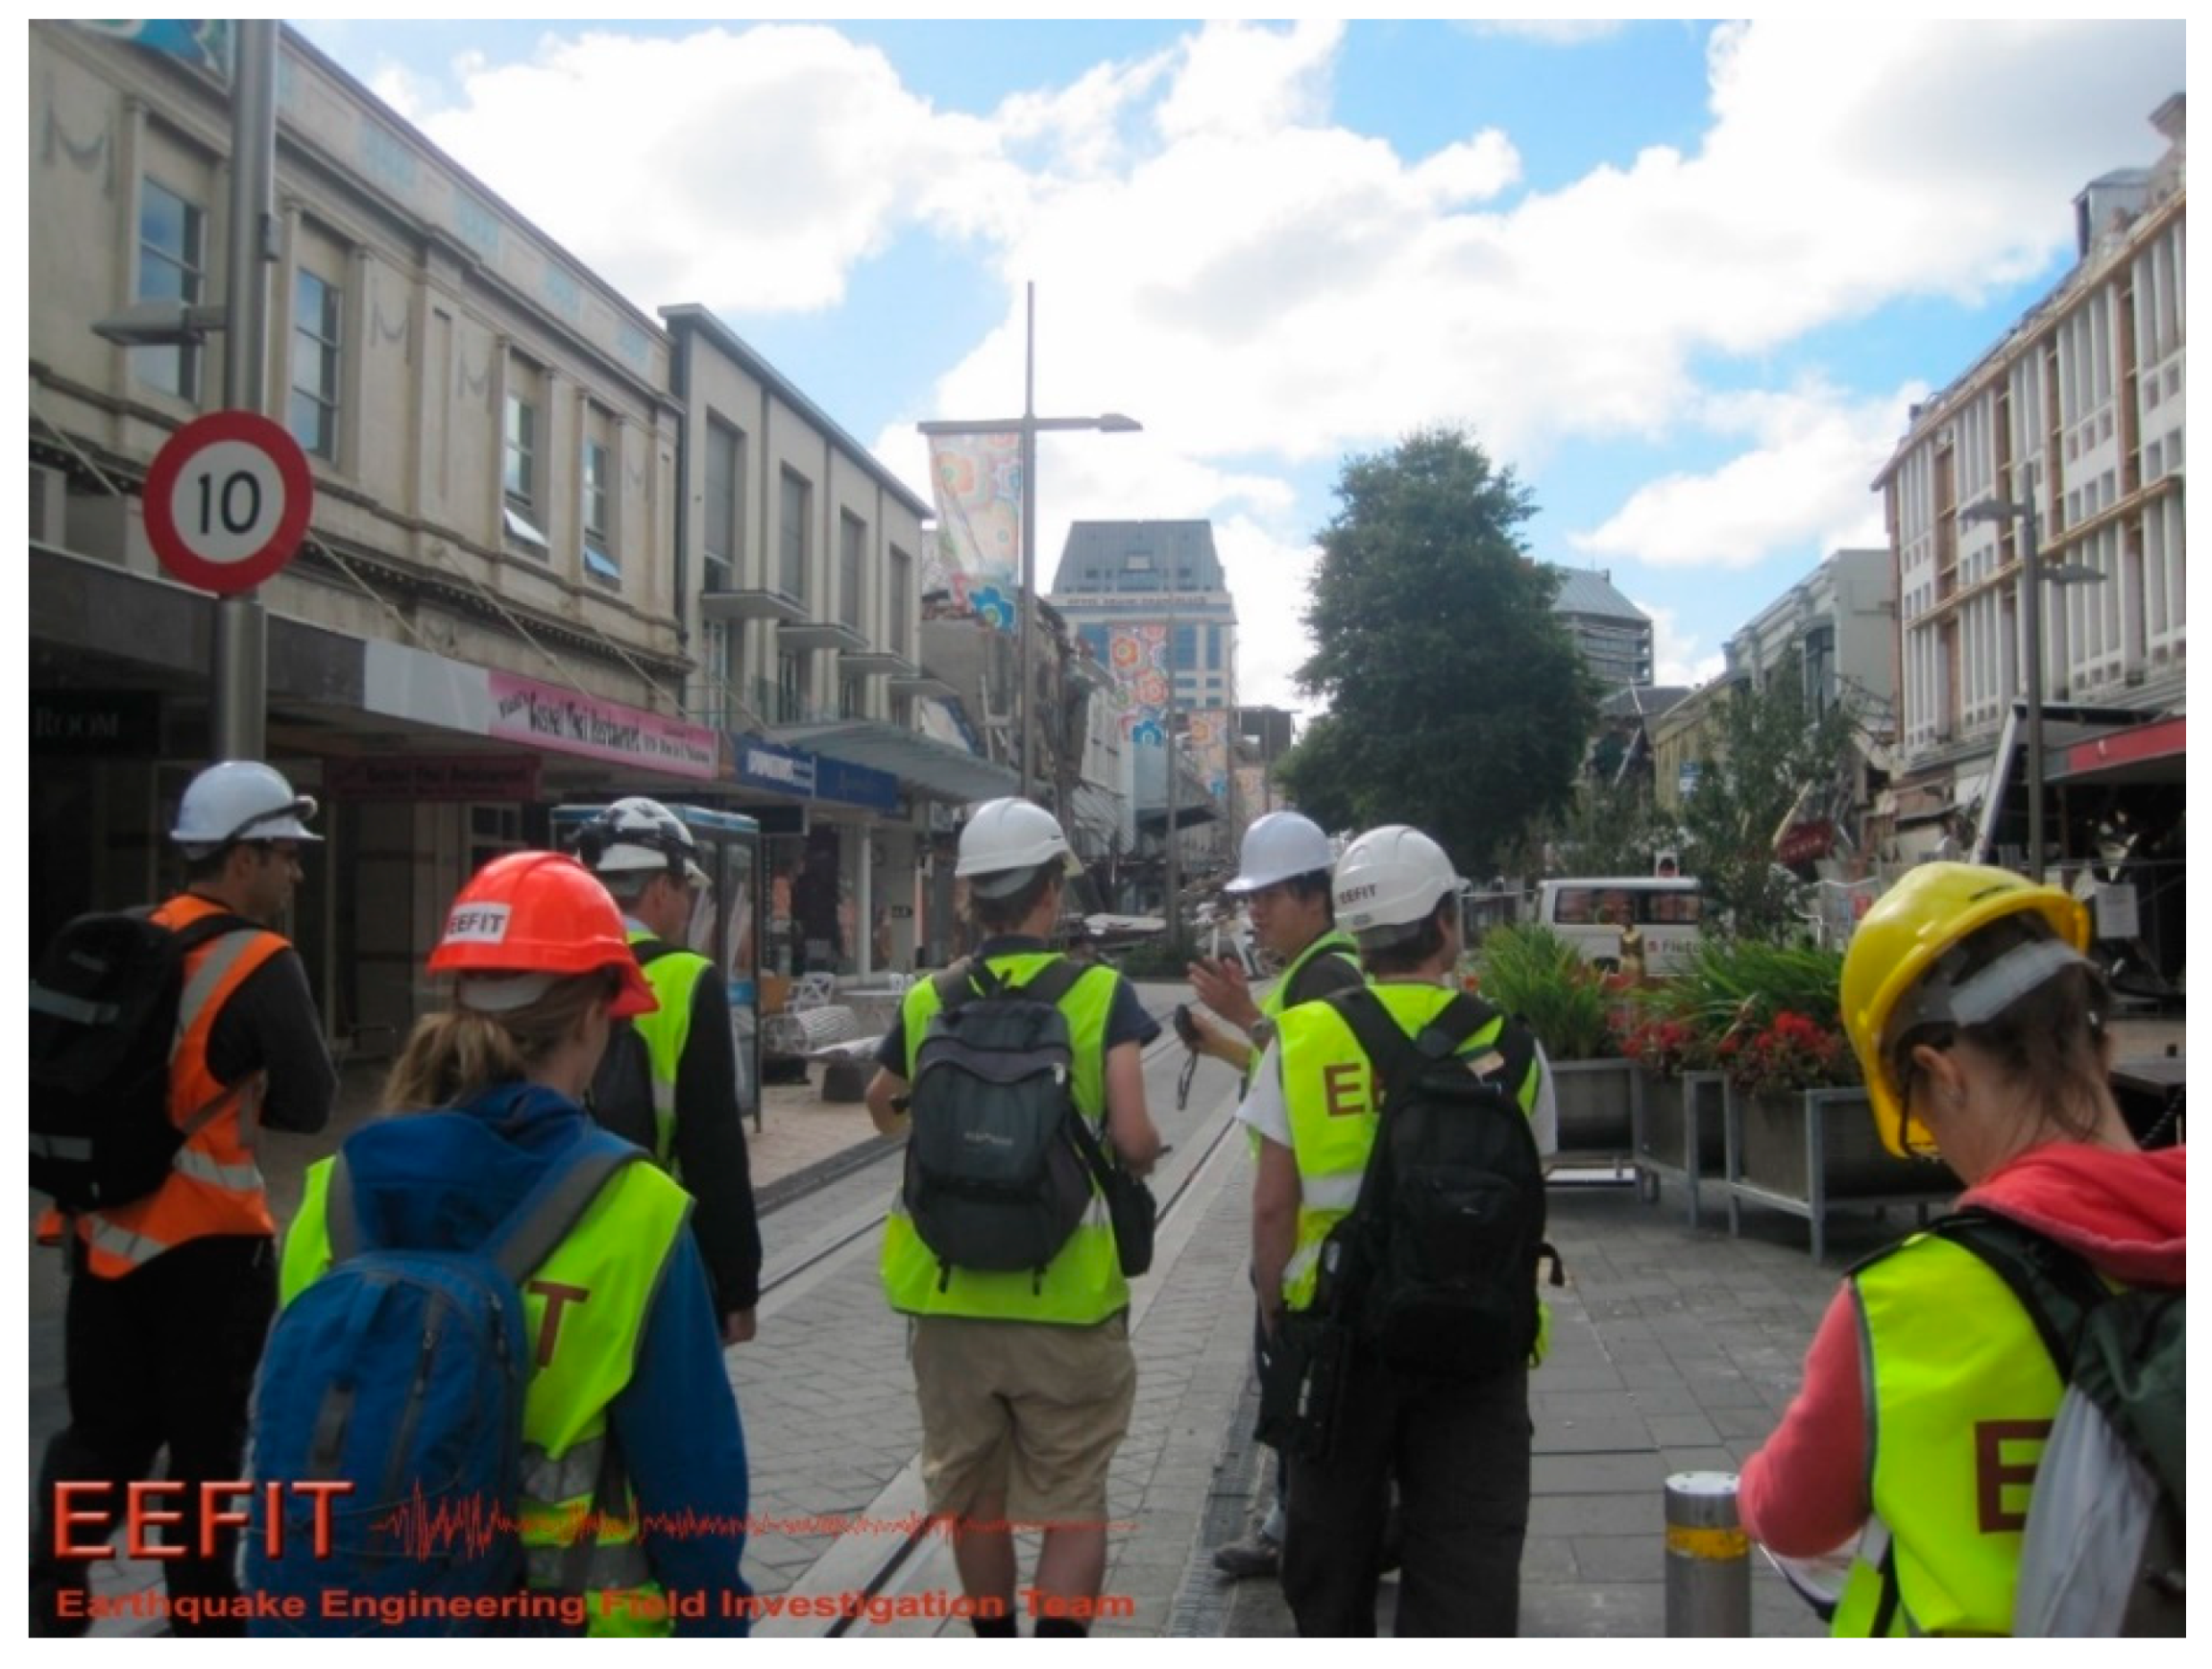
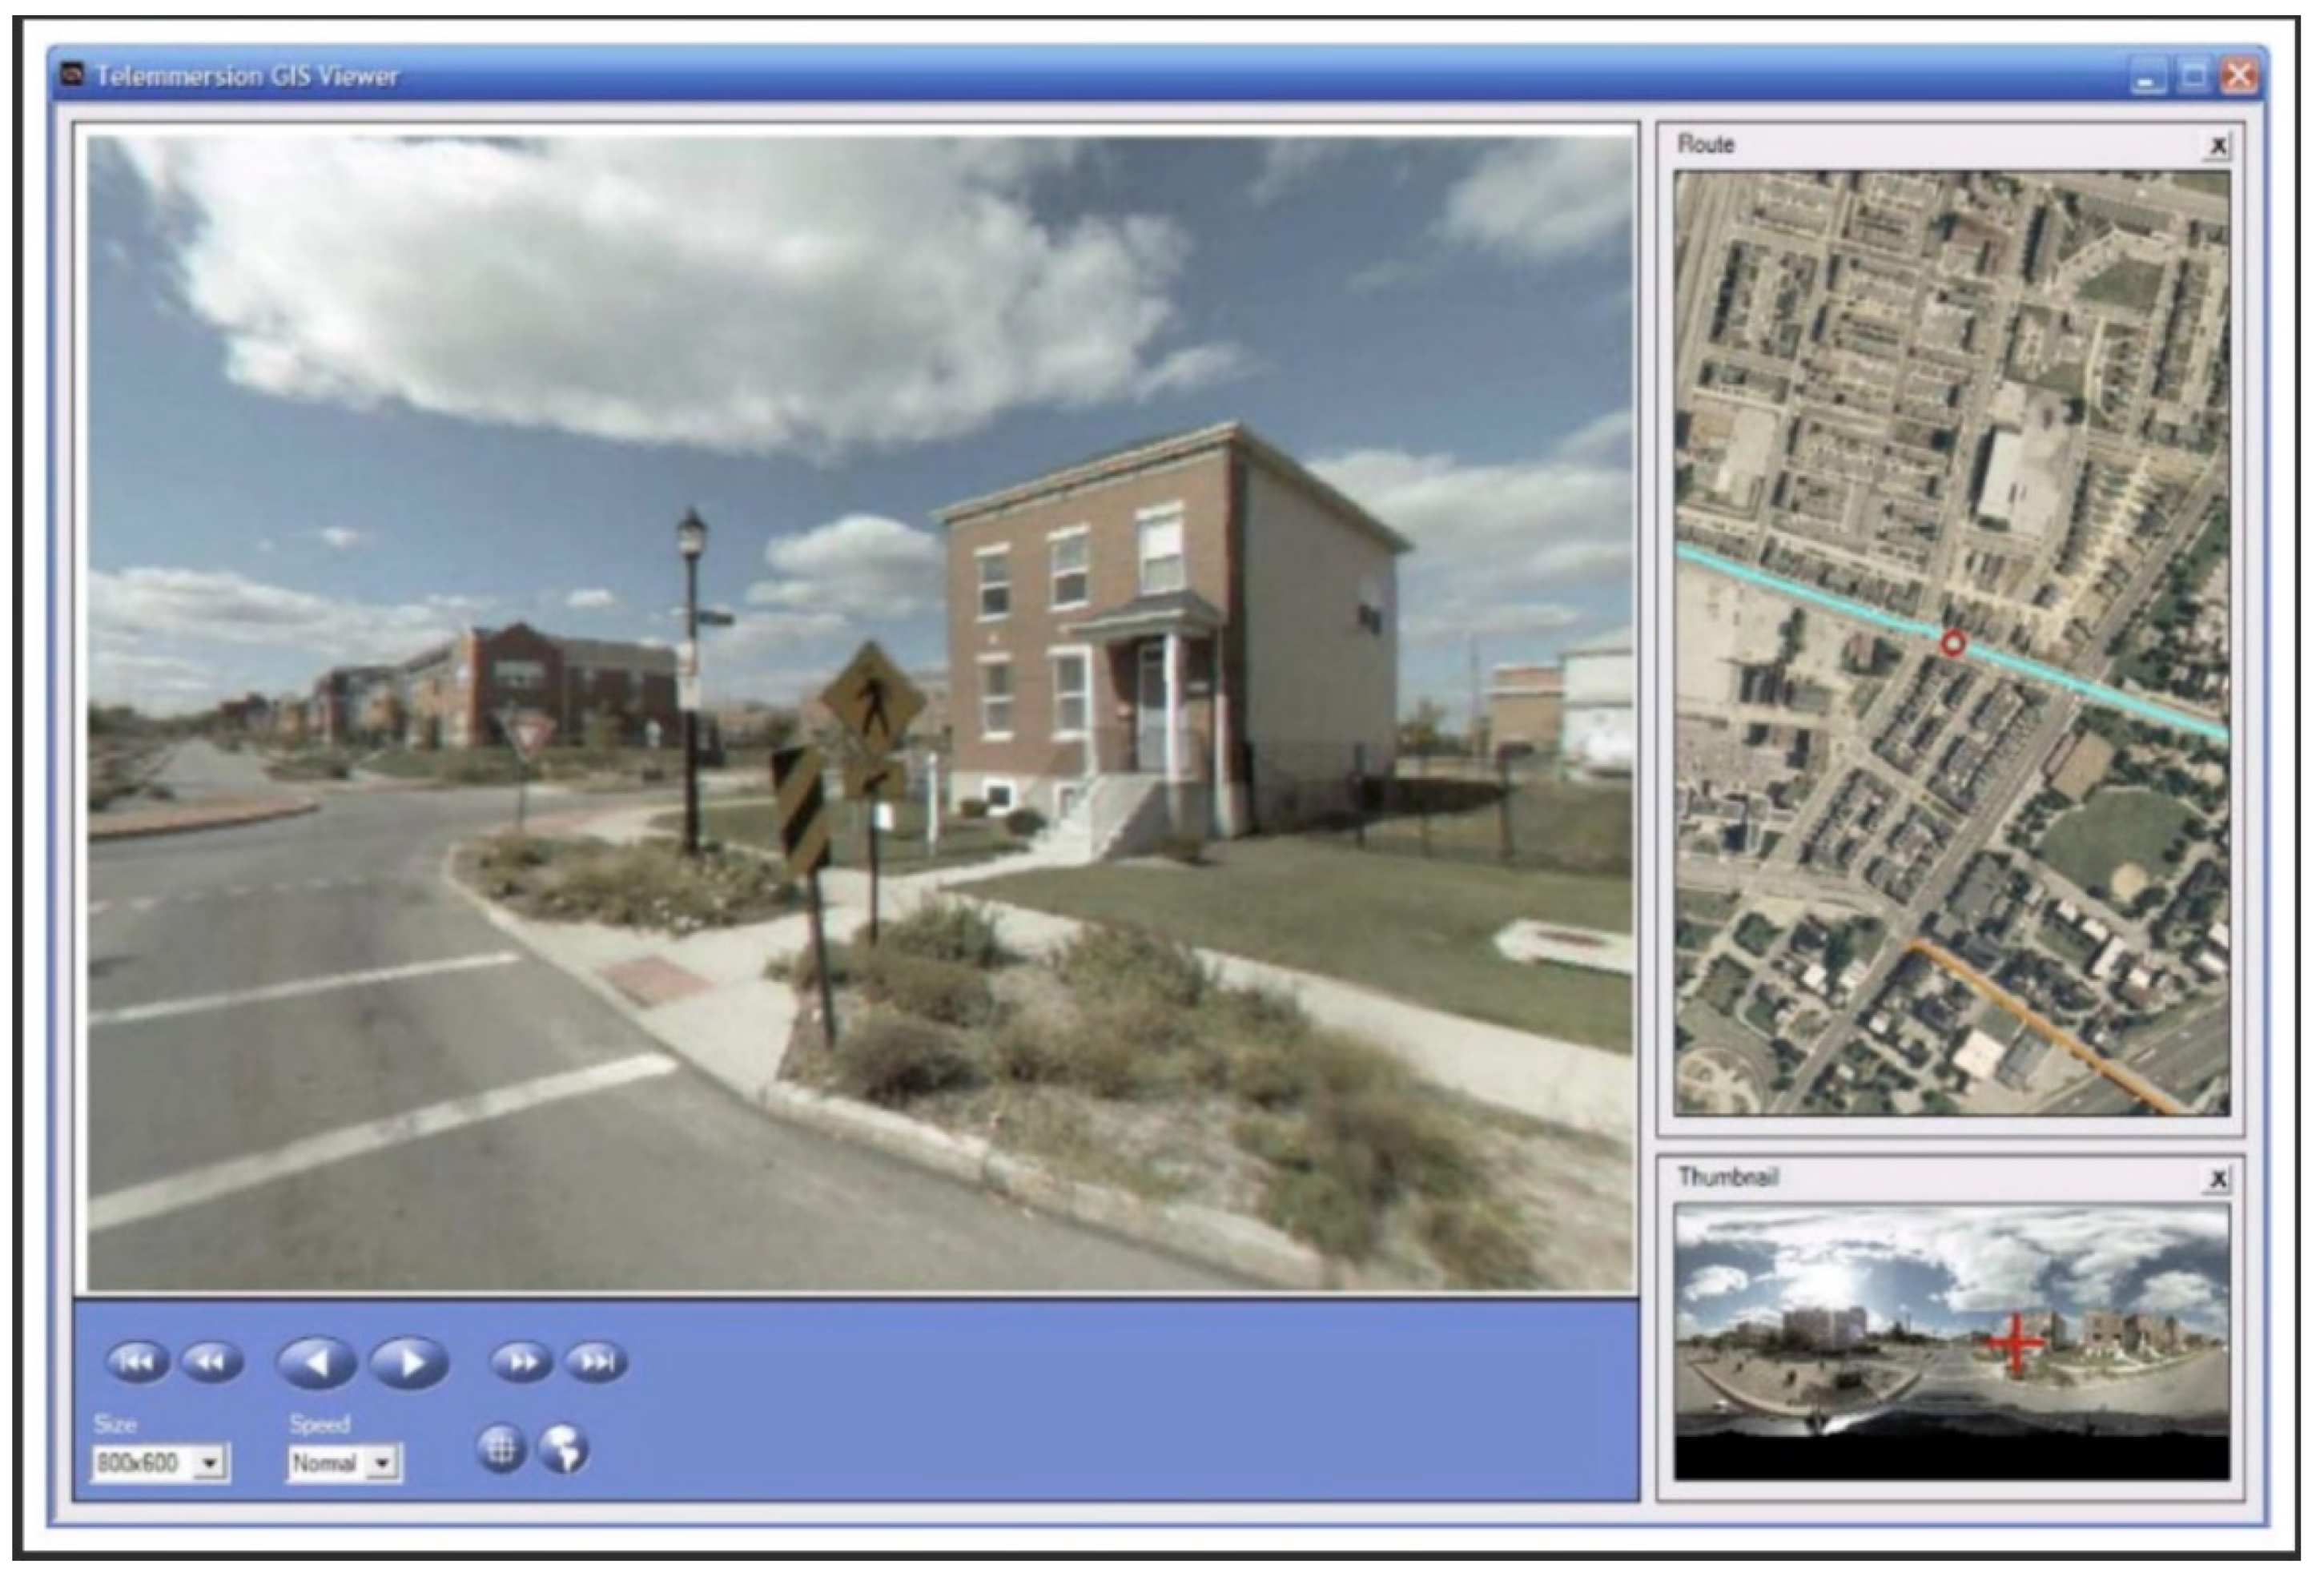
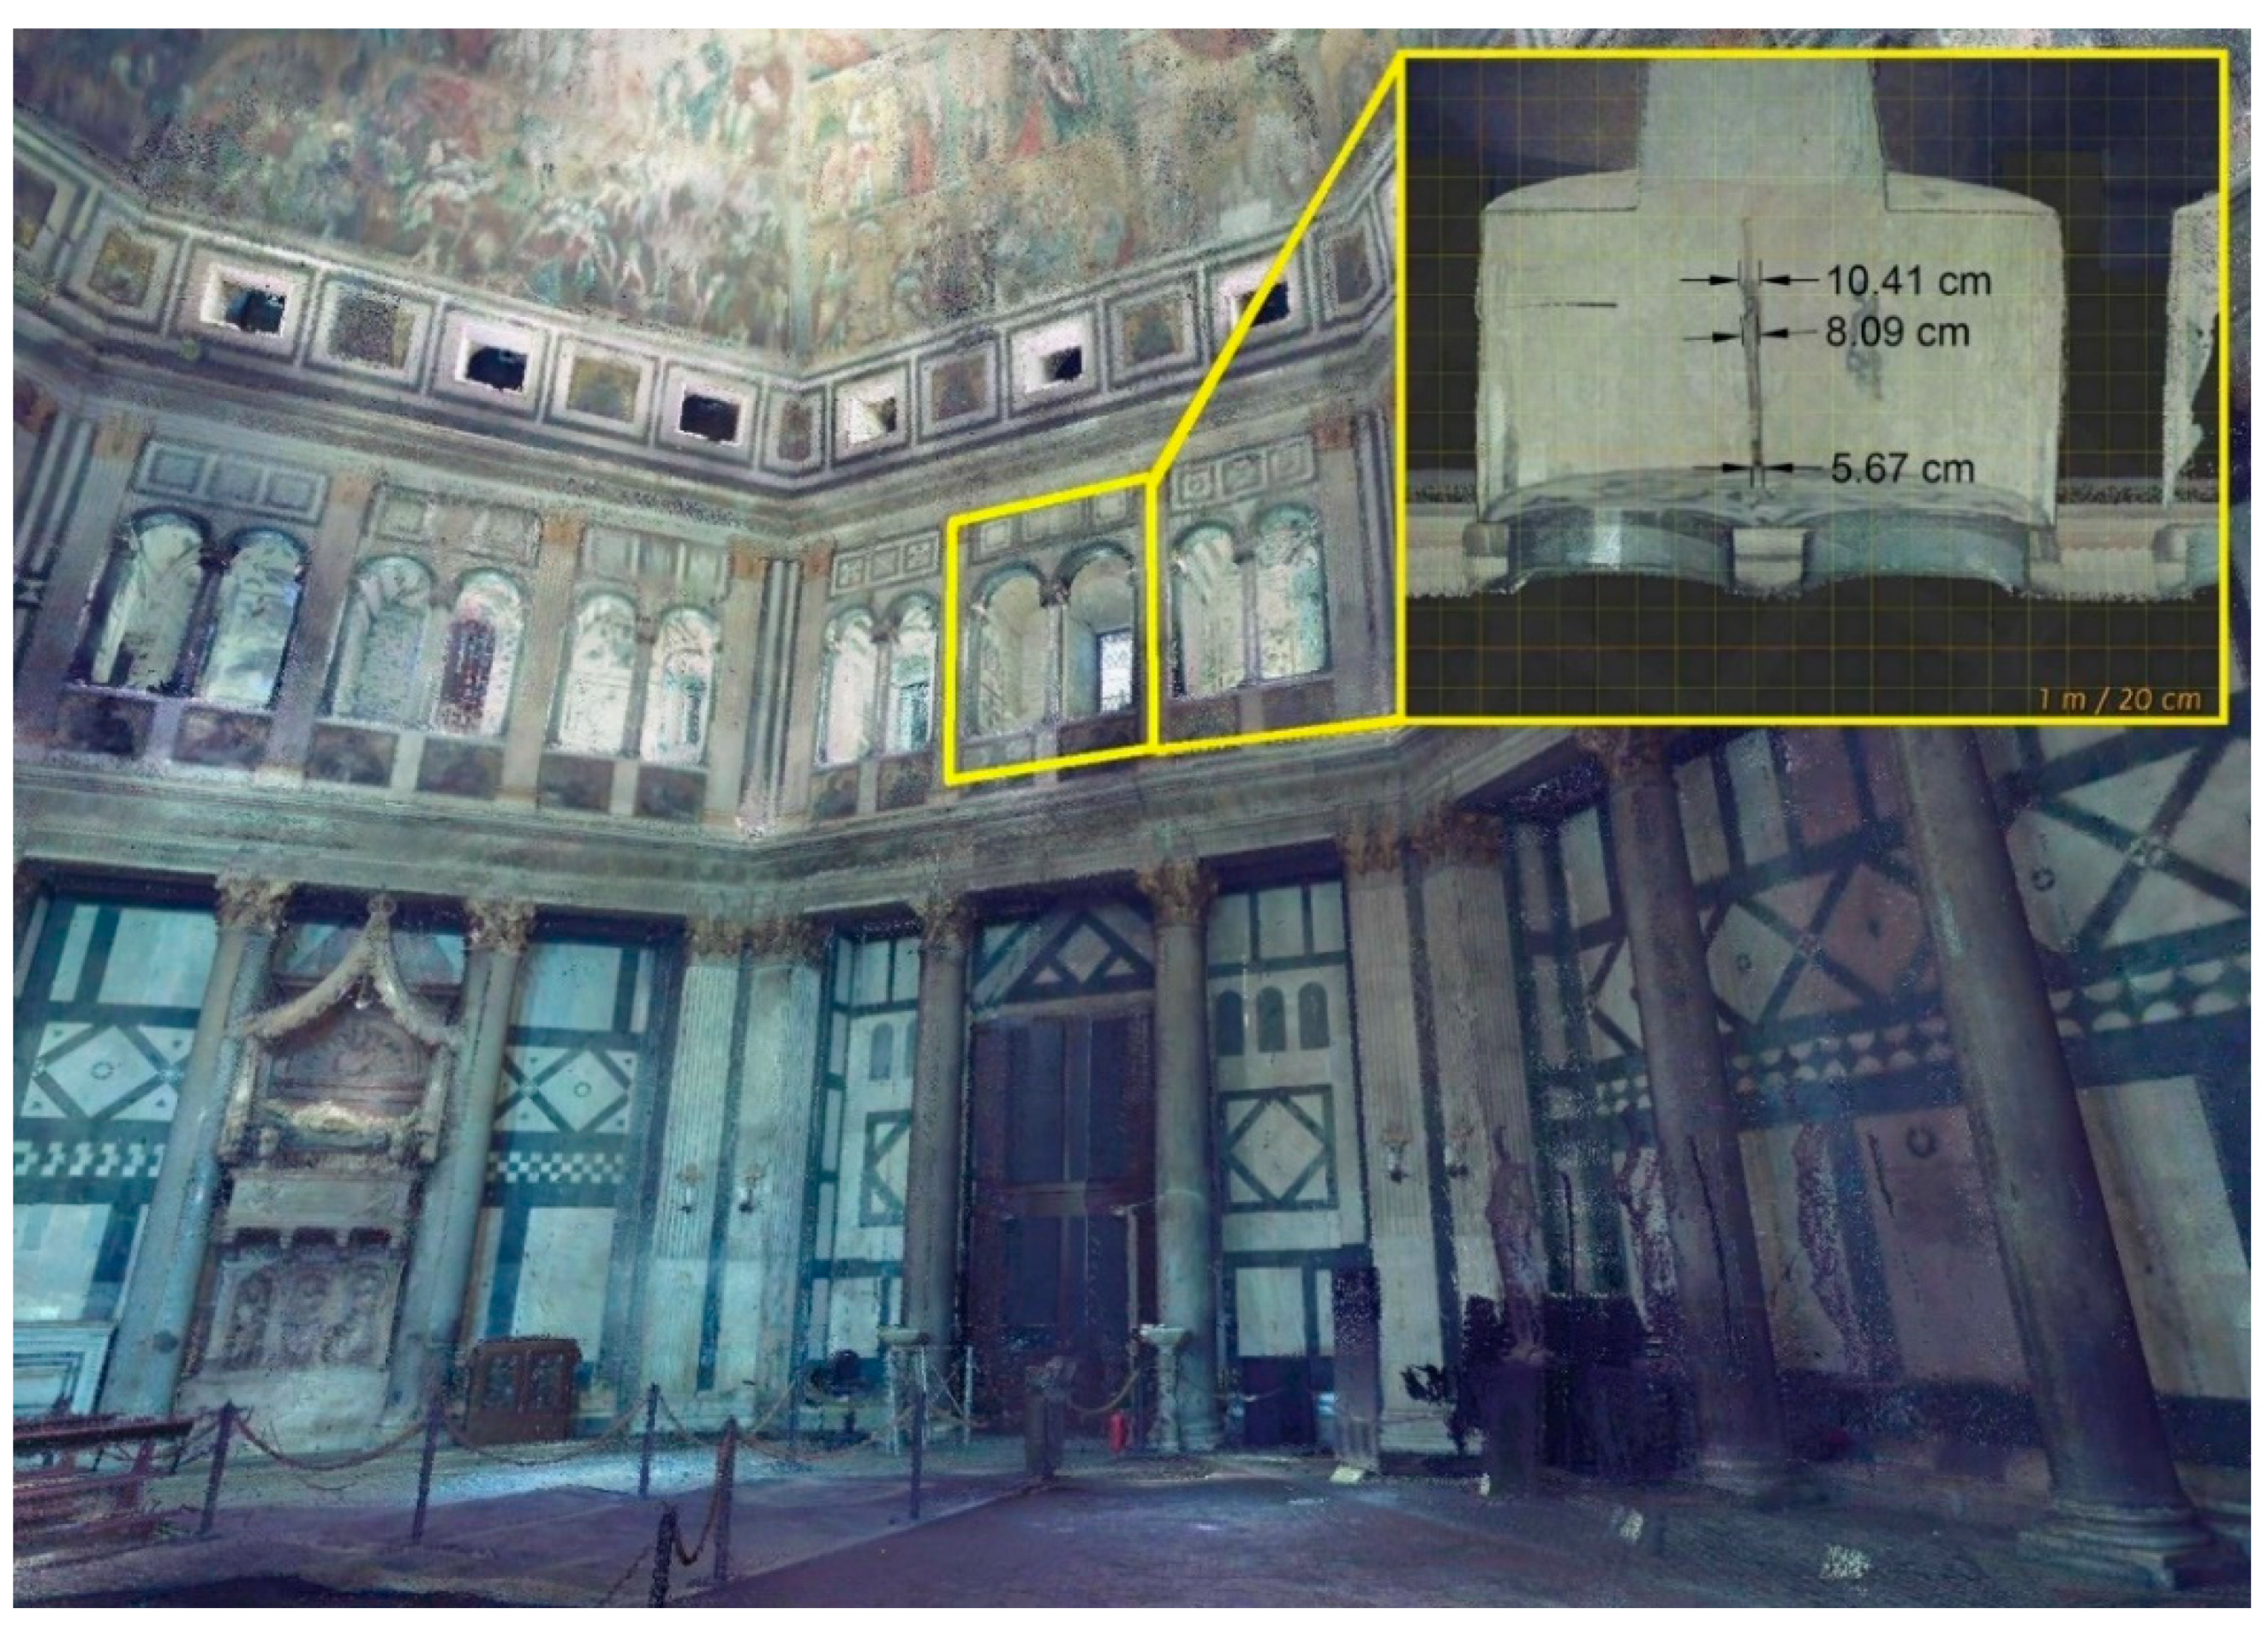
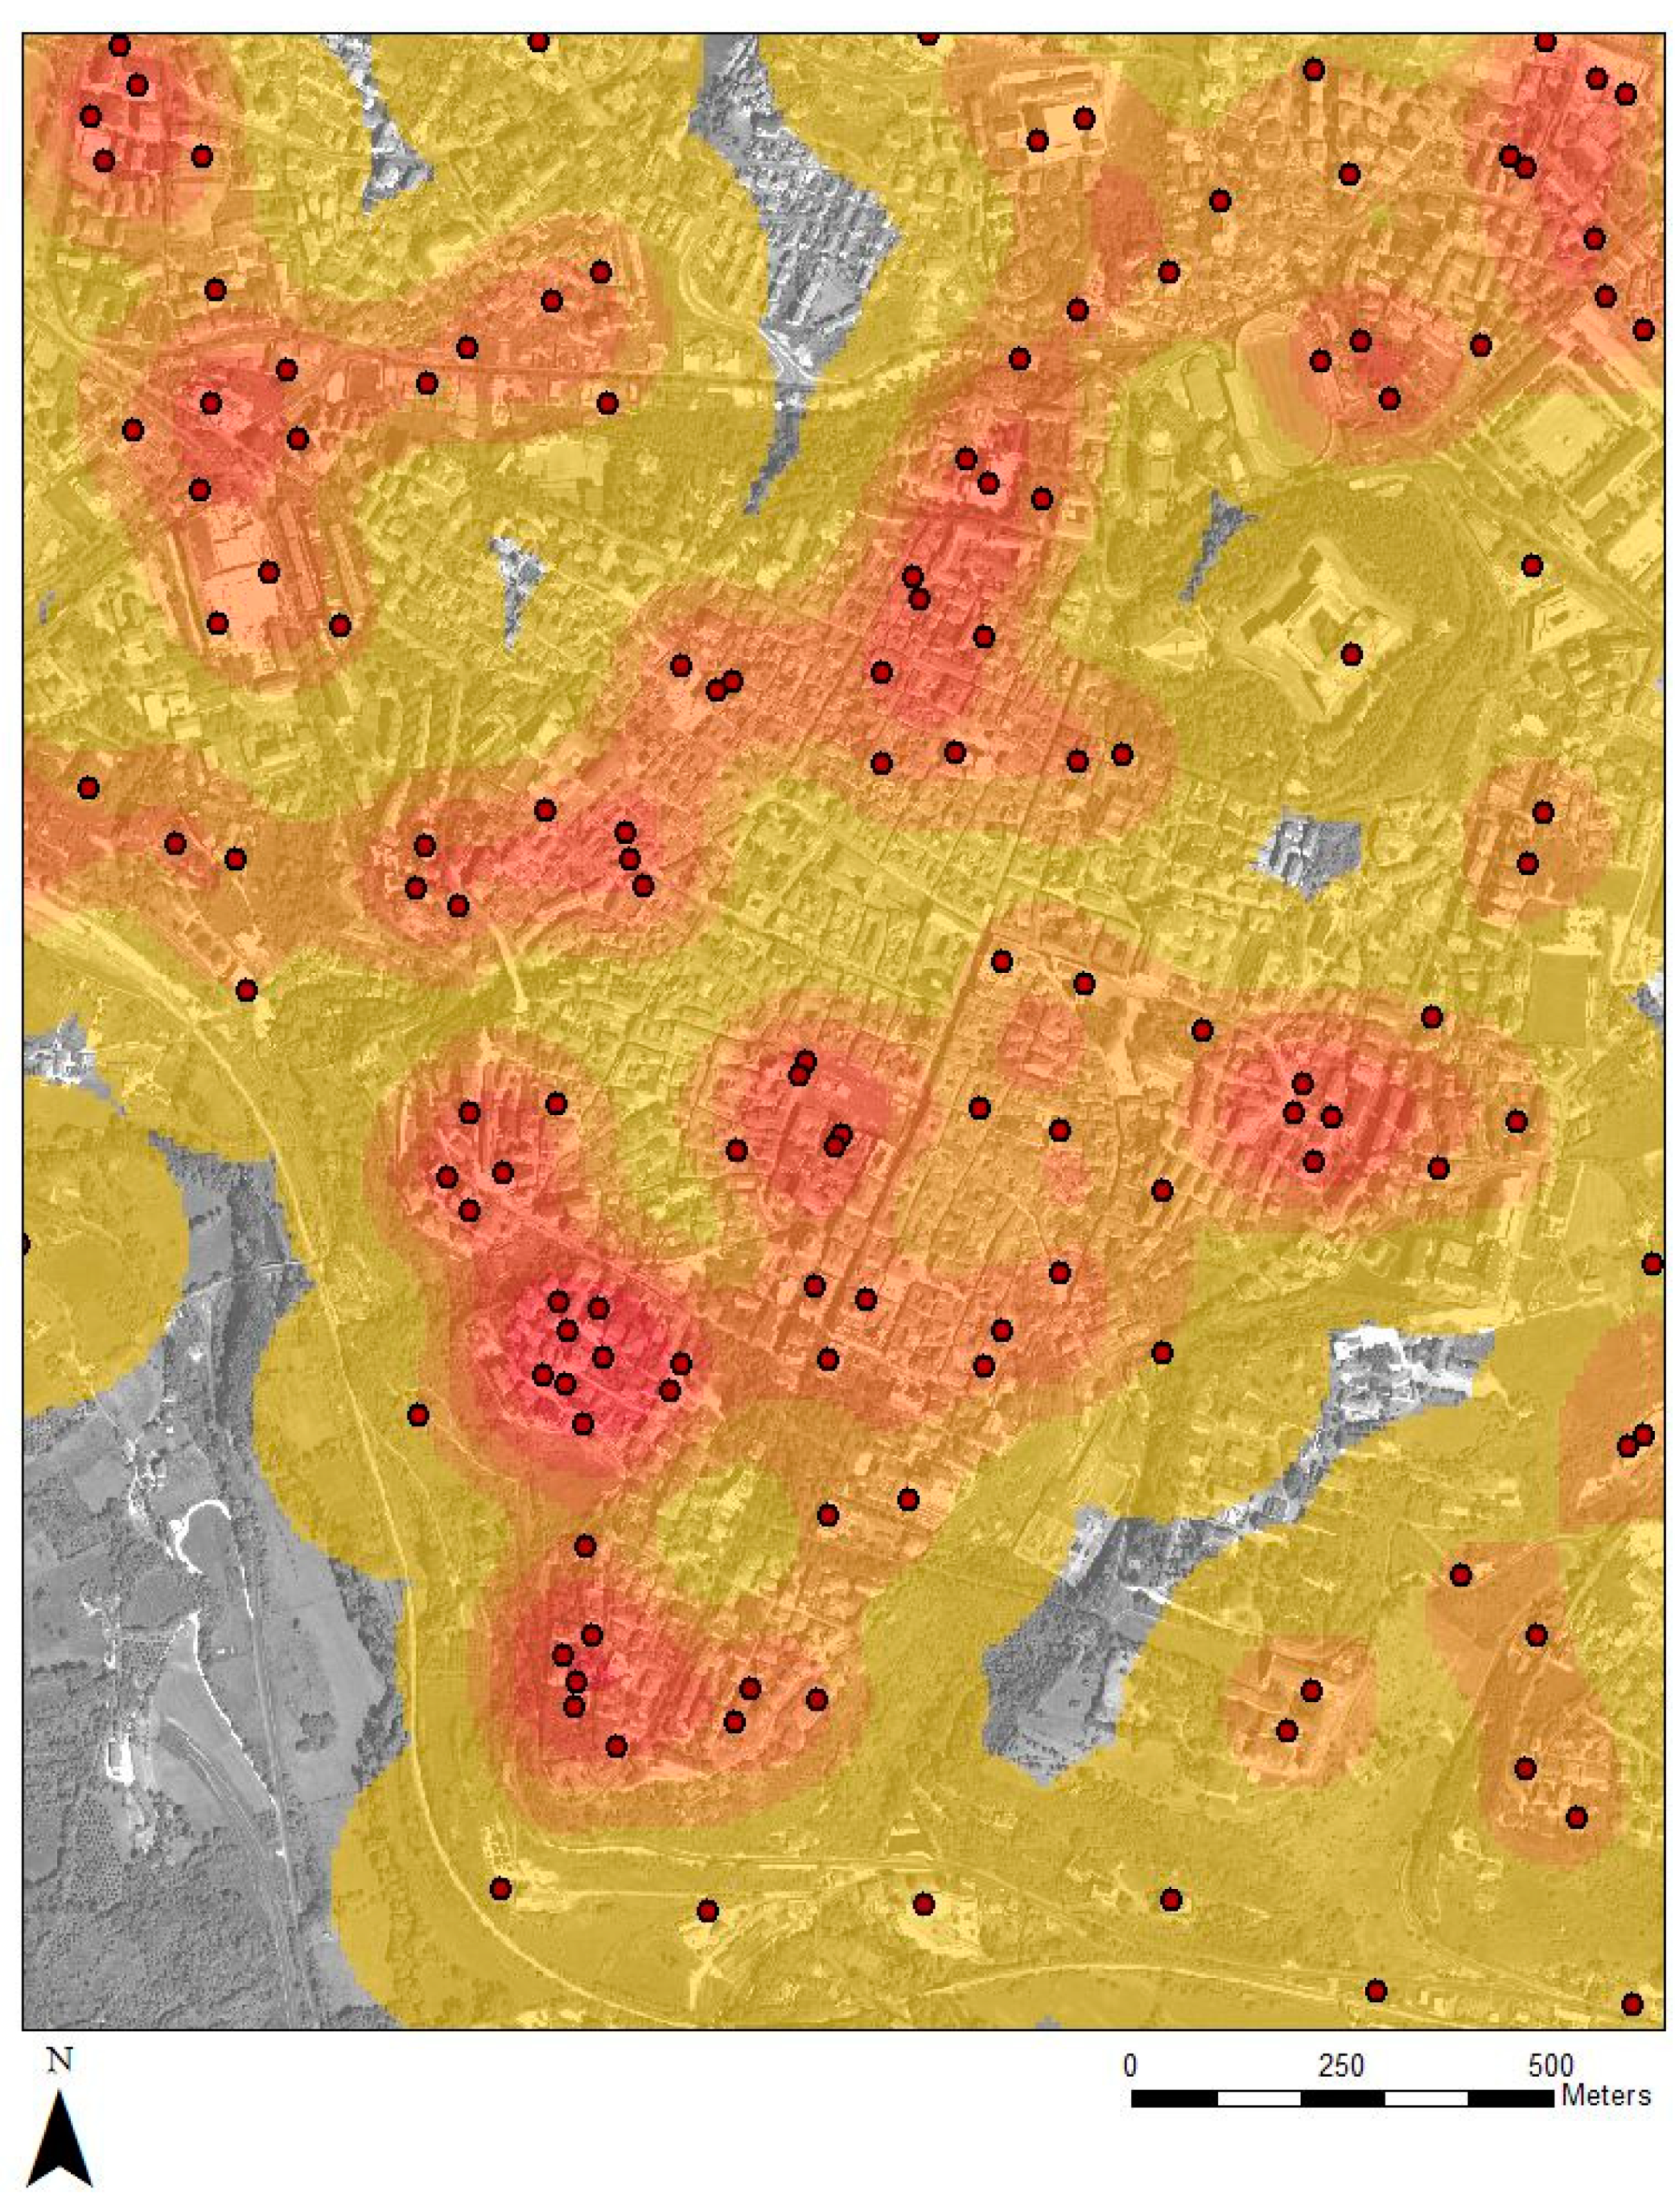
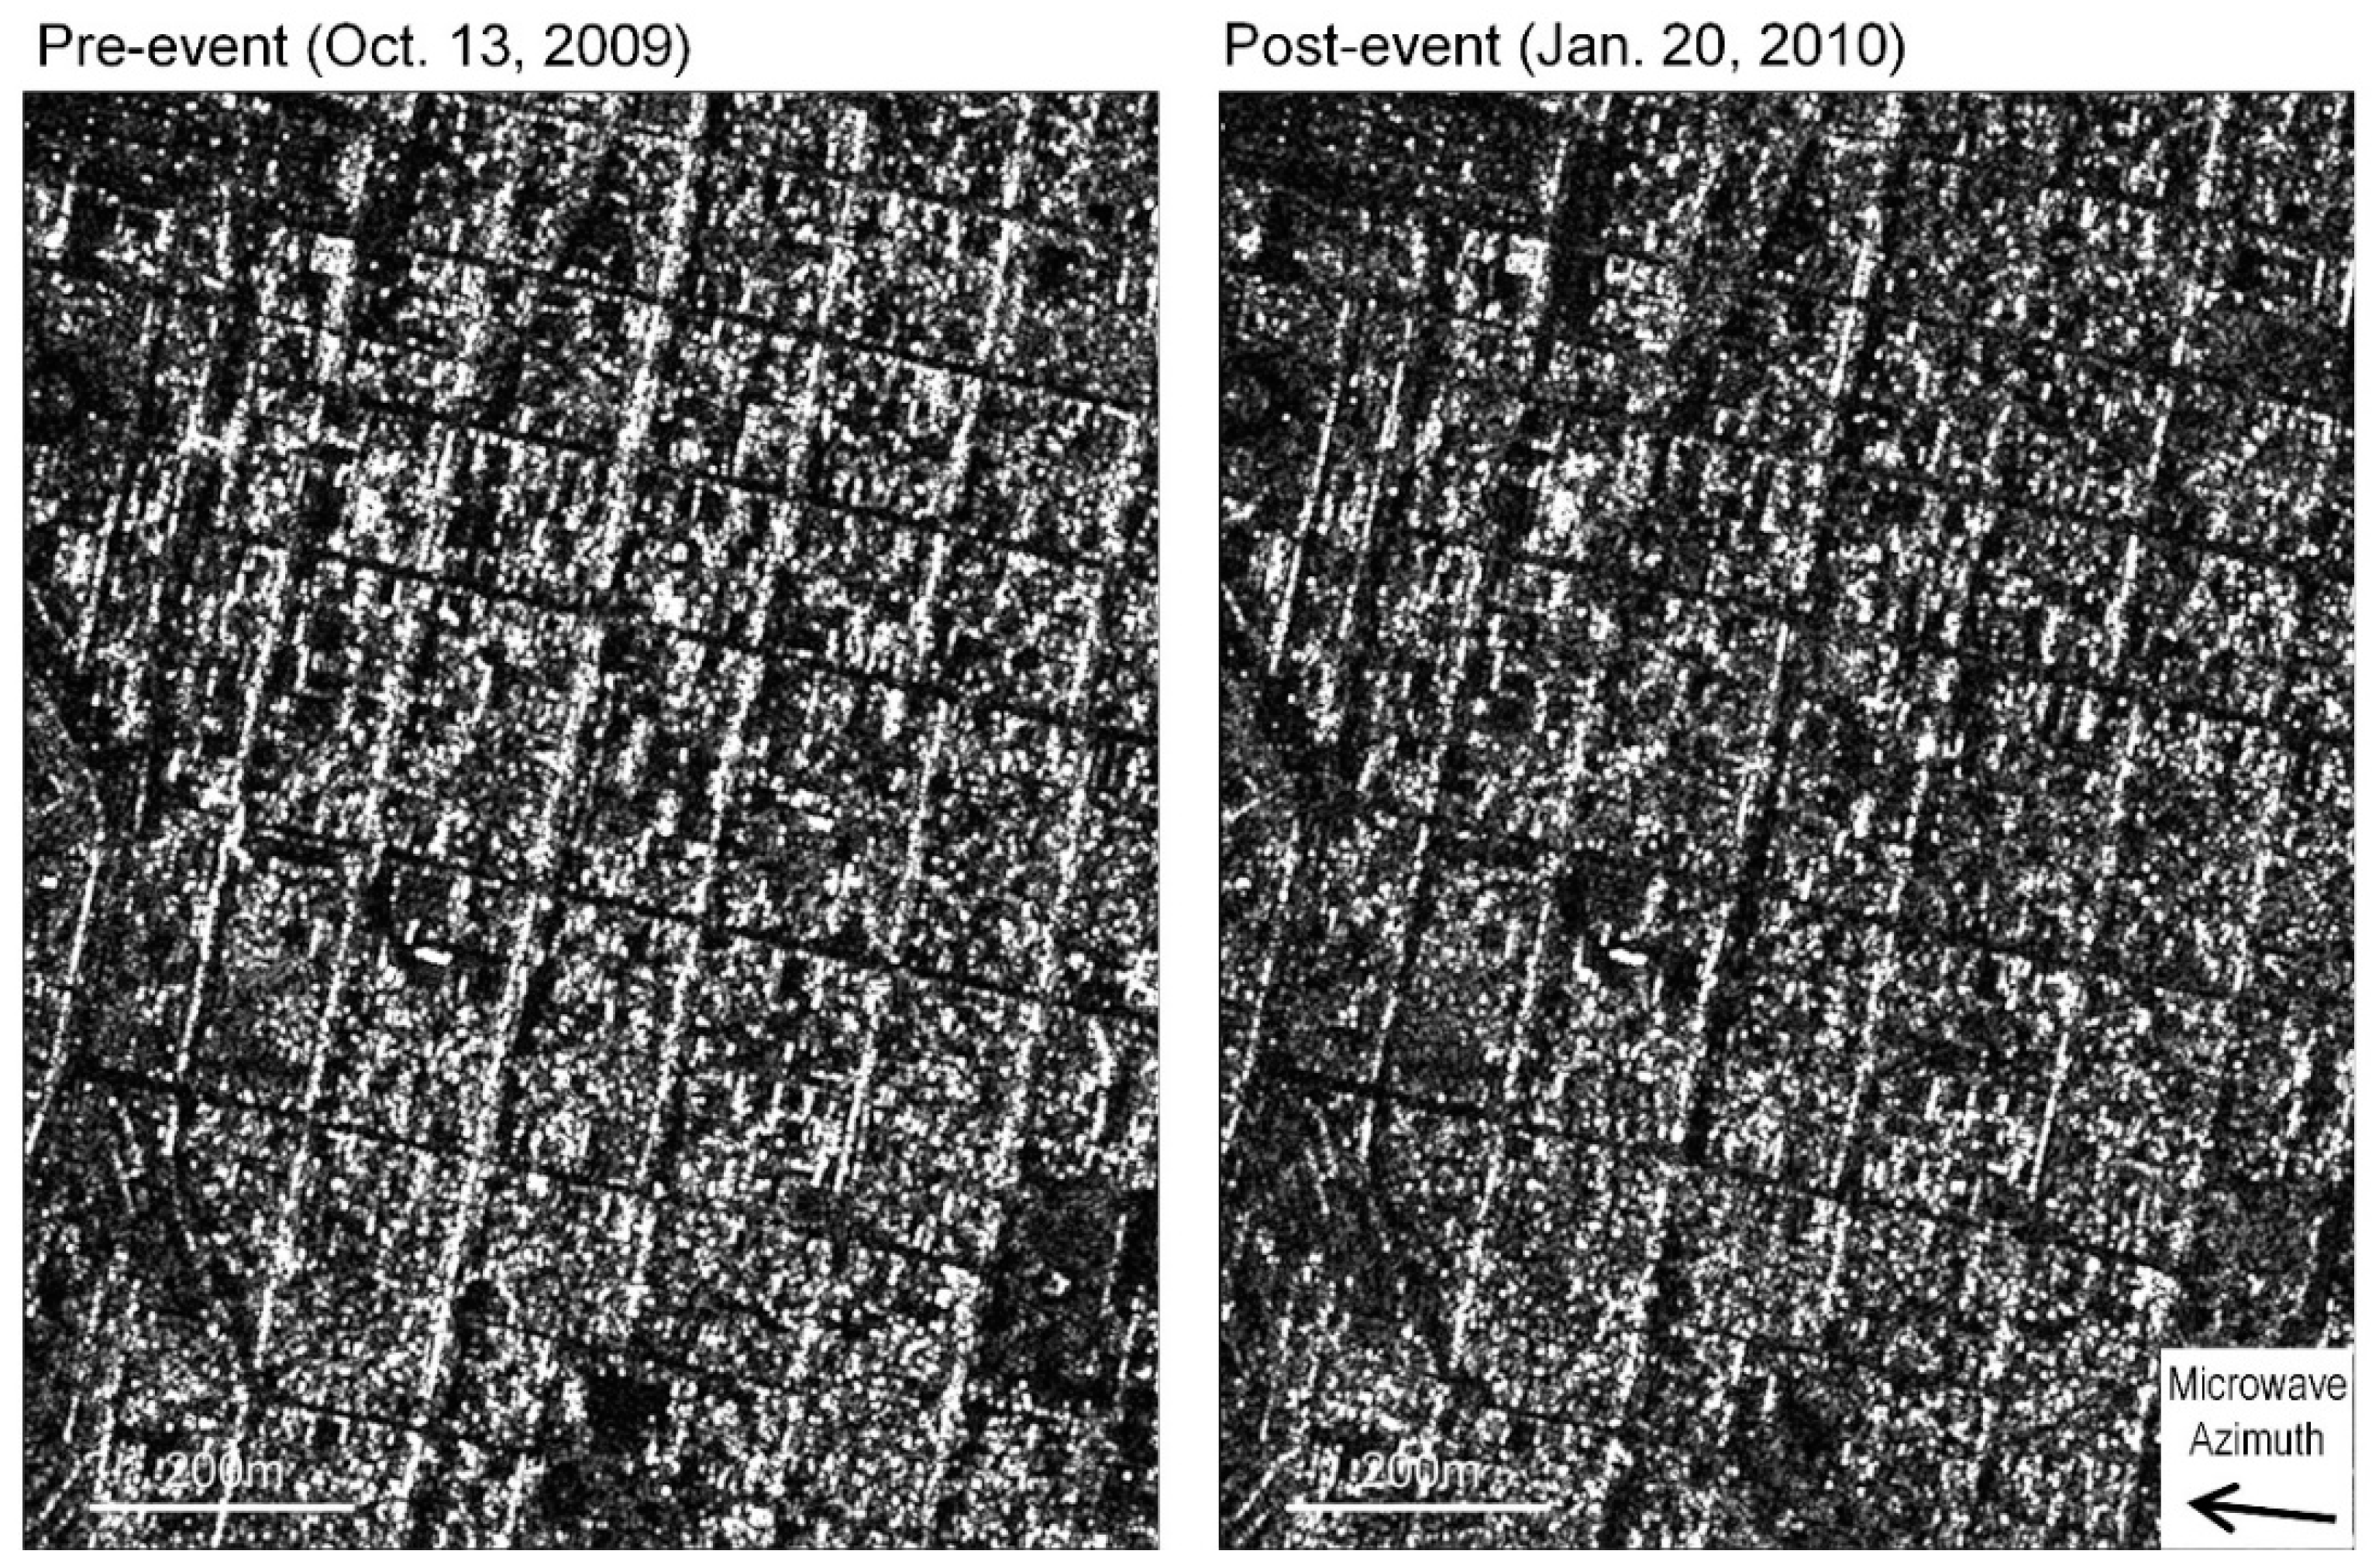
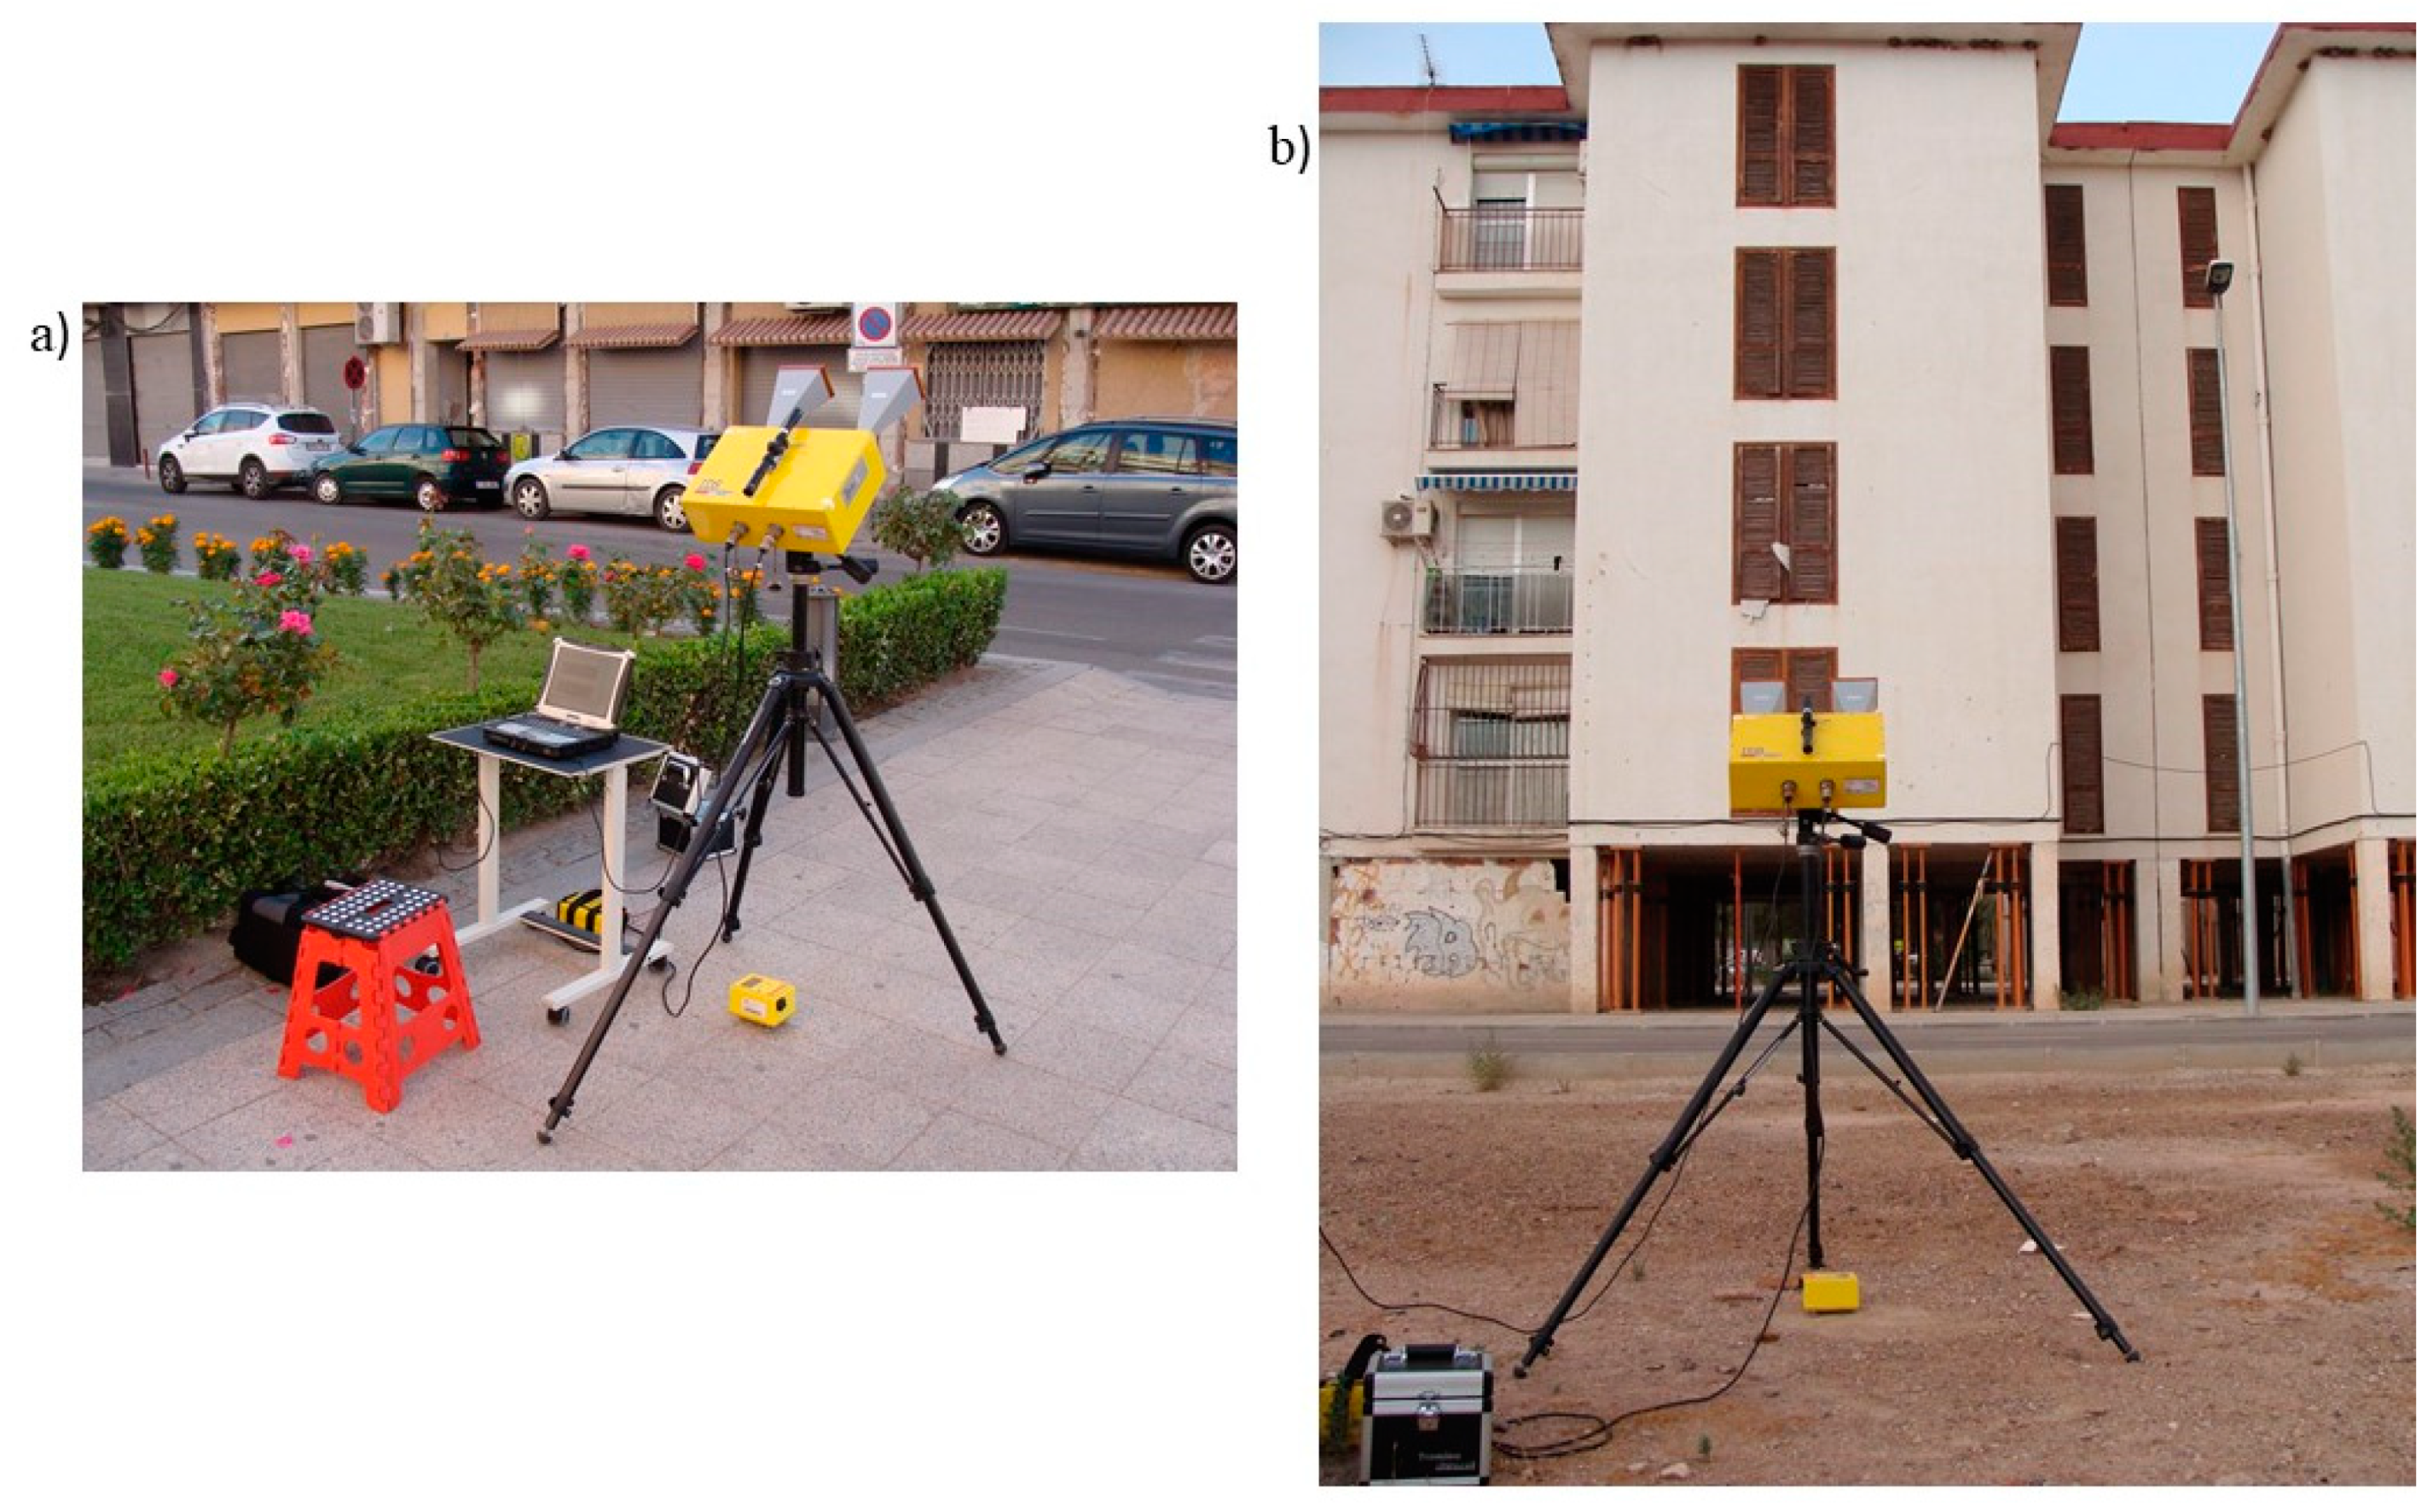
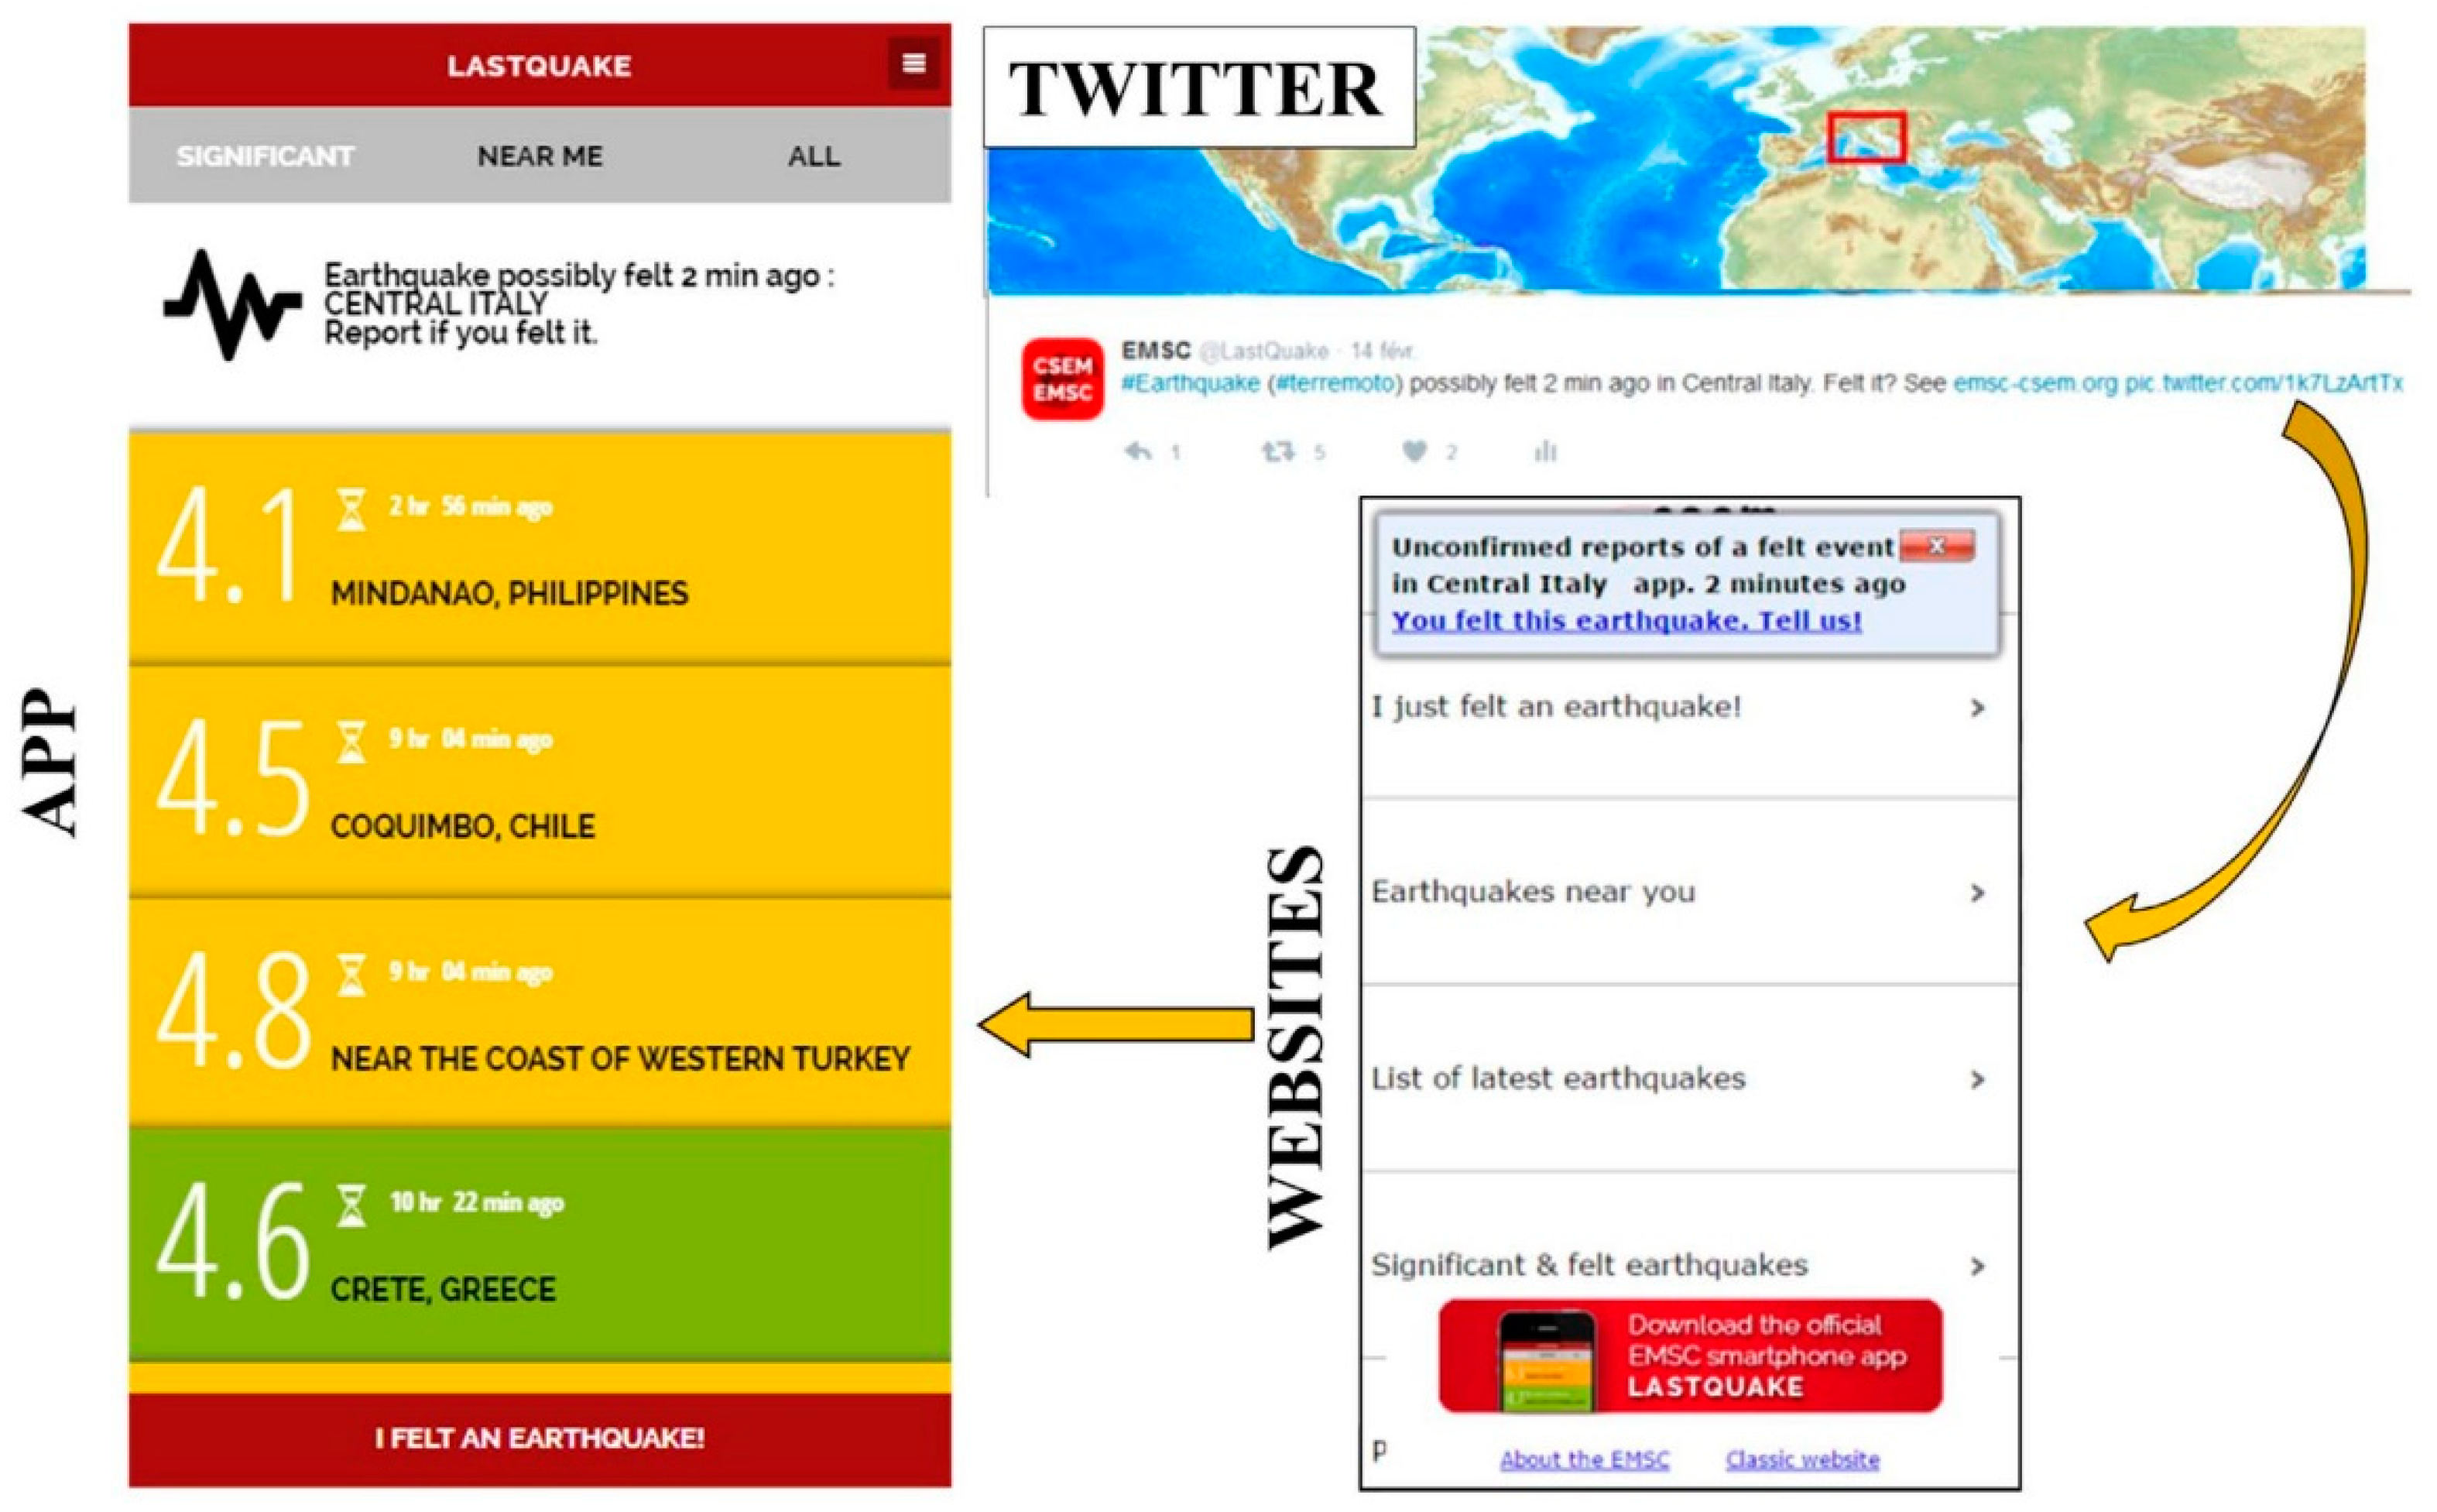
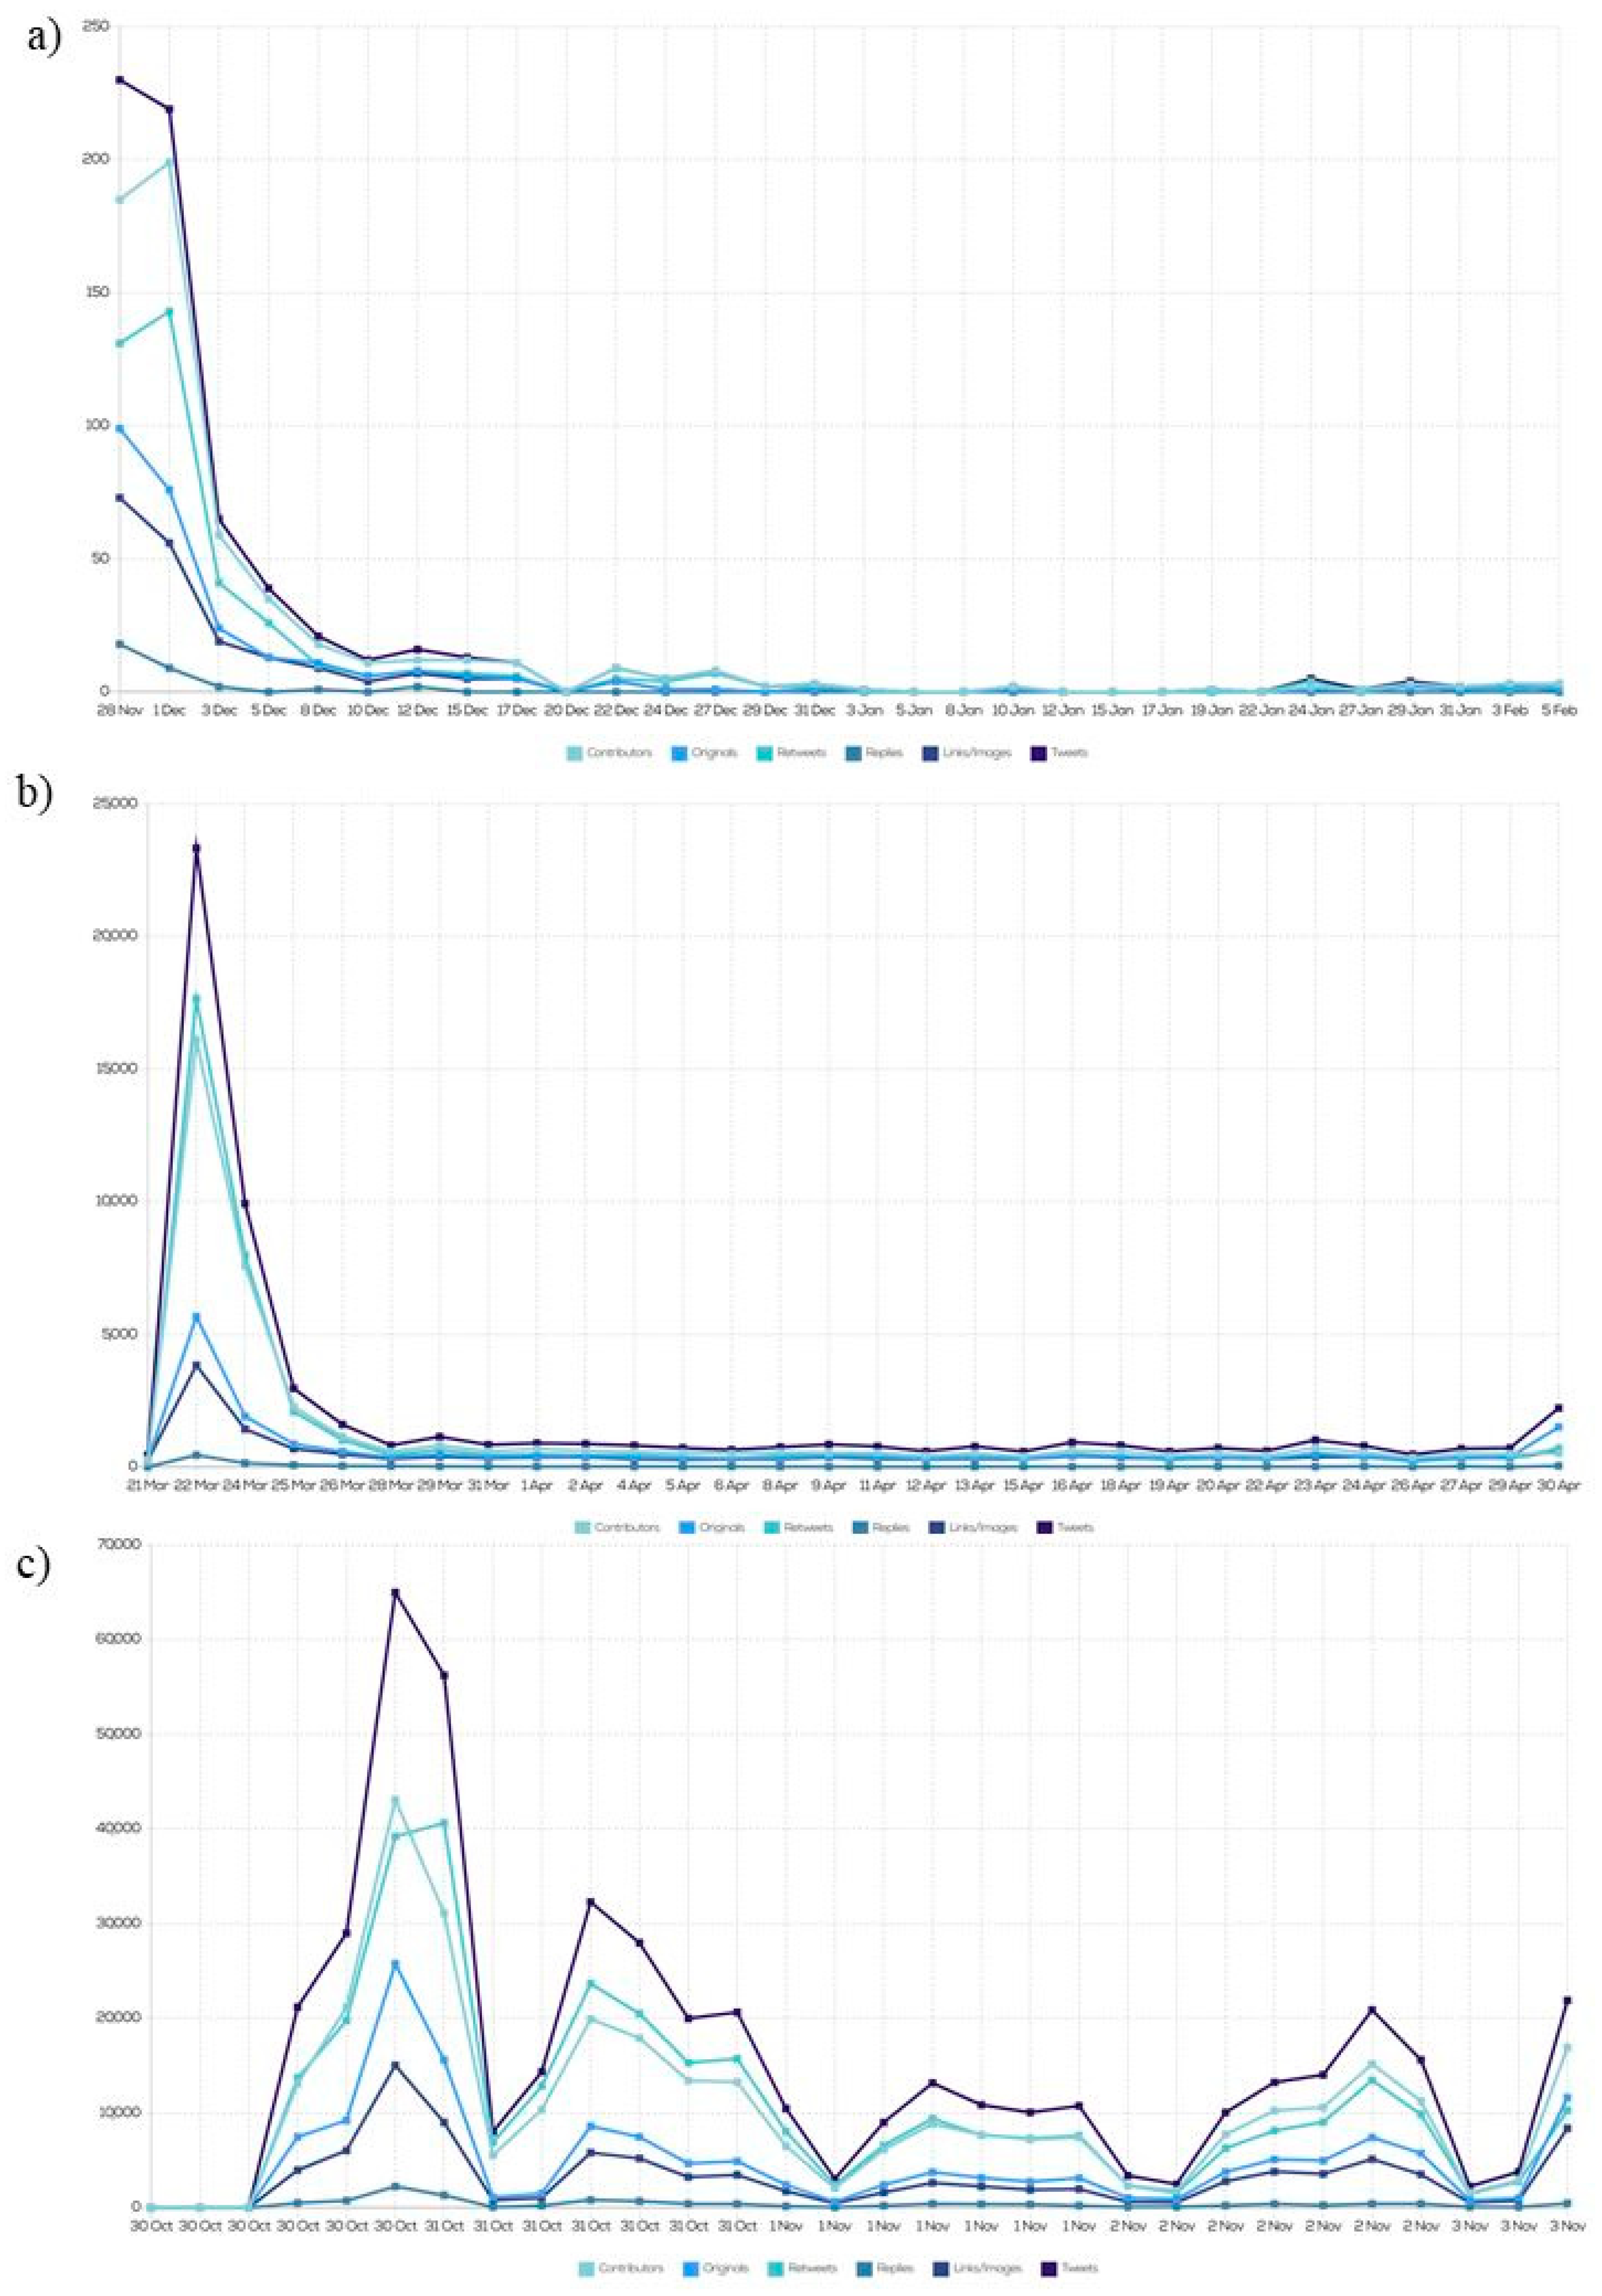
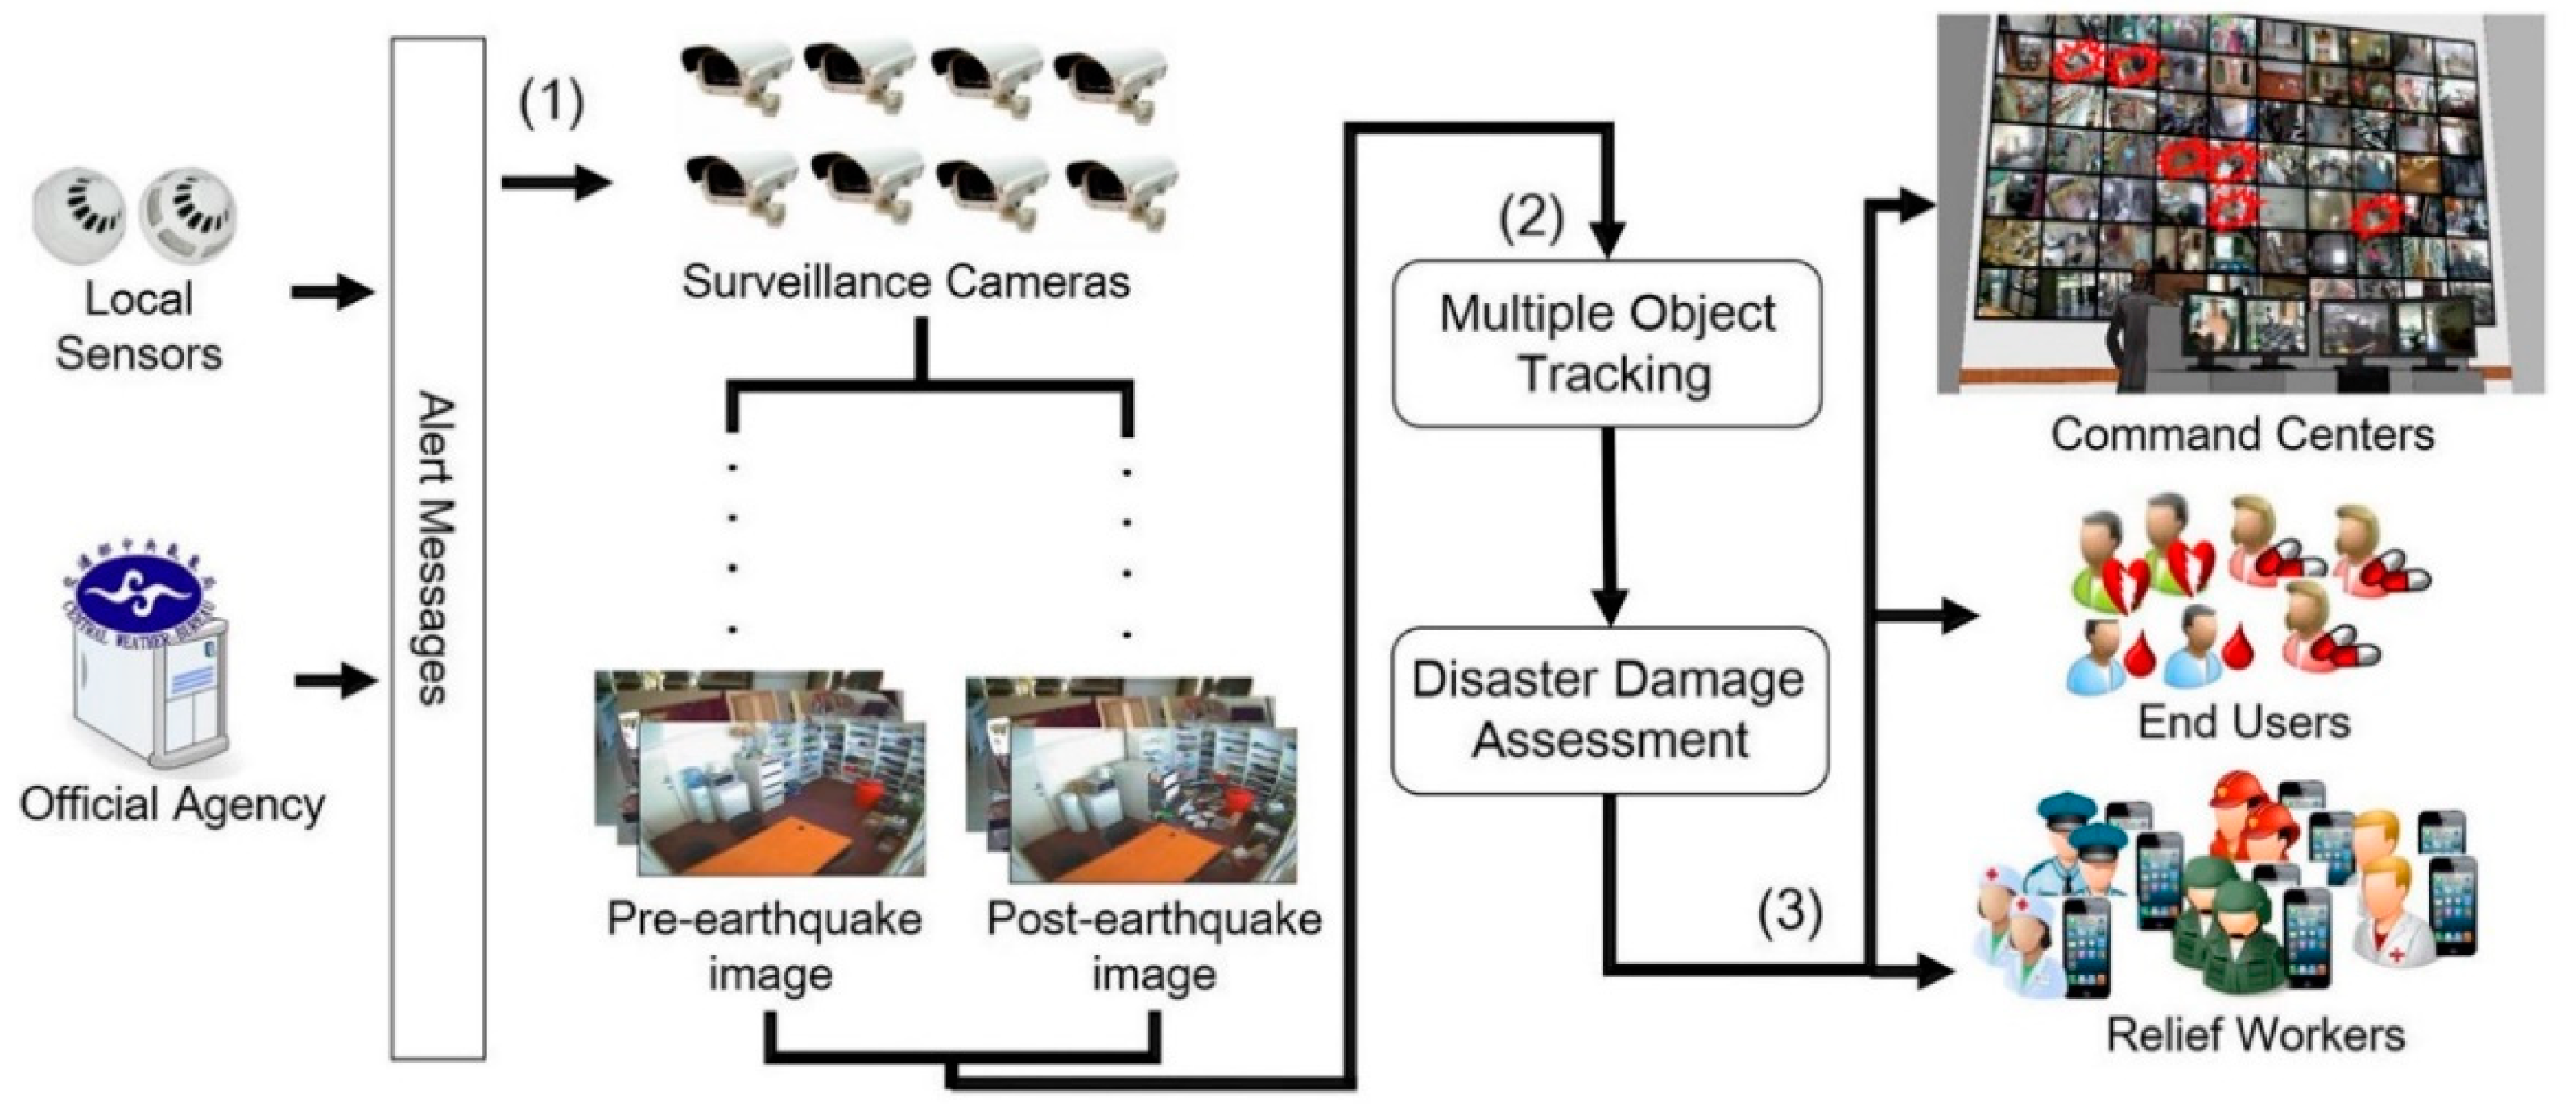