Article

A Seismological and Geophysical Database of Kos Island: 10 Years of Digital Records

Institute of Geodynamics, National Observatory of Athens, Lofos Nymfon, 11810 Athens, Greece
Earth 2021, 2(4), 920-932; https://doi.org/10.3390/earth2040053
Submission received: 17 August 2021 / Revised: 28 October 2021 / Accepted: 2 November 2021 / Published: 6 November 2021

Abstract

:
A ten-year complete seismological database is evaluated in the present work. These data are provided for events with magnitude ML ≥ 1.0, which have occurred in Eastern Greece and, more specifically, in Kos Island. Several selection criteria are applied and, hence, a catalog of the seismological records is compiled. Detailed big data (seismological, tide gauge, geodetic stations, accelerometers, etc.) of this region are used and processed in this work. The database consists of approximately 35,000 three-component broadband seismograms from 1198 digitally recorded events. It covers the last ten years of measurements, including records from the 20 July 2017, ML 6.2, Kos Island, Greece event. The seismological communities can either use this database to conduct new research or improve already existing seismic hazard studies in the region.

1. Introduction

In the broader area of Greece prevails a complex seismic tectonic regime characterized mainly by the fault of Northern Anatolia [1,2,3,4,5] and from the Europe Africa subduction zone [6,7] along the Greek arc [8,9,10]. This fact creates an intense deformation both along these active zones and in the broader area, resulting in a significant number of small and intermediate magnitude earthquakes.
The Aegean Sea is one of the most active and complicated parts of the western Alpine-Himalayan belt [11] and suffers from large earthquakes, some of which have caused destructive tsunamis [12,13,14,15,16,17,18,19,20].
The Aegean Sea Plate is a small tectonic plate located below southern Greece and western Turkey in the eastern Mediterranean Sea. It borders to the north with the divergent margin of the Eurasian plate (where the Gulf of Corinth is formed) and to the south of Crete with the submergence zone of the African plate (which sinks below the Aegean).
The geodynamic behavior of the Aegean area during the Neogene Quaternary periods was not only the result of the sinking of the African plate in the south of Crete and west of the Peloponnese below the Aegean microplate but of other lateral trends as well. As a consequence of these conditions, the Greek area went through several tectonic periods of direct compression and tension resulting in the deposition of marine and terrestrial sediments. Therefore, the tectonic activity in the Aegean area was complex, with rapid phase alternations between compression and tension, and played the most crucial role in the formation of the Aegean area as it appears today.
The island of Kos (Dodecanese) is located at the eastern end of the volcanic arc, with geographical coordinates φ = 36.8829°, λ = 27.2864°. The geology of Kos Island was initially described [21,22,23], then geological mapping of the island of Kos was performed [24].
In the last ten years, which is the main object of this work, a strong earthquake of magnitude Mw = 6.6 occurred offshore, east of the island of Kos and south of the town of Bodrum, SE Aegean Sea. According to the literature [25,26,27], this earthquake was the largest since the catastrophic earthquake (600 injuries) that occurred in 1933 (Mw = 6.5) in the greater area of Kos. The Kos earthquake happened in predominantly extensional tectonics as evidenced by the formation of Quaternary marine grabens, namely the NE–SW Kos graben [28,29] and the east–west trending Gökova graben [30,31,32,33].
It is known that seismicity patterns include seismic sequence, foreshocks, swarms, and aftershocks. In the past, many researchers, both from Greece and abroad, have created catalogs of earthquakes [34,35,36,37,38,39]. It is the first time that an attempt has been made to produce a 10-year catalog using homogeneously seismological data as well as data from a strong motion network. This study processes big seismological data in the area of the island of Kos in the Eastern Aegean (36.6574° < Lat < 37.0902° and 26.8533 < Lon < 29.9025°). These results can help researchers to understand the earthquake’s seismogenic structure and provide great, useful basic information for further specific studies and hazard assessment.
The Hellenic Unified Seismological Network (HUSN) started operations at the beginning of 2005. This project was completed at the end of 2007 and at the beginning of 2008 began to give the first results. The HUSN consists mainly of the Institute of Geodynamics (IG)-National Observatory of Athens [40] and the Seismological Laboratories of three Universities: the Geophysics department–Geothermics belonging to the National and Kapodistrian University of Athens [41] the department of Geophysics of the A.U.Th. Seismological Network, belonging to the Aristotle University of Thessaloniki [42]; the Patras Seismological Laboratory [43] belonging to the Department of Geology, University of Patras. The HUSN is in charge of recording, processing, and storing all seismological records for academic and research purposes. At present, the network consists of 164 seismological stations: more specifically, 56 belong to the National Observatory of Athens, 52 to the Seismological Laboratory of the A.U.Th. Seismological Network, 26 to Patras Seismological Laboratory, and the last 30 to the Seismological Laboratory of the University of Athens.
The time-span of the database provided in this article ranges from 2010 to 2020. The main purpose of this study is to give an overview of the database to provide easy access to it and, therefore, expand its use in research. It is the first time that such a 10-year period analysis with the latest state-of-the-art software has been applied in Greece.

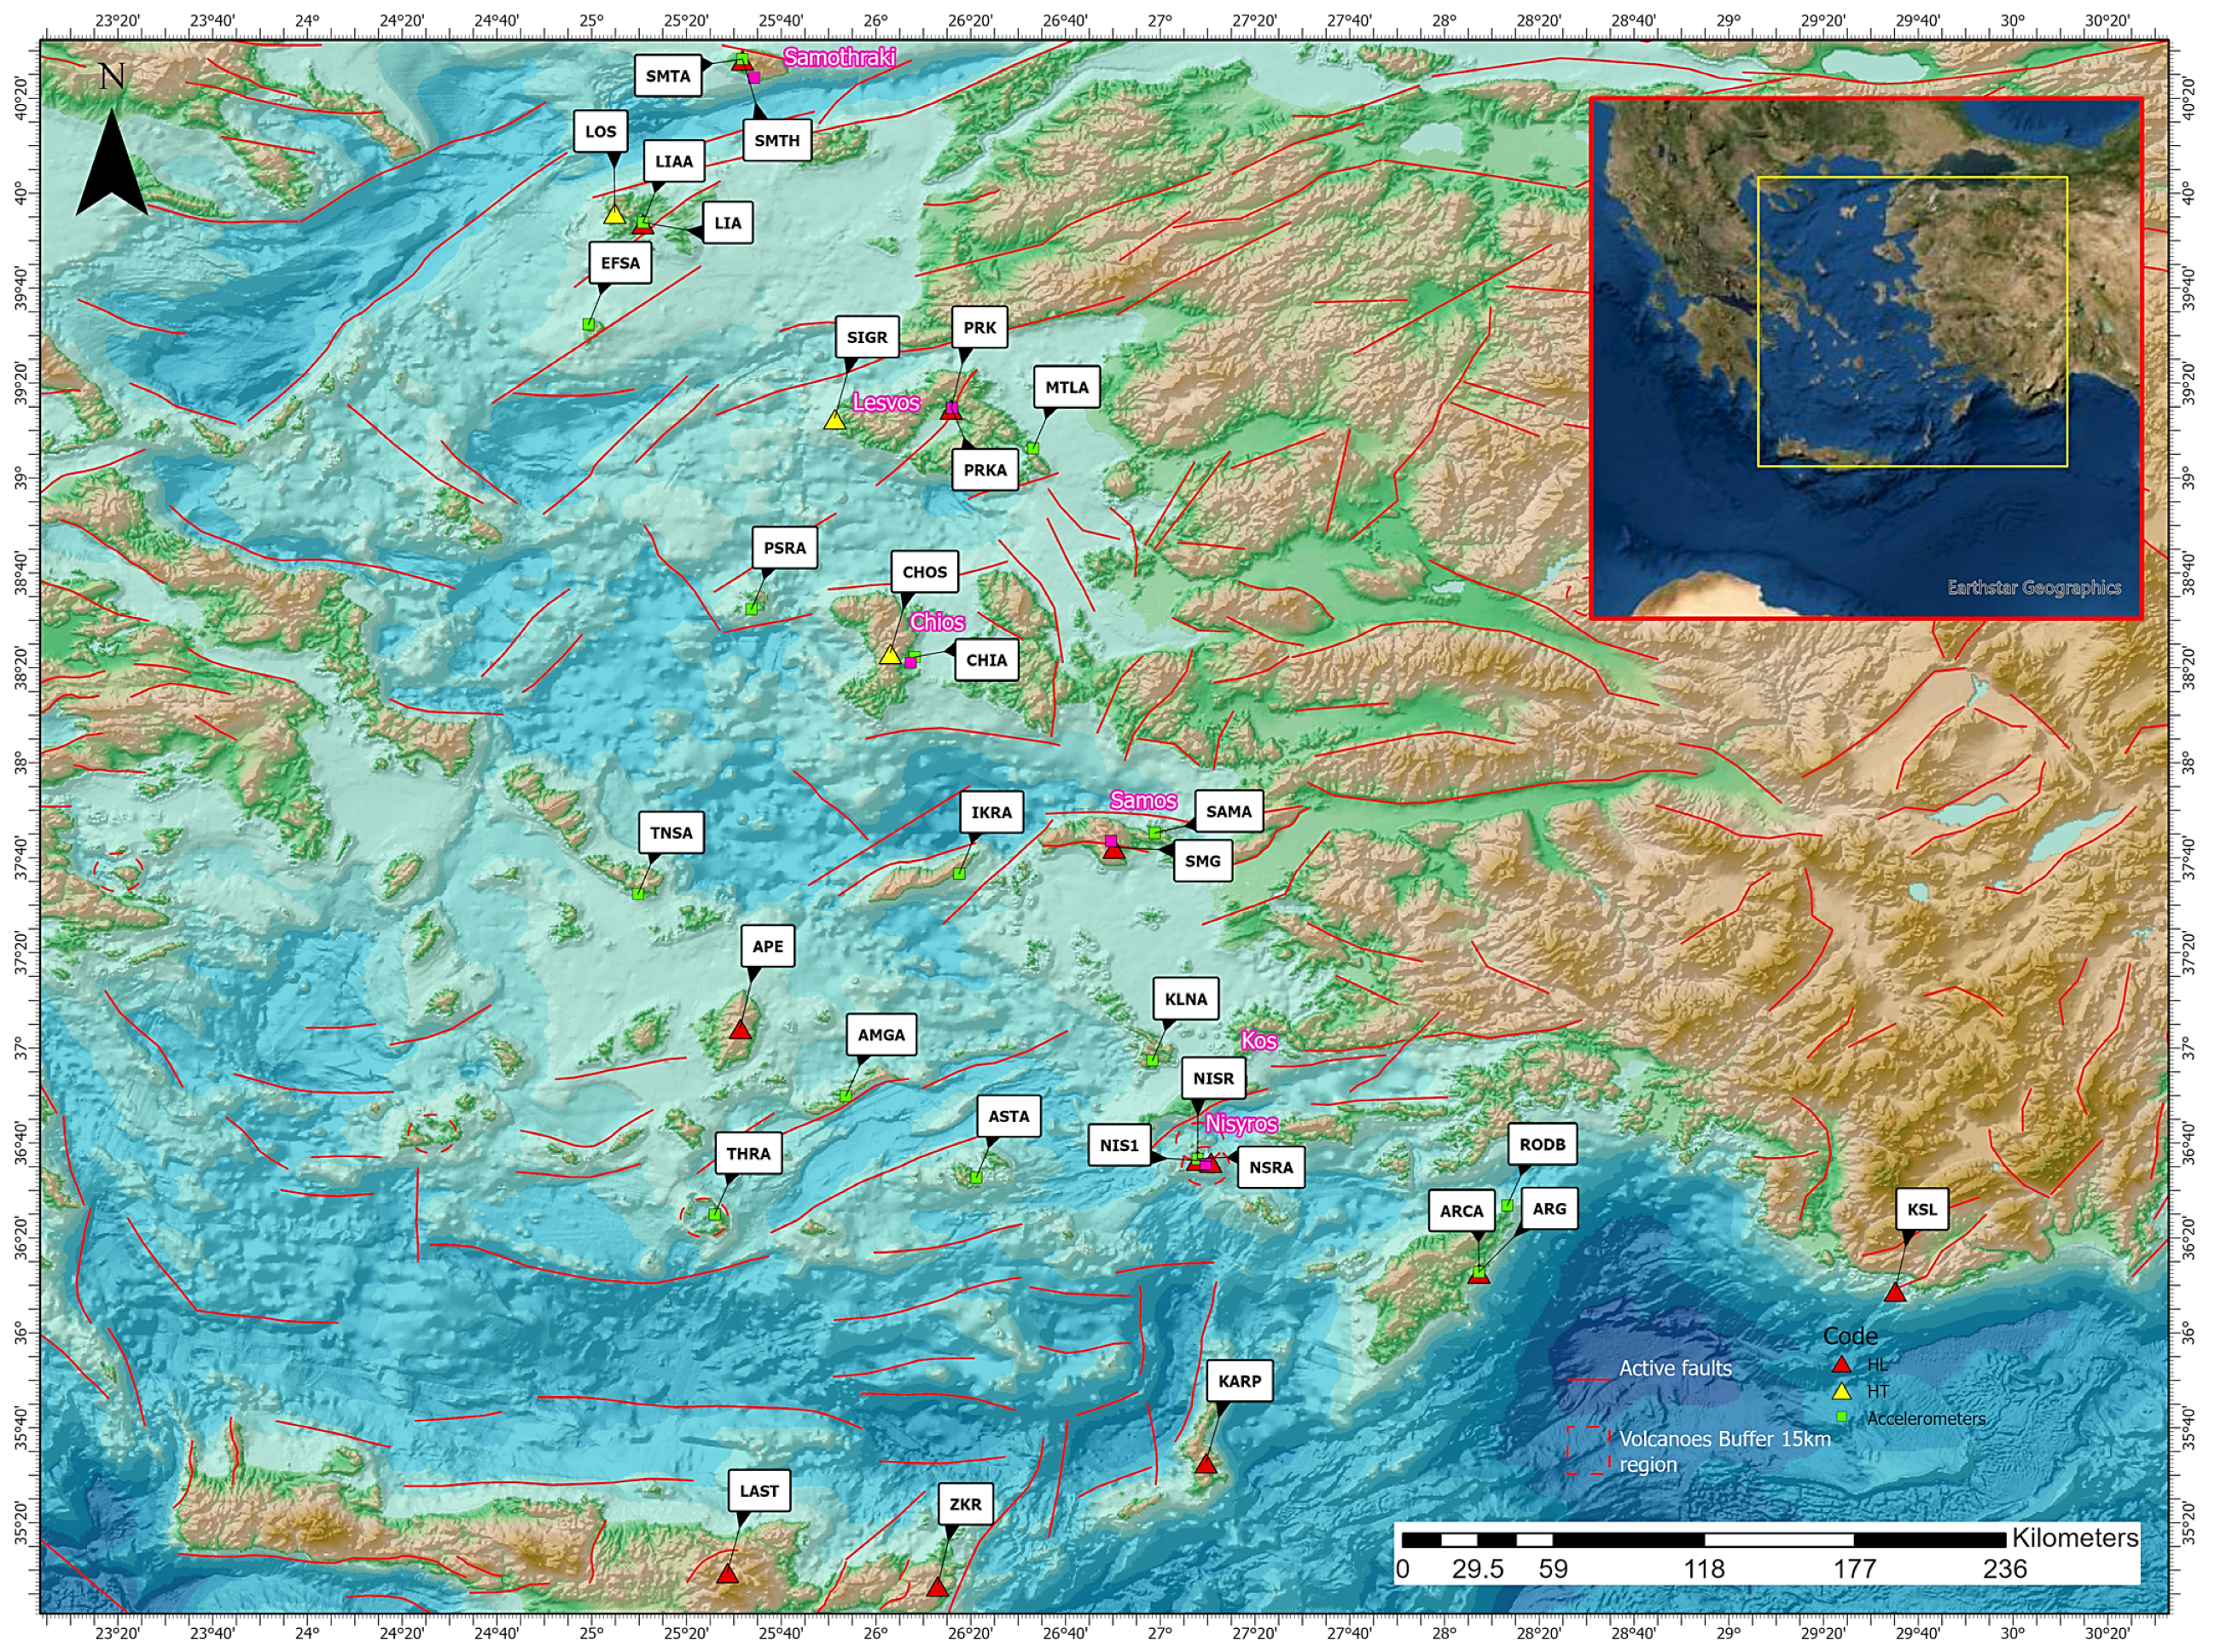
2. Dataset and Data Processing

Earthquakes are generally divided into shallow, intermediate, and deep according to the value of depth. In Greece, most earthquakes are classified as shallow earthquakes except those occurring in the Eastern Crete region, Karpathos and Rodos.
Τhe data of the seismic sequences under study were selected based on the following criteria:
  • the data belong to the area of the Eastern part of Greece,
  • the time window is defined for the time period 2010–2020,
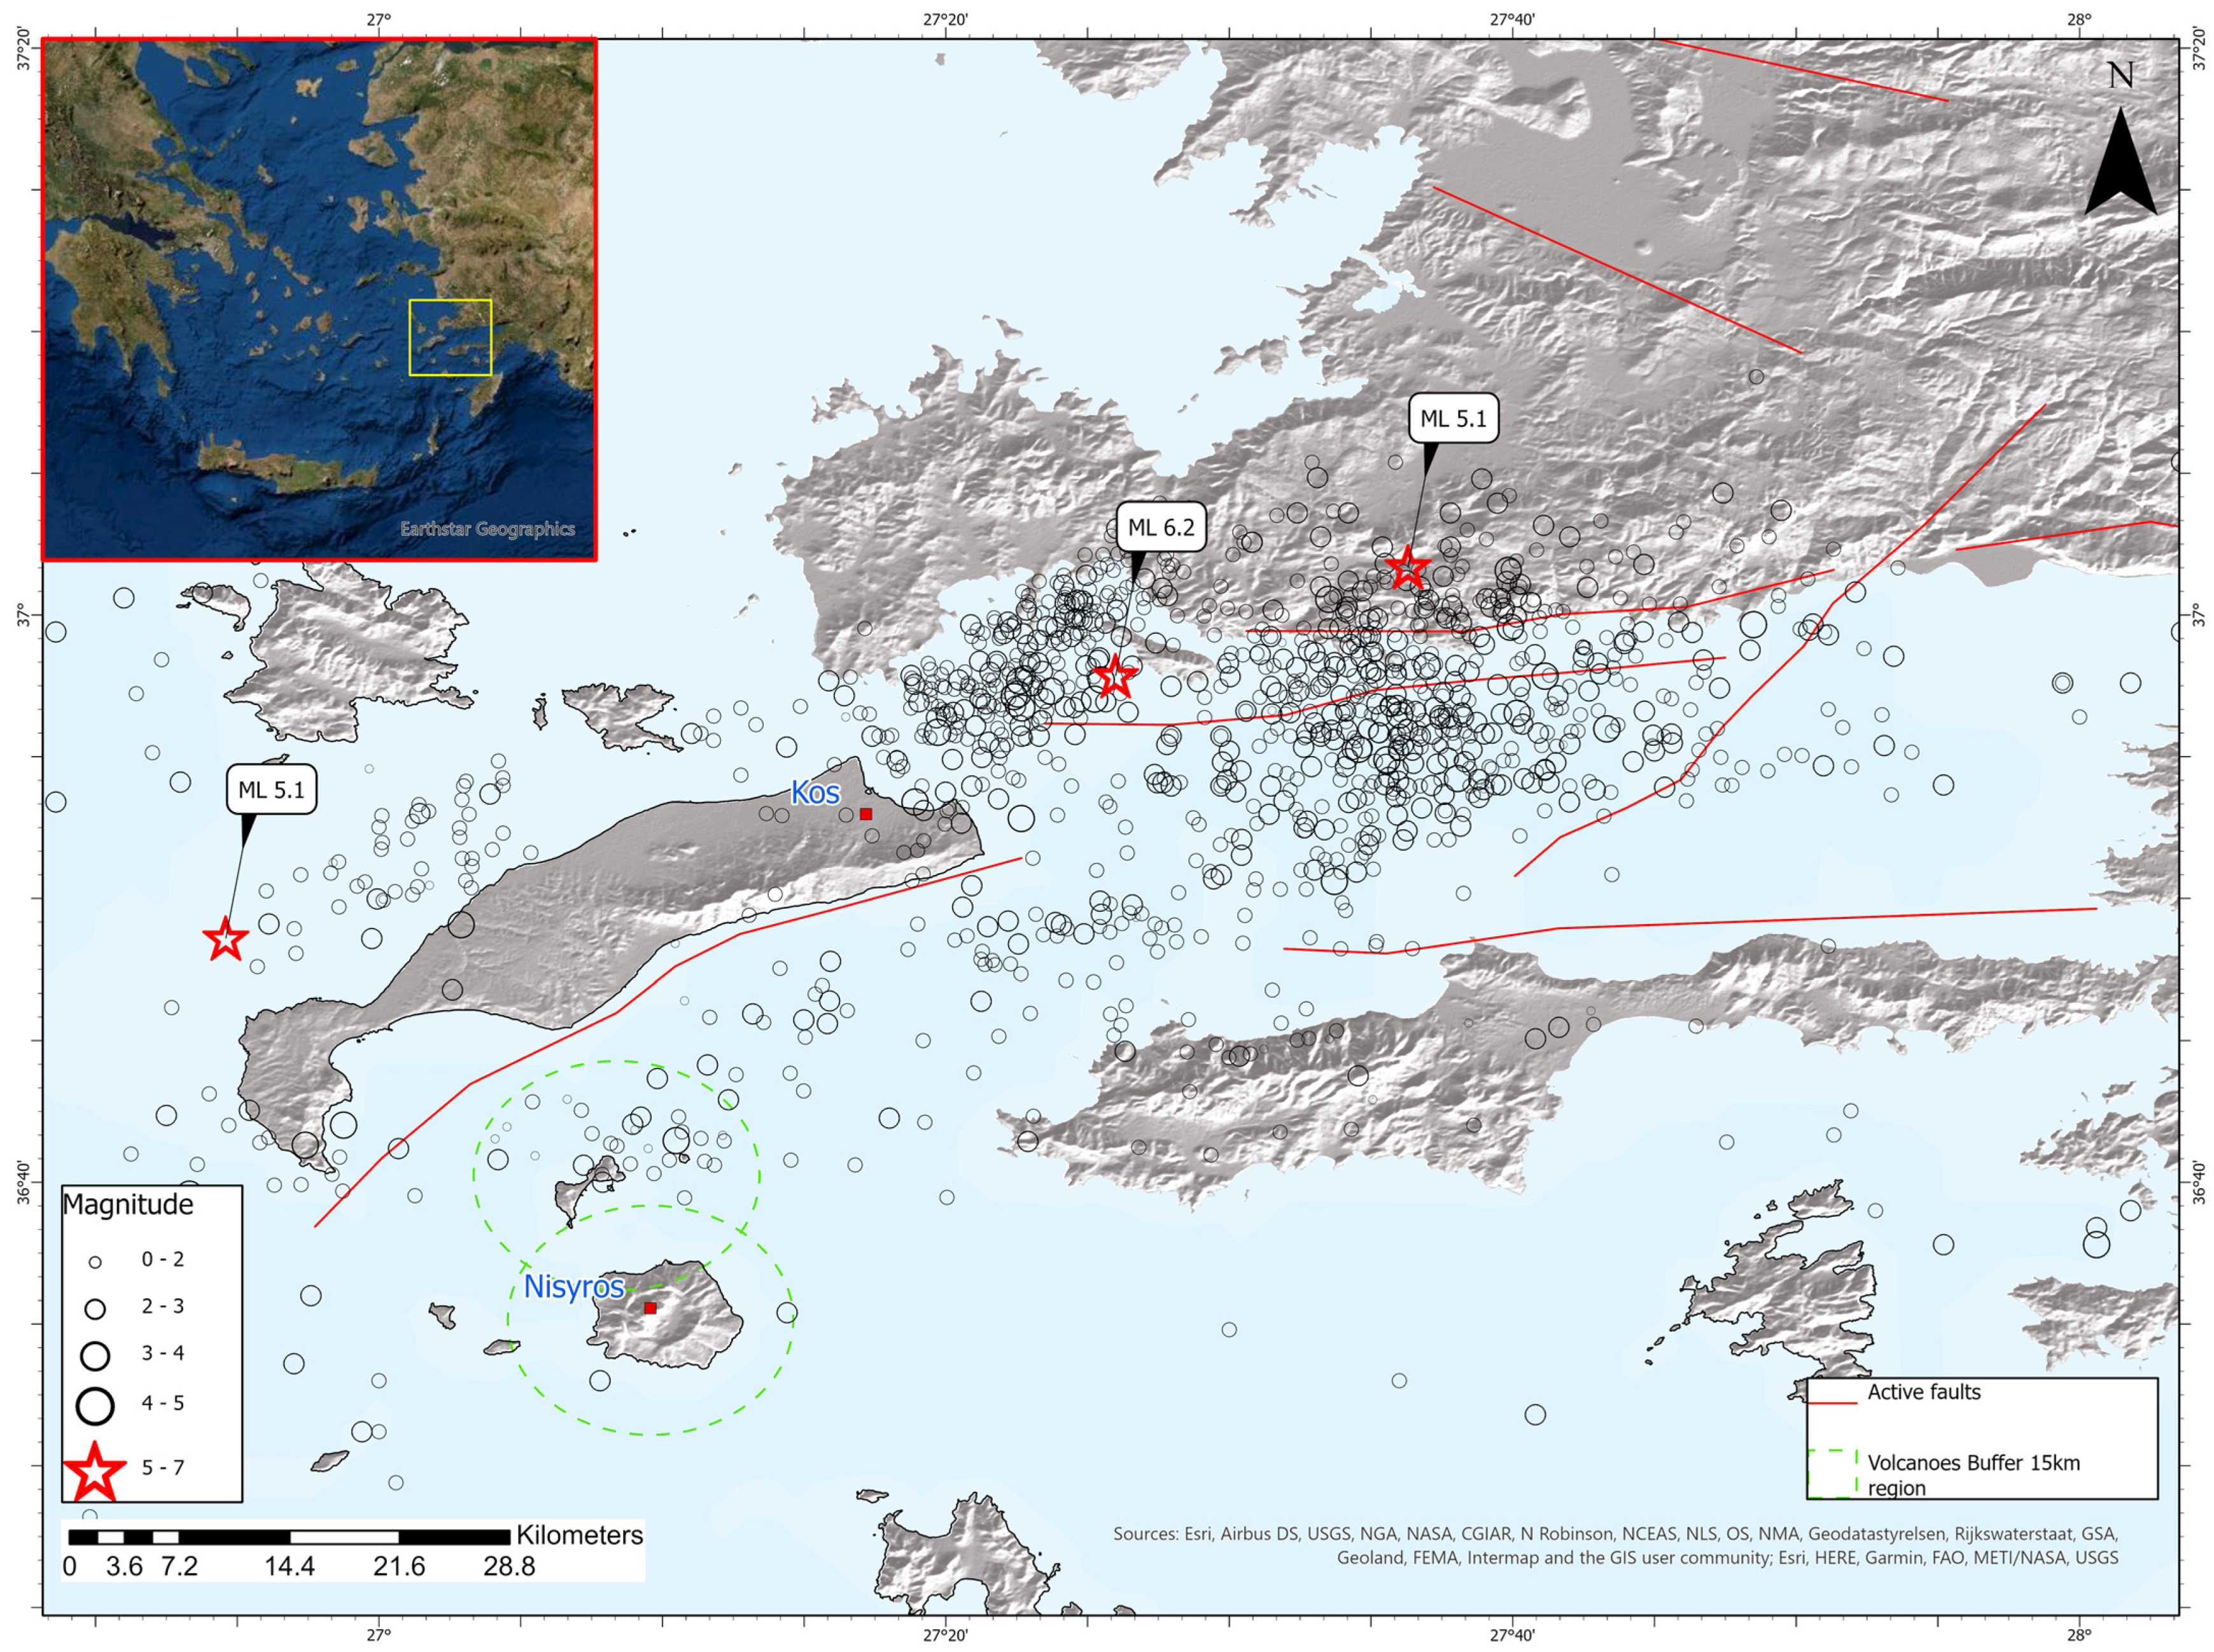
  • shallow mainshocks and a rich aftershock sequence,
  • according to the study [39], aftershocks initially occur during the first days in the same region where the mainshock occurs, and then can be expanded in a larger area.
The HUSN began in 2008. For the study area (Figure 1), 15 broadband stations were equipped with three components seismometers; detailed information is presented in Table 1 and the characteristics of 17 stations from the Hellenic Strong Motion Network (HSMN) are represented in Table 2. The geographical distribution of the stations appears in Figure 1.
The seismological database we present has a total of approximately 35,000 three-component broadband seismograms. They correspond to 1198 events from 2010 to 2020. The database is updated with new events as they are triggered by the Seismological Monitoring System. Nowadays, there is a total of 32 free-field stations. Each station transmits real-time data to the corresponding partner servers in miniSEED format and then transfers the data to the other institutes. When an earthquake is strong enough to trigger 30 stations, the earthquake’s location (coordinates in WGS84 system), depth, and magnitude are calculated automatically by at least three stations of the HUSN [40,42,44]. A baseline correction is applied by removing the mean value. After tapering on both ends, a second-order Butterworth band-pass filter is used. The SeisComp3 then processes the source parameters, calculates peak values, and gathers station information to save data into a list. The entire process is automatic; for that reason, the data is later inspected manually to identify events with a low signal-to-noise ratio or processing issues. Records that are not suitable are removed from the database. The magnitude used to characterize the database is the local magnitude (ML). For this period, 1198 events with magnitude ML ≥ 1.0 were recorded. An automated process originally obtained these events from SeisComp3. Further processing was performed, and the revised solutions are shown in Figure 2.

3. Statistical Analysis

The earthquake’s location, depth, and magnitude are calculated automatically by the SeisComp3 [48,49]. The magnitude used to characterize this database is the local magnitude (ML). Figure 3 shows the distribution of seismological recordings per year and Figure 4 the number of records relative to the magnitude. The number has increased in recent years because, at present, there are more stations.
As shown in the diagram of Figure 3, most earthquakes (Nr = 536) were observed in 2017 when the strong earthquake of ML 6.2 occurred. In Figure 4, the distribution of the number of events concerning their magnitude is presented. Here we can see that most earthquakes were between 2.0 ≤ ΜL < 3.0, and a significant number were between 3.0 ≤ ML < 4.0.
Table 3 shows a statistical summary of the number of records per different ranges of magnitude and depth. As we can observe from the table, the depth of most earthquakes was estimated between 10 and 20 km for magnitudes 2.0 ≤ ΜL < 4.0. For less than 40 events (Nr = 37), the depth was initially calculated to be greater than 50 km. The majority of earthquakes (Νr = 1.010) that occurred within this period had a depth between 5 and 20 km, which is in good agreement with the results of other works [50,51].
Ιn Figure 5, we can observe the distribution of the magnitude of earthquakes as a function of depth. Ιn this diagram, it is observed that the depths range mainly between 5 and 40 km, including the largest earthquake of the last decade that occurred on 20 July 2017, ML 6.2.
Figure 6 shows the relation time in years versus hypocentral distance from Kos Island. The hypocentral distance for the events in the database ranges mainly from 5 to 50 km. The locations refer to the events in the studied time interval hypocenter in km. The time scale is on the Y-axis. Different colors indicate the corresponding period of the located seismicity.
Figure 7 represents the relation time in years versus the magnitudes of the event that occurred in the regional area of Kos Island. It is observed that in the beginning of the year 2010, the minimum magnitude of earthquakes (Mc) that were recorded was much higher (M > 2.7) compared to the magnitudes (M > 1.5) recorded in the following years. This value of the variable is changeable over time and space. As seismic monitoring stations are added or removed, our ability to reliably detect small earthquakes changes. Closer positioned stations allow the detection of small earthquakes and, thus, lower Mc. The removal of a station lowers our ability to detect smaller events and increases Mc. Another contributing factor is the rate of earthquakes. For example, early in a post-earthquake sequence, there are often too many overlapping earthquakes. It is difficult to separate many events and to find reliable, small events. Over time, the sequence slows down and individual events become more easily detectable.
Thus, it is obvious that for the study of the specific area, especially in the first years of HUSN operation where there was no dense network of seismographs, it would be expected for the values of magnitudes to be higher. From 2011, more permanent stations and a portable network of seismographs were installed (e.g., after strong earthquakes such as in 2017 where the MC > 1.3.)

4. Discussions and Conclusions

The service to monitor seismicity in Greece and the adjacent region started in 1893 with the first seismic network operating five stations. In 2000, an extensive upgrade towards digital monitoring with broadband stations was initiated. Today, the Hellenic Unified Seismic Network (HUSN), with NOA-IG as coordinator and members of the three University Seismic Networks (Athens, Thessaloniki, and Patras), makes data available at NOA-IG in near real-time waveform data exchange with more than 150 stations.
In this study, an attempt was made to create a database of seismological and geophysical data that covers the seismicity of the last 10 years in the region of the Eastern Aegean and, more specifically, near Kos Island, including the strong event of 20 July 2017, ΜL 6.2. Statistical analysis was performed for a list of 1198 seismic data, which included two significant earthquakes, the first on 16 July 2010, ML 5.1, and the second on 20 July 2017, ML 6.2.
The database presented in this article contains approximately 35.000 three-component broadband seismograms from 1198 digitally recorded events. Τhe spatio-temporal distribution is determined in the last ten years for the area of Kos Island, Greece. Data will continue to be added as new events are recorded by the HUS Network. The database and the catalog with the metadata will help develop recent seismic hazard studies for the region or update the current database. The period for the database provided in this article ranges from 2010 to 2020.
The main task of this study was to create a complete list of seismological data for the 10 last years to make a detailed statistical analysis of them. From the analysis, we conclude the following:
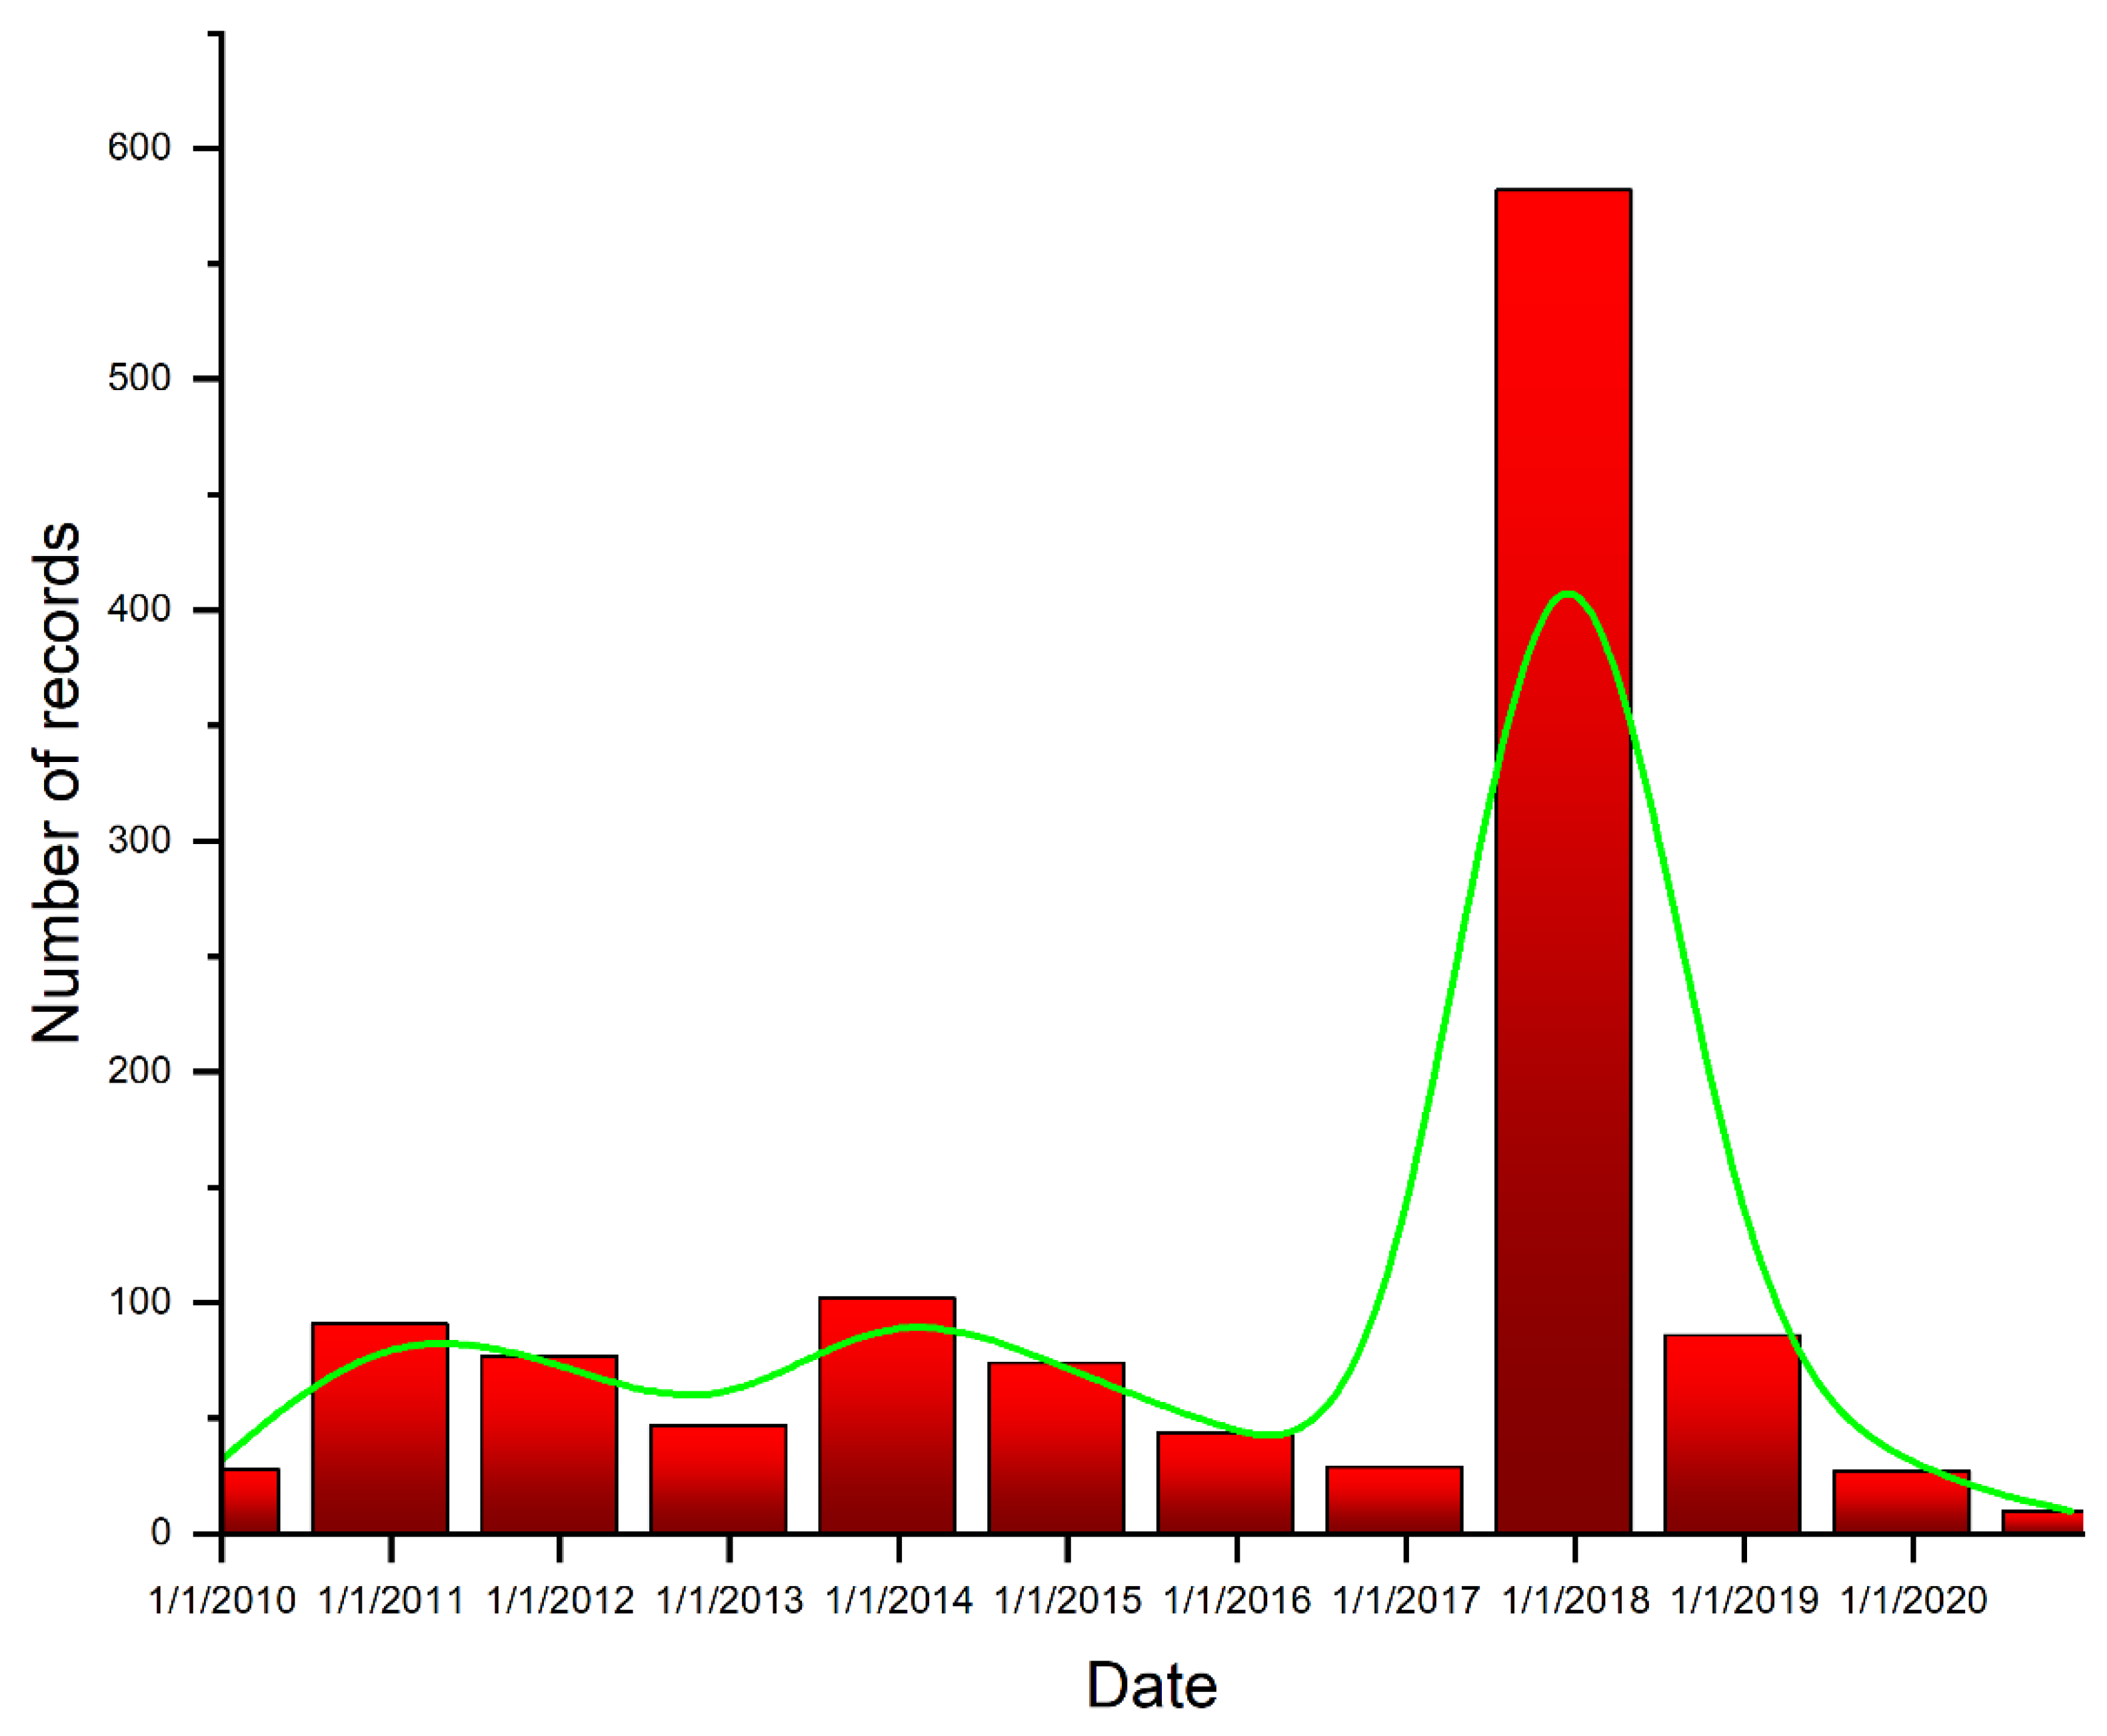
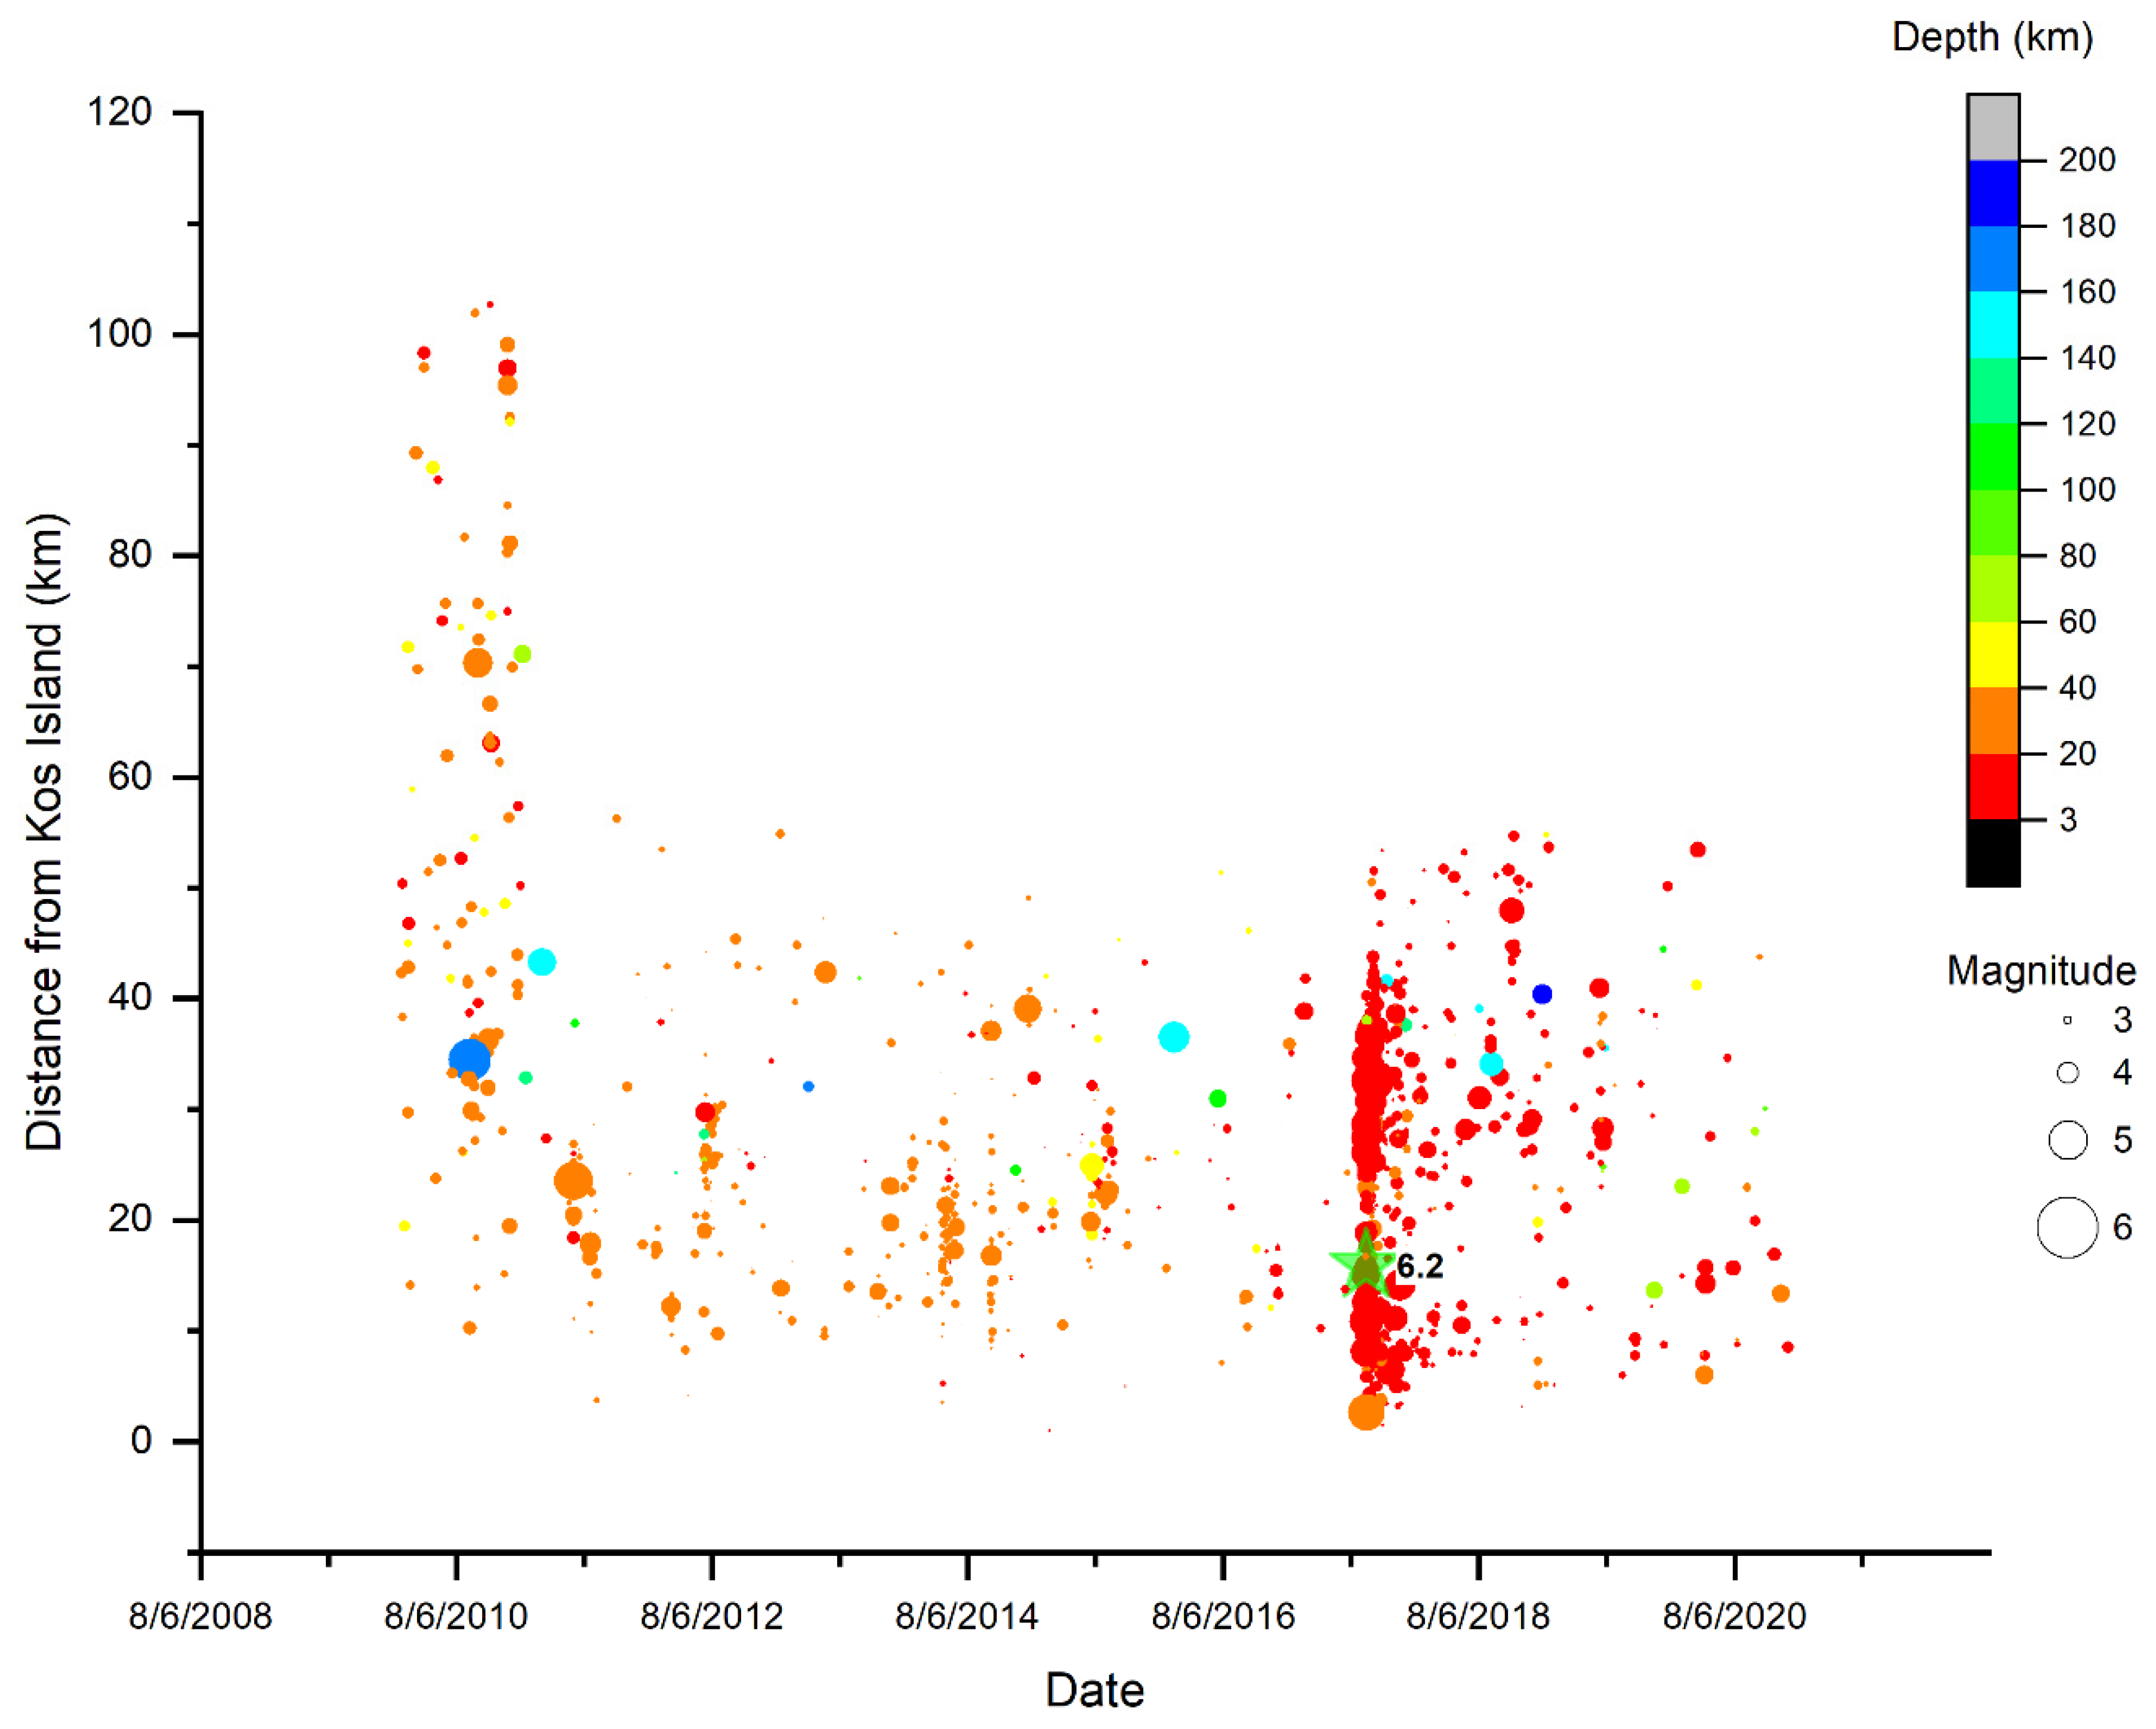
  • The maximum number of seismological recordings was observed in 2017 (Nr = 536) and specifically after the earthquake that happened on 20 July 2017, ML 6.2.
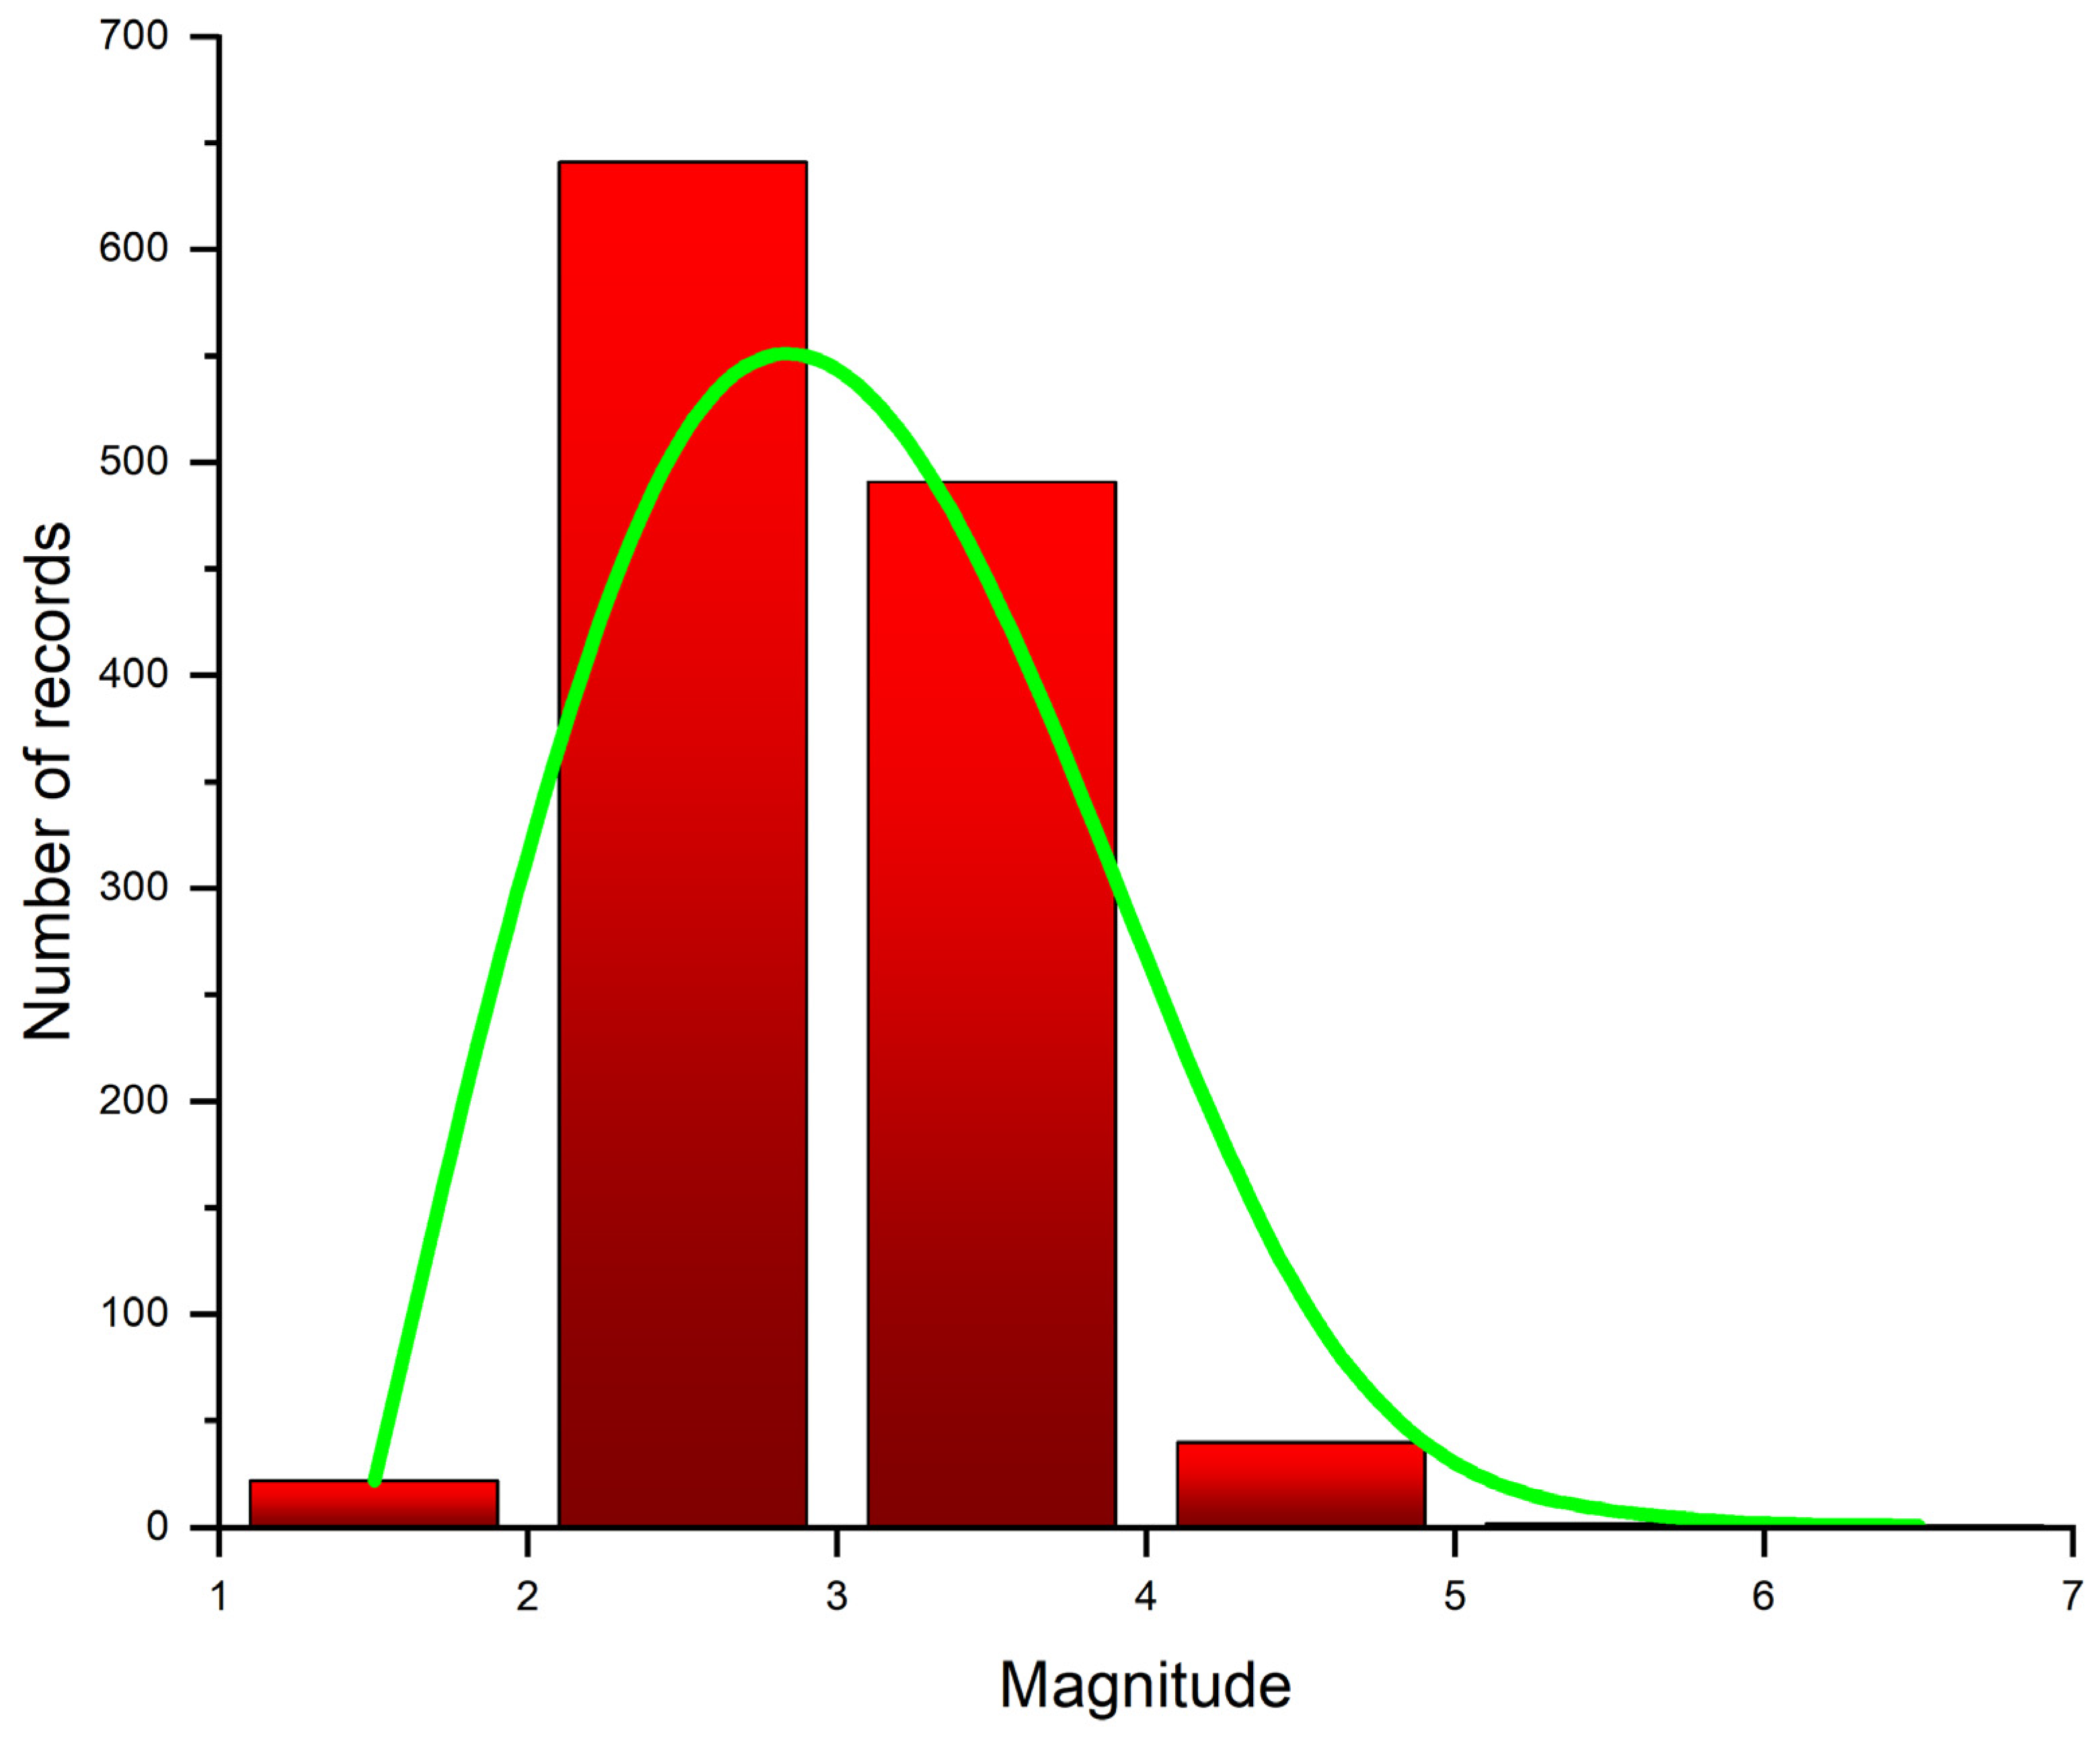
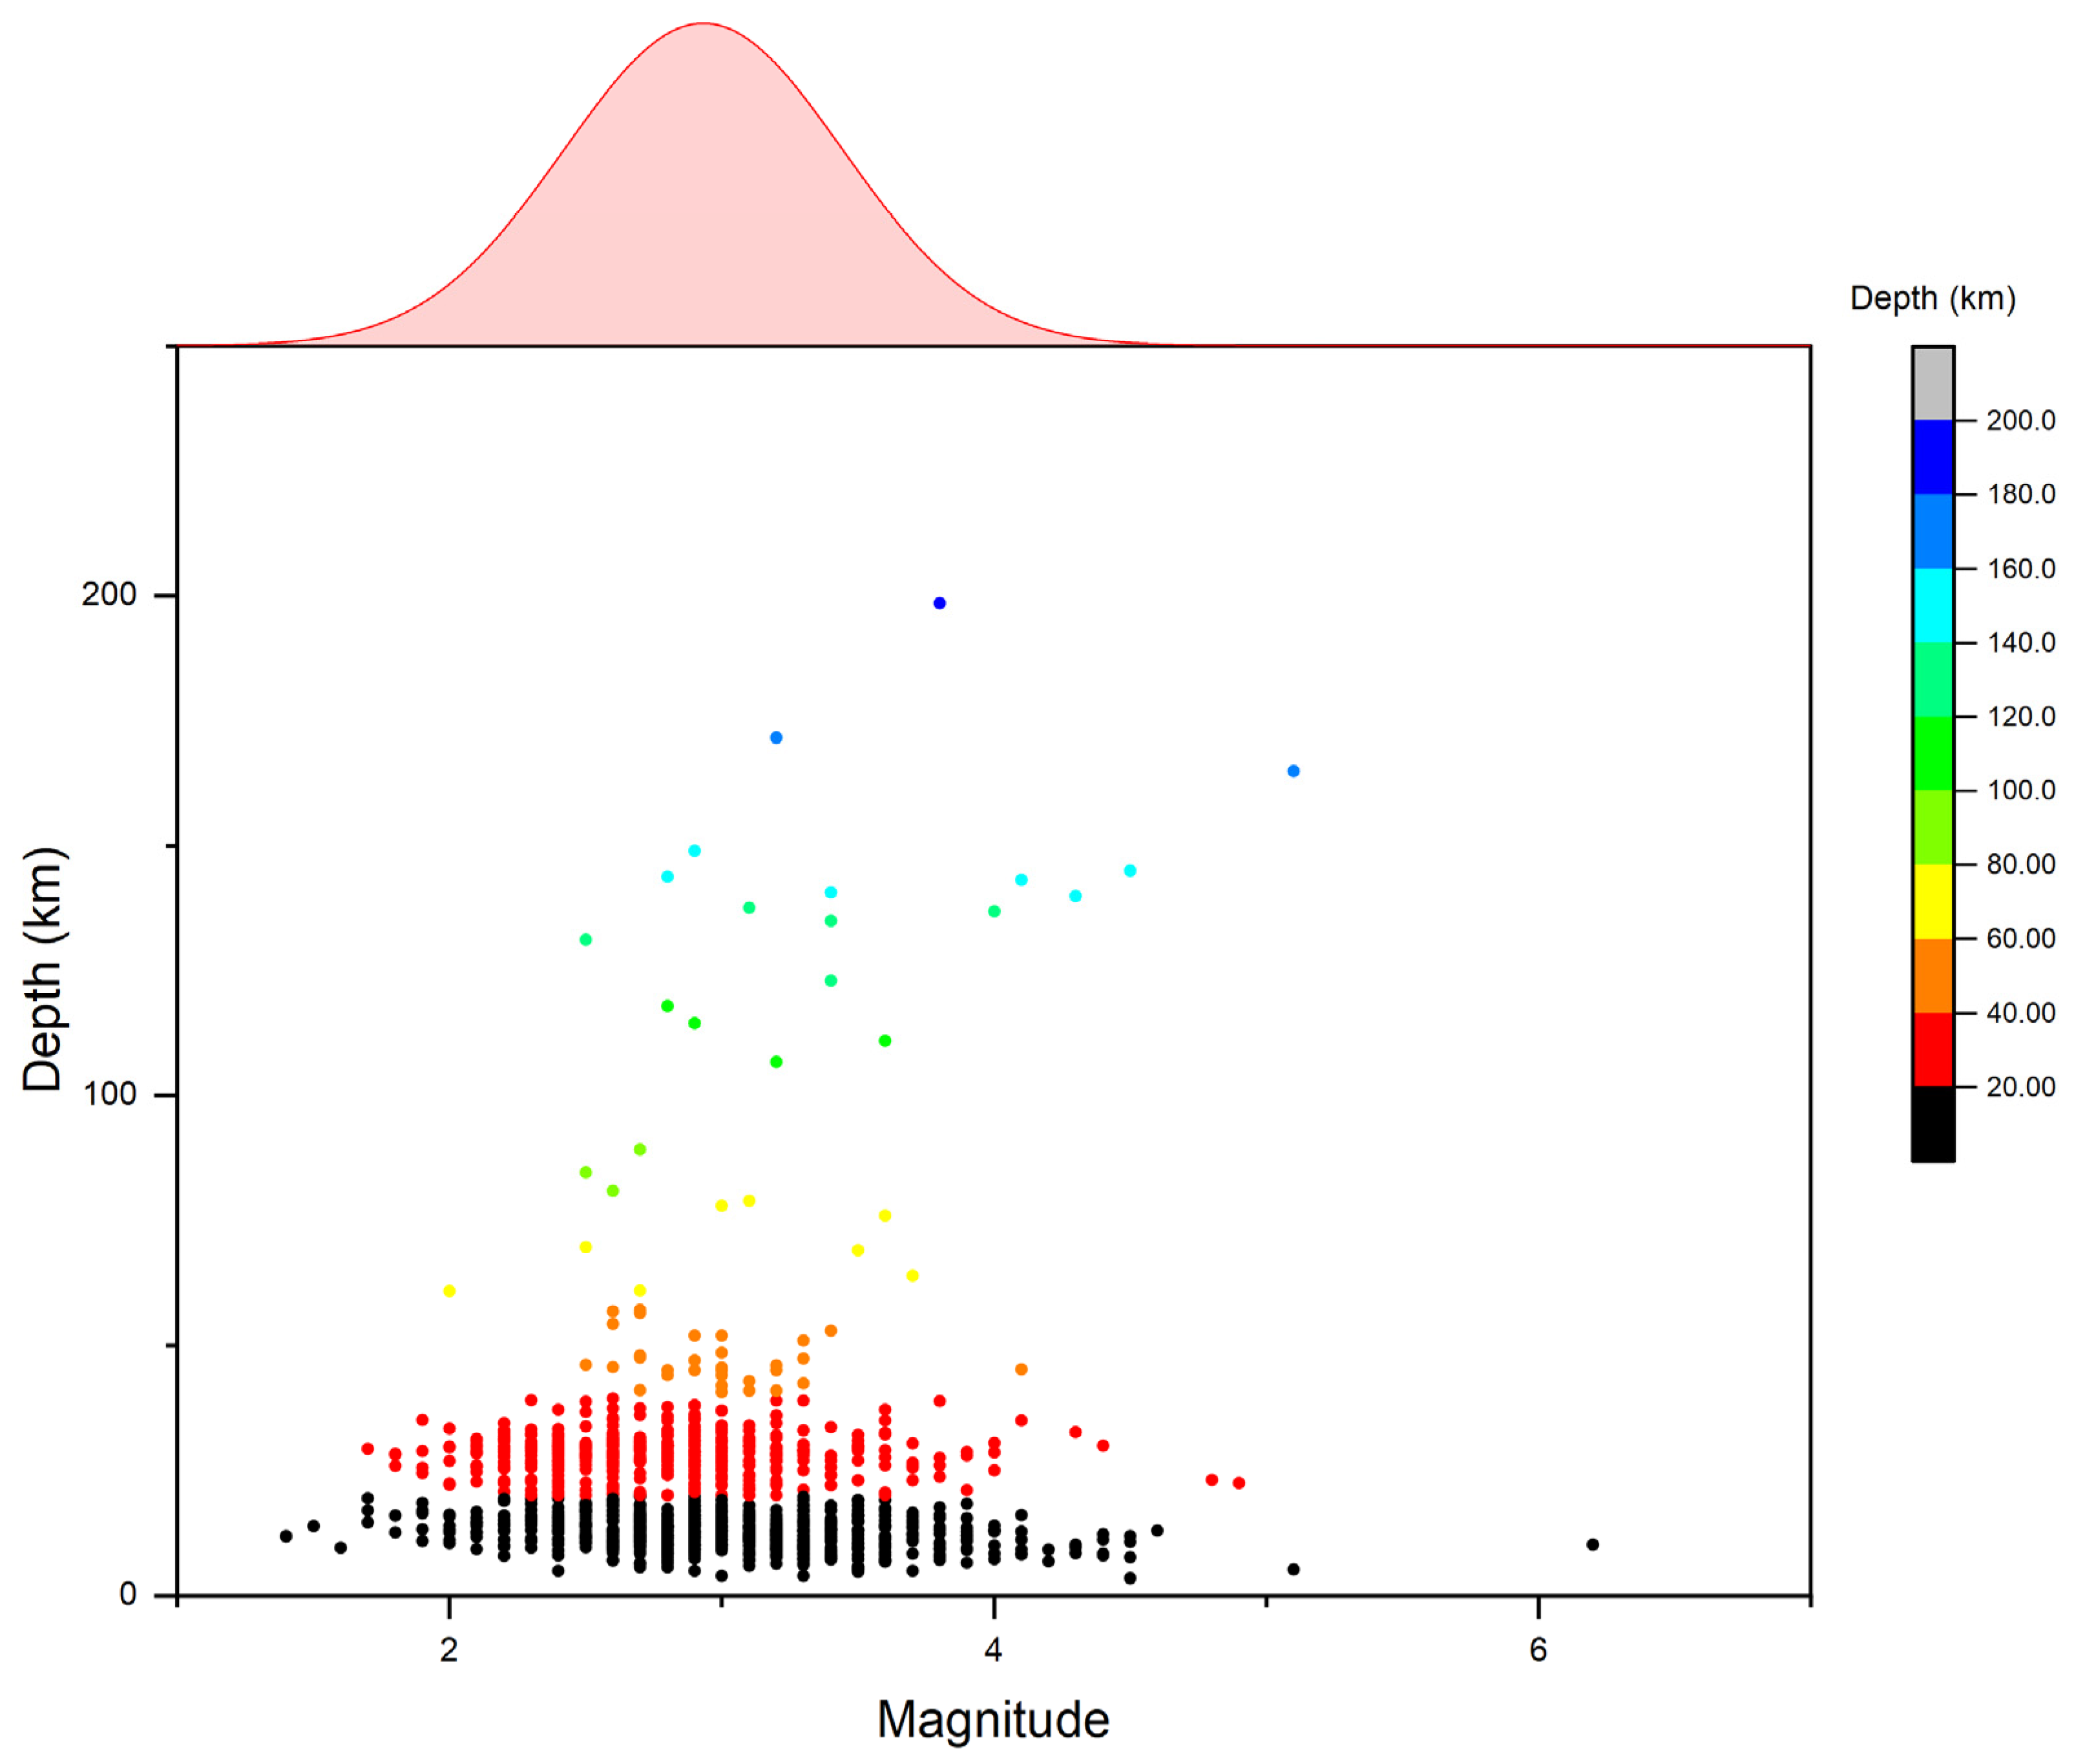
  • The vast majority of earthquakes are comprised between magnitudes 2.0 ≤ ΜL <3.0 (Nr = 641) and 2.0 ≤ ΜL < 4.0 (Nr = 1132).
  • The distribution of magnitudes depending on the depth of the earthquakes ranges was between 5 and 40 km. In 306 events, with a magnitude between 1.0 ≤ ML < 3.0, the depth was calculated between 10 and 20 km, while for several events, Nr = 336, whose magnitude was determined between 3.0 ≤ ΜL < 4.0, the depth was calculated between 10 and 30 km.
  • There were a total of 1130 earthquakes estimated with maximum hypocentral distances of 50 km from Kos Island.
  • From 2011 to 2016, the distances of earthquakes concerning the middle of Kos ranged between 10 and 30 km; then there was a shift of the epicenters, mainly in 2017, due to the strong earthquake, while, from 2018 and then in the following years, there was a shift again to the initial distances.
  • For the year 2010, there were only 91 earthquakes with magnitudes ML ≥ 2.7 in contrast to the following years in which there was an increase in both the number of earthquakes and the density of magnitudes. This can be justified by the increase in stations in the network.
  • The error depth for shallow events was ~1 km, while for depth events the error varied between 1 km < depth < 3 km. The depth error depends on various factors such as the software used, the velocity model, the number of the available stations, the azimuth distribution of the existing stations, and the ability of the analyst, etc.
  • From 2010 onwards, there was a gradual lower distance of the epicenters from the island of Kos. More specifically, in 2010, the epicentral distances were at 100 km, while in 2017, the earthquake (ML 6.2) was observed with epicenters up to 45 km. This partially confirms the study [52] regarding the Mogi [53] doughnut but needs further analysis to confirm this.
  • The magnitude of completeness (Mc) in a database, such as that considered for the Eastern Aegean region, is generally much higher than in other areas (e.g., the Corinthian Gulf). This is mainly due to the large extent of the sparse coverage of the stations. It is essential to understand that we may not detect so many small earthquakes due to a lack of equipment instead of earthquakes.

5. Data and Resources

The catalog is available at the website [40]. A table with the site conditions of each seismological station is available at [54], while for the stations from the Hellenic Strong Motion Network (HSMN), the site conditions can be found here [45]. To request the database of seismological data, please access the website [55] and fill out the form, while for the strong motion data, please visit the website [56]. All websites were last accessed in November 2021.

Funding

This research received no external funding.

Institutional Review Board Statement

Not applicable.

Informed Consent Statement

Not applicable.

Data Availability Statement

The datasets presented in this study and the contents of the tables are openly available in [40,41,42,43,55].

Acknowledgments

I acknowledge Pierrakos Stavros (B.A. in English Language and literature, NKUA M.A. in Creative Writing, University of Western Macedonia) for English editing and reviewing. We acknowledge the use of Hellenic Unified Seismograph Network (HUSN) data and we would like to thank the NOA scientific personnel for phase picking. We gratefully thank the European permanent seismic network operators who make their data available through EIDA [57]. In this study, data from the following Institutes were used: (1) HL (NOA, Hellenic Seismic Network), doi:10.7914/SN/HL. (2) HT (Aristotle University of Thessaloniki Seismological Network), doi:10.7914/SN/HT. (3) HP (University of Patras, Seismological Laboratory), doi:10.7914/SN/HP. (4) HA (National and Kapodistrian University of Athens, Seismological Laboratory), doi:10.7914/SN/HA. We acknowledge concession for the use of ESRI products licensed to the Hellenic National Tsunami Warning Center, National Observatory of Athens, through the project “HELPOS—Hellenic Plate Observing System” (MIS 5002697). HELPOS is implemented under the Action “Reinforcement of the Research and Innovation Infrastructure”, funded by the Operational Programme “Competitiveness, Entrepreneurship and Innovation” (NSRF 2014–2020) and co-financed by Greece and the European Union (European Regional Development Fund).

Conflicts of Interest

The author declares no conflict of interest.

References

  1. Kiratzi, A.A. Rates of crustal deformation in the North Aegean Trough-North Anatolian fault deduced from seismicity. Pure Appl. Geophys. PAGEOPH 1991, 136, 421–432. [Google Scholar] [CrossRef]
  2. Jackson, J.; McKenzie, D. The relationship between plate motions and seismic moment tensors, and the rates of active deformation in the Mediterranean and Middle East. Geophys. J. Int. 1988, 93, 45–73. [Google Scholar] [CrossRef] [Green Version]
  3. Hatzfeld, D.; Ziazia, M.; Kementzetzidou, D.; Hatzidimitriou, P.; Panagiotopoulos, D.; Makropoulos, K.; Papadimitriou, P.; Deschamps, A. Microseismicity and focal mechanisms at the western termination of the North Anatolian Fault and their implications for continental tectonics. Geophys. J. Int. 1999, 137, 891–908. [Google Scholar] [CrossRef]
  4. Taymaz, T.; Jackson, J.; McKenzie, D. Active tectonics of the north and central Aegean Sea. Geophys. J. Int. 1991, 106, 433–490. [Google Scholar] [CrossRef]
  5. Lybéris, N. Tectonic evolution of the North Aegean trough. Geol. Soc. Lond. Special Publ. 1984, 17, 709–725. [Google Scholar] [CrossRef]
  6. Mayer-Rosa, D. Towards uniform earthquake hazzard assessment in Europe. Ann. Geophys. 1993, 36. [Google Scholar] [CrossRef]
  7. Bourova, E.; Kassaras, I.; Pedersen, H.; Yanovskaya, T.; Hatzfeld, D.; Kiratzi, A. Constraints on absoluteSvelocities beneath the Aegean Sea from surface wave analysis. Geophys. J. Int. 2005, 160, 1006–1019. [Google Scholar] [CrossRef] [Green Version]
  8. Papazachos, B.C.; Papadimitriou, E.E.; Kiratzi, A.A.; Papaioannou, C.A.; Karakaisis, G.F. Probabilities of occurrence of large earthquakes in the Aegean and surrounding area during the period 1986–2006. Pure Appl. Geophys. PAGEOPH 1987, 125, 597–612. [Google Scholar] [CrossRef]
  9. Anderson, H.; Jackson, J. Active tectonics of the Adriatic Region. Geophys. J. Int. 1987, 91, 937–983. [Google Scholar] [CrossRef]
  10. Available online: https://www.researchgate.net/publication/288031207_Sismotectonique_du_Fosse_Nord_Egeen_Relations_avec_la_faille_Nord-Anatolienne (accessed on 4 November 2021).
  11. McKenzie, D. Active Tectonics of the Mediterranean Region. Geophys. J. Int. 1972, 30, 109–185. [Google Scholar] [CrossRef] [Green Version]
  12. Galanopoulos, A.G. A Catalogue of Shocks with Io ≥ VI or M ≥ 5 for the Years 1801–1958; Seismological Laboratory, Athens University: Athens, Greece, 1960. [Google Scholar]
  13. Papadopoulos, G.; Kuran, U.; Takahashi, T.; Minoura, K.; Imamura, F.; Yalçiner, A.; Fokaefs, A. Geological evidence of tsunamis and earthquakes at the Eastern Hellenic Arc: Correlation with historical seismicity in the eastern Mediterranean Sea. Res. Geophys. 2012, 2, e12. [Google Scholar] [CrossRef]
  14. Papadopoulos, G.A.; Gràcia, E.; Urgeles, R.; Sallares, V.; Marco De Martini, P.; Pantosti, D.; González, M.; Ahmet, C.; Yalciner, C.A.; Mascle, J.; et al. Historical and Pre-Historical Tsunamis in the Mediterranean and Its Connected Seas: Geological Signatures, Generation Mechanisms and Coastal Impacts; Elsevier: Amsterdam, The Netherlands, 2014. [Google Scholar]
  15. Bocchini, G.M.; Brüstle, A.; Becker, D.; Ruscic, M.; Rische, M.; Papadopoulos, G.A.; Meier, T.M. Slab Segmentation in the South-Eastern Aegean: Evidence from Seismicity; AGU: Washington, DC, USA, 2016. [Google Scholar]
  16. Ambraseys, N.N.; Finkel, C.F. The Seismicity of Turkey and Adjacent Areas; Eren Ltd.: Istanbul, Turkey, 1995; p. 240. [Google Scholar]
  17. Kuran, U.; Yalçiner, A.C. Crack Propagations, Earthquakes and Tsunamis in the Vicinity of Anatolia. In Landslides in Sensitive Clays; Springer: Berlin/Heidelberg, Germany, 1993; pp. 159–175. [Google Scholar]
  18. Minoura, K.; Imamura, F.; Kuran, U.; Nakamura, T.; Papadopoulos, G.A.; Takahasi, T.; Yalciner, A.C. Discovery of Minoan tsunami deposits. Geology 2000, 28, 59–62. [Google Scholar] [CrossRef] [Green Version]
  19. Ambraseys, N.; Synolakis, C. Tsunami Catalogs for the Eastern Mediterranean, Revisited. J. Earthq. Eng. 2010, 14, 309–330. [Google Scholar] [CrossRef]
  20. Moshou, A.; Konstantaras, A.; Argyrakis, P. The Major (Mw = 7.0) Earthquake of 30th October 2020 North Samos Island, Greece: Analysis of Seismological and Geodetic Data; EGU General Assembly: Munich, Germany, 2021. [Google Scholar] [CrossRef]
  21. Desio, A. Le Isole Italiane dell’ Egeo: Studi geologici e geografico-fisici. Geogr. J. 1932, 80, 341. [Google Scholar] [CrossRef]
  22. Angelier, J.; Cantagrel, J.; Vilminot, J. Neotectonique cassante et volcanisme plio-quaternaire dans l’arc egeen interne; l’ile de Milos (Grece). Bull. De La Société Géologique De Fr. 1977, S7-XIX, 119–124. [Google Scholar] [CrossRef]
  23. Besenecker, H.; Otte, O. Late Cenozoic development of Kos, Aegean Sea. In Alps, Apennines, Hellenides; Closs, H., Ed.; Pascal Press: Paris, France, 1978; pp. 506–509. [Google Scholar]
  24. Triantaphyllis, M. Geological Map of Greece. Western Kos Sheet (Kefalos) 1:50.000; IGME: Athens, Greece, 1994. [Google Scholar]
  25. Makropoulos, K.; Kaviris, G.; Kouskouna, V. An updated and extended earthquake catalogue for Greece and adjacent areas since 1900. Nat. Hazards Earth Syst. Sci. 2012, 12, 1425–1430. [Google Scholar] [CrossRef] [Green Version]
  26. Kouskouna, V.; Sesetyan, K.; Stucchi, M. The Kos Earthquake of 1933: A Preliminary Study; Gruppo Nazionale di Geofisica della Terra Solida 36o Convegno Nazional: Trieste, Italy, 2017. [Google Scholar]
  27. Ambraseys, N.N. Reassessment of earthquakes, 1900–1999, in the Eastern Mediterranean and the Middle East. Geophys. J. Int. 2001, 145, 471–485. [Google Scholar] [CrossRef] [Green Version]
  28. Tibaldi, A. Contractional tectonics and magma paths in volcanoes. J. Volcanol. Geotherm. Res. 2008, 176, 291–301. [Google Scholar] [CrossRef]
  29. Nomikou, P.; Papanikolaou, D. Extension of active fault zones on Nisyros volcano across the Yali-Nisyros Channel based on onshore and offshore data. Mar. Geophys. Res. 2011, 32, 181–192. [Google Scholar] [CrossRef]
  30. Nomikou, P.; Papanikolaou, D.; Alexandri, M.; Sakellariou, D.; Rousakis, G. Submarine volcanoes along the Aegean volcanic arc. Tectonophysics 2013, 597, 123–146. [Google Scholar] [CrossRef]
  31. Uluğ, A.; Duman, M.; Ersoy, Ş.; Özel, E.; Avcı, M. Late Quaternary sea-level change, sedimentation and neotectonics of the Gulf of Gökova: Southeastern Aegean Sea. Mar. Geol. 2005, 221, 381–395. [Google Scholar] [CrossRef]
  32. Tur, H.; Yaltirak, C.; Kerim, I.E.; Sarikavak, T. Pliocene—Quaternary tectonic evolution of the Gulf of Gökova, southwest Turkey. Tectonophysics 2015, 638, 158–176. [Google Scholar] [CrossRef]
  33. Ocakoğlu, N.; Nomikou, P.; Işcan, Y.; Loreto, M.F.; Lampridou, D. Evidence of extensional and strike-slip deformation in the offshore Gökova-Kos area affected by the July 2017 Mw6.6 Bodrum-Kos earthquake, eastern Aegean Sea. Geo-Mar. Lett. 2018, 38, 211–225. [Google Scholar] [CrossRef]
  34. Shebalin, N.V.; Karnik, V.; Hadzievski, D. UNDP-Unesco Survey of the Seismicity of Balkan Region. Catalogue of Earthquakes, Part I, 1901–1970, Skopje. References-Scientific Research Publishing. Scirp.org. 1974. Available online: https://scirp.org/(S(lz5mqp453edsnp55rrgjct55))/reference/referencespapers.aspx?referenceid=2976457 (accessed on 4 November 2021).
  35. Makropoulos, K.; Burton, P.W. A catalogue of seismicity in Greece and adjacent areas. Geophys. J. Int. 1981, 65, 741–762. [Google Scholar] [CrossRef] [Green Version]
  36. Makropoulos, K.; Drakopoulos, J.K.; Latousakis, J.B. A revised and extended earthquake catalogue for Greece since 1900. Geophys. J. Int. 1989, 98, 391–394. [Google Scholar] [CrossRef] [Green Version]
  37. Papazachos, B.C.; Comninakis, P.E. A catalogue of earthquakes in Greece and the surrounding area for the period 1901–1980. Publ. Univ. Thessalon. Geophys. Lab. 1982, 5, 146. [Google Scholar]
  38. Papazachos, B.C.; Papazachou, C.C. The Earthquakes of Greece; Ziti: Thessaloniki, Greece, 1989; p. 356. [Google Scholar]
  39. Papazachos, B.; Papazachou, C. The Earthquakes of Greece; Ziti: Thessaloniki, Greece, 1997; p. 304. [Google Scholar]
  40. NOA Seismic Network (HL)—Introduction. 2021. Available online: https://bbnet.gein.noa.gr/HL (accessed on 4 November 2021).
  41. Department of Geophysics—Geothermics. 2021. Available online: http://www.geophysics.geol.uoa.gr (accessed on 4 November 2021).
  42. Τομέας Γεωφυσικής A.Π.Θ. 2021. Available online: http://geophysics.geo.auth.gr (accessed on 4 November 2021).
  43. UPSL—Uni. Patras Seismological Laboratory. 2021. Available online: http://seismo.geology.upatras.gr (accessed on 4 November 2021).
  44. Scolv—SeisComP3 Seattle Documentation. 2021. Available online: https://www.seiscomp.de/seiscomp3/doc/seattle/current/apps/scolv.html (accessed on 4 November 2021).
  45. Hellenic Strong Motion Network. Available online: https://accelnet.gein.noa.gr (accessed on 19 July 2021).
  46. Styron, R.; Pagani, M. The GEM Global Active Faults Database. Earthq. Spectra 2020, 36, 160–180. [Google Scholar] [CrossRef]
  47. EU-DEM. 2021. Available online: https://land.copernicus.eu/imagery-in-situ/eu-dem (accessed on 18 January 2021).
  48. Ammon, C.J.; Velasco, A.A.; Lay, T.; Wallace, T.C. Foundations of Modern Global Seismology; Elsevier: Amsterdam, The Netherlands, 2021. [Google Scholar]
  49. Katsumata, A. Comparison of magnitudes estimated by the Japan Meteorological Agency with moment magnitudes for intermediate and deep earthquakes. Bull. Seism. Soc. Am. 1996, 86, 832–842. [Google Scholar] [CrossRef]
  50. Richter, C.F. An instrumental earthquake magnitude scale. Bull. Seism. Soc. Am. 1935, 25, 1–32. [Google Scholar] [CrossRef]
  51. Ganas, A.; Roumelioti, Z.; Karastathis, V.; Chousianitis, K.; Moshou, A.; Mouzakiotis, E. Erratum to: The Lemnos 8 January 2013 (M w = 5.7) earthquake: Fault slip, aftershock properties and static stress transfer modeling in the north Aegean Sea. J. Seism. 2015, 19, 273. [Google Scholar] [CrossRef] [Green Version]
  52. Ganas, A.; Kourkouli, P.; Briole, P.; Moshou, A.; Elias, P.; Parcharidis, I. Coseismic Displacements from Moderate-Size Earthquakes Mapped by Sentinel-1 Differential Interferometry: The Case of February 2017 Gulpinar Earthquake Sequence (Biga Peninsula, Turkey). Remote Sens. 2018, 10, 1089. [Google Scholar] [CrossRef] [Green Version]
  53. Mogi, K. Some features of recent seismic activity in and around Japan, 2, Activity before and after great earthquakes. Bull. Earthq. Res. Inst. 1969, 47, 395–417. [Google Scholar]
  54. BBNET—Hellenic Unified Seismic Network (HUSN). 2021. Available online: https://bbnet.gein.noa.gr/HL/real-time-plotting/husn/husnmap (accessed on 4 November 2021).
  55. ORFEUS Data Center WebDC3 Web Interface. 2021. Available online: http://orfeus-eu.org/webdc3/ (accessed on 4 November 2021).
  56. ORFEUS—Strong Motion Data. 2021. Available online: http://orfeus-eu.org/data/strong/ (accessed on 4 November 2021).
  57. Available online: http://www.orfeus-eu.org/eida (accessed on 4 November 2021).
Figure 1. Station distribution for the HUSN for the studied region, Kos Island, Eastern part of Greece. Red lines correspond to the main active faults for the study area [46]. Copernicus Land Monitoring Service used for DEM [47], while red dot lines represent the volcanoes buffer 15 km region. Red triangles represent the seismological stations belonging to the National Observatory of Athens Institute of Geodynamics [40], yellow triangles correspond to the seismological stations belong to the A.U.Th. Seismological Network [42], and green squares represent the stations that belong to the Hellenic Strong Motion Network [45].
Earth 02 00053 g001
Figure 2. Red lines correspond to the main active faults for the study area [46]. General seismicity map of the broader area of the Eastern part of Greece. Copernicus Land Monitoring Service used for DEM [47]. Green dot lines represent the volcanoes buffer 15 km region.
Earth 02 00053 g002
Figure 3. Number of seismological recordings per year for 1198 manually located events.
Earth 02 00053 g003
Figure 4. Magnitude distribution for the 1198 seismological records for the period 2010–2020.
Earth 02 00053 g004
Figure 5. Distribution of the magnitude as a function of depth.
Earth 02 00053 g005
Figure 6. Distribution of the time as a function of distance from Kos Island for the 1198 records. On the X-axis appears the time (years), while the distance (km) of each event from Kos Island appears on the Y-axis.
Earth 02 00053 g006
Figure 7. Location with time as a function of magnitude for the 1198 records. On the X-axis appears the magnitude (ML) of each event from Kos Island, Greece, while on the Y-axis appears the time (years).
Earth 02 00053 g007
Table 1. Characteristics of the Seismological stations in the study area. Station coordinates are in decimal degrees and elevation is in m. The first ten stations belong to the National Observatory of Athens network, while the last four to A.U.Th. Seismological Network. Sources: [40,41].
StationsLatitude (°)Longitude (°)Elevation (m)DataloggerSeismometer
APE37.072725.523608PS6-SCSTS-2
ARG36.213528.1212148DR24-SCLE-3D/20
KARP35.547127.161524PS6-SCEpiSensor FBA ES-T
KSL36.150329.585664PS6-SCCMG-3ESPC/60
LAST35.16225.478870PS6-SCCMG-40T/30
LIA39.897225.180567PS6-SCCMG-5TD
NISR36.610627.130948PS6-SCCMG-40T/30
PRK39.245626.2649130EDR-209STS-2
SMG37.704226.8377348DR24-SCTrillium 120P
SMTH40.470925.5305365PS6-SCCMG-3ESPC/60
ZKR35.114726.217270PS6-SCSTS-2
CHOS38.386826.0506854CENTAURT3P23
SIGR39.211425.855392Τ35012CMG-3ESP/100sec
LOS39.93325.0810°460S-13TRIDENT
NIS136.602327.1782378T35362CMG-3ESP/100
Table 2. Characteristics of stations belong to the Strong Motion Network in the study area. Station coordinates are in decimal degrees, and elevation is in m. All the stations that appear on the table belong to the National Observatory of Athens network. Sources: [45].
StationsLatitude (°)Longitude (°)Elevation (m)Sensor
SMTA40.470925.5304360CMG-5TDE
LIAA39.897225.180558CMG-5TDE
PRKA39.245626.2651120CMG-5TDE
MTLA39.104226.553212QDR
PSRA38.539725.56213CMG-5TDE
CHIA38.371326.13628QDR
SAMA37.753726.980616CMG-5TDE
IKRA37.611126.292830CMG-5TDE
TNSA37.539425.163121CMG-5TDE
AMGA36.831525.8938300CMG-5TDE
KLNA36.95726.972735CMG-5TDE
NSRA36.610627.130940CMG-5TDE
ASTA36.545426.352865CMG-5TDE
THRA36.41525.4324220CMG-5TDE
RODB36.447128.221126CMG-5TDE
ARCA36.213528.1214177QDR
EFSA39.540124.98865CMG-5TDE
Table 3. Magnitude, Depth Statistics for the Entire Database (Number and Percentage of Three-Component Records per Interval).
Magnitude MLDepth (km)
d ≤ 1010 < d ≤ 2020 < d ≤ 3030 < d ≤ 5050 < d ≤ 70d > 70
Total156 (13.02%)563 (46.99%)291 (24.29%)151 (12.60%)13 (1.08%)24 (2.0%)
1.0 ≤ M < 2.01 (0.0008%)13 (1.08%)7 (0.58%)1 (0.0008%)00
2.0 ≤ M < 3.051 (4.25%)293 (24.45%)186 (15.52%)96 (8.01%)8 (0.66%)8 (0.66%)
3.0 ≤ M < 4.089 (7.42%)243 (20.28%)93 (7.76%)50 (4.17%)5 (0.41%)11 (0.91%)
4.0 ≤ M < 5.014 (1.16%)13 (1.08%)5 (0.41%)4 (0.33%) 04 (0.33%)
5.0 ≤ M < 6.01 (0.0008%)00001 (0.0008)
6.0 ≤ M < 7.001 (0.0008%)0000
Publisher’s Note: MDPI stays neutral with regard to jurisdictional claims in published maps and institutional affiliations.

