Article

Techno-Economic Analysis of Peer-to-Peer Energy Trading Considering Different Distributed Energy Resources Characteristics

1
Institute for Research in Technology (IIT), ICAI School of Engineering, Comillas Pontifical University, 28015 Madrid, Spain
2
Department of Electrical Engineering, Faculty of Energy Engineering, Aswan University, Aswan 81528, Egypt
3
Department of Electrical Engineering, Faculty of Engineering, Aswan University, Aswan 81542, Egypt
4
Department of Electronics and Communications Engineering, Higher Institute of Engineering and Technology, Al-Tod, Luxor 85842, Egypt
*
Author to whom correspondence should be addressed.
Electricity 2025, 6(4), 57; https://doi.org/10.3390/electricity6040057
Submission received: 11 August 2025 / Revised: 26 September 2025 / Accepted: 2 October 2025 / Published: 4 October 2025

Abstract

Peer-to-peer (P2P) energy trading has emerged as a novel approach to enhancing the coordination and utilization of distributed energy resources (DERs) within modern power distribution networks. This study presents a techno-economic analysis of different DER characteristics, focusing on the integration of photovoltaic (PV) systems and energy storage systems (ESS) within a community-based P2P energy trading framework in Aswan, Egypt, under a time-of-use (ToU) electricity tariff. Eight distinct cases are evaluated to assess the impact of different DER characteristics on P2P energy trading performance and an unbalanced low-voltage (LV) distribution network by varying the PV capacity, ESS capacity, and ESS charging power. To the best of the authors’ knowledge, this is the first study to comprehensively examine the effects of different DER characteristics on P2P energy trading and the associated impacts on an unbalanced distribution network. The findings demonstrate that integrating PV and ESS can substantially reduce operational costs—by 37.19% to 68.22% across the analyzed cases—while enabling more effective energy exchanges among peers and with the distribution system operator (DSO). Moreover, DER integration reduced grid energy imports by 30.09% to 63.21% and improved self-sufficiency, with 30.10% to 63.21% of energy demand covered by community DERs. However, the analysis also reveals that specific DER characteristics—particularly those with low PV capacity (1.5 kWp) and high ESS charging rates (e.g., ESS 13.5 kWh with 2.5 kW inverter)—can significantly increase transformer and line loading, reaching up to 19.90% and 58.91%, respectively, in Case 2. These setups also lead to voltage quality issues, such as increased voltage unbalance factors (VUFs), peaking at 1.261%, and notable phase voltage deviations, with the minimum Vb dropping to 0.972 pu and maximum Vb reaching 1.083 pu. These findings highlight the importance of optimal DER sizing and characteristics to balance economic benefits with technical constraints in P2P energy trading frameworks.

1. Introduction

The urgent need to address climate change and reduce greenhouse gas emissions has accelerated the global transition toward sustainable and low-carbon energy systems. Renewable energy sources such as solar, wind, hydro, and biomass play a critical role in this transition due to their natural replenishment and minimal environmental impact. Among these, distributed energy resources (DERs), including photovoltaic (PV) systems, wind turbines, energy storage systems (ESS), combined heat and power (CHP), and controllable loads, enable decentralized energy generation and management at the local level. DERs enhance energy access, reduce emissions, and improve grid resilience.
Photovoltaic systems and energy storage have emerged as the most widely adopted DER technologies in residential and community energy systems driven by their modularity, scalability, and rapidly declining costs. However, integrating these resources into existing power grids introduces significant technical challenges related to voltage stability, power quality, and infrastructure capacity, especially when deployment is uncoordinated. Addressing these challenges is essential to unlock the full potential of DERs in facilitating more flexible, reliable, and sustainable energy networks [1].
Uncertainty modeling plays a crucial role in energy market optimization, especially in systems incorporating DERs. Various uncertainty modeling techniques, such as stochastic programming, scenario-based methods, and Conditional Value at Risk (CVaR), have been widely applied in the literature to address uncertainty in energy systems. For example, stochastic programming is commonly used to model uncertainties in multi-energy distribution systems, taking into account external factors such as natural disasters [2]. Similarly, risk-averse optimization and CVaR techniques are integrated to optimize multi-energy systems while considering constraints like carbon emissions [3].
The increasing integration of DERs within low-voltage (LV) distribution networks has catalyzed a paradigm shift in the structure and operation of electrical power systems [4,5]. Passive consumers are being transformed into active “prosumers”—individuals or entities capable of both generating and consuming electricity. Technologies such as PV [6] and ESS have enabled this transition, allowing energy to be produced and stored at the point of consumption. This evolution aligns with emerging paradigms such as hybrid AC/DC microgrids, which are considered foundational for the smart cities of the future [7]. As a result, new models of energy interaction have emerged, among which peer-to-peer (P2P) energy trading has gained significant attention. This decentralized market structure allows prosumers to directly exchange energy with each other, complementing the existing centralized wholesale market and the supply models driven by distribution system operators (DSOs) [8,9].
P2P energy trading enables prosumers who generate surplus electricity to sell or share it with others experiencing a simultaneous energy deficit. By facilitating the localized balancing of energy supply and demand, P2P trading enhances the self-sufficiency of communities and reduces reliance on upstream grid infrastructure [10]. This model supports greater penetration of renewable energy and provides a market-based mechanism for increasing the flexibility and resilience of LV distribution networks. Numerous studies have highlighted the benefits of P2P trading, including reduced total energy costs, increased consumption of locally generated renewable energy, improved utilization of DERs, and enhanced user engagement in energy markets [11,12]. Furthermore, pilot projects and experimental implementations worldwide have demonstrated the technical and economic viability of P2P energy trading systems, especially within energy communities and microgrids connected to distribution networks [13].
Despite these promising developments, the academic literature remains limited in its evaluation of the technical impacts of P2P energy trading on LV distribution networks, particularly in the context of grid constraints. While economic and market-based aspects of P2P trading have been extensively studied, fewer investigations have addressed its influence on operational variables such as voltage profiles, power losses, transformer and line loading, and overall system stability. Those that do exist often simplify the network modeling by excluding real-world grid limitations or assuming idealized conditions. For example, studies have shown that under low levels of DER penetration and trading, the introduction of P2P markets does not violate standard network constraints [14]. However, at higher levels of DER penetration, especially when combined with flexible resources such as ESS, certain operating limits may be exceeded, leading to issues such as voltage unbalance, excessive peak demand, and increased power losses [15,16].
Specifically, the presence of ESS has been observed to introduce greater complexity into grid operations. Although storage can enable time-shifting of energy and support load balancing, its uncontrolled or poorly coordinated usage may lead to undesirable grid impacts. Research indicates that when ESS is integrated into P2P trading systems, the resulting charging and discharging cycles may intensify voltage deviations and increase network losses, particularly during high-demand winter months or high-generation summer periods [17,18]. In some cases, voltage magnitudes have been reported to exceed permissible limits, particularly at end nodes in radial networks, where grid support is lowest. Such deviations are often linked more closely to generation surpluses from PV systems than to the trading mechanism itself [19]. Similarly, ESS operations have been linked to increased voltage unbalance and overheating in certain network components, indicating that without coordinated control, even beneficial technologies may degrade network performance [20].
Nevertheless, there is also evidence that with appropriate control strategies and network-aware market mechanisms, P2P energy trading can provide significant operational benefits. For example, one study incorporating network tariff design into P2P frameworks reported a 34.3% reduction in community peak demand without compromising economic viability or violating operational constraints [21]. This highlights the potential of P2P markets to not only increase DER utilization but also to improve grid efficiency, provided that their operation is harmonized with network conditions. Furthermore, systems that include flexible resources such as controllable loads, smart inverters, and demand response schemes are better positioned to mitigate potential issues and maximize the benefits of P2P integration [22].
Recent works have highlighted the importance of DER coordination and optimized P2P energy trading frameworks. For instance, a recent study proposed a 3D design of a small hybrid energy farm tailored for microgrid applications [23], and ref. [24] introduced an optimal P2P energy transaction mechanism among distributed prosumers in high-penetration renewable systems. A number of studies have focused on the optimal sizing of DERs within the context of P2P energy trading. These works explore scenarios where participants—ranging from microgrids to various building types or households—can exchange energy. For instance, particle swarm optimization and game theory were applied in [25] to size DERs in interconnected microgrids, aiming to reduce supply loss and enhance profits. Follow-up studies [26,27] expanded on this concept. In [28], reinforcement learning was used to plan and manage community battery systems in South Korea, targeting peak demand reduction and improved economic outcomes. Other approaches include bi-level optimization with genetic algorithms to balance battery costs and self-sufficiency [29] and genetic algorithms applied to optimize battery installations in Japanese commercial buildings [30] and U.S. university campuses [31], often comparing centralized vs. decentralized systems. Mixed-integer linear programming was utilized in Turkey for PV and battery planning with P2P trading [32], while game theory guided DER planning in Italy using Portuguese data due to local profile unavailability [33]. A separate Spanish study optimized PV deployment in residential communities to increase local generation and profitability [34]. Another study proposes a linear programming framework for the optimal planning and operation of DERs within a residential energy community in Spain [35]. However, none of these studies provides a comprehensive analysis of the impact of different DER sizes on P2P energy trading performance and the associated impacts on unbalanced distribution networks.
While previous studies offer valuable insights into P2P trading and DER integration, many are based on simplified network models and overlook the real-world complexities of unbalanced LV distribution networks. Additionally, the effects of varying DER sizes, especially PV and ESS, on key grid performance indicators remain underexplored. These gaps are particularly evident in regions like Egypt. Therefore, more comprehensive studies are required to bridge these technical and regional gaps.
In light of these findings, there is a clear need for more comprehensive research that evaluates the technical implications of P2P energy trading within realistic LV distribution network conditions. This includes assessing how different characteristics of PV systems and ESS influence key grid performance indicators such as peak demand, power flow patterns, voltage stability, and DER contributions. Understanding these impacts is critical for designing P2P trading platforms that are both economically attractive and technically feasible. This paper addresses this gap by investigating the operational impacts of different P2P energy trading cases within a modeled LV distribution network. Through detailed simulations and analyses that incorporate different DER characteristics—including variations in PV capacity, ESS capacity, and charging/discharging capabilities—we evaluate how P2P trading impacts peak demand, energy self-sufficiency, local trading volume, voltage variations, voltage unbalance, and network components loading (i.e., transformer and lines).
To our knowledge, this paper is the first to comprehensively investigate the operational implications of P2P energy trading in LV distribution networks under different DER integration characteristics. The findings offer valuable insights into the technical viability of P2P models and provide practical recommendations for enhancing DER coordination and system performance in decentralized energy systems. Table 1 provides a comparative overview between this study and related research. Although the referenced studies vary in terms of experimental setup, timeframe, and DER configurations, the table aims to illustrate the variety of evaluation approaches, not to offer a direct performance comparison.
Contributions to this study are summarized as follows:
  • A P2P energy trading model for a community equipped with photovoltaic (PV) systems and energy storage systems (ESS) connected to an unbalanced low-voltage (LV) distribution network. The novelty lies in combining market-based optimization with unbalanced three-phase power flow analysis, which is not commonly addressed in earlier P2P studies.
  • An evaluation of the techno-economics of coordinated DER management using P2P energy trading under a time-of-use tariff (ToU), considering different DER characteristics and operational parameters. Compared to fixed-size DER models in previous work, this study explores eight practical DER setups, leading to a cost reduction of up to 68.22% and self-sufficiency increase from 0% to 63.21% in optimal cases.
  • A techno-economic comparison of the analyzed cases, focusing on operational costs, energy imports/exports, energy trading volume, peak grid consumption, and the proportion of demand met by local DERs. This detailed comparative analysis helps identify DER combinations that maximize local energy exchange while minimizing grid dependency.
  • An evaluation of the technical impacts of P2P energy trading on the LV distribution network under different DER characteristics, with attention paid to key parameters such as voltage profiles, voltage unbalance, and component loading. The results show that poorly coordinated DER configurations (e.g., high ESS charging with low PV) can lead to voltage unbalance up to 1.26%, emphasizing the importance of DER sizing and control.
The remainder of this paper is organized as follows: Section 2 introduces the P2P energy trading model and outlines the approaches used to evaluate its impact on the LV distribution network. Section 3 provides a detailed description of the case study, including the characteristics of the LV distribution network, generation profiles, characteristics of DERs, electricity pricing under a ToU tariff, and the cases studied in the analysis. Section 4 presents and discusses the results, focusing on the technical impacts of P2P energy trading across the studied cases. Finally, Section 5 concludes the paper by summarizing the key findings and offering directions for future research.

2. Modeling Approach

To assess the impacts of P2P energy trading considering different DER characteristics on distribution networks and their consequent effects on network reliability and performance, this study employs a two-stage cascading modeling framework. The first stage involves a centralized P2P energy trading optimization, which determines the optimal energy dispatch schedules for all community households collectively that are connected to the same LV distribution network. The second stage uses a three-phase alternating current (AC) power flow analysis to evaluate the physical grid impacts resulting from the dispatch profiles obtained in the first stage.
The optimization problem in the first stage is formulated as a linear programming model and solved using MATLAB 2021a with an hourly resolution. Inputs to the MATLAB optimization include household demand profiles, electricity pricing signals, PV generation profiles, and DER ratings. The output consists of net demand profiles for each prosumer and corresponding DER dispatch schedules, reflecting energy exchanges in the P2P market.
Subsequently, the net demand profiles serve as inputs for the detailed power flow analysis performed using the open-source Pandapower software version 2.9.0 [36,37]. Pandapower conducts a comprehensive three-phase power flow calculation based on detailed LV distribution network data and prosumer net demands. The outputs from this stage provide key electrical parameters, including phase voltage magnitudes, voltage unbalance factors, and loading levels on network components such as lines and transformers.
Figure 1 illustrates the overall schematic of the P2P energy trading optimization and its impact evaluation process, highlighting the data flow between the P2P energy trading model and physical network assessment. This integrated approach enables a holistic evaluation of how P2P trading, influenced by DER characteristics, affects both energy dispatch decisions and distribution network operational conditions.

2.1. Modeling of P2P Energy Trading

The P2P energy trading model is formulated as a linear multi-period optimization problem over a trading horizon T (i.e., one month). The model considers a community of h households, each equipped with DERs such as PV systems and ESS.
The objective of the optimization is to maximize the community’s economic benefit by minimizing the total cost of energy imported from the DSO, while maximizing revenue from exporting surplus energy to the DSO. p ( t ) G is the import price from DSO and p ( t ) E is the export price to DSO at time instant t . G t , h represents the energy imported from the DSO by household h at time instant t , while E t , h represents the energy exported to the DSO by household h at time instant t . The objective function of the problem is indicated by (1), as proposed in [19,21,38].
m i n t   h (     p ( t ) G G t , h p ( t ) E E t , h )   Δ t
The P2P energy trading model is subject to a set of operational constraints, which fall into three general categories: energy balance constraints, P2P trading constraints, and DER operating constraints.
Energy balance constraints ensure that, for each household h and at each time instant t, the total energy supply (energy imported from DSO G t , h , energy imported from peers I t , h P 2 P , PV generation P V   t , h , and ESS discharging power D t , h E S S ) equals or exceeds the total energy demand (energy exported to DSO E t , h , energy exported to peers X t , h P 2 P , demand D e m t , h , and ESS charging power C t , h E S S ). For a household equipped with both PV and ESS, the energy balance is represented by (2):
G t , h + I t , h P 2 P +   P V   t , h + D t , h E S S E t , h + X t , h P 2 P + D e m t , h + C t , h E S S                         t T ,   h H
This constraint guarantees that all demand components (consumption, charging, and exports) are satisfied by available energy sources (DSO, P2P, PV, and storage discharge). For households without PV or ESS, the corresponding terms ( P V   t , h , D t , h E S S ,   E t , h ,   X t , h P 2 P , a n d   C t , h E S S ) are excluded from the equation.
In the proposed community energy system, households (peers) can engage in P2P energy trading without requiring direct physical connections. Instead, trades are facilitated via the shared LV distribution network. To ensure consistency in energy accounting, the following constraints govern P2P transactions:
The energy imported by household h from peer p at time instant t, denoted   I ( t , h p ) p , must equal the energy exported by peer p to household h, X t , p h p , adjusted by a P2P trading efficiency factor ψ P 2 P , as indicated by (3):
I ( t , h p ) p = ψ P 2 P X t , p h p                     p h , t T ,   h H
where ψ P 2 P is the loss factor set to 0.95 (i.e., a 5% loss during trading).
The total P2P energy exported by household h H at time instant t, X ( t , h ) P 2 P , is the sum of its exports to all other peers, as indicated by (4).
X ( t , h ) P 2 P = p h   X ( t , h p ) p , P 2 P                           t T ,   h H
Similarly, the total energy imported by household h H at time instant   t , I ( t , h ) P 2 P , is the sum of all imports from peers, as indicated by (5).
I ( t , h ) P 2 P = p h     I ( t , h p ) p , P 2 P t T ,   h H
To maintain energy balance across the entire community, the total P2P energy imported must equal the total energy exported, accounting for network losses. This is ensured by the following constraint, indicated by (6).
h   ψ P 2 P X ( t , h ) P 2 P = h     I ( t , h ) P 2 P                                           t T
The operation of ESS is governed by several physical and technical limitations, including charge/discharge power limits, state of charge (SoC) levels, and energy conservation dynamics.
The charging C ( t , h ) E S S and discharging D ( t , h ) E S S rates for each ESS are constrained by their respective maximum power ratings, as indicated by (7) and (8). Where C E S S and D E S S are the maximum limits of charging and discharging, respectively.
0 C ( t , h ) E S S C E S S             t T ,   h H
0 D ( t , h ) E S S D E S S             t T ,   h H
Each battery’s SoC is restricted to remain within a defined operational range, typically between 20% and 100% of its storage capacity. The lower and upper levels for energy stored   S ( t , h ) E S S in kWh for each ESS, denoted as   S _ E S S and S E S S , respectively, are indicated by (9).
  S _ E S S S ( t , h ) E S S S E S S                 t T ,   h H
This operational range is chosen to protect battery health and extend its lifespan, as recommended by battery management best practices and manufacturer guidelines.
The evolution of the SoC over time is modeled based on the previous time step’s SoC and the charging/discharging activity, considering round-trip efficiencies for charging η c E S S and discharging η d E S S , indicated by (10).
S ( t , h ) E S S = S ( t 1 , h ) E S S + η c E S S C t , h E S S   Δ t 1 / η d E S S D ( t , h ) E S S Δ t           t T ,   h H
At the beginning of the simulation (e.g., the first hour of the first day), the SoC of each ESS is initialized to a random value between 20% and 80% of its maximum capacity. For each subsequent day, the final SoC of the previous day becomes the initial SoC for the current day, ensuring continuity across the simulation horizon.

2.2. Evaluation of Impacts on the LV Distribution Network

The power flow analysis evaluates the impact of DER dispatch resulting from P2P energy trading on the operation of the LV distribution network. Following the identification of the optimal trading case by the P2P energy trading optimization model, a power flow simulation is performed. The net active power demand at each connection point is defined as the total capacity imported, both from the DSO and through P2P trading, minus the total capacity exported, including both local consumption and P2P exports. Thus, (11) indicates the net active power demand P ( t , h ) n for each household   h at each time instant t .
P ( t , h ) n = G ( t , h ) + I ( t , h ) P 2 P E ( t , h ) X ( t , h ) P 2 P                                                                                     t T ,   h H
Pandapower uses P ( t , h ) n as an input to run the power flow. It is assumed that the charging and discharging of ESS occur behind the node connection point and are therefore not explicitly included in (11). Additionally, the P2P trading model used in this study focuses solely on the exchange of active power and does not account for reactive power flows. Accordingly, the power flow simulations are conducted under the assumption of a constant power factor of 0.95 pu.
The model excludes reactive power dynamics and uses aggregated load profiles instead of capturing load diversity at the household level. These choices were made based on data availability and customers’ privacy constraints. The available data from the DSO is at the transformer level supplying the residential customers and for active power only.

3. Case Study

This section describes the LV distribution network employed as a case study, demand profiles, importing/exporting prices from/to the DSO, DER characteristics, and the cases considered for analysis.

3.1. LV Distribution Network

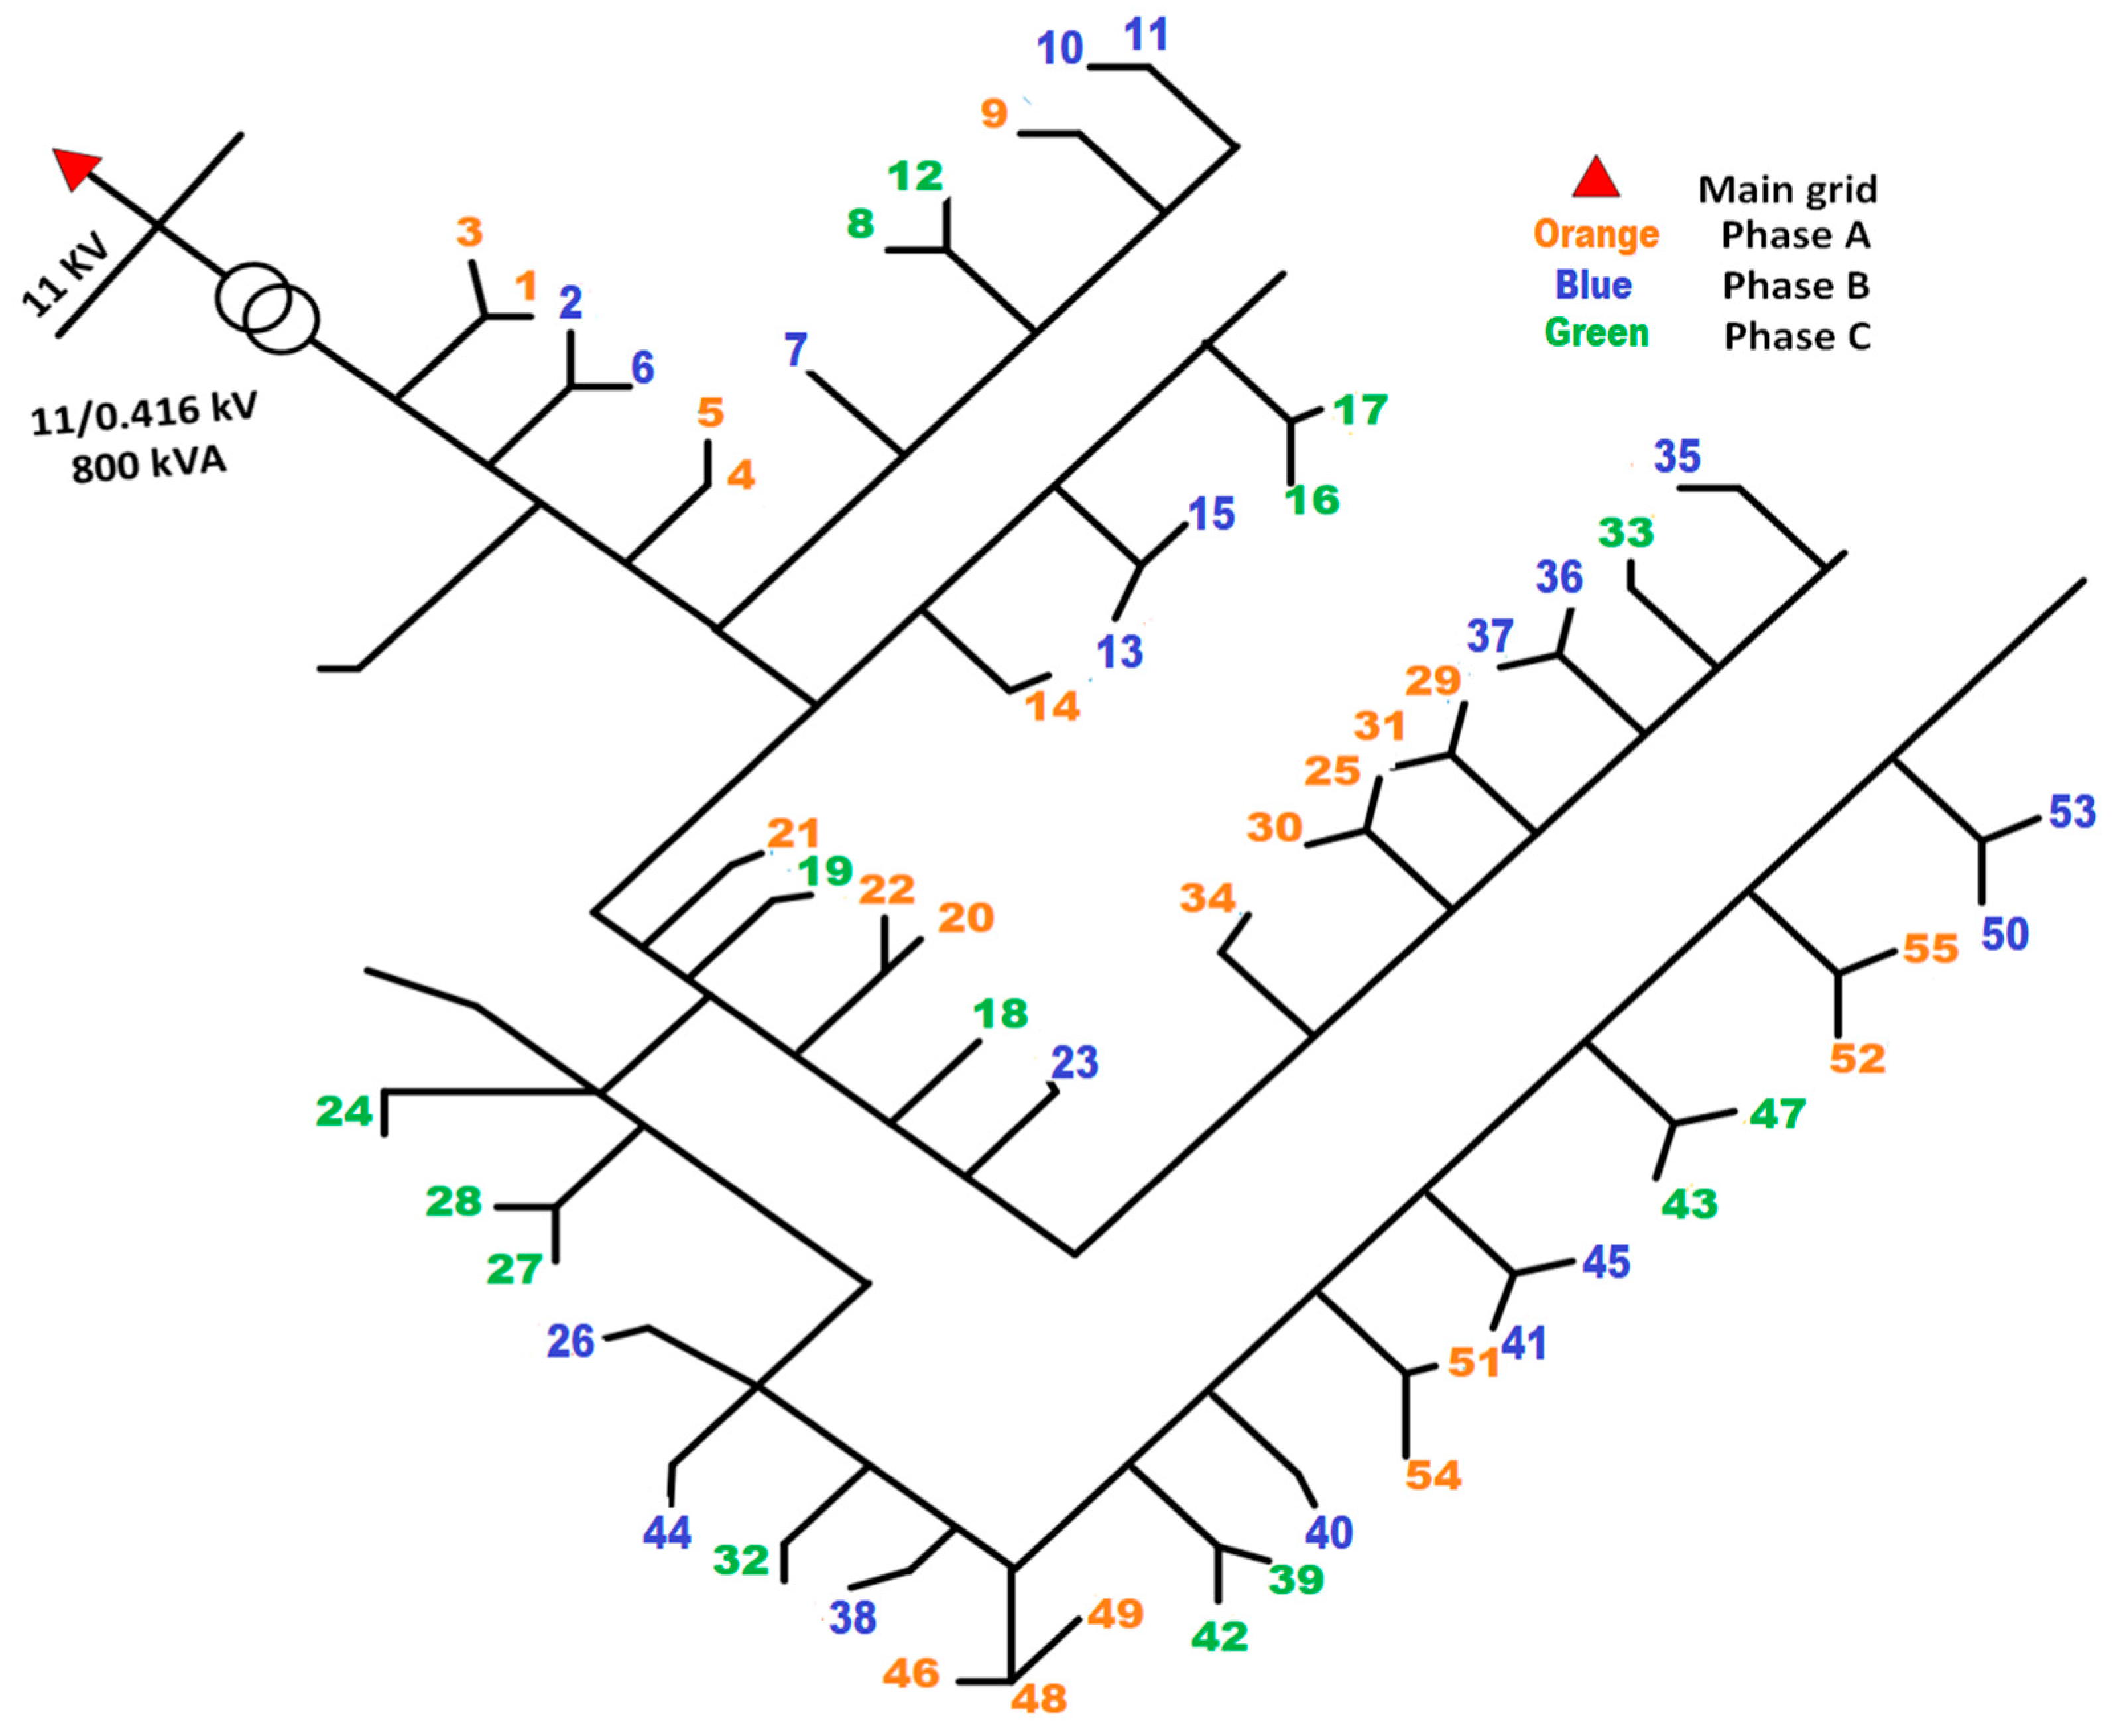
The case study utilizes the unbalanced IEEE European low-voltage test feeder [39], which is supplied by an 11 kV/0.416 kV transformer rated at 800 kVA. The transformer employs delta/grounded-star winding connections to step down the voltage for distribution. The LV distribution network comprises 55 single-phase consumers, each connected at distinct nodes along the feeder. The consumers are unevenly distributed across the three phases, as depicted in Figure 2: 21 consumers connected to Phase a (orange), 19 to Phase b (blue), and 15 to Phase c (green).

3.2. Demand Profiles

The demand profiles used in this study were derived from actual measurements recorded at the transformer connection point for residential customers in Aswan during June 2020. To generate individual household profiles, the total real power demand aggregated over the three phases was first averaged per consumer and subsequently scaled by a random factor ranging between 0.6 and 1.3 to reflect consumption variability. All profiles have an hourly resolution. Figure 3 presents the aggregate demand profiles for the 55 households over a three-day period, illustrating typical consumption behaviors within the network.

3.3. Electricity Prices

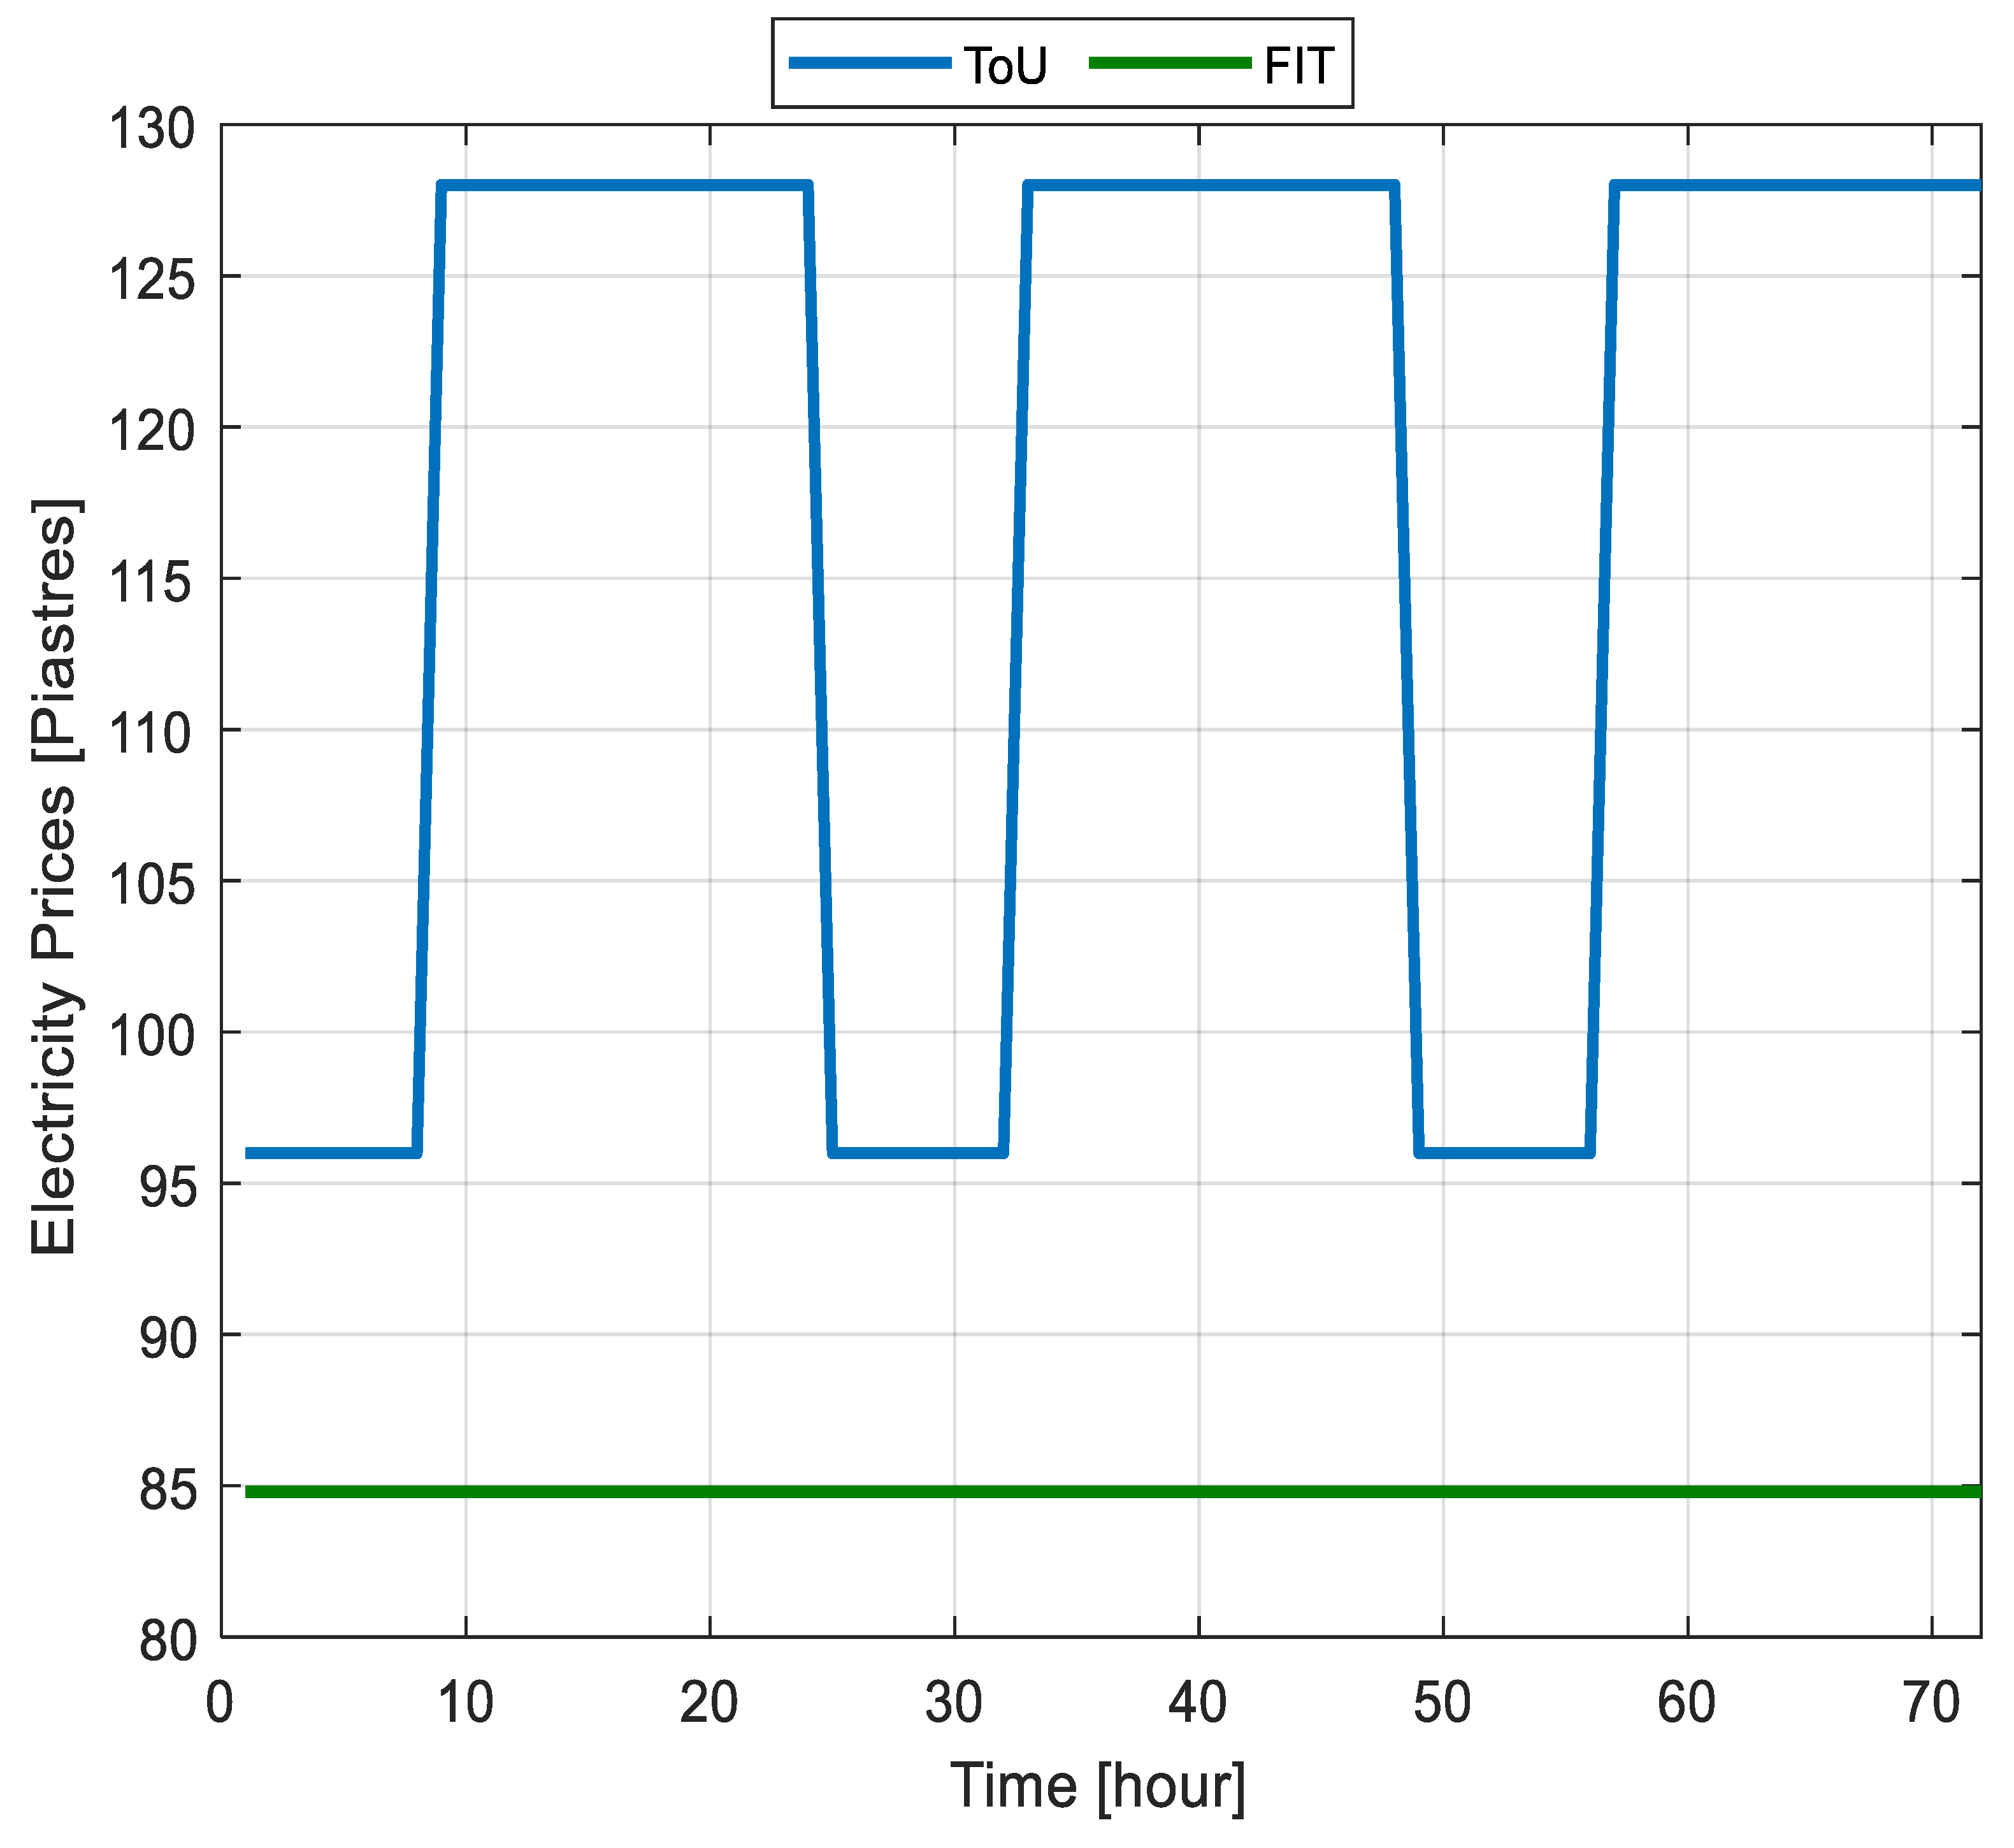
Currently, Egypt employs a flat electricity tariff structure, meaning the same rate applies regardless of the time of day. However, future regulatory frameworks are expected to incorporate time-of-use (ToU) tariffs with higher integration of local generation and flexible devices like ESS, electric vehicles, etc., which vary prices based on demand periods to incentivize consumers to shift their electricity consumption to off-peak periods. This study focuses on ToU pricing to analyze its effects on P2P energy trading. Flat tariff rates for 2022–2023 were obtained from the Egyptian Electric Utility and Consumer Protection Regulatory Agency (EgyptERA) [40], while ToU prices assume lower rates during nighttime hours. Selling prices, based on feed-in-tariffs (FIT) for exported energy, were sourced from [41] to reflect payments to prosumers. Figure 4 depicts the three-day price profile used in the simulations.

3.4. DER Characteristics

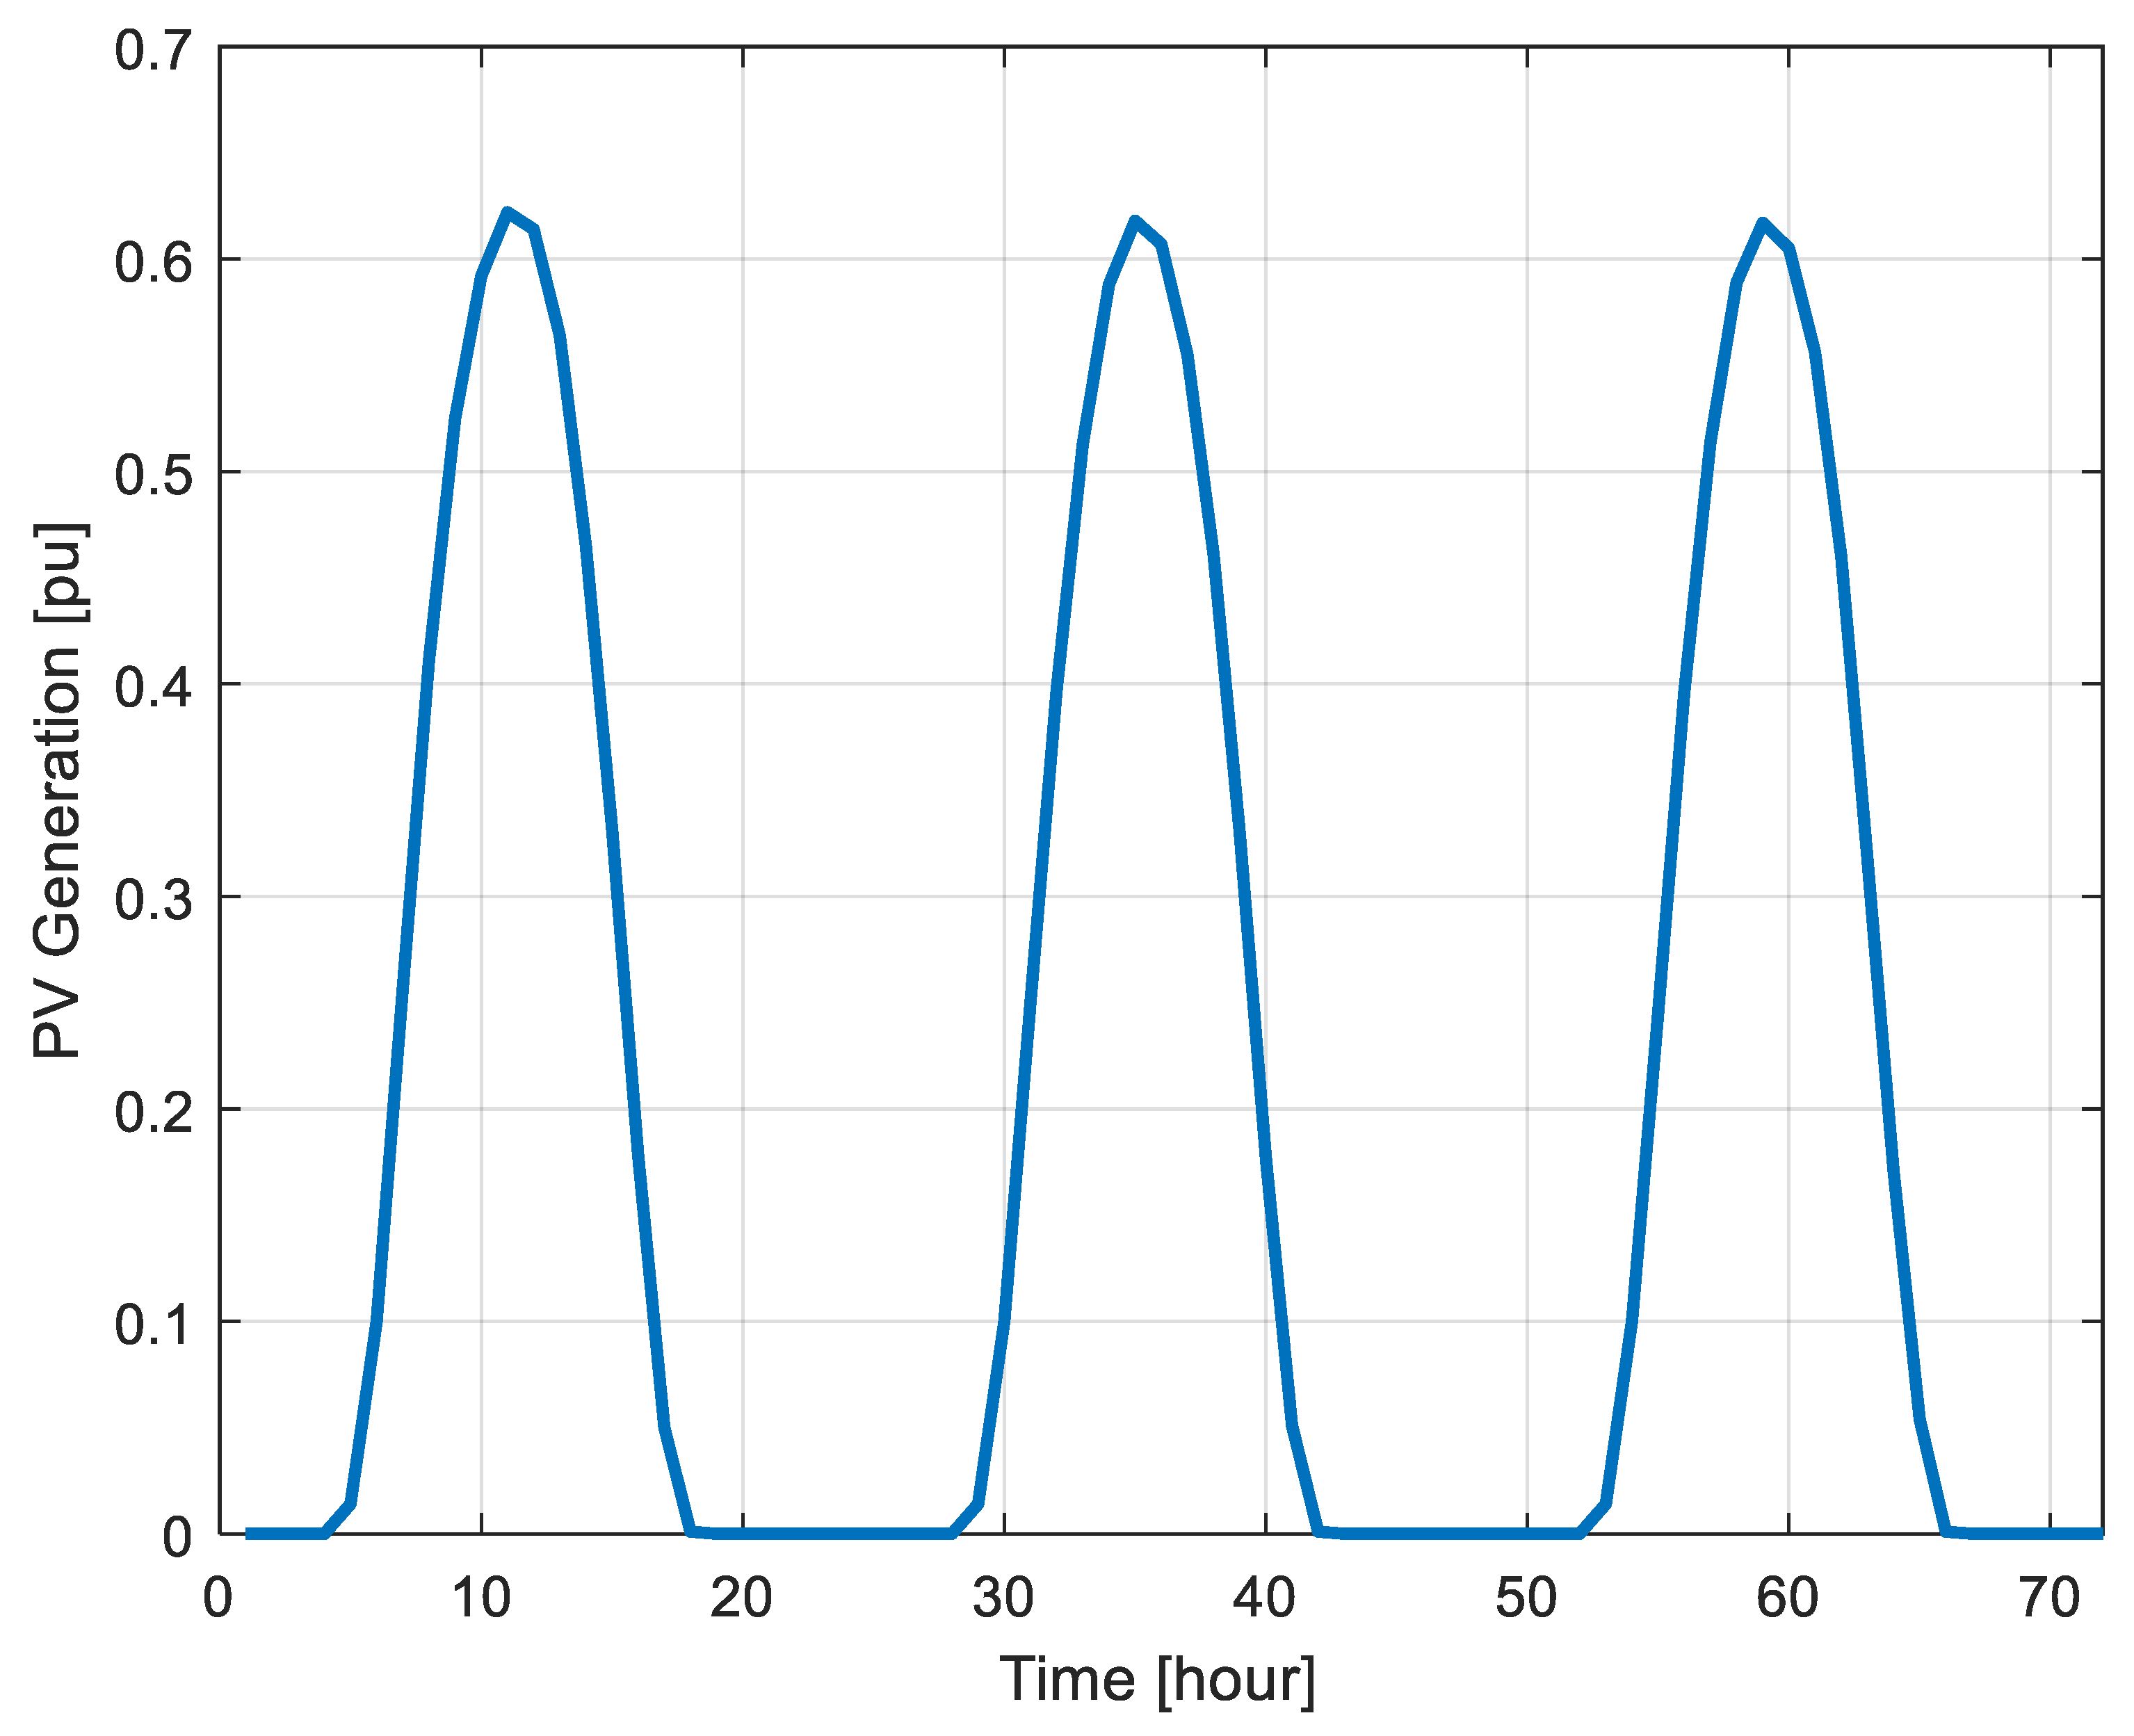
The network under study includes different DER characteristics, comprising PV systems and ESS. Households are categorized as either consumers without DERs or prosumers equipped with one or more DERs. Table 2 summarizes the DER installations across the network, indicating that 18 households are consumers without DERs, 33 households (60%) are prosumers equipped with PV systems, and 22 households (40%) have ESS installations. Historical PV generation profiles specific to Aswan were obtained from Renewables.ninja [42], which utilizes meteorological data from NASA’s MERRA-2 database dating back to 2019 [43]. Renewables.ninja does not model Maximum Power Point Tracking (MPPT) explicitly, but it assumes perfect MPPT so that PV output is always at the maximum possible level given the solar irradiance, weather, and system parameters.
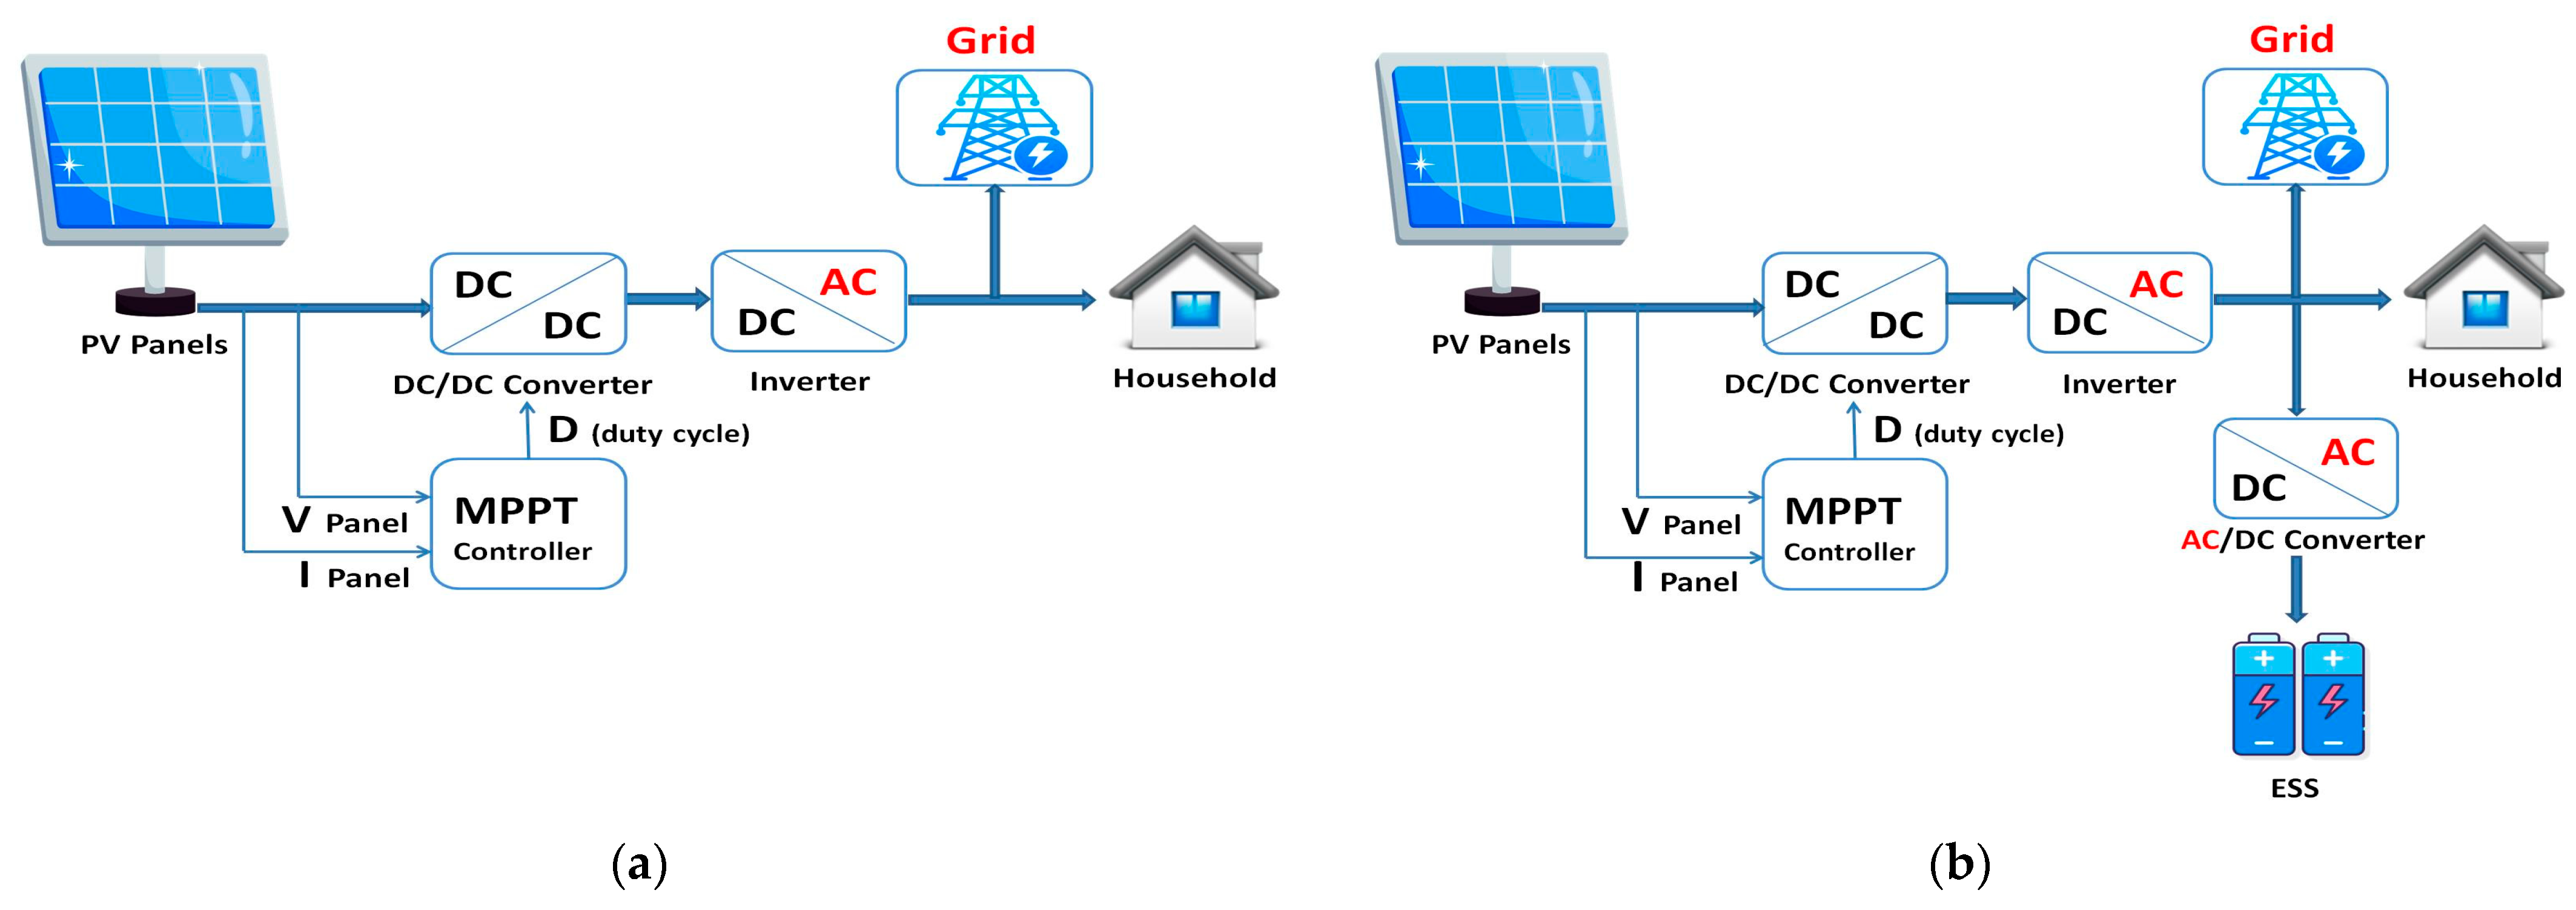
This modeling approach ensures that the operational behavior of PV systems is realistically represented in the simulation framework and adequately integrated into the P2P energy trading cases. Figure 5 depicts the typical PV generation for one household over three days. The ESS used in this study is modeled based on the specifications of the commercially available Tesla Powerwall. ESS units are modeled with charging and discharging efficiencies of 95%, representing realistic operational characteristics. The charging and discharging of the ESS are controlled to optimize the energy community objective function, and they are optimized centrally by the energy community manager. Figure 6 depicts the general structure of a household with integrated DERs and their conversion systems [44].

3.5. Analyzed Cases

This study compares eight cases to evaluate how different characteristics of DER impact the performance of P2P energy trading and the LV distribution network. Each case includes households equipped with various combinations of PV systems and ESS. These characteristics differ in terms of PV capacity (i.e., kWp), ESS energy capacity (i.e., kWh), and ESS charging power (i.e., kW). The values chosen for these parameters are based on commercially available residential DER systems, such as typical PV and ESS, ensuring practical relevance. Specifically, PV capacities of 1.5 kWp and 3 kWp represent common residential PV installations in Egypt used by customers to decrease their electricity bills, while ESS energy capacities (7 kWh and 13.5 kWh) and charging powers (2.5 kW and 5 kW) reflect widely used battery specifications. These configurations allow for a realistic assessment of DER integration under practical conditions. All DERs are operated under P2P energy trading, allowing households to use their DERs to cover their demand and exchange surplus energy locally before interacting with the DSO. These eight cases are evaluated against a base case in which no DER systems are installed and all households purchase electricity from the DSO at a ToU tariff. The comparison provides an in-depth analysis of how different DER characteristics influence grid dependency, operational costs, energy imports and exports, and overall system performance. The key attributes of the eight DER characteristics and the base case are summarized in Table 3.

4. Results

The presentation of results is divided into two main sections. The first section provides a comparative analysis of the techno-economic performance of the studied cases. The second section evaluates the impact of these cases on the LV distribution network.

4.1. Comparative Analysis of Techno-Economic Cases

This section presents a comparative analysis of the studied cases, focusing on key performance indicators such as operational costs, energy imports and exports, the proportion of demand met by DERs, peak grid consumption, and total energy traded locally within the P2P network. The simulation results for the eight DER characteristics, along with their comparison to the base case without DER integration, are summarized in Table 4. Similar techno-economic evaluations of P2P energy trading frameworks and their impacts on community energy systems have been reported in previous studies [11,12], demonstrating the importance of such analyses in optimizing DER integration and local energy markets.

4.1.1. Analysis of Operational Costs

The analysis of total electricity costs within the community’s P2P energy trading network reveals substantial variation across different DER characteristics. These differences are primarily driven by the combination of PV capacity and ESS characteristics. As presented in Table 4, the deployment of DERs, particularly cases combining PV and ESS, results in significant reductions in community total operational costs compared to the base case—with no DER integration—which depends entirely on electricity imported from the DSO. The base case incurred the highest operational cost at 24,139.86 EGP, reflecting typical dependence on the DSO.
In contrast, cases with DER integration achieved cost reductions ranging from approximately 37% to over 68%, depending on the installed DERs characteristics. The most cost-effective case—PV 3 kWp with ESS 13.5 kWh, characterized by a high PV and ESS capacity—achieved a 68.22% reduction in operational costs, particularly in Case 1 (PV 3 kWp with ESS 13.5 kWh and 5 kW) and Case 3 (PV 3 kWp with ESS 13.5 kWh and 2.5 kW), lowering the total energy costs to 7671.20 EGP. This reduction highlights the critical role of both PV generation and ESS in reducing DSO dependence. These findings are supported by previous studies, which showed that integrating PV and ESS can result in P2P markets delivering significant cost savings for end-users while supporting more flexible pricing schemes that enhance grid operations [16]. The significant savings result from the high self-consumption of renewable energy and the ability to store surplus energy for use during periods of high energy prices or low PV generation.
Cases with higher PV capacities generally resulted in lower operational costs due to increased renewable energy generation. This not only reduced electricity imports from the DSO but also enabled surplus energy exports, thereby generating additional revenue. For instance, cases with PV 3 kWp produced significantly more electricity than those with 1.5 kWp, enhancing energy independence. Moreover, higher ESS capacities facilitated load shifting and increased self-consumption, further decreasing reliance on the DSO. Interestingly, varying ESS charger power rates (2.5 kW or 5 kW) had no impact on operational costs, indicating that the ESS capacity is more critical than the charging rate in determining economic performance.
The analysis of energy import and export costs further illustrates the economic benefits of DER adoption. The base case meets all energy demand through imports, resulting in high costs and zero export revenue. Conversely, cases with DER integration significantly reduce import costs, with the lowest value—7836.56 EGP—observed in systems characterized by high PV and ESS capacities, specifically those combining PV 3 kWp with ESS 13.5 kWh (notably in Cases 1 and 3). Export revenues reached up to 2095.85 EGP, specifically those with PV 3 kWp with ESS 7 kWh (Cases 5 and 7), since the small ESS do not enable storing all the excess PV generation for house demand later use or local trading within the community. Cases with only PV 1.5 kWp capacity, however, recorded no export revenue due to the complete onsite consumption of generated energy within the community of households.
The integration of DERs, through appropriate combinations of PV generation and ESS, significantly reduces the operational costs of the community. As supported by previous studies, local electricity market approaches have been shown to effectively reduce energy costs for energy communities by maximizing the consumption of locally generated clean electricity, with PV and ESS combinations showing the highest economic potential [18]. Moreover, smart community-based electricity markets can achieve up to a 50% cost reduction in summer and boost local green energy consumption by over 30%, primarily through enhanced self-consumption and energy arbitrage enabled by PV and ESS [19]. These findings highlight the importance of carefully selecting DER capacities to maximize economic efficiency and energy independence within P2P energy trading frameworks.

4.1.2. Analysis of Energy Imports and Exports

A key objective of integrating DERs in P2P energy trading networks is to reduce dependence on the DSO by increasing local energy generation and its consumption within the community. Analyzing energy flows, specifically energy imports from the DSO and exports of surplus energy, provides valuable insights into how different DER characteristics affect system performance and economic outcomes. The results of community energy imports and exports are summarized in Table 4.
In the base case, without DER integration, the total energy imported from the DSO was 20,368.03 kWh over the simulation period. This reflects complete reliance on the DSO to meet the community’s energy demand. In contrast, all cases with DER integration significantly reduced DSO imports. The lowest import values—7492.60 kWh (a 63.21% reduction)—occurred in cases with a high PV and ESS capacity (PV 3 kWp with ESS 13.5 kWh), particularly in Cases 1 and 3. This demonstrates the effectiveness of high PV generation and ESS capacity in reducing grid consumption. Figure 7a illustrates energy imports from the DSO across all DER-integrated cases, showing periods of zero imports for Cases 1 to 8, during which prosumers met their demand through self-generation or by trading energy with other households at prices lower than those of the DSO.
No energy exports were recorded in the base case where all households were only consumers. However, in cases with DER integration, some exports to the DSO occurred, although prosumers primarily prioritized intra-community trading. As shown in Table 4 and Figure 7b, cases with a high PV and ESS capacity (PV 3 kWp with ESS 13.5 kWh) exported no energy or limited amounts of energy to the DSO, indicating enhanced self-consumption within the community by P2P energy trading or taking advantage of ESS flexibility in storing all or most of the surplus PV generation.
Notably, cases with a high PV capacity and low ESS, particularly Cases 5 and 7, achieved the highest export volumes, reaching 2471.53 kWh due to the limited ESS capacity. Conversely, systems with a low PV capacity (1.5 kWp), regardless of ESS size or charger rating, exhibited zero exports during the entire simulation period. In these cases, all generated energy was consumed locally, either directly by household loads, exchanged P2P within the community, or stored in the ESS for later use. Even when combined with relatively large storage (ESS 13.5 kWh), small-scale PV systems only met the immediate household demand, with no surplus available for export.
These findings highlight the critical role of a sufficient PV capacity in enabling both self-sufficiency and participation in P2P or exports to DSO. While smaller PV systems can reduce DSO dependence through localized generation and storage, they do not generate surplus energy for exporting to the DSO. These results align with previous studies showing that community energy trading can reduce electricity costs, decrease exports to DSO, and increase self-sufficiency through DERs [11,12].

4.1.3. Analysis of Peak Grid Consumption

The analysis of peak grid consumption across different DER characteristics reveals significant variation, primarily influenced by the combination of PV capacity and ESS characteristics. As presented in Table 4, the base case—without any DER integration—recorded grid consumption with the highest value of 61.20 kW during the studied month, with 100% of the energy demand supplied by the DSO.
With the introduction of DERs, peak consumption levels varied significantly across the studied cases. The most notable reduction occurred in cases combining a high PV capacity with a low ESS capacity (PV 3 kWp, ESS 7 kWh), regardless of the ESS charger rate (5 kW or 2.5 kW), particularly in Cases 5 and 7. These characteristics achieved a 37.15% reduction in peak grid consumption relative to the base case and supplied 54.36% of the total energy demand through local generation and storage, indicating a high degree of self-sufficiency.
An even greater self-sufficiency (63.21%) was observed in cases combining a high PV capacity with a high ESS capacity (PV 3 kWp, ESS 13.5 kWh), particularly in Cases 1 and 3. However, these cases did not yield the lowest peak demand values, suggesting that ESS capacity alone does not necessarily minimize peak demand.
In contrast, cases that combine a high ESS with low PV capacity (PV 1.5 kWp, ESS 13.5 kWh) and high charger rates (5 kW), specifically Case 2, resulted in significant increases in peak grid consumption, reaching 130.49 kW—an increase of 113.21% over the base case. This case demonstrates a lower efficiency in utilizing DERs, with only 30.10% of demand met through local generation and storage due to the low PV generation. Recent studies have proposed the inclusion of contracted power costs in the optimization objectives of community energy trading. This approach has shown potential in reducing the peak demand by over 30% without compromising economic performance or requiring explicit modeling of grid constraints [21].
These findings highlight that DER integration does not guarantee reduced grid dependency or peak demand; rather, the effectiveness depends critically on achieving the right balance between PV generation and ESS capacity. Moreover, recent co-simulation studies indicate that moderate levels of P2P energy trading do not significantly affect network operational performance, supporting the feasibility of such market mechanisms in LV distribution systems [14]. A higher PV capacity contributes more significantly to reducing DSO reliance and enhancing self-sufficiency, especially when combined with an appropriately sized ESS that can store and discharge energy efficiently. Therefore, optimal system design must consider not only the presence of DERs but also their relative sizing and operational parameters to ensure an improved energy performance and reduced dependence on centralized infrastructure.

4.1.4. Analysis of Energy Trading Volume

The integration of DERs not only impacts peak grid consumption and energy generation but also significantly influences the volume of local energy exchange through P2P trading. Figure 7c illustrates the total energy trading volumes observed across different characteristics for the first three days of the simulation period.
As presented in Table 4, the base case—without any DERs—resulted in zero P2P trade (as expected), as all energy demand was supplied by the DSO. In contrast, cases with DER integration facilitated varying levels of local energy exchange, with trading volumes strongly correlated to both PV and ESS capacities.
The highest volume of P2P trade—6919.72 kWh—was observed in cases that combine a high PV capacity with high ESS capacity (PV 3 kWp, ESS 13.5 kWh), whether using a 5 kW or 2.5 kW charger rate, particularly in Cases 1 and 3. Conversely, cases with a lower PV capacity (1.5 kWp) or low ESS (7 kWh) demonstrated significantly reduced trading volumes. For instance, Cases 6 and 8 recorded a total of 2268.89 kWh in P2P trade. Cases with a high PV capacity but low ESS capacity (PV 3 kWp, ESS 7 kWh) exhibited intermediate trading volumes, reaching 3473.23 kWh, notably in Cases 5 and 7.
These findings indicate that high PV and ESS capacities serve as key enablers of local energy trading. Previous studies have shown that residential ESS within local electricity markets can significantly increase P2P transactions and unlock greater economic benefits for communities, especially under static time-of-use pricing that allows seasonal optimization through energy arbitrage and surplus PV utilization [20]. However, other factors, such as discharge capability, energy prices, and community load profiles, also influence the effectiveness of surplus energy distribution within the network. Therefore, maximizing local energy resilience and trading activity requires a balanced and well-sized integration of DERs. Cases with appropriate PV and ESS capacities not only reduce grid dependency and peak demand but also enable significant energy sharing among prosumers, contributing to the development of more autonomous and sustainable energy communities. These findings align with previous research indicating that P2P markets with integrated PV and ESS provide economic benefits while promoting more efficient energy pricing structures [16].

4.2. Analysis of Impacts on the LV Distribution Network

This section presents a comparative analysis of the studied cases to evaluate the impact of different DER characteristics on the operational performance of LV distribution networks. The analysis focuses on key network parameters, including phase voltage magnitudes, voltage unbalance factors (VUF), transformer loading, and line loading. The simulation results during the simulation period (i.e., one month) for phase voltages, maximum VUF, and transformer and line loading across the eight DER characteristics, along with their comparison to the base case without DER integration, are summarized in Table 5. Similar technical assessments of DER integration impacts on LV distribution networks have been addressed in previous studies [11,12,16], highlighting the importance of such evaluations in enhancing grid reliability and operational efficiency.

4.2.1. Analysis of Voltage Variations Impacts

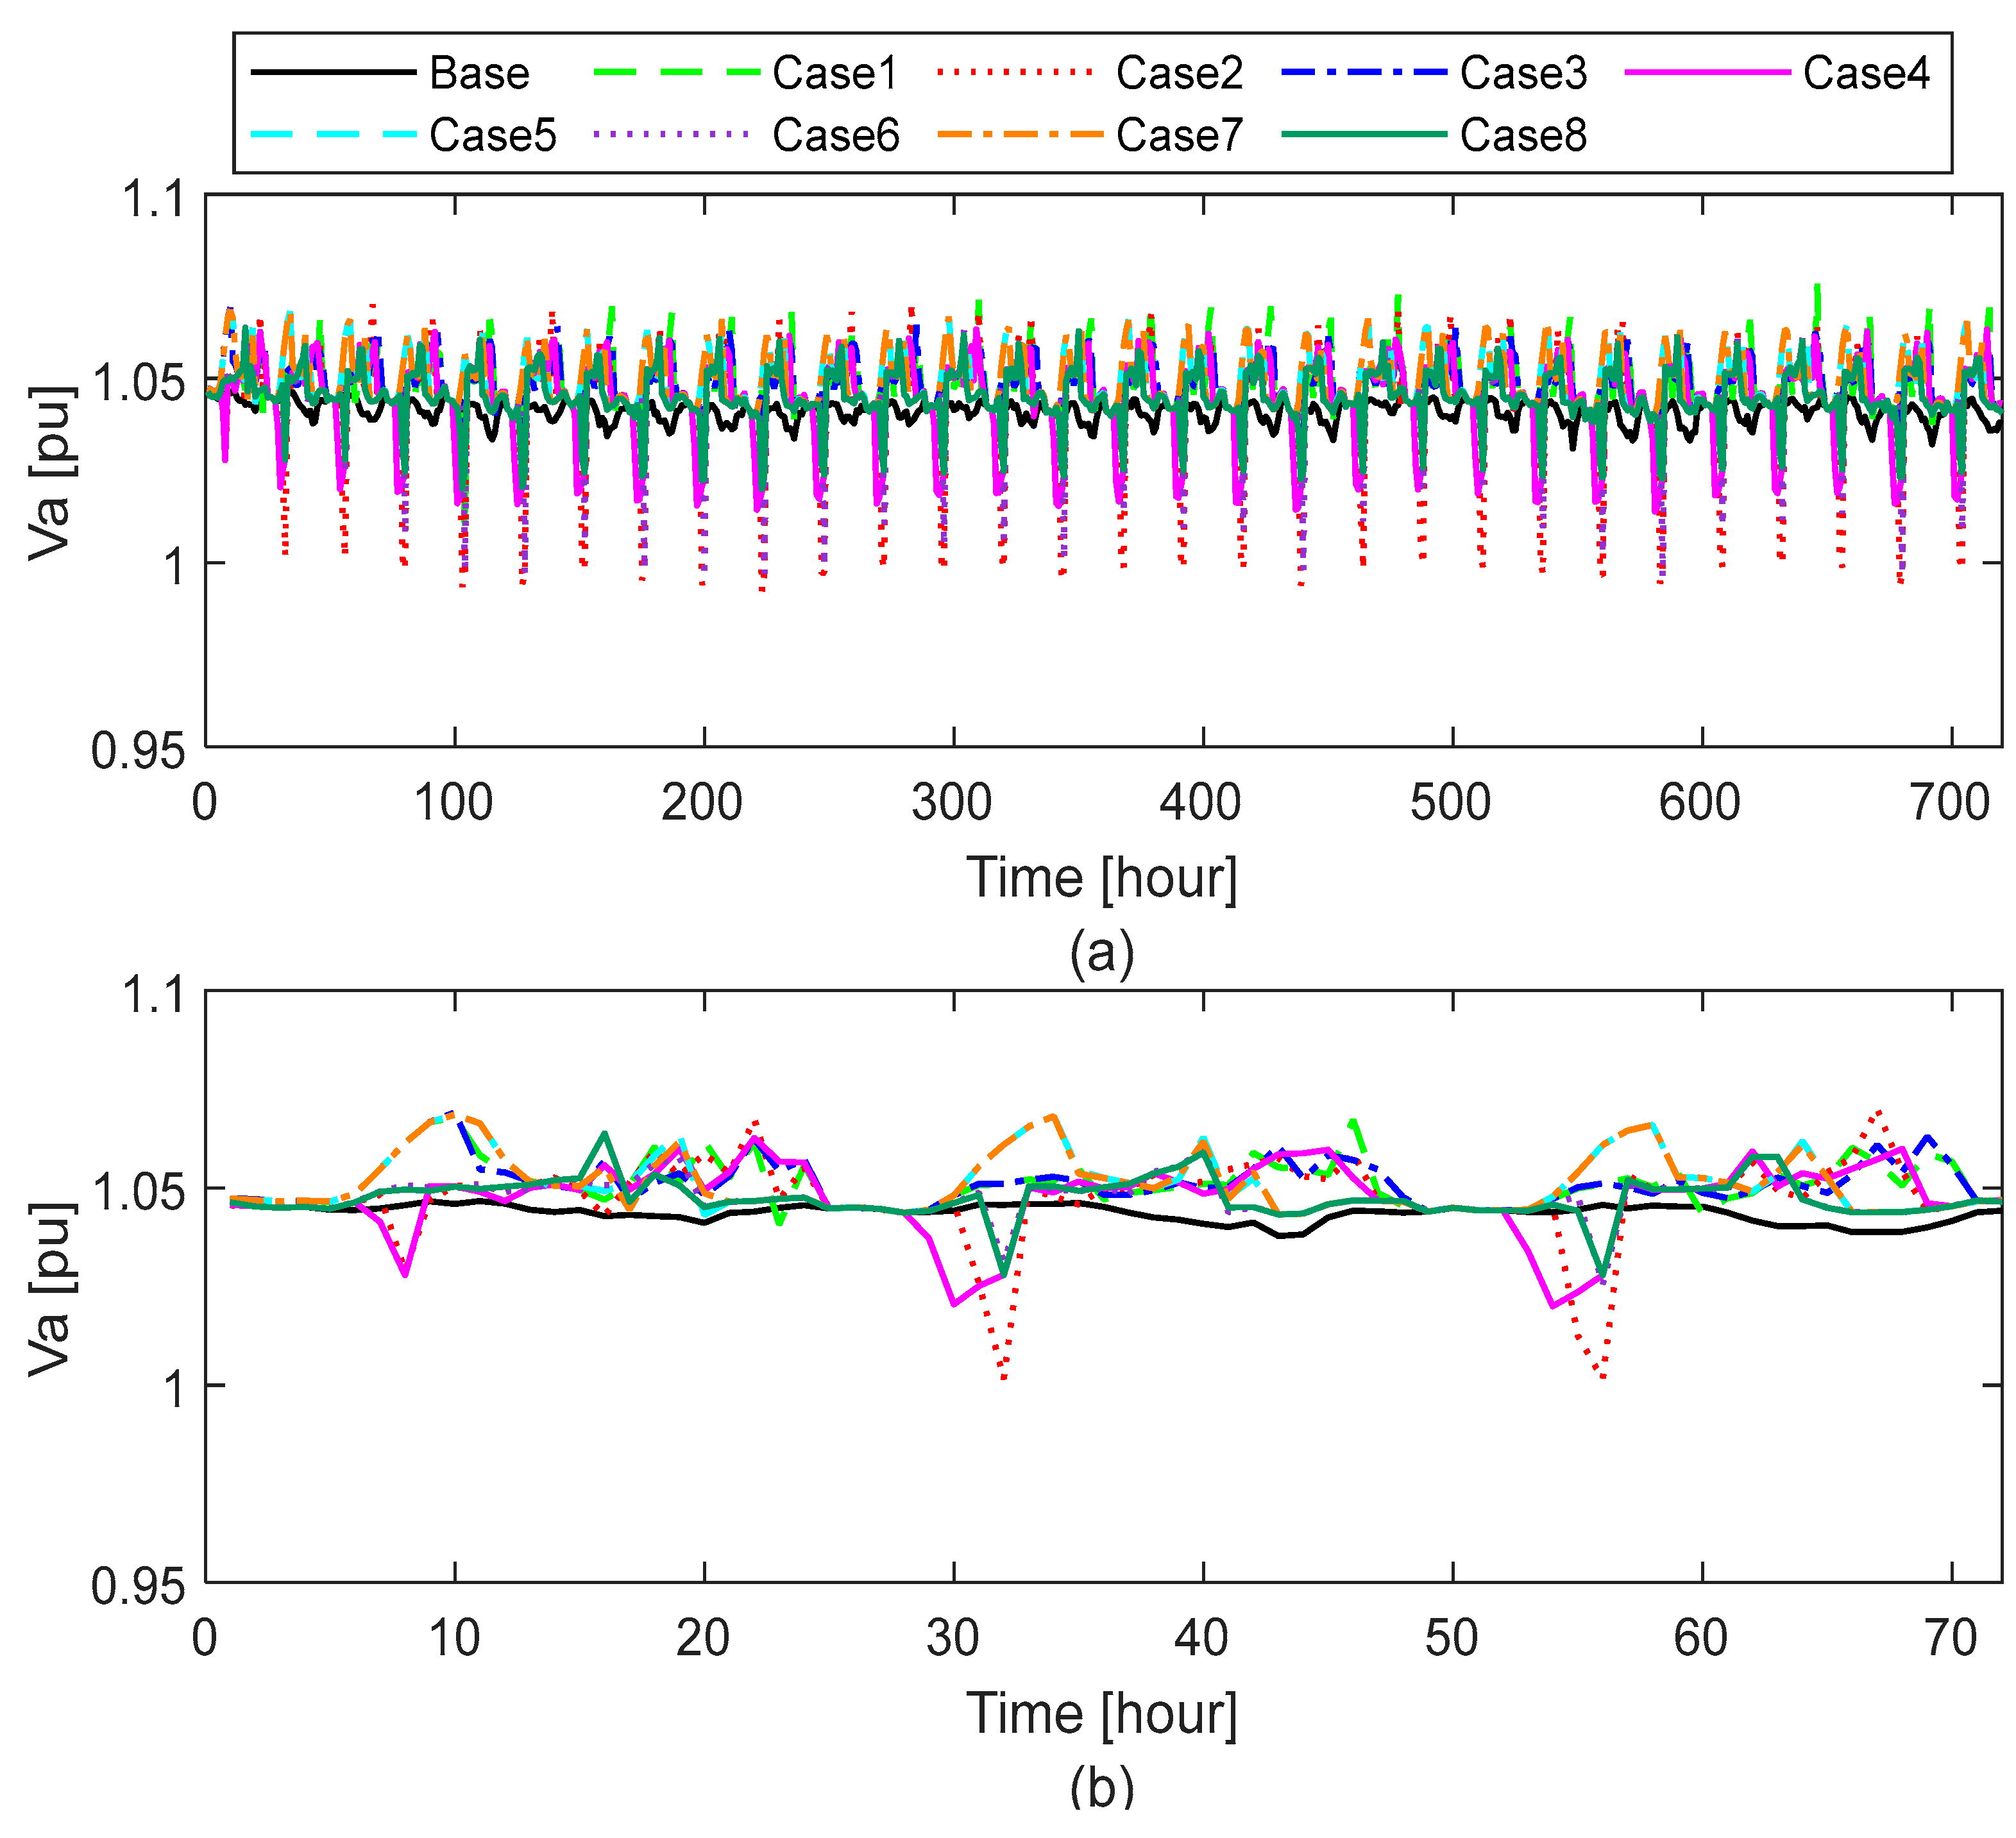
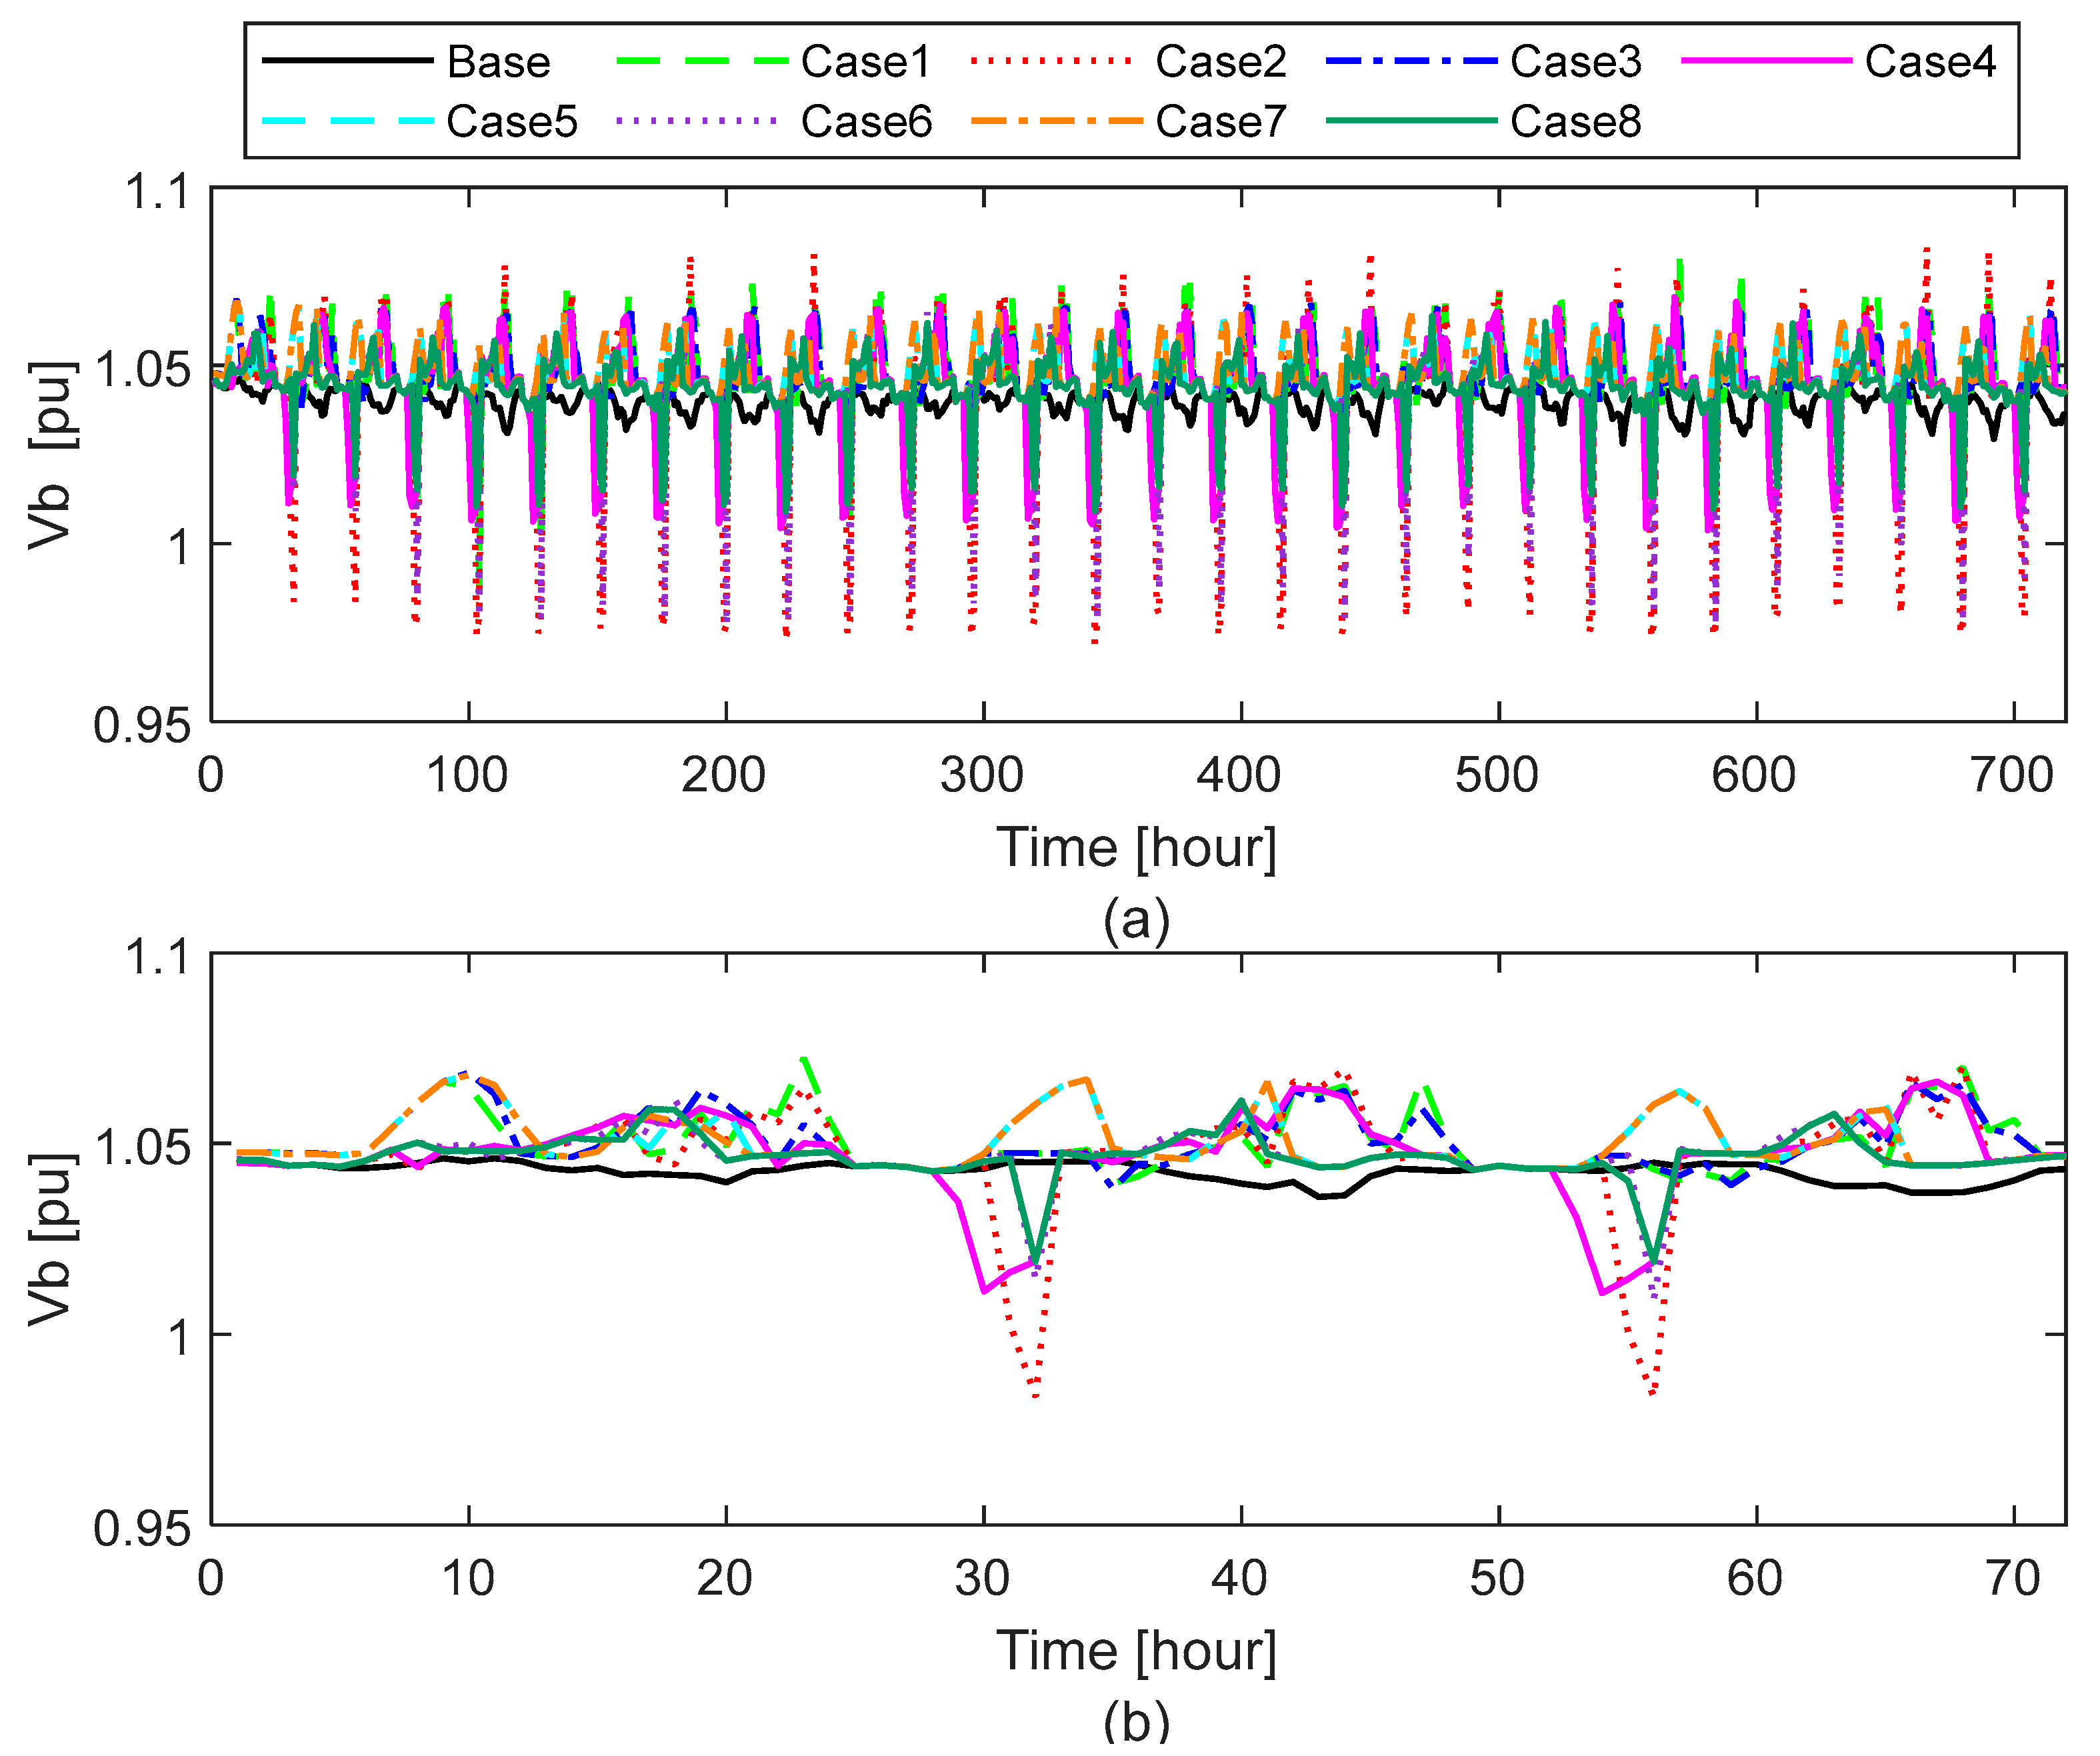
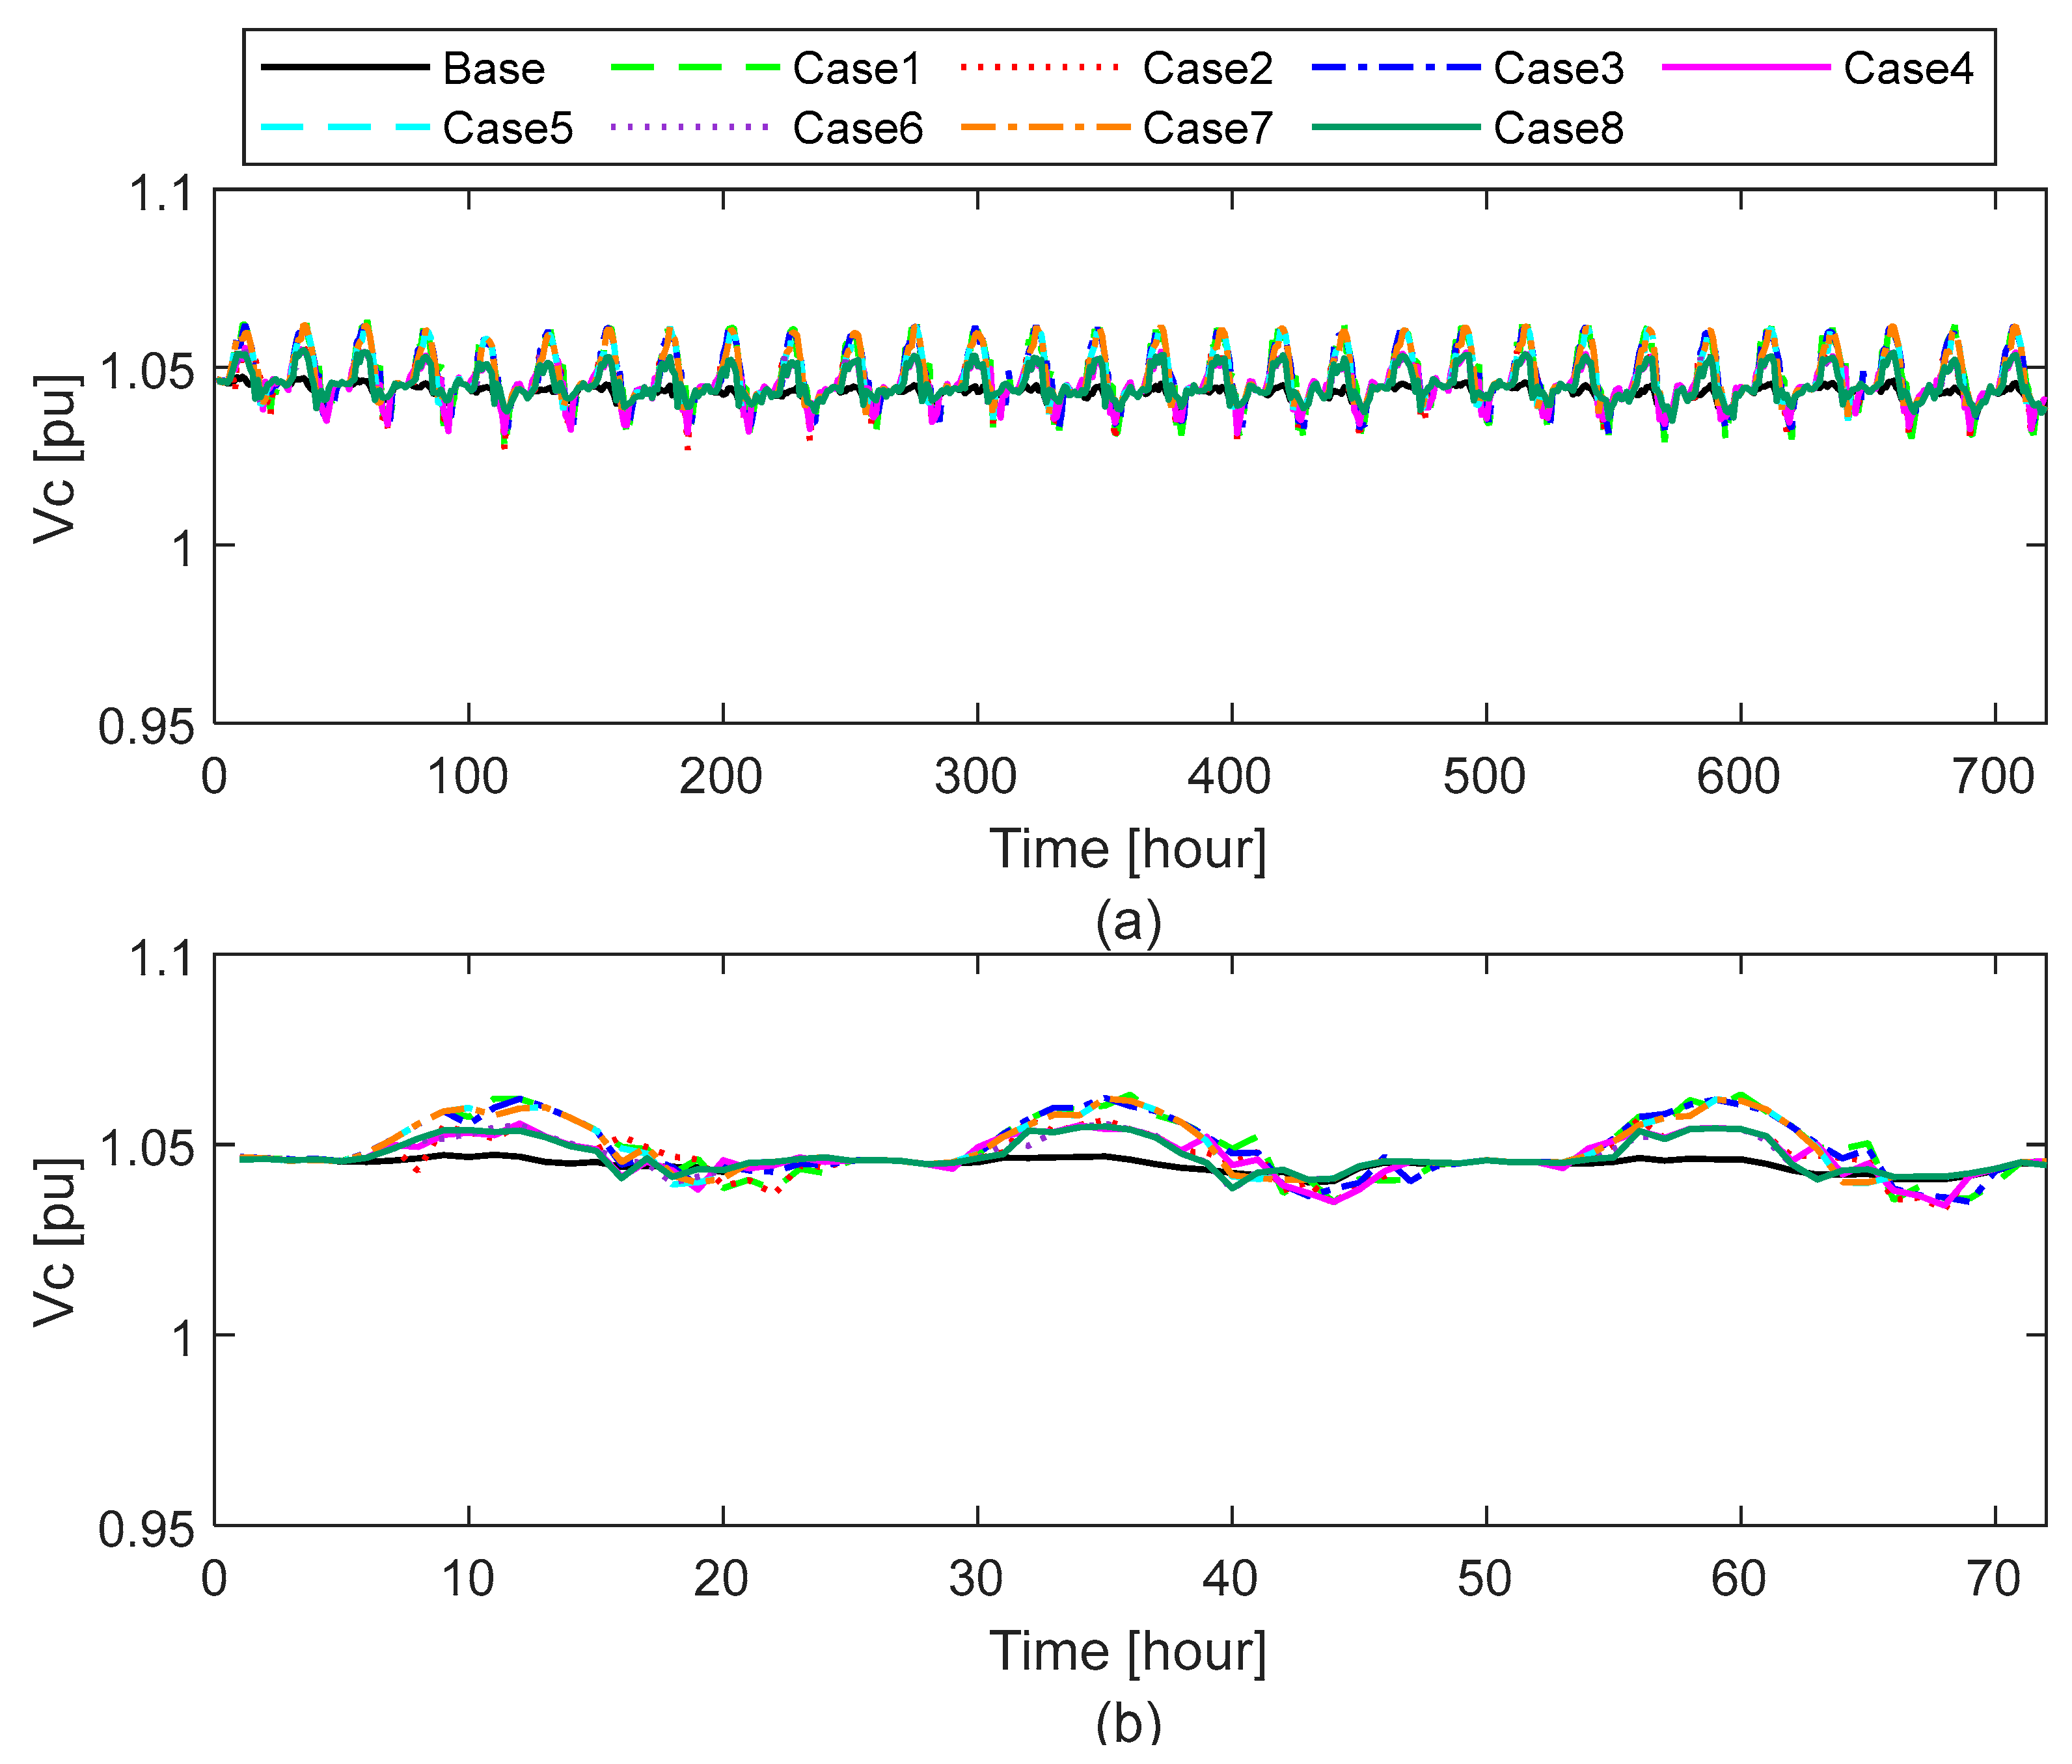
The LV distribution network under study is inherently unbalanced, as each phase supplies a distinct group of prosumers with unique load and generation profiles. Voltage measurements were collected simultaneously across all three phases, with a particular focus on Load 53—located at the end of the feeder line—where voltage fluctuations are typically most pronounced. Nodes at the feeder’s extremities are especially susceptible to voltage drops during periods of high local demand and to voltage rises when local generation exceeds consumption. According to the EN 50160 standard [45], voltage levels in LV networks should remain within the range of 0.90 to 1.10 per unit (pu). Figure 8, Figure 9 and Figure 10 illustrate the voltage profiles recorded over a one-month/three-day simulation period for better visibility.
As summarized in Table 5, DER characteristics significantly affect the magnitude and stability of voltage levels across all three phases (Va, Vb, and Vc). In the base case—without DER integration—voltage values remain within acceptable limits, with a relatively narrow range between 1.028 and 1.047 pu. However, the deployment of DERs—particularly cases combining a high PV capacity (3 kWp) with a high ESS capacity (13.5 kWh)—results in increased voltage fluctuations. For instance, Case 1 exhibits a voltage range from 0.988 pu to 1.080 pu, indicating significant deviation due to the dynamic charging and discharging behavior of storage units. This aligns with previous findings, showing that while smart homes equipped with PV and ESS under community-based electricity markets can achieve significant cost savings and increase local green energy consumption, their operation—especially in winter—may negatively impact voltage stability and increase active power losses [18,19]. The greatest voltage deviation is observed in Case 2, where the Phase b voltage drops to 0.972 pu and peaks at 1.083 pu, the largest voltage spread recorded (the widest difference between the minimum and maximum voltage values), suggesting that a high ESS capacity with insufficient PV generation can lead to inefficient energy usage and phase voltage deviation.
Conversely, cases with low ESS (7 kWh) and high PV capacities (Cases 5 and 7) demonstrate more stable voltage profiles, with voltages remaining between 1.035 pu and 1.069 pu and reduced overall variation. Notably, across all cases, Phase b consistently registers the lowest voltage levels, and Phase c registers the smallest deviations in voltage.
These findings demonstrate that while DER integration facilitates localized energy exchange and supports P2P trading, it also introduces voltage quality challenges. Nonetheless, previous simulation studies have reported that moderate P2P trading levels may not cause significant voltage or operational issues in LV networks [14]. Other research has found that decentralized ESS integration under P2P trading schemes can increase voltage fluctuations, even if voltage levels remain within acceptable limits [16]. Therefore, the careful consideration of PV and ESS sizing, charger power, and balanced DER deployment is essential to maintain voltage stability and ensure reliable LV network performance under P2P trading conditions. In all the studied cases, none exceeded the acceptable limits.

4.2.2. Analysis of Voltage Phase Unbalance Impacts

Under ideal operating conditions, a balanced three-phase load results in no current flow through the neutral conductor, thereby minimizing power losses and ensuring efficient system performance. However, perfect load balancing is rarely achieved in practical LV distribution networks due to inherent variations in the loads connected to each phase. In traditional residential areas where customer consumption patterns are relatively uniform, phase unbalance is typically maintained within acceptable limits by distributing single-phase loads evenly across the three phases.
This balance is expected to be significantly disrupted with the increasing integration of single-phase DERs. Moreover, P2P energy trading introduces variability in both consumption and generation patterns among prosumers compared to when they optimize their DERs individually in home energy management systems. This agrees with previous studies indicating that ESS operation under retail pricing schemes can significantly influence voltage unbalance, especially under ToU tariffs [20]
The impact of P2P trading on voltage stability in LV distribution networks can be assessed using the voltage unbalance factor (VUF), which evaluates the deviation in voltage magnitudes among the three phases. According to the symmetrical component method, the International Electrotechnical Commission (IEC) defines the VUF as the ratio of the negative-sequence voltage (V2) to the positive-sequence voltage (V1), expressed as a percentage (12):
V U F = ( V 2 / V 1 ) 100   ( % )
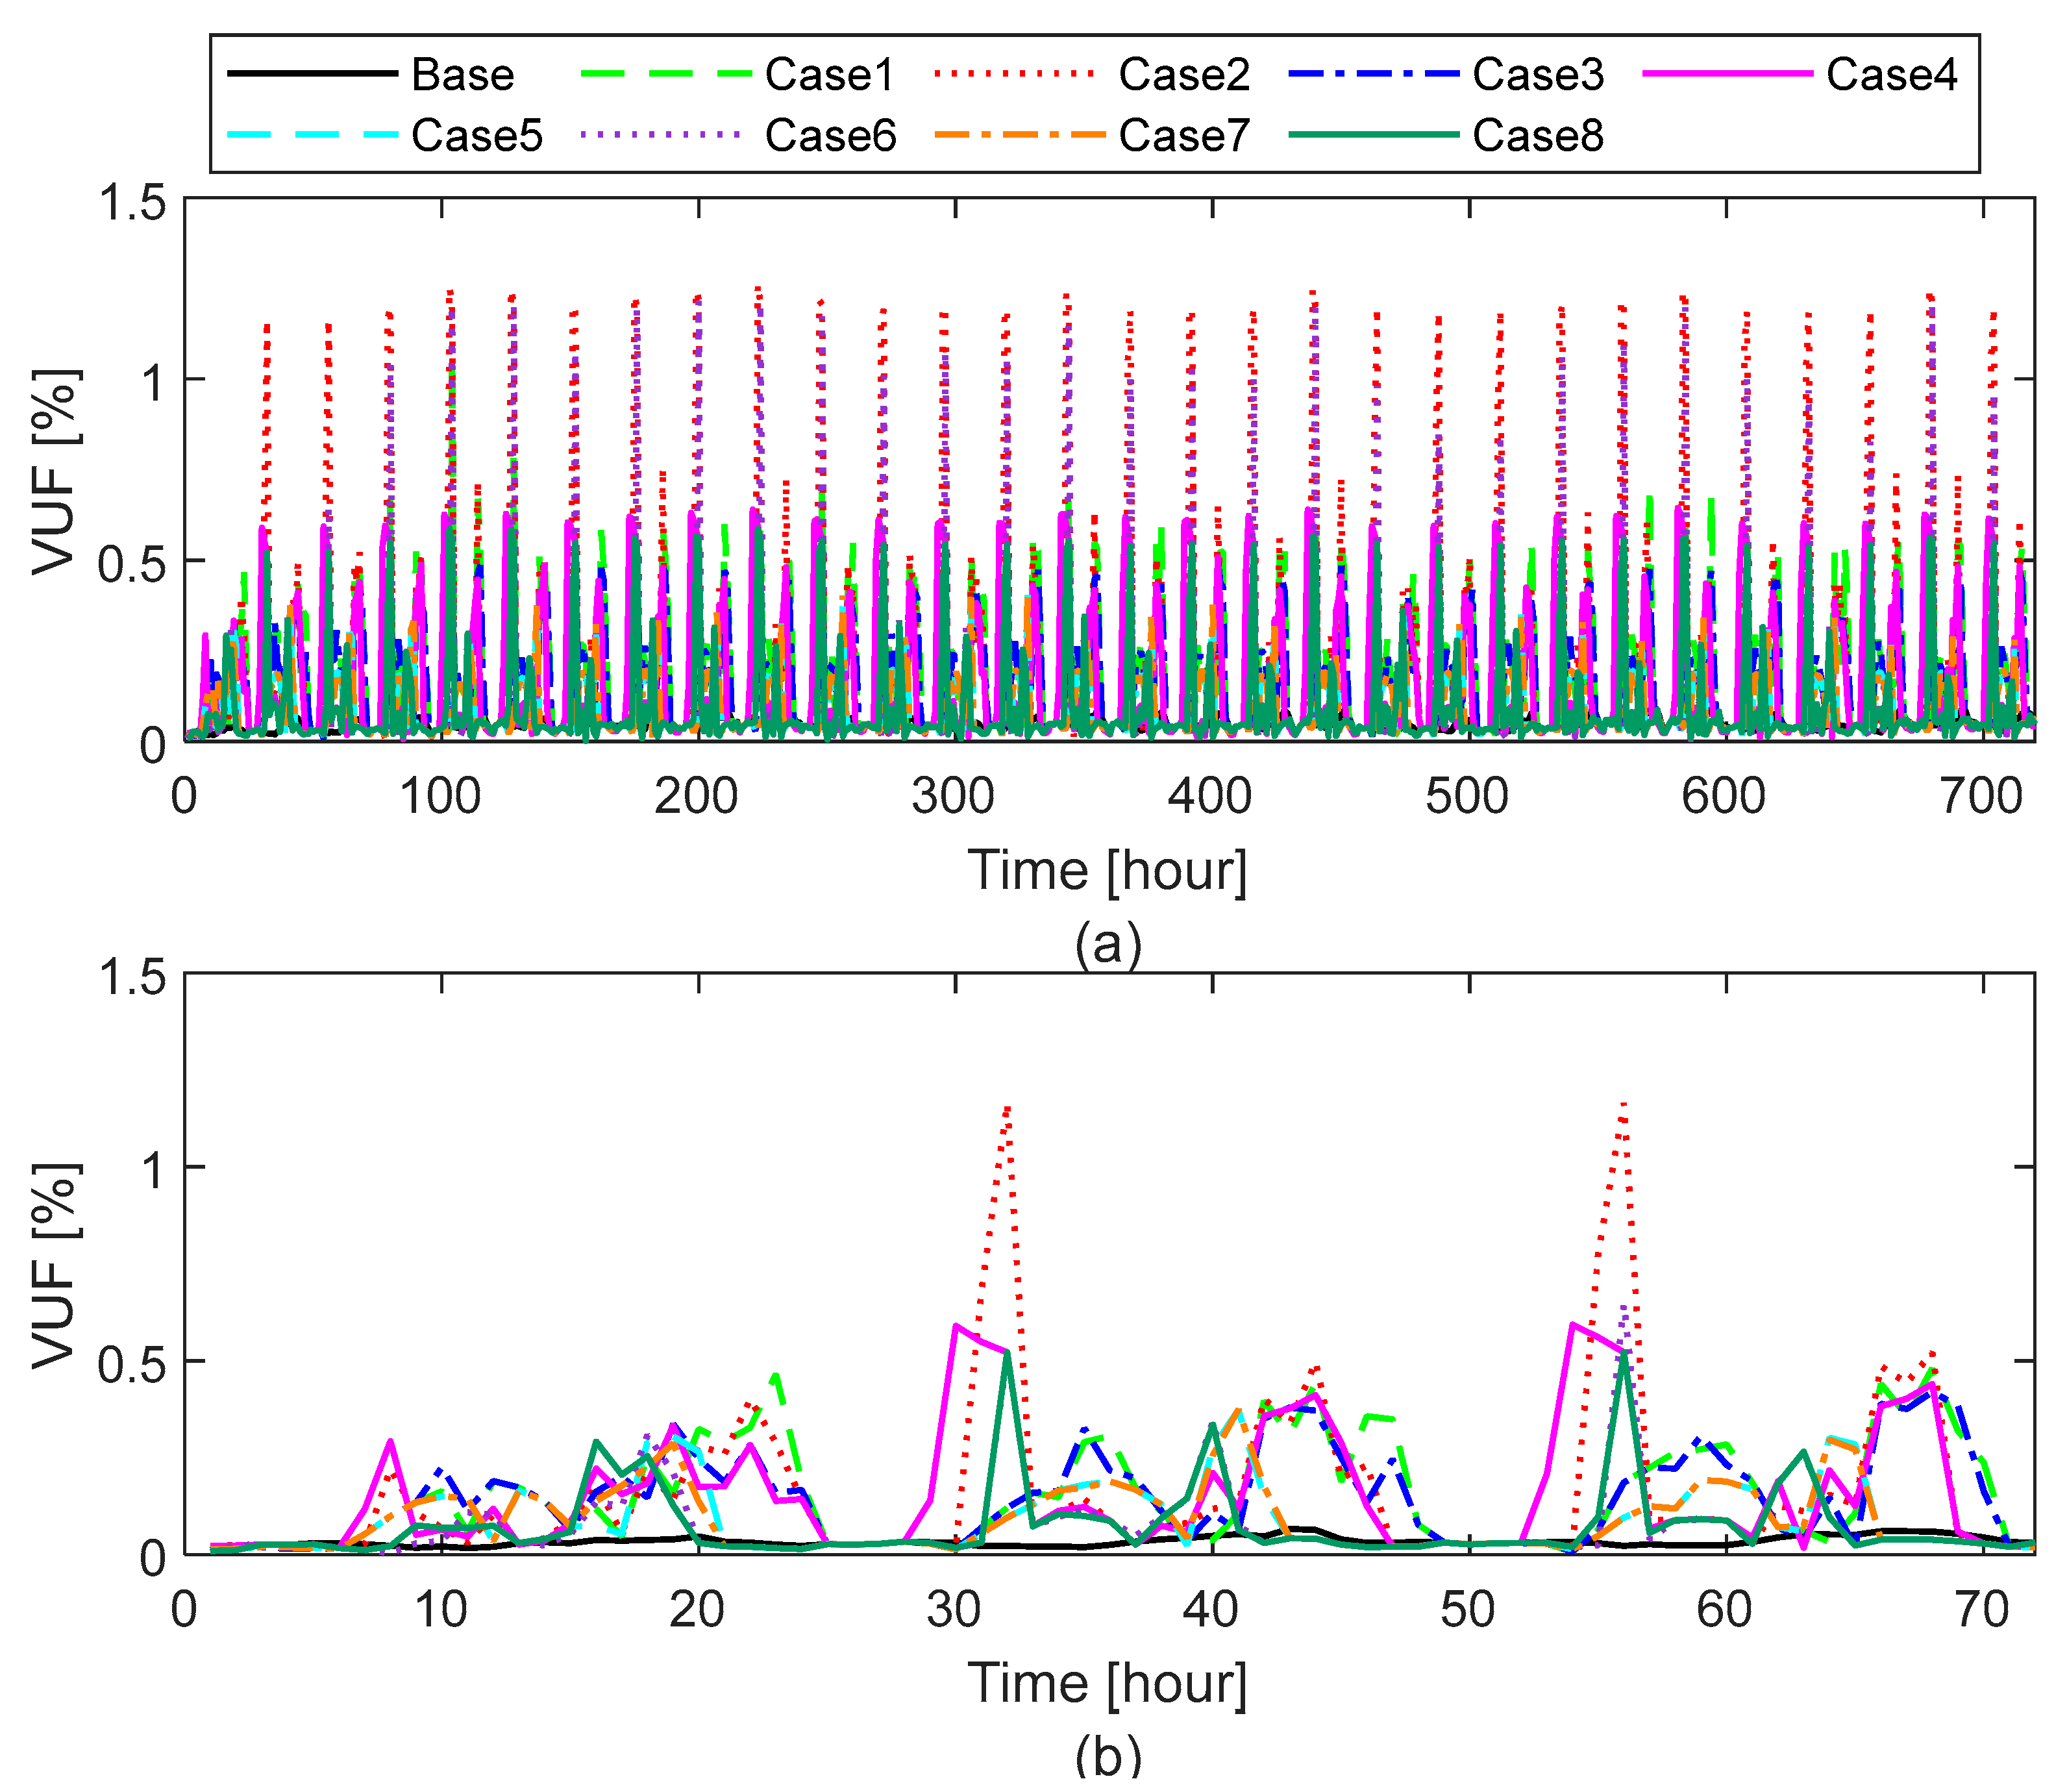
This metric represents the “true” measure of voltage unbalance. According to IEC standards, the maximum permissible VUF in LV distribution networks is 2%. Figure 11 illustrates the VUF values recorded over a one-month/three-day simulation period.
As summarized in Table 5, the maximum VUF across different DER characteristics under P2P energy trading conditions exhibits notable variations that reflect the impact of DER sizing on voltage balance in the LV distribution network. In the base case, where no DERs are integrated, the VUF remains as low as 0.105%, indicating a well-balanced network under conventional operation. However, the integration of DERs and active P2P trading introduces increased voltage unbalance, with the highest values observed in Cases 2 and 6, where VUF reaches approximately 1.261% and 1.216%, respectively.
In Case 2, the case with a high ESS capacity (13.5 kWh) and charging power (5 kW) combined with a low PV capacity (1.5 kWp) tends to exhibit higher VUF values. This is primarily because large ESS units in the community often charge simultaneously during low electricity price periods, leading to uneven phase loading, as they typically operate on a single phase. Such charging behavior causes unbalanced power flows in phases, which increases voltage unbalance in the LV network. On the other hand, Case 6 is characterized by a low ESS (7 kWh) and high charging power (5 kW), combined with a low PV capacity (1.5 kWp). While the storage capacity is lower than in Case 2, the limited PV output still restricts local generation. Moreover, the simultaneous charging of ESS at the high charging power results in high VUF values. In contrast, Cases 5 and 7, both incorporating balanced combinations of a high PV (3 kWp) with low ESS (7 kWh), demonstrate the lowest VUF values among DER-integrated cases at just 0.408%.
Overall, while all characteristics remain within the IEC’s acceptable limit of 2%, the results clearly show that the improper sizing or distribution of DER components—particularly when combined with P2P energy trading—can lead to increased voltage unbalance. Similar findings have been reported in previous community energy trading studies, where voltage magnitude and voltage unbalance occasionally exceeded acceptable limits [12].

4.2.3. Analysis of Transformer and Line Loading Impacts

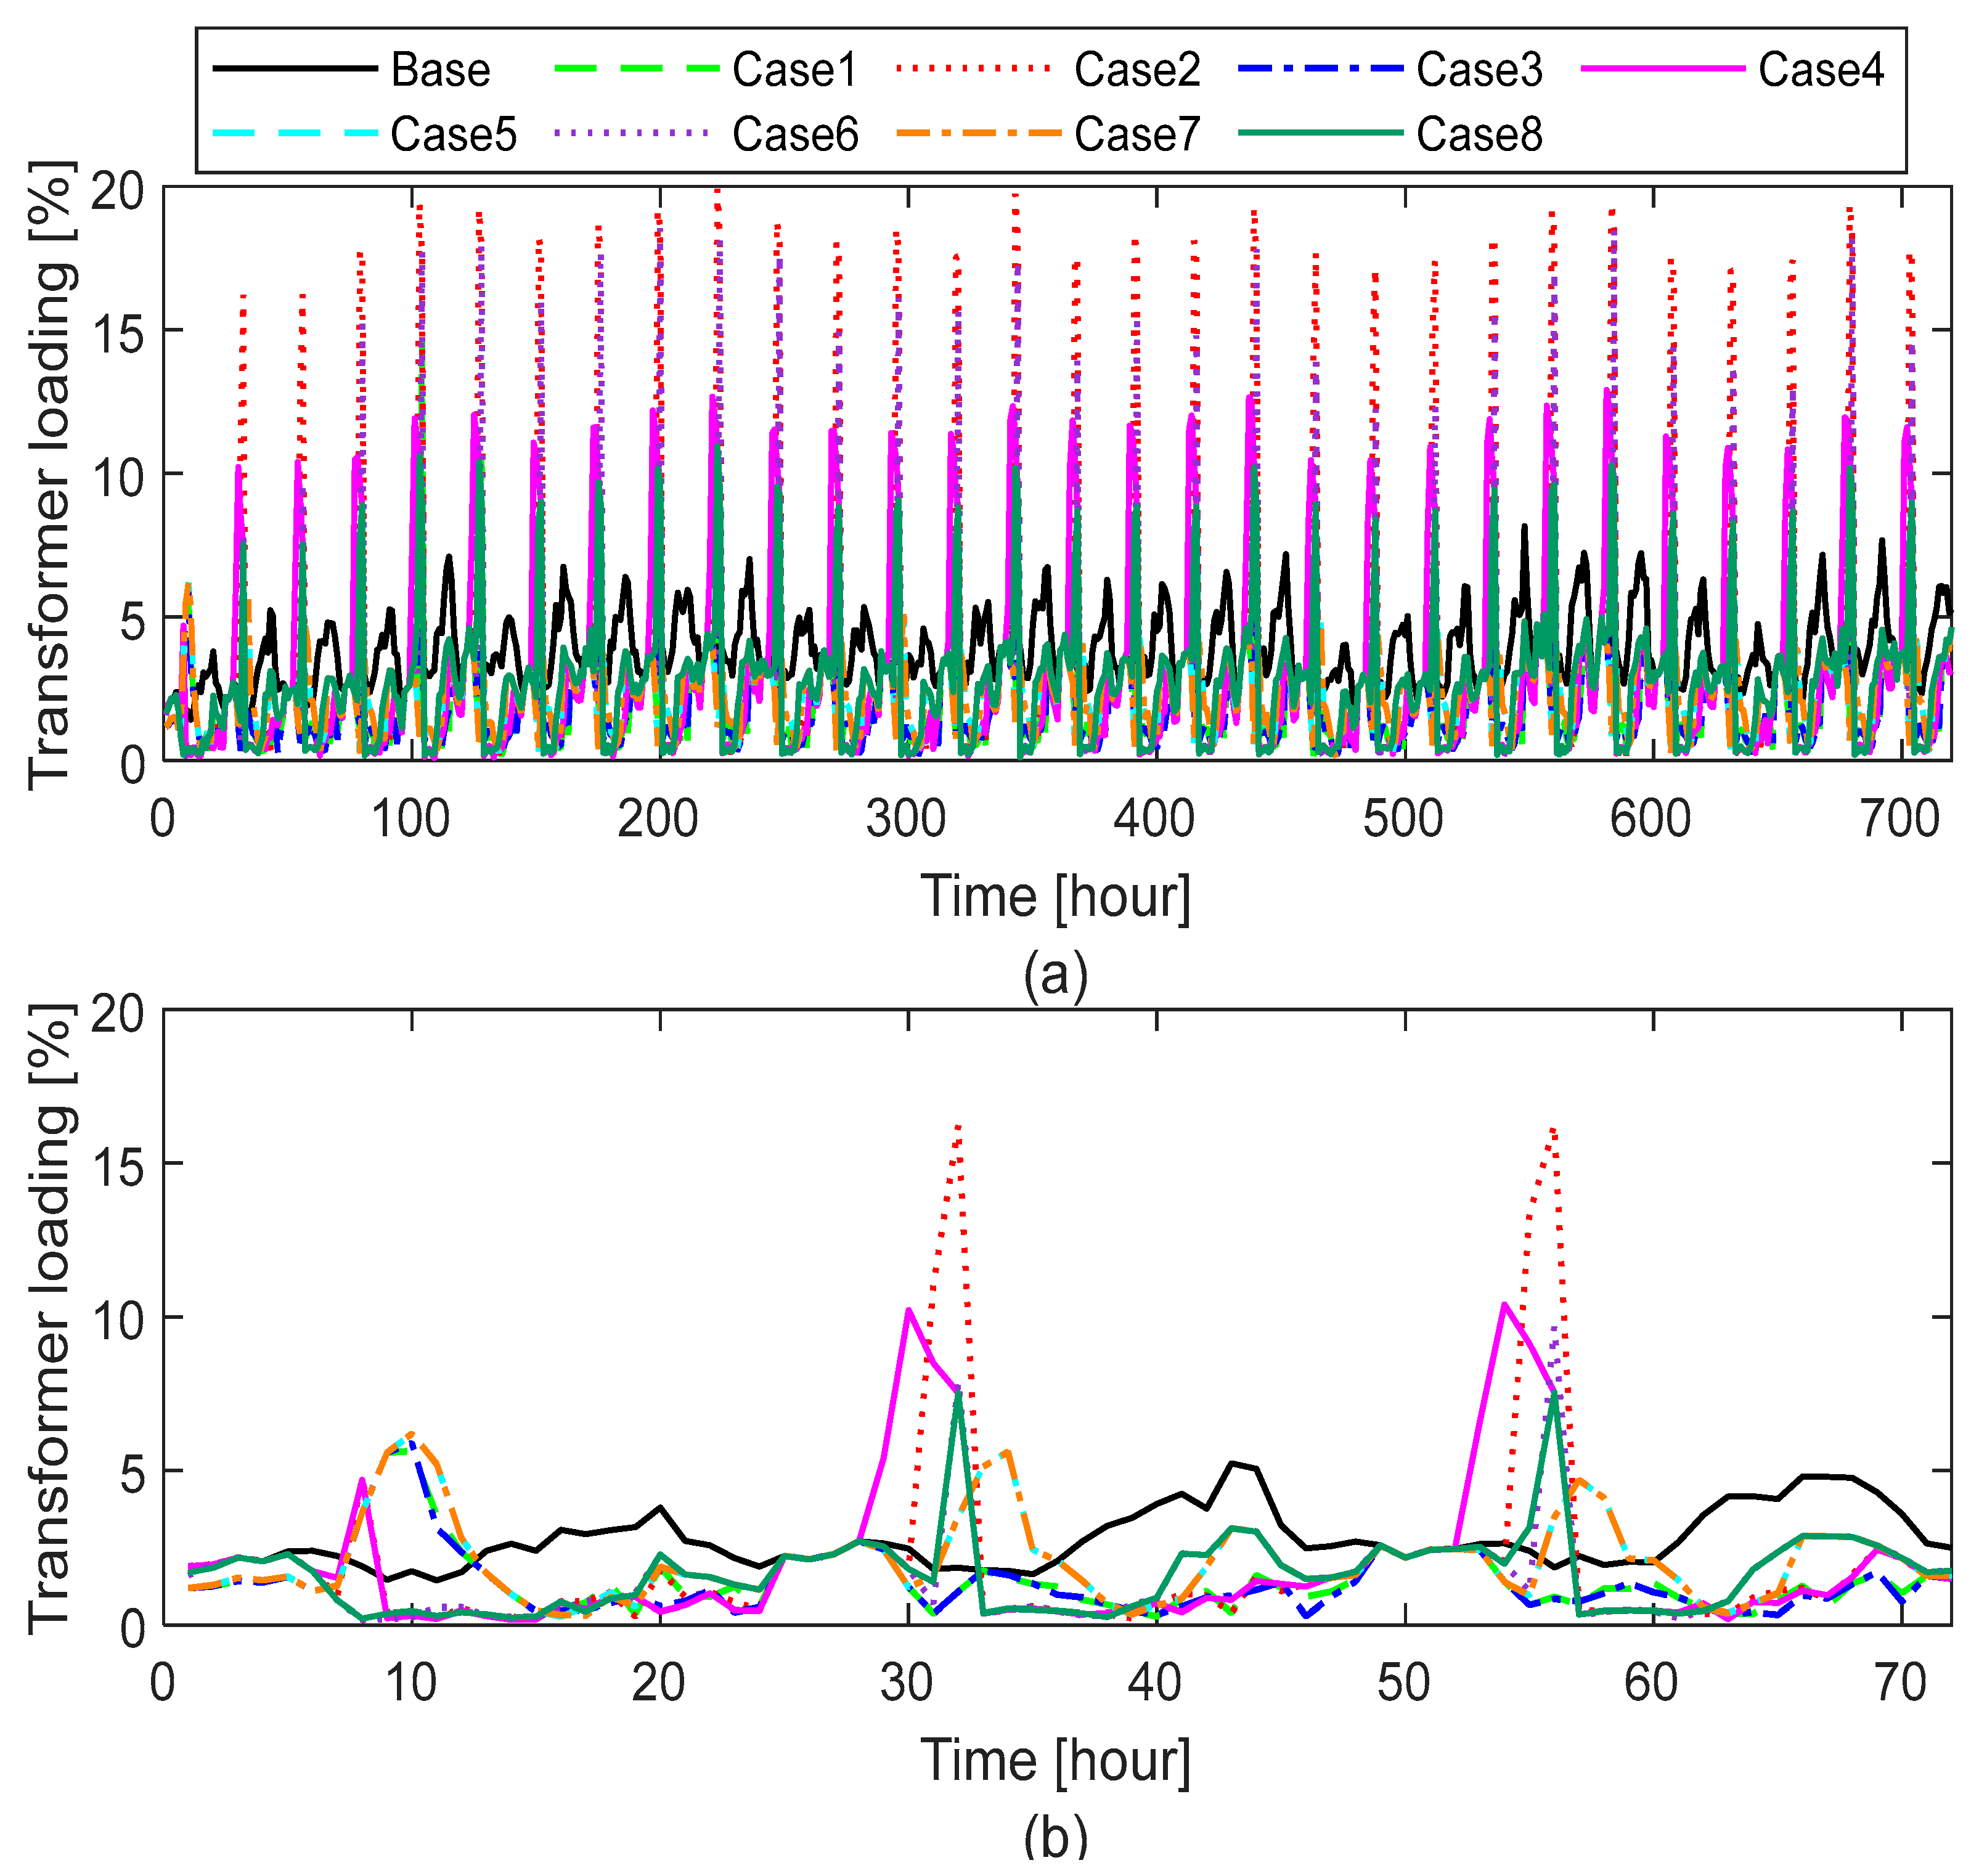
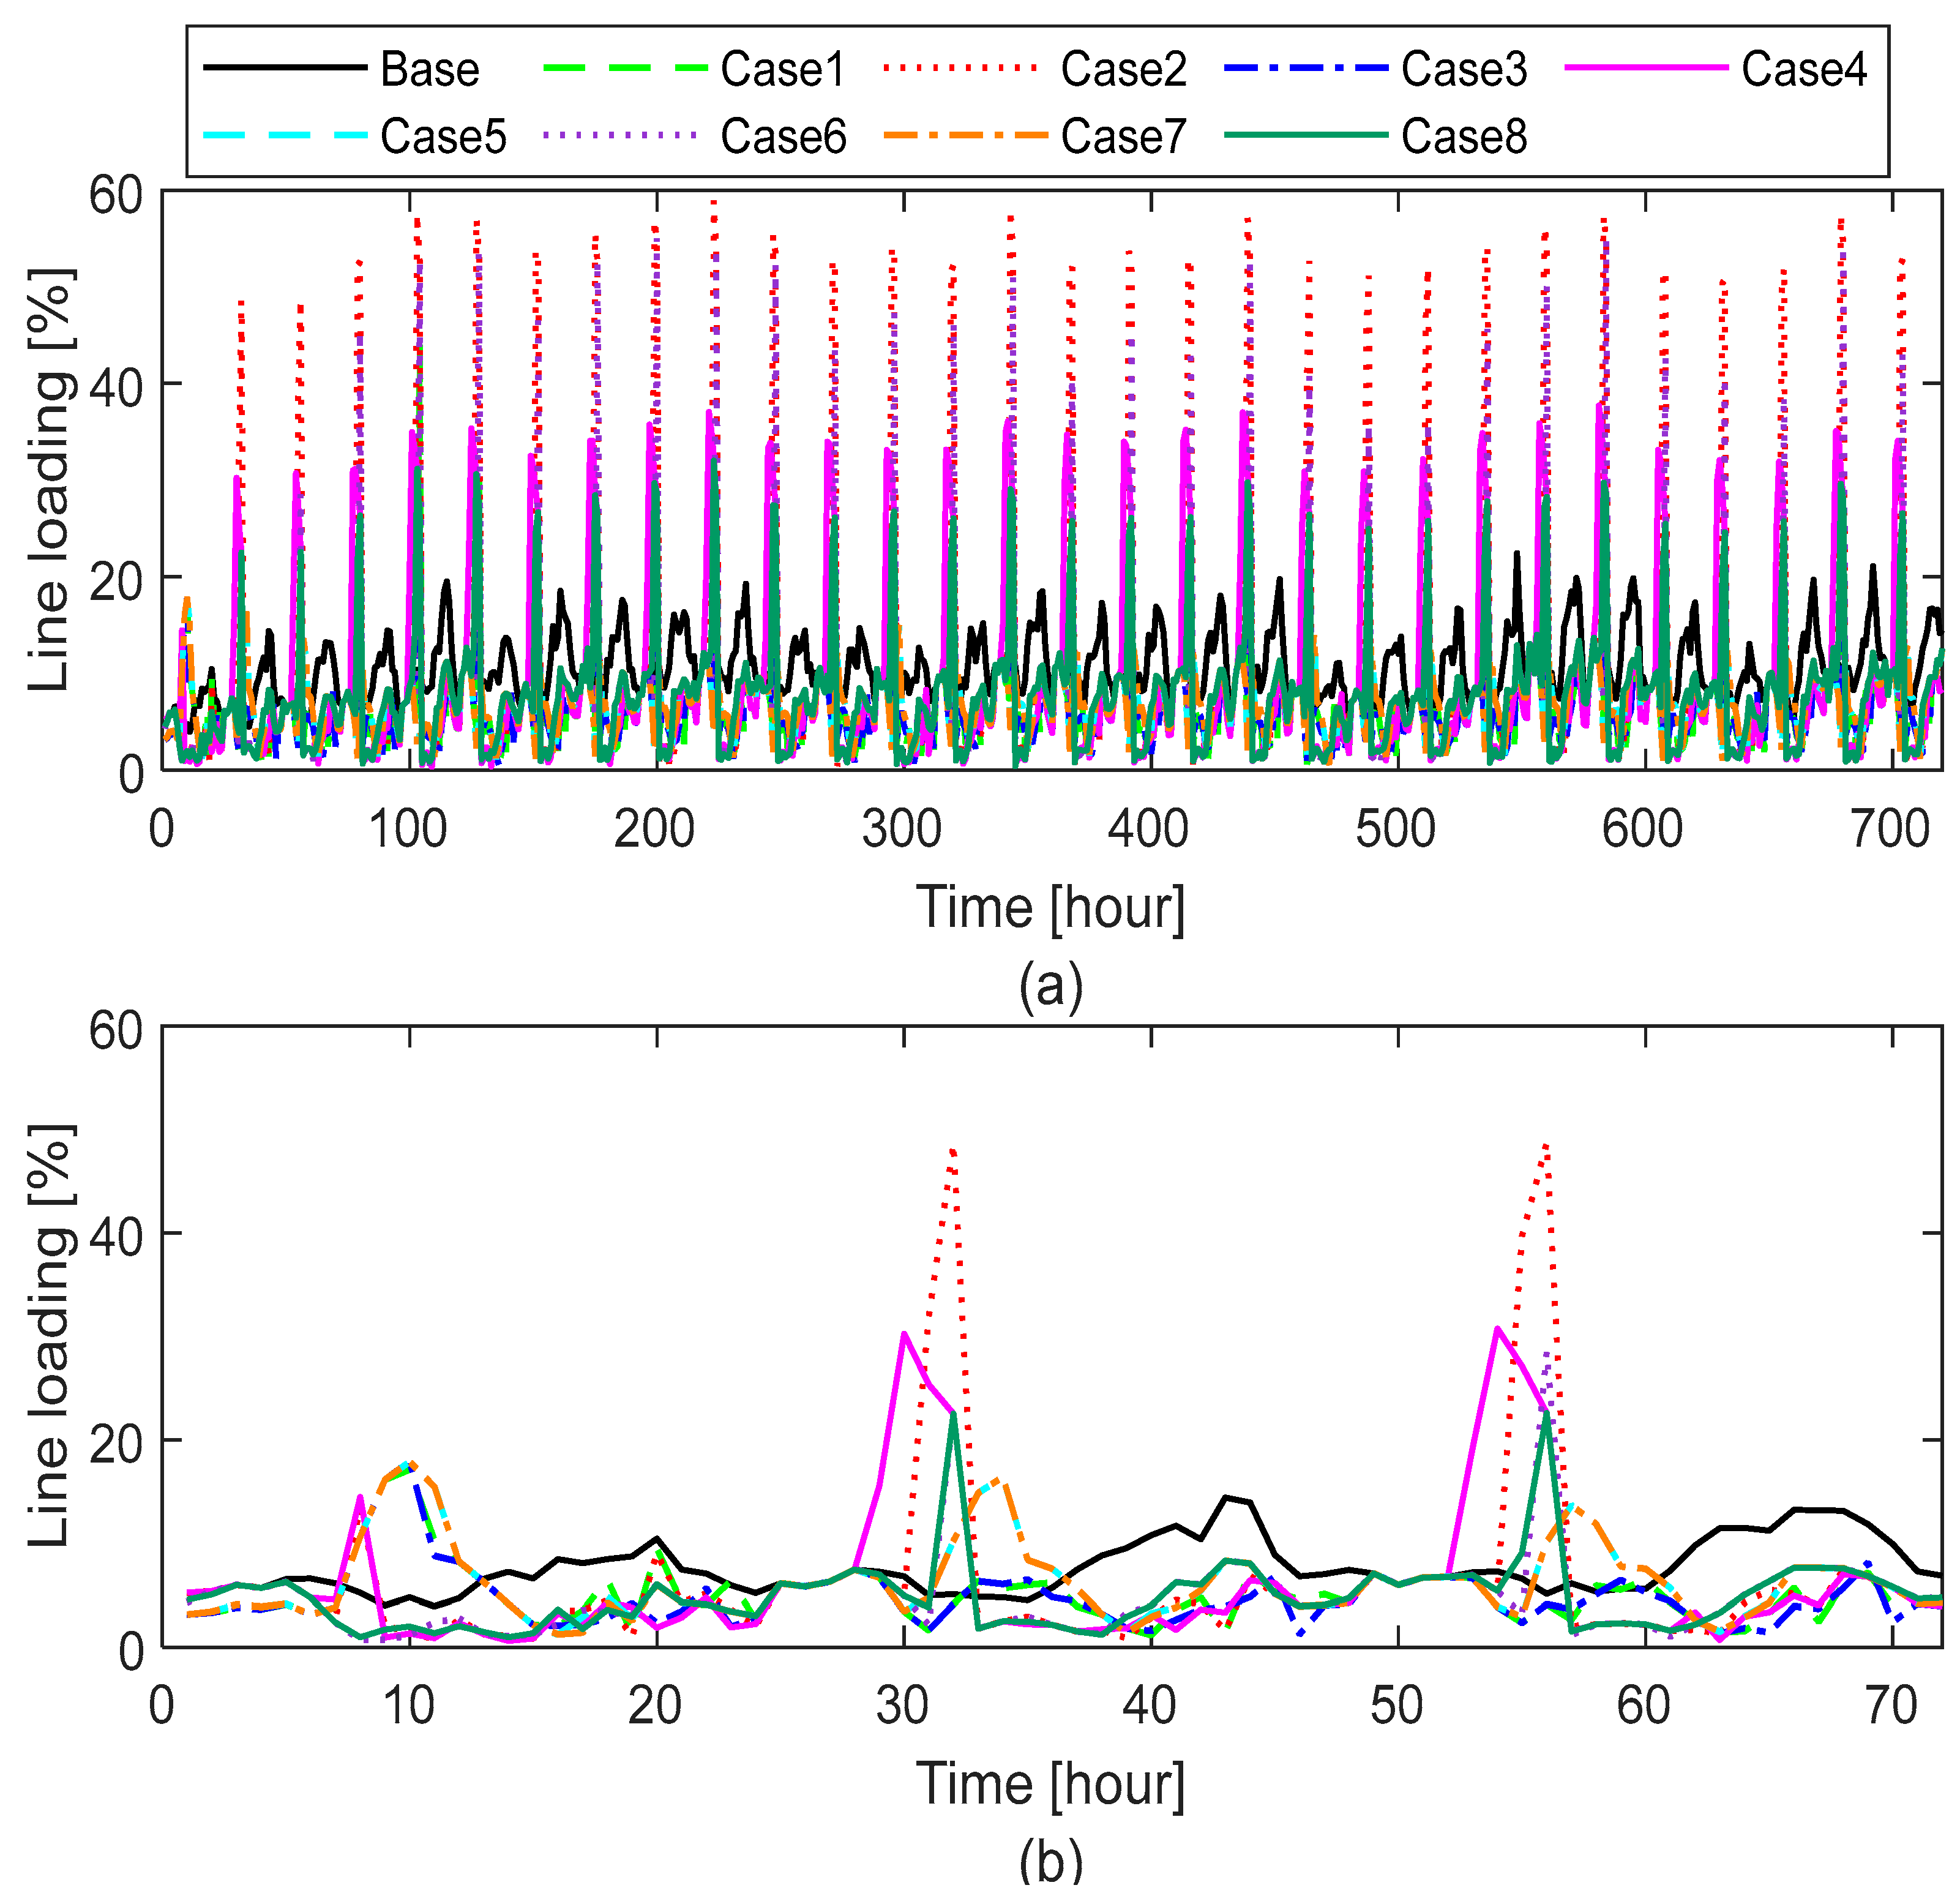
The integration of DERs under P2P energy trading frameworks can significantly influence both transformer and line loading in LV distribution networks. As prosumers exchange energy locally, the direction and magnitude of power flows shift dynamically, resulting in variable loading conditions. Figure 12 and Figure 13 illustrate transformer and line loadings recorded over a one-month/three-day simulation period.
As summarized in Table 5, significant variations in network loading are observed across different DER characteristics under P2P energy trading. In the base case without DERs, the maximum transformer and line loadings are 8.16% and 22.45%, respectively. However, with the integration of DERs, these values can increase substantially. For instance, Case 2, characterized by a low PV capacity (1.5 kWp) with a high ESS capacity (13.5 kWh) and high charging rate, results in maximum transformer loading (19.90%) and line loading (58.91%) among all cases. This indicates that a low generation capacity combined with high storage and charger power leads to significant energy exchanges across the network. As a result, the peak of grid consumption increases by 113.21% compared to the base case. Such flows may be intensified by the simultaneous charging and discharging of ESS within the community during periods of low electricity prices, which can overload network components. These findings are consistent with previous studies, which found that P2P trading combined with ESS—especially under static ToU pricing—can increase internal network losses and voltage issues, even though it offers economic benefits to prosumers. However, other studies suggest that when flexibility in power dispatch is enabled, P2P trading can alter network losses at a specific time, while overall daily energy losses remain minimal in large-scale distribution systems [15,16,20]. To mitigate such impacts, recent studies have proposed including contracted power costs in energy trading optimization models. This approach helps prevent the synchronization of high-power flexible devices (e.g., ESS, EVs), thereby reducing peak demand and preventing violations in line loading, voltage unbalance, and voltage magnitude in LV distribution networks without requiring direct DSO interaction [21].
In contrast, cases with a higher PV capacity (3 kWp) and low ESS capacity (7 kWh), particularly Cases 5 and 7, lead to a significantly lower transformer (6.20%) and line loadings (17.88%). In these cases, surplus PV generation is stored in ESS and later used at night or traded with other prosumers within the community, reducing the reliance on energy from the DSO. As a result, the peak of grid consumption decreases by 37.15% compared to the base case. This indicates that increased PV generation, along with low storage usage, can effectively reduce peak power flows, thereby lowering the load on both transformers and distribution lines. This aligns with previous findings that, while community energy trading can increase community peak demand and cause limit violations on some lines, it generally maintains transformer loading within safe limits [12]. Similarly, P2P trading under proper design can reduce energy costs and improve self-consumption without violating network limits. However, studies show that ToU tariffs combined with flexible DERs may impact the network more than home energy management systems [11].
Although Case 2 highlights potential issues with increased transformer and line loadings, these impacts can be mitigated through coordinated ESS control strategies. Co-simulation studies confirm that under moderate P2P trading levels, the operational performance of LV networks is not significantly affected [14]. For instance, implementing scheduled ESS charging times across prosumers or integrating demand response programs can significantly reduce peak power flows. Additionally, deploying local optimization algorithms that account for network constraints (e.g., line capacity or transformer ratings) can enhance the operational reliability of the LV network under P2P energy trading frameworks. Moreover, the efficient design of power-based control tariffs could decrease the peak demand and the associated impacts on the distribution network. These strategies present promising directions for future work and practical deployment.

4.2.4. Comparative Analysis of Different Cases Using Boxplot Representations

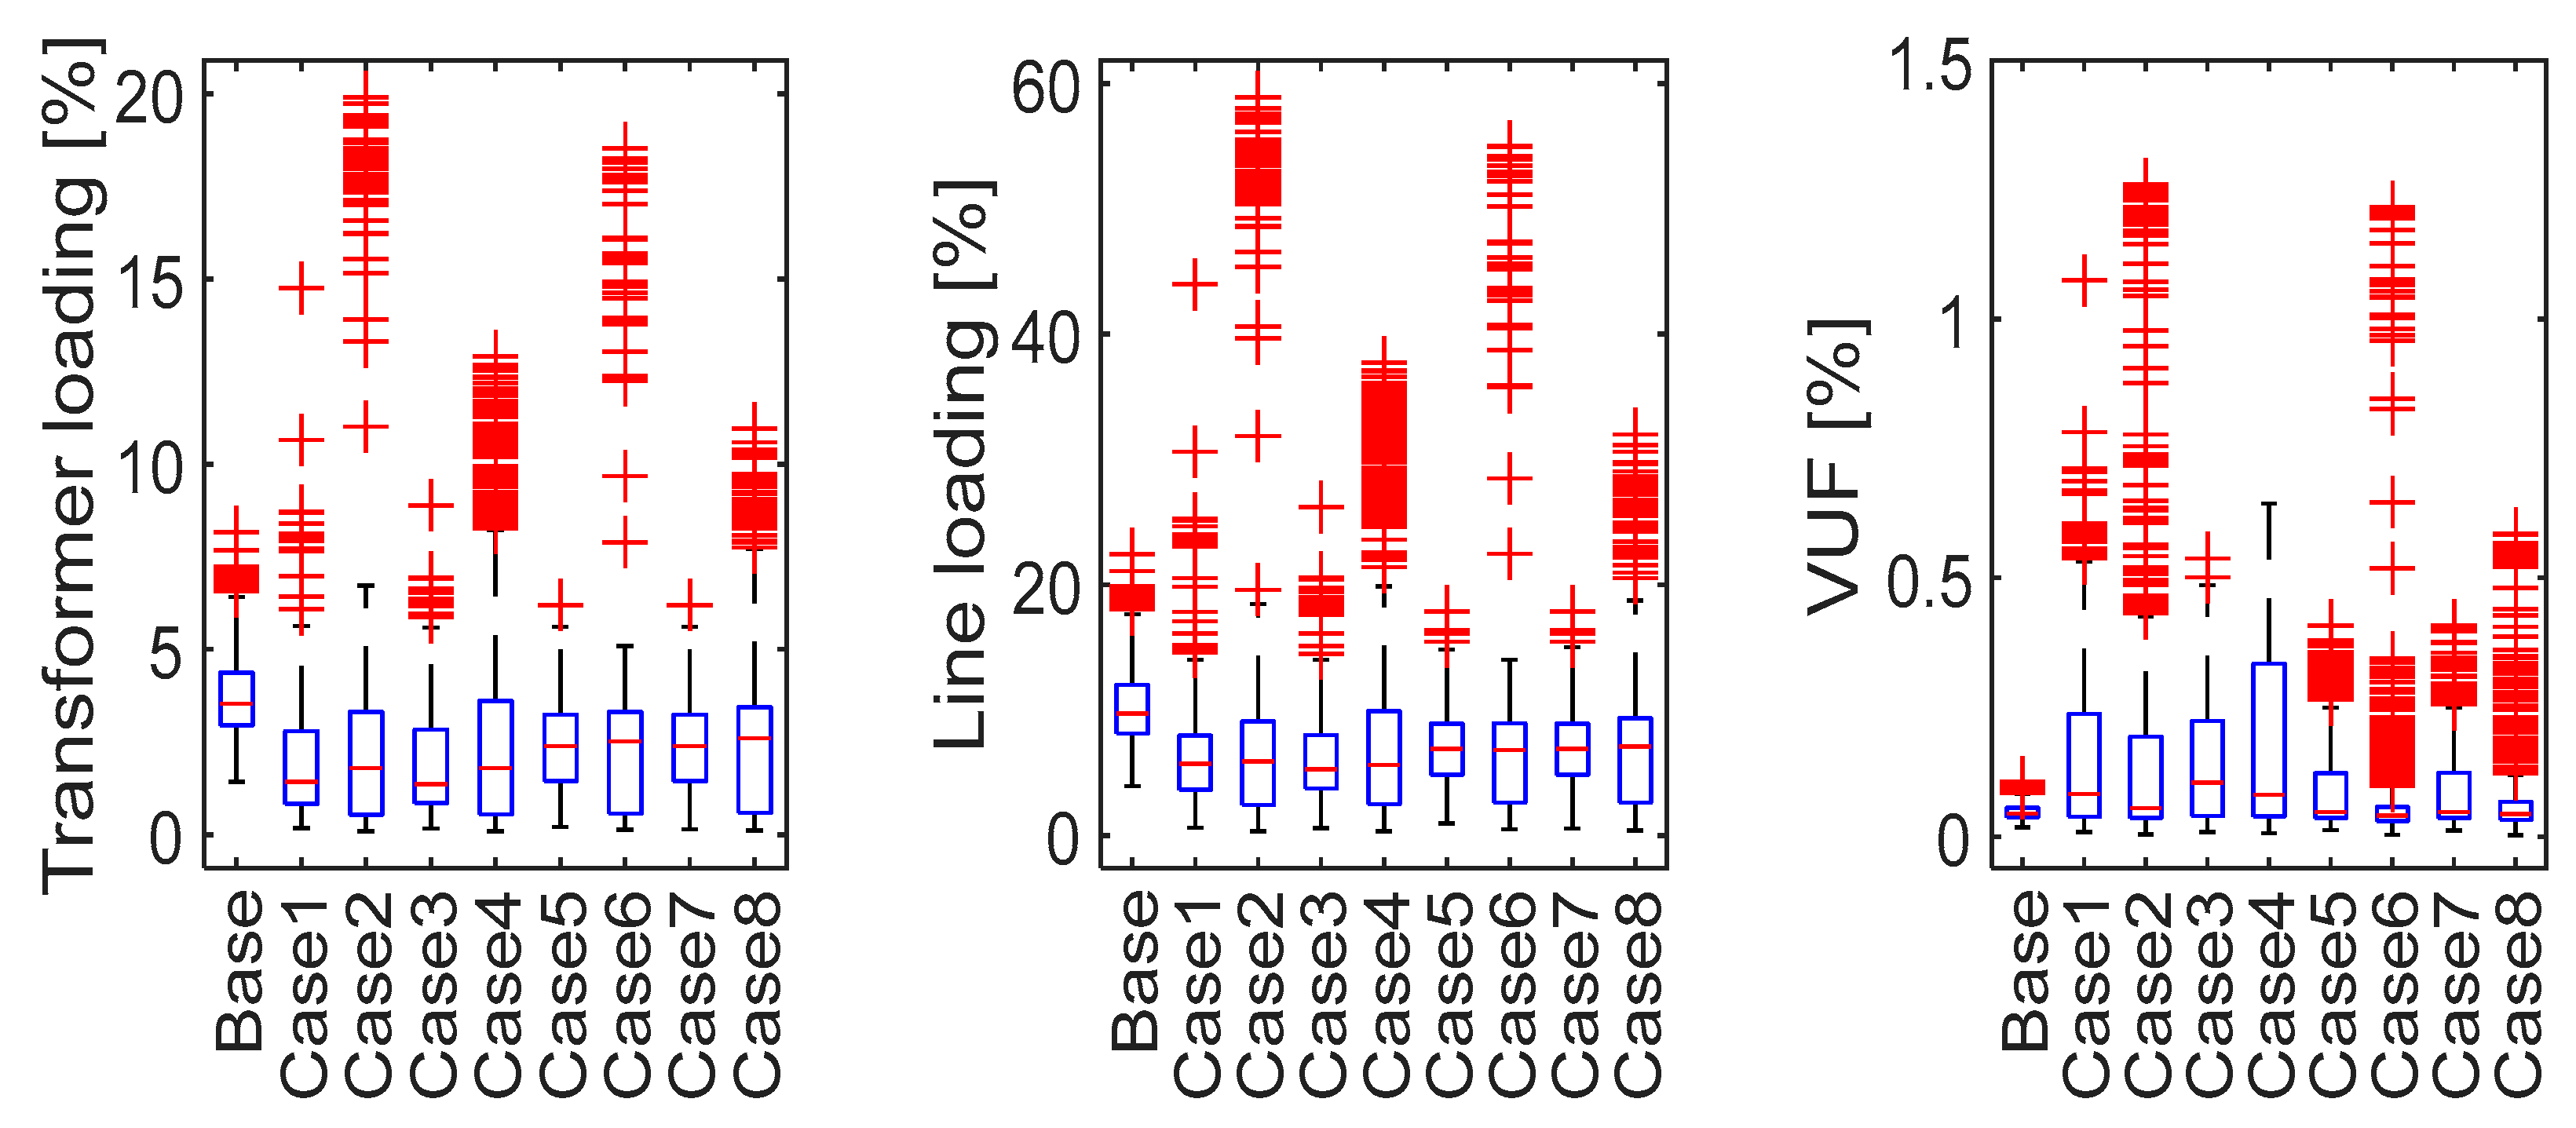
A comparative analysis was conducted to evaluate voltage variations, transformer loading, line loading, and voltage unbalance across DER integration cases over a one-month simulation period. Figure 14 illustrates that voltage levels for all three phases remained within acceptable limits across the eight DER characteristics cases and the base case for the entire simulation period.
Compared to the base case without DER integration, cases with DER integration exhibited increased voltage variations. In the base case, phase voltages were relatively stable, remaining below 1.05 pu, indicating a well-balanced and steady voltage profile. However, the introduction of DERs, particularly under P2P trading, led to uneven voltage levels across phases. This unbalance is attributed to the inherently unbalanced generation, ESS charging/discharging, and demand patterns associated with DER integration and P2P energy trading. Phase b experienced the highest voltage fluctuations, while Phase c demonstrated the lowest. In particular, Case 2 (PV 1.5 kWp, ESS 13.5 kWh, and charger 5 kW) had a notably high impact on the LV distribution network voltages. It resulted in voltage variations typically exceeding 1.06 pu, with maximum outliers reaching 1.083 pu and remaining below 1.04 pu, with minimum outliers down to 0.972 pu.
Figure 15 presents the transformer and line loading levels, as well as the VUF, over the entire simulation period. Compared to the base case, cases with DER integration showed increased higher VUF values. Moreover, most of the cases with DER integration showed increased component loading, except Cases 5 and 7, which resulted in lower component loading than the base case.
In the base case, the transformer’s average loading remained below 7% for most of the simulation period, with maximum outliers reaching 8.16%. In contrast, in Case 2, the average transformer loading stayed below 10%, but maximum outliers rose significantly to 19.90%.
A similar trend was observed in line loading. While the base case showed an average line loading under 18% with maximum outliers of 22.45%, Case 2 maintained an average loading below 20% but with a substantial rise in outliers, reaching up to 58.91%.
Regarding voltage quality, the VUF in the base case stayed below 0.1% for most of the simulation period, with maximum outliers at 0.105%. In Case 2, however, the VUF remained below 0.5% for most hours, but outliers increased markedly, peaking at 1.261%. This indicates a significant rise in voltage unbalance due to DER integration and P2P energy trading.

4.3. Research Implications and Limitations

This study contributes to the growing body of research on P2P energy trading by providing a detailed techno-economic analysis of how different DER characteristics impact cost savings and power network performance in LV distribution systems. The findings emphasize the critical role of proper DER sizing and coordination, especially of ESS, to maintain network stability while maximizing economic benefits.
The two-stage modeling approach, combining market optimization with unbalanced three-phase power flow analysis, offers a practical framework to evaluate P2P trading impacts under realistic grid constraints. This approach can be adapted to other community energy systems with similar characteristics.
However, this study has some limitations: only one representative LV network was analyzed, which may not capture the diversity of real-world topologies. This requires future research to study other LV networks [46]. Additionally, user behavior dynamics, dynamic tariffs [47], and advanced DER control strategies, particularly for high PV penetration, were simplified or excluded. These factors should be considered in future research to improve model realism.
Future work could also explore scalability to larger networks, the integration of reactive power flows, inclusion of the demand response for heat pumps [47], dynamic pricing schemes, and inclusion of uncertainties to enhance the understanding of P2P trading in real-world applications [48].
However, certain simplifications were made in the model, particularly the exclusion of reactive power and the use of aggregated load profiles. These choices allowed us to focus on core technical impacts. Future research should address these factors for a more detailed analysis.

5. Conclusions and Future Research Directions

This study has conducted a comprehensive techno-economic analysis of different distributed energy resources (DER) characteristics within a peer-to-peer (P2P) energy trading framework under a time-of-use (ToU) tariff in Aswan, Egypt. Results show that integrating PV and ESS, even at low capacities, can significantly improve community economic performance by reducing the reliance on grid-supplied electricity and facilitating energy exchanges among peers and with the distribution system operator (DSO). The most effective case, a 3 kWp PV system combined with a 13.5 kWh ESS, achieves a 68.22% reduction in total operational costs. Key network parameters, including transformer loading, line loading, voltage unbalance factors (VUF), and phase voltage magnitudes, were also evaluated. Cases with a low PV capacity but high ESS and charger rate increase both the transformer and line loading, with maximum line loading reaching 58.91% and transformer loading up to 19.90%. In contrast, cases with a higher PV capacity and low ESS reduce loading, improving asset utilization. The uneven deployment of DERs and simultaneous charging of ESS significantly contribute to voltage unbalance, with VUF values exceeding 1.2% in severe cases. Additionally, DER integration in P2P energy trading increased the voltage deviations, but none of the studied cases exceeded the acceptable limits.
However, it was also observed that certain configurations, particularly those combining a high PV capacity with large ESS, tend to increase voltage fluctuations. These insights highlight the importance of coordinated DER sizing, phase balancing, and the implementation of advanced control strategies to ensure that the technical benefits of P2P trading do not come at the expense of network reliability and power quality. Furthermore, mitigation strategies, such as network-aware coordinated ESS charging/discharging, demand response mechanisms, and power-based network tariffs, are recommended to alleviate potential overloading and voltage imbalance while maintaining the economic and operational benefits of DER integration.
Building on these findings, future research could explore several promising directions:
  • Participant Diversity: Investigate the impact of DER characteristics on P2P energy trading performance across different user types, such as commercial and industrial buildings, to assess broader applicability and scalability.
  • Network Design: Examine how various distribution network configurations (e.g., meshed vs. radial, urban vs. rural) influence the technical and economic outcomes of DER-enabled P2P trading.
  • Integration of Emerging Technologies: Incorporate additional DER technologies, such as electric vehicles (EVs), heat pumps, and controllable/flexible loads, to model more complex and realistic community energy systems.
  • Advanced Control and Pricing Mechanisms: Study reactive power flows, alternative tariff structures (e.g., real-time pricing), and coordinated DER control strategies to further enhance grid performance, efficiency, and market responsiveness.
  • DER Control Under High Penetration Cases: Explore coordinated control mechanisms for high PV and ESS configurations—such as voltage-aware ESS charging/ discharging, smart inverter utilization, and phase-based load scheduling—to mitigate voltage fluctuations and enhance overall grid stability.
  • Modeling of Uncertainties: Stochastic assessment of the effect of DER sizes on P2P energy trading performance and impacts on unbalanced distribution networks could provide important insights.
These future research avenues will contribute to the development of more resilient, efficient, and equitable P2P energy trading models better aligned with real-world distribution network constraints and evolving operational challenges.

Author Contributions

Conceptualization, M.N. and M.Z.; methodology, M.N.; software, M.N. and M.Z.; validation, M.N. and M.Z.; formal analysis, M.N. and M.Z.; investigation, M.N. and M.Z.; resources, M.N. and M.Z.; data curation, M.N. and M.Z.; writing—original draft preparation, M.Z.; writing—review and editing, M.N. and M.Z.; visualization, M.N. and M.Z.; supervision, M.N., G.S., L.N. and A.-A.A.; project administration, M.N., G.S., L.N. and A.-A.A.; funding acquisition, M.N., G.S., L.N. and A.-A.A. All authors have read and agreed to the published version of the manuscript.

Funding

Morsy Nour received funding from TED2021-131365B-C41 reference project funded by the MCIN/AEI/10.13039/501100011033 and by the European Union ‘NextGenerationEU’/PRTR.

Data Availability Statement

Part of the datasets presented in this article are not readily available because they contain consumers’ consumption profiles.

Conflicts of Interest

The authors declare no conflict of interest.

Nomenclature

Sets
t     T Time   instant   t   at   time   horizon   T
h , p     H Household   h   and   peer   p   in   a   community   H households
Scalars
ψ P 2 P P2P trading loss factor
C E S S a n d   D E S S ESS upper levels of charging and discharging powers
  S _ E S S a n d   S E S S ESS upper and lower levels of storage levels
η c E S S   a n d   η d E S S ESS charging/discharging efficiency
Parameters
D e m t , h Local   energy   demand   by   household   h   at   time   instant   t
P V   t , h P V   generation   by   household   h   at   time   instant t
p ( t ) G Import   price   from   DSO   at   time   instant   t
p ( t ) E Export   price   to   DSO   at   time   instant   t
P ( t , h ) n Net   active   power   demand   of   household   h   at   time   instant   t
Variables
I t , h P 2 P Energy   imported   via   P 2 P   trading   by   household   h   at   time   instant   t
X t , h P 2 P Energy   exported   via   P 2 P   trading   by   household   h   at   time   instant   t
I ( t , h p ) p Energy   imported   via   P 2 P   trading   by   household   h   from   peer   p at   time   instant   t
X t , p h p Energy   exported   via   P 2 P   trading   by   household   h   to   peer   p at   time   instant   t
G t , h Energy   imported   from   the   DSO   by   household   h   at   time   instant   t
E t , h Energy   exported   to   the   DSO   by   household   h   at   time   instant   t
S ( t , h ) E S S Energy   stored   in   ESS   of   household   h   at   time   instant   t
D t , h E S S Discharging   power   from   ESS   of   household   h   at   time   instant   t
C ( t , h ) E S S Charging   power   to   ESS   of   household   h   at   time   instant   t

References

  1. Muhtadi, A.; Pandit, D.; Nguyen, N. Distributed energy resources based microgrid: Review of architecture, control, and reliability. IEEE Trans. Ind. Appl. 2021, 57, 2223–2235. [Google Scholar] [CrossRef]
  2. Wang, Z.; Hou, H.; Wei, R.; Li, Z. A Distributed Market-Aided Restoration Approach of Multi-Energy Distribution Systems Considering Comprehensive Uncertainties from Typhoon Disaster. IEEE Trans. Smart Grid 2025, 16, 3743–3757. [Google Scholar] [CrossRef]
  3. Wang, Z.; Hou, H.; Zhao, B.; Zhang, L.; Shi, Y.; Xie, C. Risk-averse stochastic capacity planning and P2P trading collaborative optimization for multi-energy microgrids considering carbon emission limitations: An asymmetric Nash bargaining approach. Appl. Energy 2024, 357, 122505. [Google Scholar] [CrossRef]
  4. Bento, M.E.C.; Morais, H. Advances in Operation, Optimization, and Control of Smart Grids. Electricity 2025, 6, 27. [Google Scholar] [CrossRef]
  5. Amako, E.A.; Arzani, A.; Mahajan, S.M. Heuristic-Based Scheduling of BESS for Multi-Community Large-Scale Active Distribution Network. Electricity 2025, 6, 36. [Google Scholar] [CrossRef]
  6. Gabrovska-Evstatieva, K.G.; Trifonov, D.T.; Evstatiev, B.I. A Review of the Key Factors Influencing the Performance of Photovoltaic Installations in an Urban Environment. Electricity 2025, 6, 23. [Google Scholar] [CrossRef]
  7. Kazerani, M.; Tehrani, K. Grid of hybrid AC/DC microgrids: A new paradigm for smart city of tomorrow. In Proceedings of the 2020 IEEE 15th Interantional Conference of System of Systems Engineering, Budapest, Hungary, 2–4 June 2020. [Google Scholar] [CrossRef]
  8. Islam, S.N. A Review of Peer-to-Peer Energy Trading Markets: Enabling Models and Technologies. Energies 2024, 17, 1702. [Google Scholar] [CrossRef]
  9. Galici, M.; Troncia, M.; Nour, M.; Chaves-Ávila, J.P.; Pilo, F. Comparative techno-economic analysis of market models for peer-to-peer energy trading on a distributed platform. Appl. Energy 2025, 380, 125005. [Google Scholar] [CrossRef]
  10. Toledo-Pérez, M.D.C.; Vargas-Méndez, R.A.; Claudio-Sánchez, A.; Osorio-Gordillo, G.L. General Approach to Electrical Microgrids: Optimization, Efficiency, and Reliability. Electricity 2025, 6, 12. [Google Scholar] [CrossRef]
  11. Zedan, M.; Nour, M.; Shabib, G.; Ali, Z.M.; Alharbi, A.; Mohamed, A.A. Techno-economic Assessment of Peer to Peer Energy Trading: An Egyptian Case Study. IEEE Access 2024, 12, 58317–58337. [Google Scholar] [CrossRef]
  12. Nour, M.; Chaves-Ávila, J.P.; Troncia, M.; Ali, A.; Sánchez-Miralles, Á. Impacts of Community Energy Trading on Low Voltage Distribution Networks. IEEE Access 2023, 11, 50412–50430. [Google Scholar] [CrossRef]
  13. Nasrat, L.; Zedan, M.; Ali, A.; Shabib, G. Review on Energy Trading of Community-Based Projects around the World. In Proceedings of the IEEE 23rd International Middle East Power Systems Conference (MEPCON), Cairo, Egypt, 13–15 December 2022. [Google Scholar] [CrossRef]
  14. Hayes, B.P.; Thakur, S.; Breslin, J.G. Co-simulation of electricity distribution networks and peer to peer energy trading platforms. Int. J. Electr. Power Energy Syst. 2020, 115, 105419. [Google Scholar] [CrossRef]
  15. Azim, M.I.; Tushar, W.; Saha, T.K. Investigating the impact of P2P trading on power losses in grid-connected networks with prosumers. Appl. Energy 2020, 263, 114687. [Google Scholar] [CrossRef]
  16. Dynge, M.F.; del Granado, P.C.; Hashemipour, N.; Korpås, M. Impact of local electricity markets and peer-to-peer trading on low-voltage grid operations. Appl. Energy 2021, 301, 117404. [Google Scholar] [CrossRef]
  17. Hashemipour, N.; Aghaei, J.; Del Granado, P.C.; Kavousi-Fard, A.; Niknam, T.; Shafie-khah, M. Uncertainty modeling for participation of electric vehicles in collaborative energy consumption. IEEE Trans. Veh. Technol. 2022, 71, 10293–10302. [Google Scholar] [CrossRef]
  18. Saif, A.; Khadem, S.K.; Conlon, M.; Norton, B. Hosting a community-based local electricity market in a residential network. IET Energy Syst. Integr. 2022, 4, 448–459. [Google Scholar] [CrossRef]
  19. Saif, A.; Khadem, S.K.; Conlon, M.F. Impact of Distributed Energy Resources in Smart Homes and Community-Based Electricity Market. IEEE Trans. Ind. Appl. 2023, 59, 59–69. [Google Scholar] [CrossRef]
  20. Saif, A.; Khadem, S.K.; Conlon, M.; Norton, B. Local Electricity Market operation in presence of residential energy storage in low voltage distribution network: Role of retail market pricing. Energy Rep. 2023, 9, 5799–5811. [Google Scholar] [CrossRef]
  21. Nour, M.; Chaves-Ávila, J.P.; Troncia, M.; Sánchez-Miralles, M.Á. Mitigating the Impacts of Community Energy Trading on Distribution Networks by Considering Contracted Power Network Charges. IEEE Access 2024, 12, 26991–27004. [Google Scholar] [CrossRef]
  22. Zedan, M.; Nour, M.; Shabib, G.; Nasrat, L.; Ali, A. Review of peer-to-peer energy trading: Advances and challenges. E-Prime—Adv. Electr. Eng. Electron. Energy 2024, 10, 100778. [Google Scholar] [CrossRef]
  23. Tehrani, K.; Simde, D.; Fozing, J.; Jamshidi, M. A 3D design of a small hybrid farm for microgrids. In Proceedings of the IEEE-WAC2022, San Antonio, TX, USA, 11–15 October 2022. [Google Scholar] [CrossRef]
  24. Ma, H.; Xiang, Y.; Sun, W.; Dai, J.; Zhang, S.; Liu, Y.; Liu, J. Optimal Peer-to-Peer Energy Transaction of Distributed Prosumers in High-Penetrated Renewable Distribution Systems. IEEE Trans. Ind. Appl. 2024, 60, 4622–4632. [Google Scholar] [CrossRef]
  25. Ali, L.; Muyeen, S.M.; Bizhani, H.; Ghosh, A. A peer-to-peer energy trading for a clustered microgrid—Game theoretical approach. Int. J. Electr. Power Energy Syst. 2021, 133, 107307. [Google Scholar] [CrossRef]
  26. Ali, L.; Muyeen, S.M.; Bizhani, H.; Simoes, M.G. Economic planning and comparative analysis of market-driven multi-microgrid system for peer-to-peer energy trading. IEEE Trans. Ind. Appl. 2022, 58, 4025–4036. [Google Scholar] [CrossRef]
  27. Ali, L.; Muyeen, S.M.; Bizhani, H.; Ghosh, A. A multi-objective optimization for planning of networked microgrid using a game theory for peer-to-peer energy trading scheme. IET Gener. Transm. Distrib. 2021, 15, 3423–3434. [Google Scholar] [CrossRef]
  28. Kang, H.; Jung, S.; Jeoung, J.; Hong, J.; Hong, T. A bi-level reinforcement learning model for optimal scheduling and planning of battery energy storage considering uncertainty in the energy-sharing community. Sustain. Cities Soc. 2023, 94, 104538. [Google Scholar] [CrossRef]
  29. Secchi, M.; Barchi, G.; Macii, D.; Moser, D.; Petri, D. Multi-objective battery sizing optimisation for renewable energy communities with distribution-level constraints: A prosumer-driven perspective. Appl. Energy 2021, 297, 117171. [Google Scholar] [CrossRef]
  30. Li, Y.; Qian, F.; Gao, W.; Fukuda, H.; Wang, Y. Techno-economic performance of battery energy storage system in an energy sharing community. J. Energy Storage 2022, 50, 104247. [Google Scholar] [CrossRef]
  31. Rodrigues, D.L.; Ye, X.; Xia, X.; Zhu, B. Battery energy storage sizing optimisation for different ownership structures in a peer-to-peer energy sharing community. Appl. Energy 2020, 262, 114498. [Google Scholar] [CrossRef]
  32. Yaldız, A.; Gokçek, T.; Sengor, I.; Erdinç, O. Optimal sizing and economic analysis of photovoltaic distributed generation with Battery Energy Storage System considering peer-to-peer energy trading. Sustain. Energy Grids Netw. 2021, 28, 100540. [Google Scholar] [CrossRef]
  33. Fioriti, D.; Frangioni, A.; Poli, D. Optimal sizing of energy communities with fair revenue sharing and exit clauses: Value, role and business model of aggregators and users. Appl. Energy 2021, 299, 117328. [Google Scholar] [CrossRef]
  34. Lazzari, F.; Mor, G.; Cipriano, J.; Solsona, F.; Chemisana, D.; Guericke, D. Optimizing planning and operation of renewable energy communities with genetic algorithms. Appl. Energy 2023, 338, 120906. [Google Scholar] [CrossRef]
  35. Nour, M.; Chaves-Ávila, J.P.; Troncia, M.; Sánchez-Miralles, Á.; Ali, A. Optimal planning and operation of energy community DERs considering local energy trading and uncertainties. Results Eng. 2025, 26, 104881. [Google Scholar] [CrossRef]
  36. Pandapower 2.3.0 Documentation. [Online]. Available online: https://pandapower.readthedocs.io/en/v2.3.1/index.html (accessed on 10 July 2025).
  37. Thurner, L.; Scheidler, A.; Schäfer, F.; Menke, J.H.; Dollichon, J.; Meier, F.; Meinecke, S.; Braun, M. Pandapower—An Open-Source Python Tool for Convenient Modeling, Analysis, and Optimization of Electric Power Systems. IEEE Trans. Power Syst. 2018, 33, 6510–6521. Available online: https://ieeexplore.ieee.org/document/8344496 (accessed on 1 July 2025). [CrossRef]
  38. Lüth, A.; Zepter, J.M.; Del Granado, P.C.; Egging, R. Local electricity market designs for peer-to-peer trading: The role of battery flexibility. Appl. Energy 2018, 299, 1233–1243. [Google Scholar] [CrossRef]
  39. “Resources—IEEE PES Test Feeder”. [Online]. Available online: https://cmte.ieee.org/pes-testfeeders/resources/ (accessed on 20 June 2025).
  40. Egyptian Electric Utility and Consumer Protection Regulatory Agency (EgyptERA), Website [Online]. Available online: http://egyptera.org/ar/Tarrif2022N.aspx (accessed on 1 July 2025).
  41. Behira Electricity Distribution Co. Website [Online]. Available online: https://www.bedc.gov.eg/ (accessed on 1 July 2025).
  42. Renewables.ninja, Website [Online]. Available online: https://www.renewables.ninja (accessed on 1 July 2025).
  43. Rienecker, M.M.; Suarez, M.J.; Gelaro, R.; Todling, R.; Bacmeister, J.; Liu, E.; Bosilovich, M.G.; Schubert, S.D.; Takacs, L.; Kim, G.-K.; et al. MERRA: Nasa’s modern-era retrospective analysis for research and applications. J. Clim. 2011, 24, 3624–3648. [Google Scholar] [CrossRef]
  44. Eskandarpour Azizkandi, M.; Sedaghati, F.; Shayeghi, H. An interleaved configuration of modified ky converter with high conversion ratio for renewable energy applications; design, analysis and implementation. J. Oper. Autom. Power Eng. 2019, 7, 90–106. [Google Scholar] [CrossRef]
  45. IEC 61000-3-14; Assessment of Emission Limits for Harmonics, Interharmonics, Voltage Fluctuations and Unbalance for the Connection of Disturbing Installations to LV Power Systems. IEC: Geneva, Switzerland, 2011. Available online: https://webstore.iec.ch/publication/4147 (accessed on 1 July 2025).
  46. Marcos, F.E.P.; Domingo, C.M.; Román, T.G.S.; Palmintier, B.; Hodge, B.-M.; Krishnan, V.; García, F.D.C.; Mather, B. A review of power distribution test feeders in the united states and the need for synthetic representative networks. Energies 2017, 10, 1896. [Google Scholar] [CrossRef]
  47. Morell-Dameto, N.; Chaves-Ávila, J.P.; San Román, T.G.; Dueñas-Martínez, P.; Schittekatte, T. Network tariff design with flexible customers: Ex-post pricing and a local network capacity market for customer response coordination. Energy Policy 2024, 184, 113907. [Google Scholar] [CrossRef]
  48. Uddin, N.; Wu, Y.; Islam, M.S.; Zakaria, K.M. An optimized decentralized peer-to-peer energy trading system for smart grids incorporating uncertain renewable energy sources through fuzzy optimization. Electr. Power Syst. Res. 2025, 238, 111154. [Google Scholar] [CrossRef]
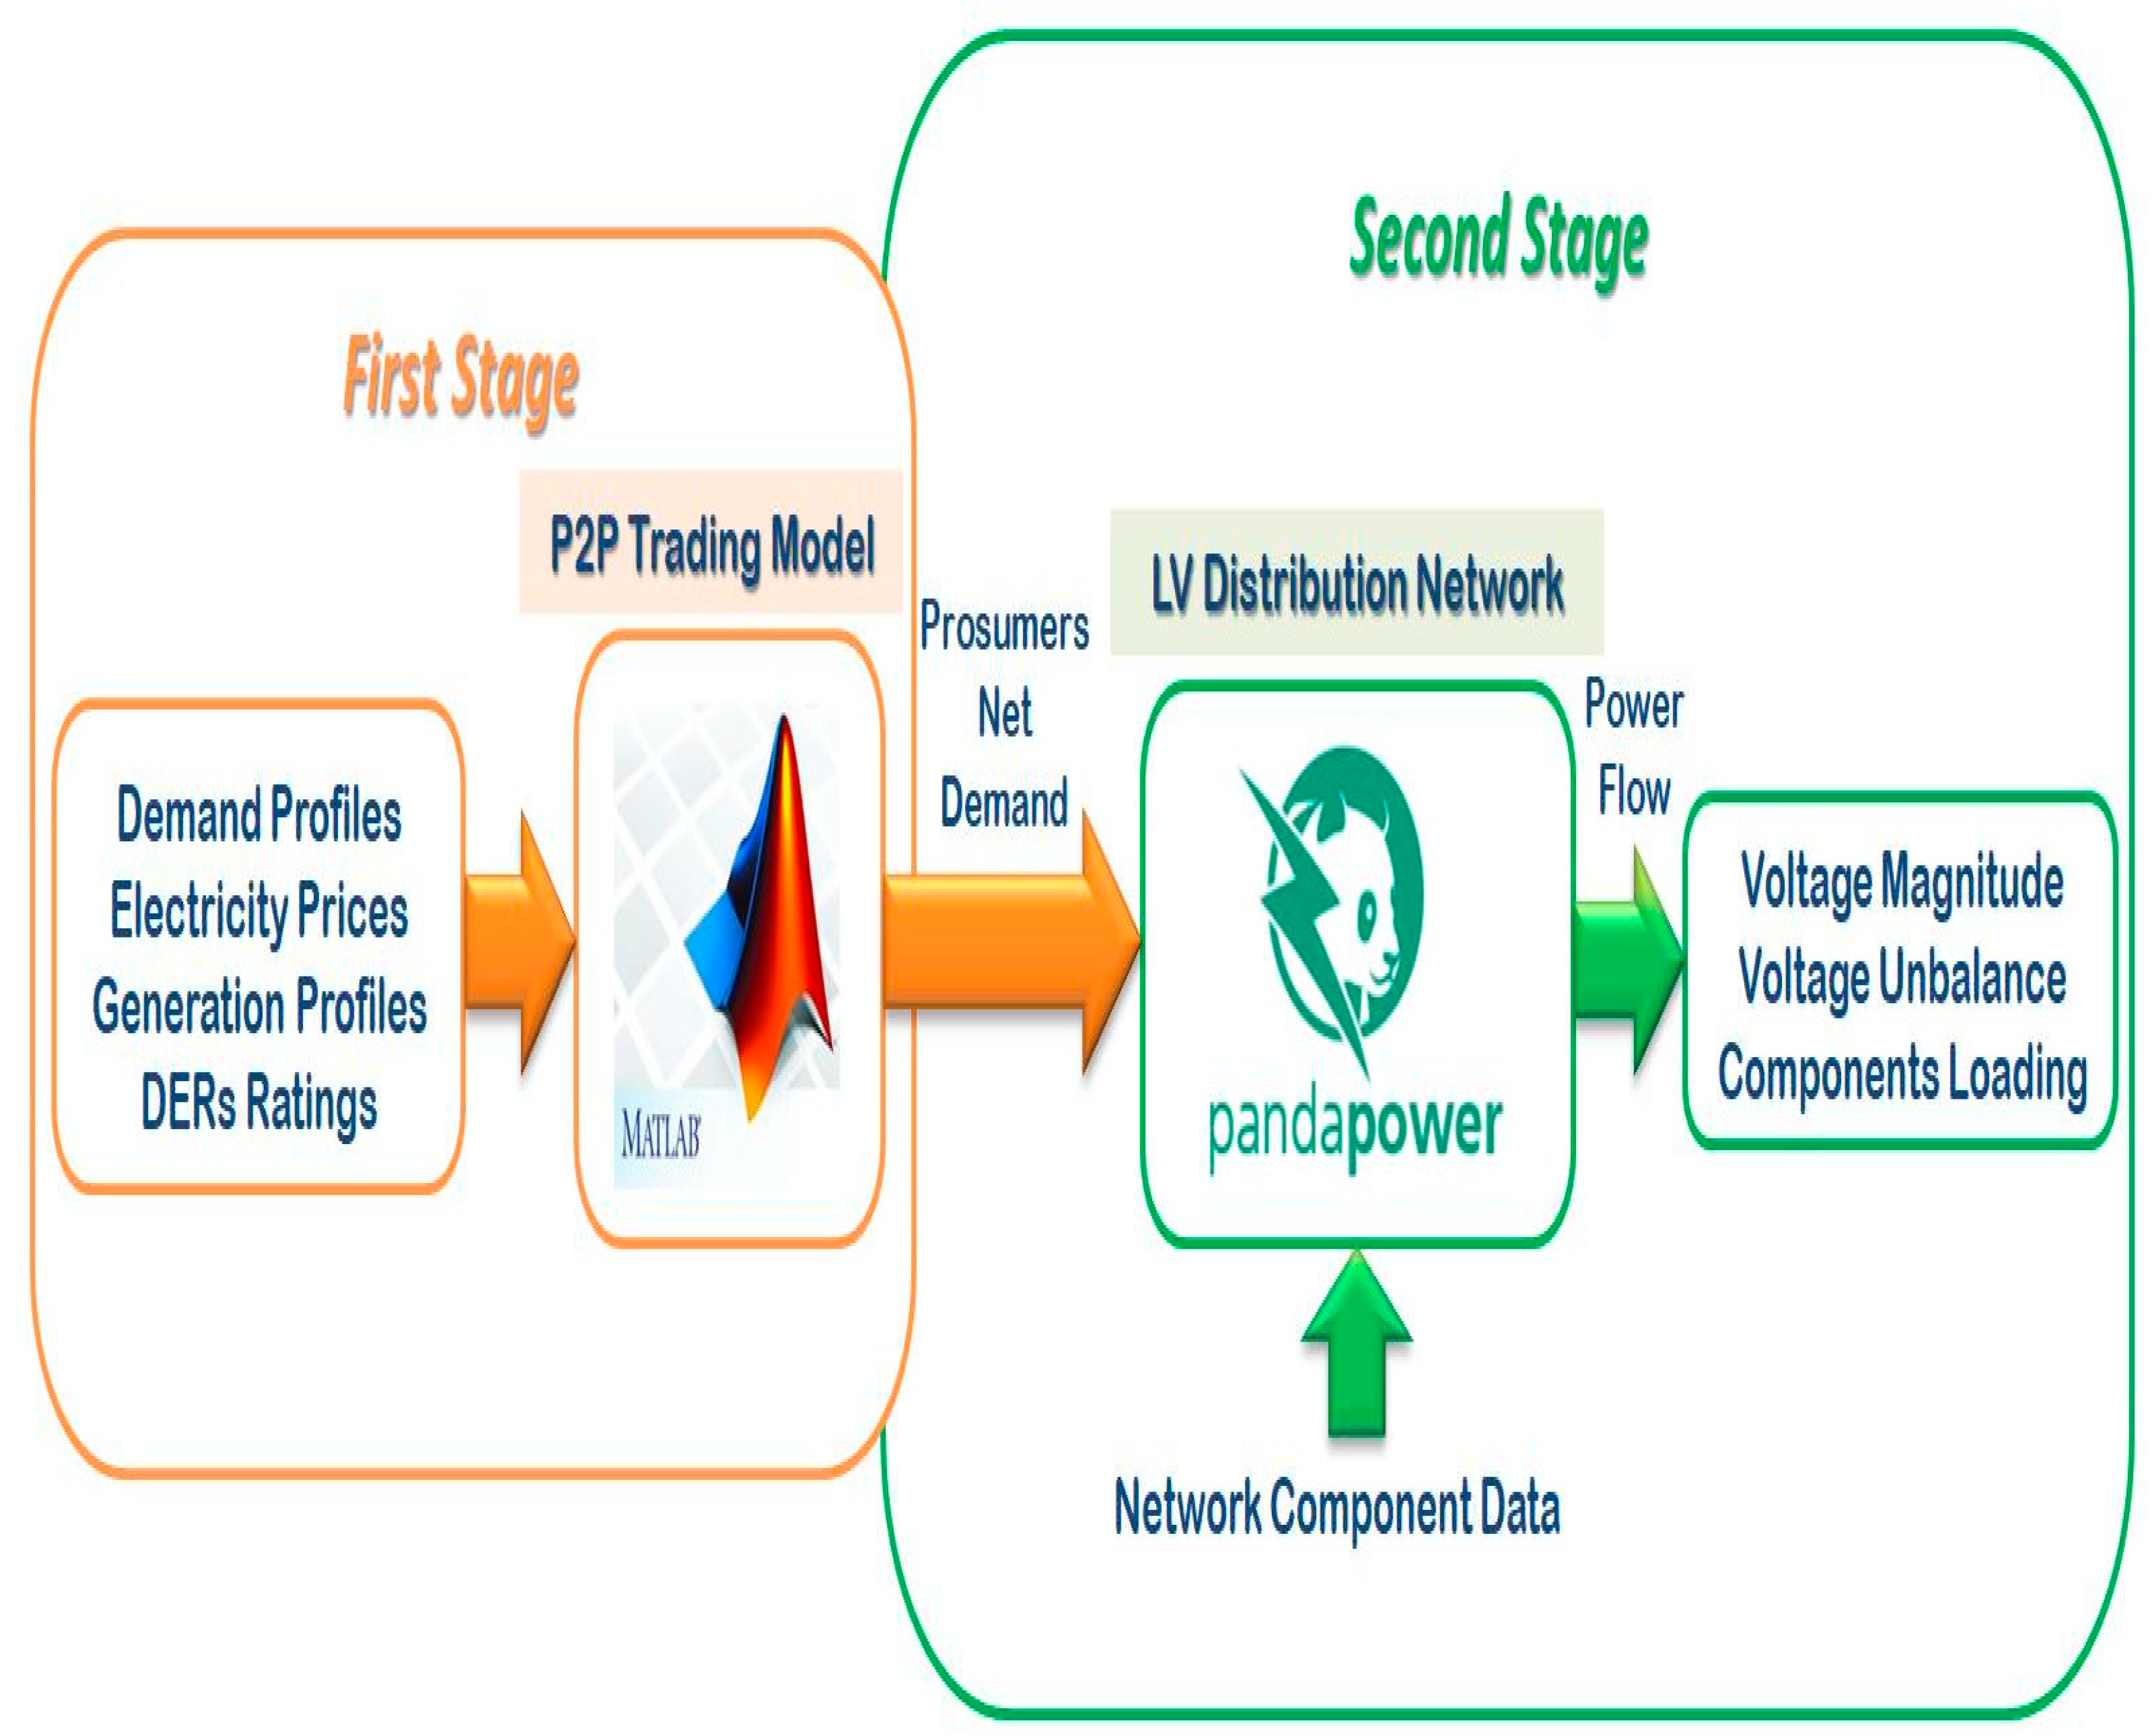
Figure 1. Schematic overview of the two-stage modeling framework integrating P2P energy trading optimization and three-phase AC power flow analysis for assessing impacts on unbalanced LV distribution networks.
Electricity 06 00057 g001
Figure 2. Schematic representation of the IEEE European LV distribution network used in this study.
Electricity 06 00057 g002
Figure 3. Aggregated demand profiles for 55 households over three-days (where H household and dem   Demand). (Note: The stacked area plot illustrates the total demand from 55 households, where each colored layer represents an individual household’s consumption.).
Electricity 06 00057 g003
Figure 4. Electricity prices over three days.
Electricity 06 00057 g004
Figure 5. PV generation profile for one household over three days in pu.
Electricity 06 00057 g005
Figure 6. DERs and their conversion system for: (a) a household with only PV; (b) a household with PV and ESS.
Electricity 06 00057 g006
Figure 7. Comparison of the cases studied based on: (a) imports from the DSO, (b) exports to the DSO, and (c) traded energy within the community over three days.
Electricity 06 00057 g007
Figure 8. Phase a voltage over (a) one month and (b) three days.
Electricity 06 00057 g008
Figure 9. Phase b voltage over (a) one month and (b) three days.
Electricity 06 00057 g009
Figure 10. Phase c voltage over (a) one month and (b) three days.
Electricity 06 00057 g010
Figure 11. Voltage unbalance factor (VUF) over (a) one month and (b) three days.
Electricity 06 00057 g011
Figure 12. Transformer loading over (a) one month and (b) three days.
Electricity 06 00057 g012
Figure 13. Line loading over (a) one month and (b) three days.
Electricity 06 00057 g013
Figure 14. Comparison of the voltage variation impacts of different cases using boxplot representations over one month.
Electricity 06 00057 g014
Figure 15. Comparison of the transformer loading, line loading, and phase unbalance impacts of different cases using boxplot representations over one month.
Electricity 06 00057 g015
Table 1. Overview of related studies on the impact of P2P energy trading on distribution networks. (Note: This is a qualitative comparison highlighting the scope, DER characteristics, and evaluated impacts, not a direct experimental comparison.).
CountryDERDERsStudyVoltageEvaluatedReference
TechnologiesCharacteristicsPeriodUnbalanceImpacts
EnglandPV, EVNo1 DayYesVoltage, Power Losses,
and Peak Demand
[14]
AustraliaPV, ESS, and
Controllable loads
No1 DayNoVoltage, Power Losses[15]
NorwayPV, ESS/EVNo21 Days
(Summer)
NoVoltage, Power Losses,
and Peak Demand
[16]
EnglandPV, WG, ESS, and EVNo1 MonthNoVoltage[17]
IrelandPV, ESSNoJanuary/JuneNoVoltage, Power Losses[18]
IrelandPV, ESSNoJanuary/JuneNoVoltage[19]
SpainPV, ESS, and EVNo1 Month (July)YesVoltage, Peak Demand, and Components Loading[12]
IrelandPV, ESSNoJanuary/JuneYesVoltage, Power Losses[20]
EgyptPV, ESS, and EVNo1 Month (June)YesVoltage, Peak Demand, and Components Loading[11]
SpainPV, ESS, and EVNo1 Month (July)YesVoltage, Peak Demand, and Components Loading[21]
EgyptPV, ESSYes1 Month (June)YesVoltage, Peak Demand, and Components loadingThis Study
PV (photovoltaic), ESS (energy storage system), EV (electric vehicle), and WG (wind generator).
Table 2. Installed DERs at individual households.
HouseholdDERHouseholdDERHouseholdDERHouseholdDER
1PV + ESS15PV + ESS29No DER43PV
2PV + ESS16PV30PV + ESS44No DER
3PV + ESS17No DER31No DER45PV + ESS
4No DER18PV + ESS32PV46No DER
5PV + ESS19No DER33PV + ESS47No DER
6No DER20PV + ESS34PV48PV + ESS
7PV21No DER35No DER49PV
8PV22No DER36No DER50PV + ESS
9PV + ESS23PV + ESS37PV + ESS51No DER
10No DER24PV38No DER52PV + ESS
11No DER25PV39PV53PV + ESS
12PV + ESS26No DER40PV + ESS54PV + ESS
13No DER27PV + ESS41PV55PV + ESS
14No DER28No DER42No DER
Table 3. Characteristics of the base case and the eight different DER cases.
CasePV Capacity
(kWp)
ESS Capacity
(kWh)
Charger Power
(kW)
Remarks
Base 000No DER (DSO supply only)
Case 1313.55High PV capacity, ESS capacity, and charge rate
Case 21.513.55Low PV capacity; high ESS capacity and charge rate
Case 3313.52.5High PV and ESS capacity; low charge rate
Case 41.513.52.5Low PV capacity and charge rate; high ESS capacity
Case 5375High PV capacity and charge rate; low ESS capacity
Case 61.575Low PV and ESS capacity; high charge rate
Case 7372.5High PV capacity; low ESS capacity and charge rate
Case 81.572.5Low PV capacity, ESS capacity, and charge rate
Table 4. Comparative analysis of the base case and eight cases with different DER characteristics for one month.
No DERESS 13.5kWh, C 5kWESS 13.5 kWh, C 2.5 kWESS 7kWh, C 5kWESS 7 kWh, C 2.5 kW
PV
3kWp
PV
1.5kWp
PV
3kWp
PV
1.5kWp
PV
3kWp
PV
1.5kWp
PV
3kWp
PV
1.5kWp
BaseCase 1Case 2Case 3Case 4Case 5Case 6Case 7Case 8
Costs of DSO Energy Import (EGP)24,139.867836.5614,610.057836.5614,610.0510,535.6415,160.1110,535.6415,160.11
Revenue of DSO Energy Export (EGP)0165.360165.3602095.8502095.850
Total Operational Costs (EGP)24,139.867671.2014,610.057671.2014,610.058439.7915,160.118439.7915,160.11
Cost Reduction vs. Base (%)-−68.22−39.47−68.22−39.47−65.03−37.19−65.03−37.19
Energy Imported from DSO (kWh)20,368.03
7492.60
−63.21
14,239.09
−30.09
7492.60
−63.21
14,239.09
−30.09
9294.58
−54.36
13,789.78
−32.29
9294.58
−54.36
13,789.78
−32.29
Energy Exported to DSO (kWh)0195.000195.0002471.5302471.530
Demand Supplied by DSO (%)10036.7969.9036.7969.9045.6467.7145.6467.71
Demand Supplied by DERs (%)063.2130.1063.2130.1054.3632.2954.3632.29
Peak Grid Consumption (kW)61.2095.72130.4959.9188.2038.46120.9238.4674.85
Change in Peak Demand vs. Base (%)-+56.40+113.21−2.10+44.11−37.15+97.58−37.15+22.30
Total P2P Energy Traded (kWh)06919.725148.576919.725148.573473.232268.893473.232268.89
Table 5. Simulation results for the base case and eight DER cases evaluating their effects on the LV distribution network across one month.
No DERESS 13.5 kWh, C 5 kWESS 13.5 kWh, C 2.5 kWESS 7 kWh, C 5 kWESS 7 kWh, C 2.5 kW
PV
3 kWp
PV
1.5 kWp
PV
3 kWp
PV
1.5 kWp
PV
3 kWp
PV
1.5 kWp
PV
3 kWp
PV
1.5 kWp
BaseCase 1Case 2Case 3Case 4Case 5Case 6Case 7Case 8
Minimum Va (pu)1.0311.0080.9921.0251.0141.0380.9961.0381.020
Maximum Va (pu)1.0461.0761.0701.0691.0631.0691.0631.0691.064
Minimum Vb (pu)1.0280.9880.9721.0151.0041.0360.9771.0361.009
Maximum Vb (pu)1.0461.0801.0831.0691.0691.0681.0651.0681.064
Minimum Vc (pu)1.0341.0261.0271.0311.0311.0351.0351.0361.035
Maximum Vc (pu)1.0471.0631.0571.0621.0551.0621.0551.0621.055
Maximum VUF (%)0.1051.0751.2610.5380.64410.4081.2160.4080.586
Maximum line loading (%)22.4543.9758.9126.2037.7317.8854.9917.8832.02
Maximum transformer loading (%)8.1614.7519.908.8912.916.2018.536.2010.96
Disclaimer/Publisher’s Note: The statements, opinions and data contained in all publications are solely those of the individual author(s) and contributor(s) and not of MDPI and/or the editor(s). MDPI and/or the editor(s) disclaim responsibility for any injury to people or property resulting from any ideas, methods, instructions or products referred to in the content.