Article

Multi-Objective Optimization for Economic and Environmental Dispatch in DC Networks: A Convex Reformulation via a Conic Approximation

by
Nestor Julian Bernal-Carvajal
,
Carlos Arturo Mora-Peña
and
Oscar Danilo Montoya
*
Grupo de Compatibilidad e Interferencia Electromagnética, Facultad de Ingeniería, Universidad Distrital Francisco José de Caldas, Bogotá 110231, Colombia
*
Author to whom correspondence should be addressed.
Electricity 2025, 6(3), 43; https://doi.org/10.3390/electricity6030043 (registering DOI)
Submission received: 10 May 2025 / Revised: 14 June 2025 / Accepted: 23 July 2025 / Published: 1 August 2025

Abstract

This paper addresses the economic–environmental dispatch (EED) problem in DC power grids integrating thermoelectric and photovoltaic generation. A multi-objective optimization model is developed to minimize both fuel costs and CO2 emissions while considering power balance, voltage constraints, generation limits, and thermal line capacities. To overcome the non-convexity introduced by quadratic voltage products in the power flow equations, a convex reformulation is proposed using second-order cone programming (SOCP) with auxiliary variables. This reformulation ensures global optimality and enhances computational efficiency. Two test systems are used for validation: a 6-node DC grid and an 11-node grid incorporating hourly photovoltaic generation. Comparative analyses show that the convex model achieves objective values with errors below 0.01% compared to the original non-convex formulation. For the 11-node system, the integration of photovoltaic generation led to a 24.34% reduction in operating costs (from USD 10.45 million to USD 7.91 million) and a 27.27% decrease in CO2 emissions (from 9.14 million kg to 6.64 million kg) over a 24 h period. These results confirm the effectiveness of the proposed SOCP-based methodology and demonstrate the environmental and economic benefits of renewable integration in DC networks.

1. Introduction

1.1. General Context

The increase in energy demand and industrialization has driven up CO2 emissions, leading to the adoption of strategies that combine the integration of renewable energies with the optimization of economic–environmental dispatch [1,2]. In contexts such as Colombia, where electricity generation heavily depends on hydropower resources and requires thermal backup during drought periods, there is a clear need to efficiently coordinate plant operation and energy planning to reduce both costs and emissions [3].
Within this framework, the development of advanced optimization models for economic–environmental dispatch becomes essential, as it improves operational efficiency by incorporating a detailed representation of combined cycle thermal plants, which are potentially more efficient and less polluting [4]. Simultaneously, the evolution towards high-voltage direct current (HVDC) transmission networks, especially MT-HVDC systems, offers a promising solution to expand transmission capacity, reduce losses, and enhance the stability of electrical systems, while also facilitating the integration of renewable energy sources [5]. This integrated approach, which combines optimized dispatch with the implementation of MT-HVDC infrastructures, emerges as a key element in the energy transition, contributing to a more reliable, flexible, and sustainable power system [6,7].

1.2. Motivation

Economic dispatch is a central problem in the efficient operation of power systems, as it seeks to minimize generation costs while ensuring operational constraints and system stability [8]. The growing integration of renewable energy sources and the need for more flexible operation have introduced new challenges in the formulation and solution of this problem [9]. Traditional methods such as linear and quadratic programming have shown limitations when addressing increasingly complex models, which has led to the emergence of convex optimization and conic relaxation techniques as viable alternatives [10].
The use of second-order cone relaxation allows non-convex economic dispatch problems to be transformed into approximate convex formulations, ensuring the discovery of globally optimal solutions with greater computational efficiency. In particular, the reformulation of optimal power flow through conic models has proven effective in HVDC systems, where loss reduction and operational stability are essential. This approach has been extended to MT-HVDC networks, facilitating the interconnection of large generation and demand centers across long distances [11].
Implementing an economic dispatch model based on conic relaxation in MT-HVDC networks enables the integration of conventional thermal generation with renewable sources, while simultaneously minimizing operational costs and environmental impact. Additionally, the model incorporates a robust analysis that considers uncertainties in demand and renewable generation, providing a strategy adaptable to system operational variations [12].
The application of this methodology optimizes generation allocation, enhances the modeling of renewable energy integration into a power system without compromising system reliability, and, by transforming the economic dispatch problem into a convex formulation, ensures an efficient and scalable solution for energy management in modern electrical grids.

1.3. Literature Review

Electricity generation has been fundamental to industrial, technological, and social development, enabling the modernization of various sectors and improving quality of life. Initially, electricity was produced from fossil fuels and hydroelectric power plants, later incorporating renewable sources such as solar and wind energy. However, the sustained growth of energy demand has led to a notable increase in greenhouse gas emissions, driving the search for solutions that combine operational efficiency with environmental responsibility [13,14].
Economic–environmental dispatch emerges as a mathematical approach aimed at minimizing both operating costs and pollutant emissions through the optimal allocation of generation resources in the electrical system [11]. Initially, models based on linear and nonlinear programming were used to represent operational constraints and associated costs. As the sector evolved, more sophisticated techniques such as quadratic programming and mixed-integer programming were introduced to manage discrete aspects, such as the start-up and shutdown of thermal units [15,16].
The adoption of metaheuristic algorithms, such as particle swarm optimization and genetic algorithms, offered new alternatives for exploring large solution spaces in highly non-convex problems [17]. However, these methods present limitations in terms of stability and performance, leading to the exploration of hybrid approaches that integrate traditional mathematical models with artificial intelligence techniques [18].
In this context, the incorporation of advanced infrastructures, such as MT-HVDC transmission networks, has driven changes in the design of optimization models. These networks offer greater flexibility for long-distance energy transmission and facilitate the integration of renewable energy sources, while imposing new operational constraints that require more refined optimization methods [19].
A key innovation in this area is conic relaxation, a technique that reformulates the non-convex problem into a set of convex constraints. This not only enables the achievement of globally optimal solutions but also improves stability and reduces computation times. The effectiveness of conic relaxation has been demonstrated in optimal power flow analysis for HVDC networks and in the management of distributed renewable generation, where operational constraints and variability make conventional methods less effective [11].
To contextualize the contribution of this work within the broader research landscape, Table 1 presents a summary of relevant studies addressing the economic–environmental dispatch (EED) problem in power systems. The table highlights the main methodologies employed in the literature, identifies their key limitations, and contrasts them with the proposed approach. This comparison aims to clearly demonstrate the added value of the convex reformulation based on second-order cone programming (SOCP), especially in scenarios involving DC grids with integrated renewable generation.
As shown in Table 1, traditional methods such as classical optimization and heuristic techniques (e.g., PSO) face limitations related to scalability, lack of global optimality guarantees, and poor integration of renewable energy sources. Recent works employing convex relaxation techniques have focused primarily on AC systems and single-objective formulations. In contrast, the methodology proposed in this paper addresses these shortcomings by formulating a multi-objective EED model tailored to DC networks, incorporating real photovoltaic generation profiles, and enabling globally optimal solutions through SOCP. This ensures both computational efficiency and physical feasibility under realistic operating conditions.

1.4. Contribution and Scope

The main contributions and the scope of this research are presented below:
  • A novel convex reformulation of the economic–environmental dispatch (EED) problem in DC networks using second-order cone programming (SOCP), which transforms the original non-convex model into a tractable convex approximation with global optimality guarantees.
  • A comparative and physical validation of the SOCP-based model against the original NLP formulation using two MT-HVDC test systems (6-node and 11-node) with photovoltaic generation, demonstrating significant improvements in computational efficiency and emission–cost trade-offs.
This research is limited to the analysis of steady-state operation in radial MT-HVDC networks, where all system parameters such as line resistances, voltage limits, and current limits are considered deterministic and known in advance. The model neglects dynamic system behavior, protection schemes, and stochastic variations in demand or solar irradiance. The conic relaxation approach is applied to quadratic terms in the power balance equation but does not extend to unit commitment or integer-based constraints. Additionally, the model assumes a fixed topology and does not account for reconfiguration or contingency scenarios. The proposed methodology is tested on two benchmark systems to demonstrate its scalability and suitability for real-world planning scenarios in modern DC grids.
Unlike prior studies that have employed SOCP techniques in AC power systems primarily for voltage regulation or single-objective optimal power flow, this work presents a novel application of conic relaxation to a multi-objective EED problem in MT-HVDC. The proposed methodology stands out by addressing the non-convexity of power balance equations through an algebraic reformulation that introduces auxiliary variables and transforms quadratic voltage terms into second-order cone constraints. Furthermore, this approach incorporates time-varying photovoltaic generation and load profiles over a 24 h horizon, enabling an accurate analysis of daily system operation. The optimization framework supports simultaneous minimization of fuel costs and CO2 emissions, and its effectiveness is validated through quantitative comparisons with a non-convex DNLP model, showing relative errors below 0.01% and performance gains in computational efficiency and physical feasibility. These aspects, together with the full convex reformulation and realistic modeling of renewable integration, differentiate this work from existing approaches and position it as a scalable and reliable alternative for energy management in modern DC grids.

1.5. Document Structure

The remainder of this article is organized as follows. Section 2 introduces the mathematical formulation of the EED problem, including the objective functions and system constraints. Section 3 presents the convex reformulation of the EED model using second-order cone programming (SOCP), detailing the algebraic transformations and the conic relaxation process. Section 4 describes the two multi-terminal HVDC (MT-HVDC) test systems used to validate the proposed methodology, including their topology, generation units, and demand profiles. Section 5 discusses the numerical results obtained from both the non-convex and the convex models, analyzing their accuracy, computational efficiency, and physical feasibility. Finally, Section 6 concludes this article with final remarks and outlines potential directions for future research.

2. Problem Formulation for Economic–Environmental Dispatch

The optimization model for the EED is formulated as a nonlinear programming (NLP) problem. This initial model aims to minimize both the generation costs and the CO2 emissions, considering constraints such as power balance, voltage limits, and generation capacity, thus integrating both economic and environmental objectives. To present the general formulation of the EED problem, an operation with 1 h periods is considered [21].

2.1. Objective Functions

Equation (1) represents a linear combination of the two objective functions through a global optimization approach.
min z = w 1 z 1 + w 2 z 2
In this model, z is the total objective function, calculated as a weighted sum of the functions z 1 and z 2 , where w 1 and w 2 are the weighting factors assigned to each.
min z 1 = i = 1 N h = 1 H a i P i , h c g 2 + b i P i , h c g + c i + b i P i , h r g
min z 2 = i = 1 N h = 1 H α i P i , h c g 2 + β i P i , h c g + γ i + β i P i , h r g
The function z 1 , given in Equation (2), reflects the energy production costs, while z 2 , given in Equation (3), represents the greenhouse gas emissions measured in kilograms. This approach allows balancing economic costs with environmental impact by adjusting the relative importance of each function through the values of w 1 and w 2 [8,11].
Here, a i , b i , and c i represent the coefficients associated with fossil fuel costs. On the other hand, α i , β i , and γ i are related to the coefficients that describe the amount of greenhouse gases released into the atmosphere. P i , h c g corresponds to the conventional power generation variable for each thermoelectric plant, while P i , h r g represents the generation from each renewable plant associated with photovoltaic generation. Subscripts i and j refer to the receiving and sending nodes, respectively, while h represents the time period index over 24 h.

2.2. Set of Constraints

The efficient operation of the system requires the incorporation of various technical constraints. These include ensuring power balance, controlling voltage levels, limiting generation capacities, and enforcing current flow limits [22].
P i , h c g + P i , h r g P i , h d = v i , h j = 1 N G i j v j , h , { i N , h H } ;
v i min v i , h v i max , { i N , h H } ;
P i c g , m i n P i , h c g P i c g , m a x , { i N , h H } ;
P i r g , m i n P i , h r g P i r g , m a x , { i N , h H } ;
| v i , h v j , h | r i j i i j max , i , j L , h H ;
0 w 1 , w 2 1
The equations presented describe the fundamental constraints of the economic–environmental dispatch problem.
Equation (4) establishes the power balance at each node of the system, where P i , h d is the demand at each node and the term v i j = 1 N G i j v j models the line losses, where v i , h and v j , h correspond to the voltages at the sending and receiving nodes, respectively, and G i j represents the conductances of the lines.
Equation (5) defines the operational voltage limits at the nodes, ensuring that the voltage at each node ( v i ) remains within the minimum ( v i min ) and maximum ( v i max ) values established for the system to maintain its stability and reliability. Equation (28) imposes the generation limits for the thermal power plants, guaranteeing that the power generated by each unit P i , h c g remains within the minimum ( P i c g , m i n ) and maximum ( P i c g , m a x ) allowable limits according to their capacities. Similarly, Equation (29) limits the photovoltaic generation values given by P i , h r g . Equation (8) sets a constraint on the voltage difference between connected nodes, limited by the product of the conductor resistance r i j and the maximum admissible current i i j max . This ensures that the line currents do not exceed the maximum values supported by the conductors [23].

3. Approximate Convex Reformulation

The initial multi-objective EED model is intrinsically non-convex due to the presence of the product of variables v i v j in the power balance Equation (4). This term introduces a complexity that makes solving the problem difficult using classical non-convex optimization methods, such as NLP, SQP, SDP [8], or generalized interior-point algorithms. To overcome this limitation, a convex reformulation based on conic relaxation is employed, allowing the original model to be represented through a SOCP framework [24]. This approximation transforms the non-convex system into an operationally equivalent model that is mathematically more manageable and solvable through convex optimization tools, particularly in networks with distributed generation or radial structures [25].
To address this non-convexity, an algebraic reformulation using auxiliary variables is proposed, enabling the model to be transformed into an approximate convex system. First, a new auxiliary variable z i j is introduced, defined as follows:
z i j = v i v j
To construct an equivalent model that transforms the nonlinear term, two auxiliary variables u i and u j are defined, associated with the squares of the nodal voltage variables:
u i = v i 2
u j = v j 2
By squaring both sides of Equation (10), the following relationship is obtained in terms of the auxiliary variables:
z i j 2 = u i u j
However, by introducing the new variable z i j = v i v j , as described in Equation (10), it is possible to rewrite the power balance equation in terms of this new auxiliary variable. Substituting Equation (10) into Equation (4), the following reformulated expression is obtained:
P i , h c g + P i , h r g P i , h d = j = 1 N G i j z i j , h , i , j N , h H
Up to this point, the power balance Equation (14) has been reformulated in terms of the new auxiliary variable z i j , obtaining an expression that simplifies the handling of the original nonlinear terms.

Conic Relaxation

Conic optimization, a subfield of convex optimization, uses second-order cone constraints to relax non-convex problems [20]. These constraints, also known as Lorentz cones, are convex because their solutions lie within the interior space of the cone [26]. In the case of the term u i u j , conic relaxation allows Equation (13) to be rewritten using an equivalent representation based on a hyperbolic form. This approach ensures that the resulting system retains the fundamental structure of the original model while guaranteeing convexity, thus facilitating convergence to globally optimal solutions.
In the following section, the remaining system constraints will be reformulated in terms of the auxiliary variables u i and u j , a process that will be carried out using the conic relaxation model, allowing an approximation of the original model and ensuring its convexity.
The conic reformulation of the multi-objective EED model can be expressed as follows:
u i u j = 1 4 ( u i + u j ) 2 1 4 ( u i u j ) 2 , ( i , j ) N
Substituting (13) into (15), we obtain
( 2 z i j ) 2 = ( u i + u j ) 2 ( u i u j ) 2
Rearranging the terms of Equation (16), the following equivalent expression is obtained:
( 2 z i j ) 2 + ( u i u j ) 2 = ( u i + u j ) 2
It can be observed that (17) can be rewritten using the Euclidean norm as follows:
2 z i j u i u j u i + u j , ( i , j ) N
Observation 1.
Equation (18) remains non-convex due to the equality sign. However, following the methodology proposed in [20], it is possible to relax this condition by replacing the equality with an inequality. This transforms Equation (18) into a second-order cone constraint.
It is important to note that Equation (5), by squaring all terms, can be reformulated in terms of the auxiliary variable u i , generating (19):
( v i min ) 2 u i ( v i max ) 2
For Equation (8), which is related to the thermal limits of the conductors, it is possible to square both sides, thus obtaining the following expression:
( | v i v j | ) 2 ( r i j i i j max ) 2
v i 2 2 v i v j + v j 2 ( r i j i i j max ) 2
Substituting Equations (10)–(12) into (21), the following expression is obtained:
u i + u j 2 z i j ( r i j i i j max ) 2
Once all equations have been reformulated in terms of the auxiliary variables z i j , u i , and u j , it is possible to rewrite the set of constraints of the model using only these new variables. However, before proceeding with this reformulation, it is convenient to reinterpret the meaning of u i and u j in relation to the matrix z, in order to facilitate the unified representation of the system.
In this context, z i j corresponds to a matrix containing the products of all possible combinations between voltages v i and v j , that is, z i j = v i v j . Given that u i = v i 2 and u j = v j 2 , these values match the diagonal elements of the matrix z, specifically u i = z i i and u j = z j j . This relationship allows all original constraints to be expressed exclusively in terms of the matrix z, which is fundamental for applying convex relaxation techniques.
Z h = v h v h = z 11 , h z 12 , h z 1 j , h z 1 n , h z 21 , h z 22 , h z 2 j , h z 2 n , h z i 1 , h z i 2 , h z i j , h z i n , h z n 1 , h z n 2 , h z n j , h z n n , h
z i j , h = v i , h v j , h , i , j N , h H
Set of reformulated constraints:
P i , h c g + P i , h r g P i , h d = j = 1 N G i j z i j , h , i , j N , h H
2 z i j , h z i i , h z j j , h z i i , h + z j j , h , i , j N , h H
( v i min ) 2 z i i , h ( v i max ) 2 , i N , h H
P i c g , m i n P i , h c g P i c g , m a x , i N , h H
P i r g , m i n P i , h r g P i r g , m a x , i , j N , h H
z i i , h + z j j , h 2 z i j , h ( r i j i i j max ) 2 , ( i , j ) L , h H
Observation 2.
It should be noted that none of the objective functions required reformulation, as they do not contain terms dependent on v i or v j . Therefore, they remain unchanged and are preserved as in the original model.

4. Test Systems

To validate the performance of the proposed approach, which includes both the original non-convex EED model and its convex reformulation through conic relaxation SOCP, two MT-HVDC test systems are employed. These systems allow evaluating the precision, efficiency, and computational viability of the relaxed model using the CVX optimization tool in MATLAB® version 2024b. The systems are presented below.

4.1. Six-Node System

The first test system consists of six nodes, where nodes 1, 2, and 3 host conventional thermal plants, while nodes 4, 5, and 6 contain constant power loads (see Figure 1). This system is designed with a nominal voltage level of 400 kV, and the slack node is located at node 2. The thermal capacity limit associated with the current is set at 4.6 kA for all lines. Its simplified structure facilitates analyzing the behavior of the economic–environmental dispatch model in a controlled environment, enabling comparative validation between the original non-convex formulation and the conic relaxation-based convex reformulation.
In Table 2, the resistances of each line connection in the six-node system are detailed. Table 3 presents the assigned load values for each node, and Table 4 summarizes the generation cost coefficients, emission factors, and the minimum and maximum operating limits of the thermal plants.

4.2. Eleven-Node System

This MT-HVDC system consists of 11 nodes operating at a nominal voltage of 400 kV, 17 transmission lines, 3 thermal power plants, 2 renewable generators based on photovoltaic plants, and 6 variable load nodes, whose hourly evolution follows the demand curve shown in Figure 2. The electrical configuration of the system is illustrated in Figure 3. The slack node is set at node 2, which maintains a fixed voltage of 400 kV, while the operational voltage limits for the other nodes are restricted between 360 kV and 400 kV. Table 5 presents the transmission line data, including resistances and maximum current capacities for each conductor, Table 6 presents the peak load consumption, and Table 7 provides the cost and emission coefficients for the thermal plants as well as the minimum and maximum operational limits for the thermal and photovoltaic generators.
On the other hand, for this test system, demand variation curves are considered, as illustrated in Figure 2. In the same figure, the power output profiles of the photovoltaic systems are also shown.

5. Numerical Validation

To verify the performance of the proposed convex quadratic approximation for the EED in DC networks, an exhaustive comparison was conducted with the original NLP model implemented in GAMS. Additionally, for the numerical validation of the new conic relaxation method, a solution was developed in MATLAB® (version 2024b) on a PC equipped with an Intel Core i5-1135G7 processor at 2.40 GHz, 16 GB of RAM, and running Microsoft Windows 11 Pro 64-bit.

5.1. Analysis 1: Comparison Between Convex and Non-Convex Models for the 6-Node System

In order to evaluate the accuracy and consistency of the convex reformulation of the EED model, a direct comparison is established between the results obtained by the original non-convex model and its relaxed version through SOCP.
The non-convex model is implemented in GAMS using the DNLP (nonlinear programming) solution algorithm, which is capable of handling variable products and nonlinear equations. On the other hand, the convexified model, based on conic relaxation techniques, is developed solely in MATLAB using the CVX optimization tool. For the three scenarios analyzed, the thermal current limit constraint (30) was omitted in both models in order to grant greater operational freedom to the system and enable a direct comparison between the results, focusing the analysis exclusively on the effect of the convex reformulation on the primary dispatch objectives.
To carry out the analysis, three scenarios were defined, varying the weight factors associated with the objective functions: minimization of generation costs and reduction in CO2 emissions. The multi-objective formulation is transformed into a scalar function through a linear combination of both objectives, where the coefficients ω 1 and ω 2 determine the relative priority between the criteria.
  • Scenario 1: ω 1 = 1 , ω 2 = 0 . Exclusively optimizing generation costs, constituting a single-objective problem.
  • Scenario 2: ω 1 = 0.5 , ω 2 = 0.5 . Equal importance is given to operational costs and emissions, representing a balanced approach.
  • Scenario 3: ω 1 = 0 , ω 2 = 1 . Solely prioritizing the minimization of emissions, ignoring operational costs.

5.1.1. Comparison Results Between DNLP and SOCP Models

The results obtained for the three defined scenarios allow a direct comparison of the performance between the original non-convex model DNLP and its convex reformulation via conic relaxation SOCP. Table 8 presents the values of the objective functions z 1 (total generation cost) and z 2 (total CO2 emissions) for both models.
The results show a high agreement between both formulations. In Scenario 1, focused exclusively on cost minimization, the relative difference in z 1 is less than 0.0001%, while for z 2 it remains below 0.013%. Scenario 2, which represents a balanced trade-off between costs and emissions, shows practically null relative errors. In Scenario 3, where the sole objective is emissions reduction, the difference in z 2 remains negligible (0.003%), although a slight deviation is observed in the value of z 1 (0.319%), attributable to the higher sensitivity of the model to emission constraints.
Table 9 compares the powers generated by each thermal unit under Scenario 2, evidencing an almost exact match between both models, which confirms that the conic relaxation does not significantly alter the dispatch decisions when a balance between objectives is prioritized.

5.1.2. Evaluation of the Physical Feasibility of the SOCP Solution

In order to evaluate the operational validity of the convexified model through conic relaxation SOCP, its behavior was analyzed under the activation of critical physical constraints of the system. This analysis explicitly includes the thermal current limit constraint (30) in both models: the non-convex (formulated in GAMS with DNLP) and the relaxed one (formulated in MATLAB with CVX).
The balanced scenario defined by weights ω 1 = 0.5 and ω 2 = 0.5 is maintained, aiming to assess the feasibility of the SOCP solution under stricter operating conditions and to directly compare it with the solution of the original model (see Table 10).
The results show a very high agreement between the objective function values. The difference in the total generation cost ( z 1 ) is only USD 1.18, representing a relative error below 0.0002%. Similarly, the difference in total emissions ( z 2 ) is less than 1 kg. Regarding the generated powers, the differences are negligible and remain below 0.01 MW.
These findings demonstrate that the solution obtained by the SOCP model is not only computationally efficient but also satisfies the operational requirements imposed by the system’s physical constraints. Therefore, it validates that the conic relaxation maintains the physical feasibility of the original model, reinforcing the applicability of the convexified approach for more complex systems.

5.1.3. Comparative Analysis with and Without Thermal Current Constraint

To understand the effect of the thermal current constraint (associated with the maximum capacity of the conductors), the results of the balanced scenario ( ω 1 = 0.5 , ω 2 = 0.5 ) are compared under two conditions: with and without the inclusion of said constraint. The results are presented in Table 11.
The results show a significant increase in the total generation cost ( z 1 ) when activating the thermal current constraint: around 35% in both models. This increase is because the system can no longer operate freely and must limit the current flows through the transmission lines, thereby restricting the dispatch from the most economical units (in this case, G3 with 1800 MW when no constraint is applied).
In terms of dispatch, it is observed that imposing the thermal constraint significantly limits the generation of unit G3 (possibly the most efficient or economical), reducing its output from 1800 MW to 913.5 MW. Consequently, units G1 and G2 must compensate for the deficit by increasing their output to 1500 MW and 1426 MW, respectively, which raises both the operational cost and CO2 emissions ( z 2 ).
From a physical standpoint, this situation reflects the reality of power systems, where transmission lines have limited capacity to carry current. When these limits are not considered, the model tends to overuse the cheapest units without physical restrictions, resulting in artificially optimal solutions. However, when the thermal limit is included, the model yields a more realistic—albeit costlier and more emissive—solution (see the comparative analysis in Figure 4 and Figure 5).
This analysis highlights the importance of incorporating operational constraints such as thermal current limits to obtain feasible and representative results of the actual system and validates the capability of the SOCP model to effectively meet these conditions.

5.2. Comparison Between Convex and Non-Convex Models with Photovoltaic Generation

This section analyzes the behavior of the 11-node system when photovoltaic (PV) generation is incorporated at two strategic points of the network, specifically at nodes 4 and 5. For this purpose, realistic hourly profiles of solar radiation and demand were used, represented through the photovoltaic generation and daily demand curves shown in Figure 2, corresponding to a 24 h cycle with hourly intervals.
The objective of this analysis is to verify the consistency between the convexified SOCP and non-convex DNLP models, implemented, respectively, in MATLAB CVX and GAMS under identical operating conditions. Both models consider the incorporation of renewable generation, maintaining the physical and operational constraints of the electrical system, including the hourly availability curve of photovoltaic generation and the system load curve.
The results obtained for the cost objective function ( z 1 ) and CO2 emissions ( z 2 ), accumulated over the 24 h horizon with weighting factors w 1 = 0.5 and w 2 = 0.5 , are summarized in Table 12.
The results show an almost exact match between both formulations. The relative difference between the values obtained for z 1 and z 2 is on the order of 10 6 , validating that the convex reformulation through second-order cone programming (SOCP) techniques does not compromise the quality or feasibility of the original non-convex solution.
Furthermore, it is confirmed that the convexified model accurately reproduces the system behavior with renewable generation, maintaining both numerical accuracy and physical viability under scenarios with high hourly variability.

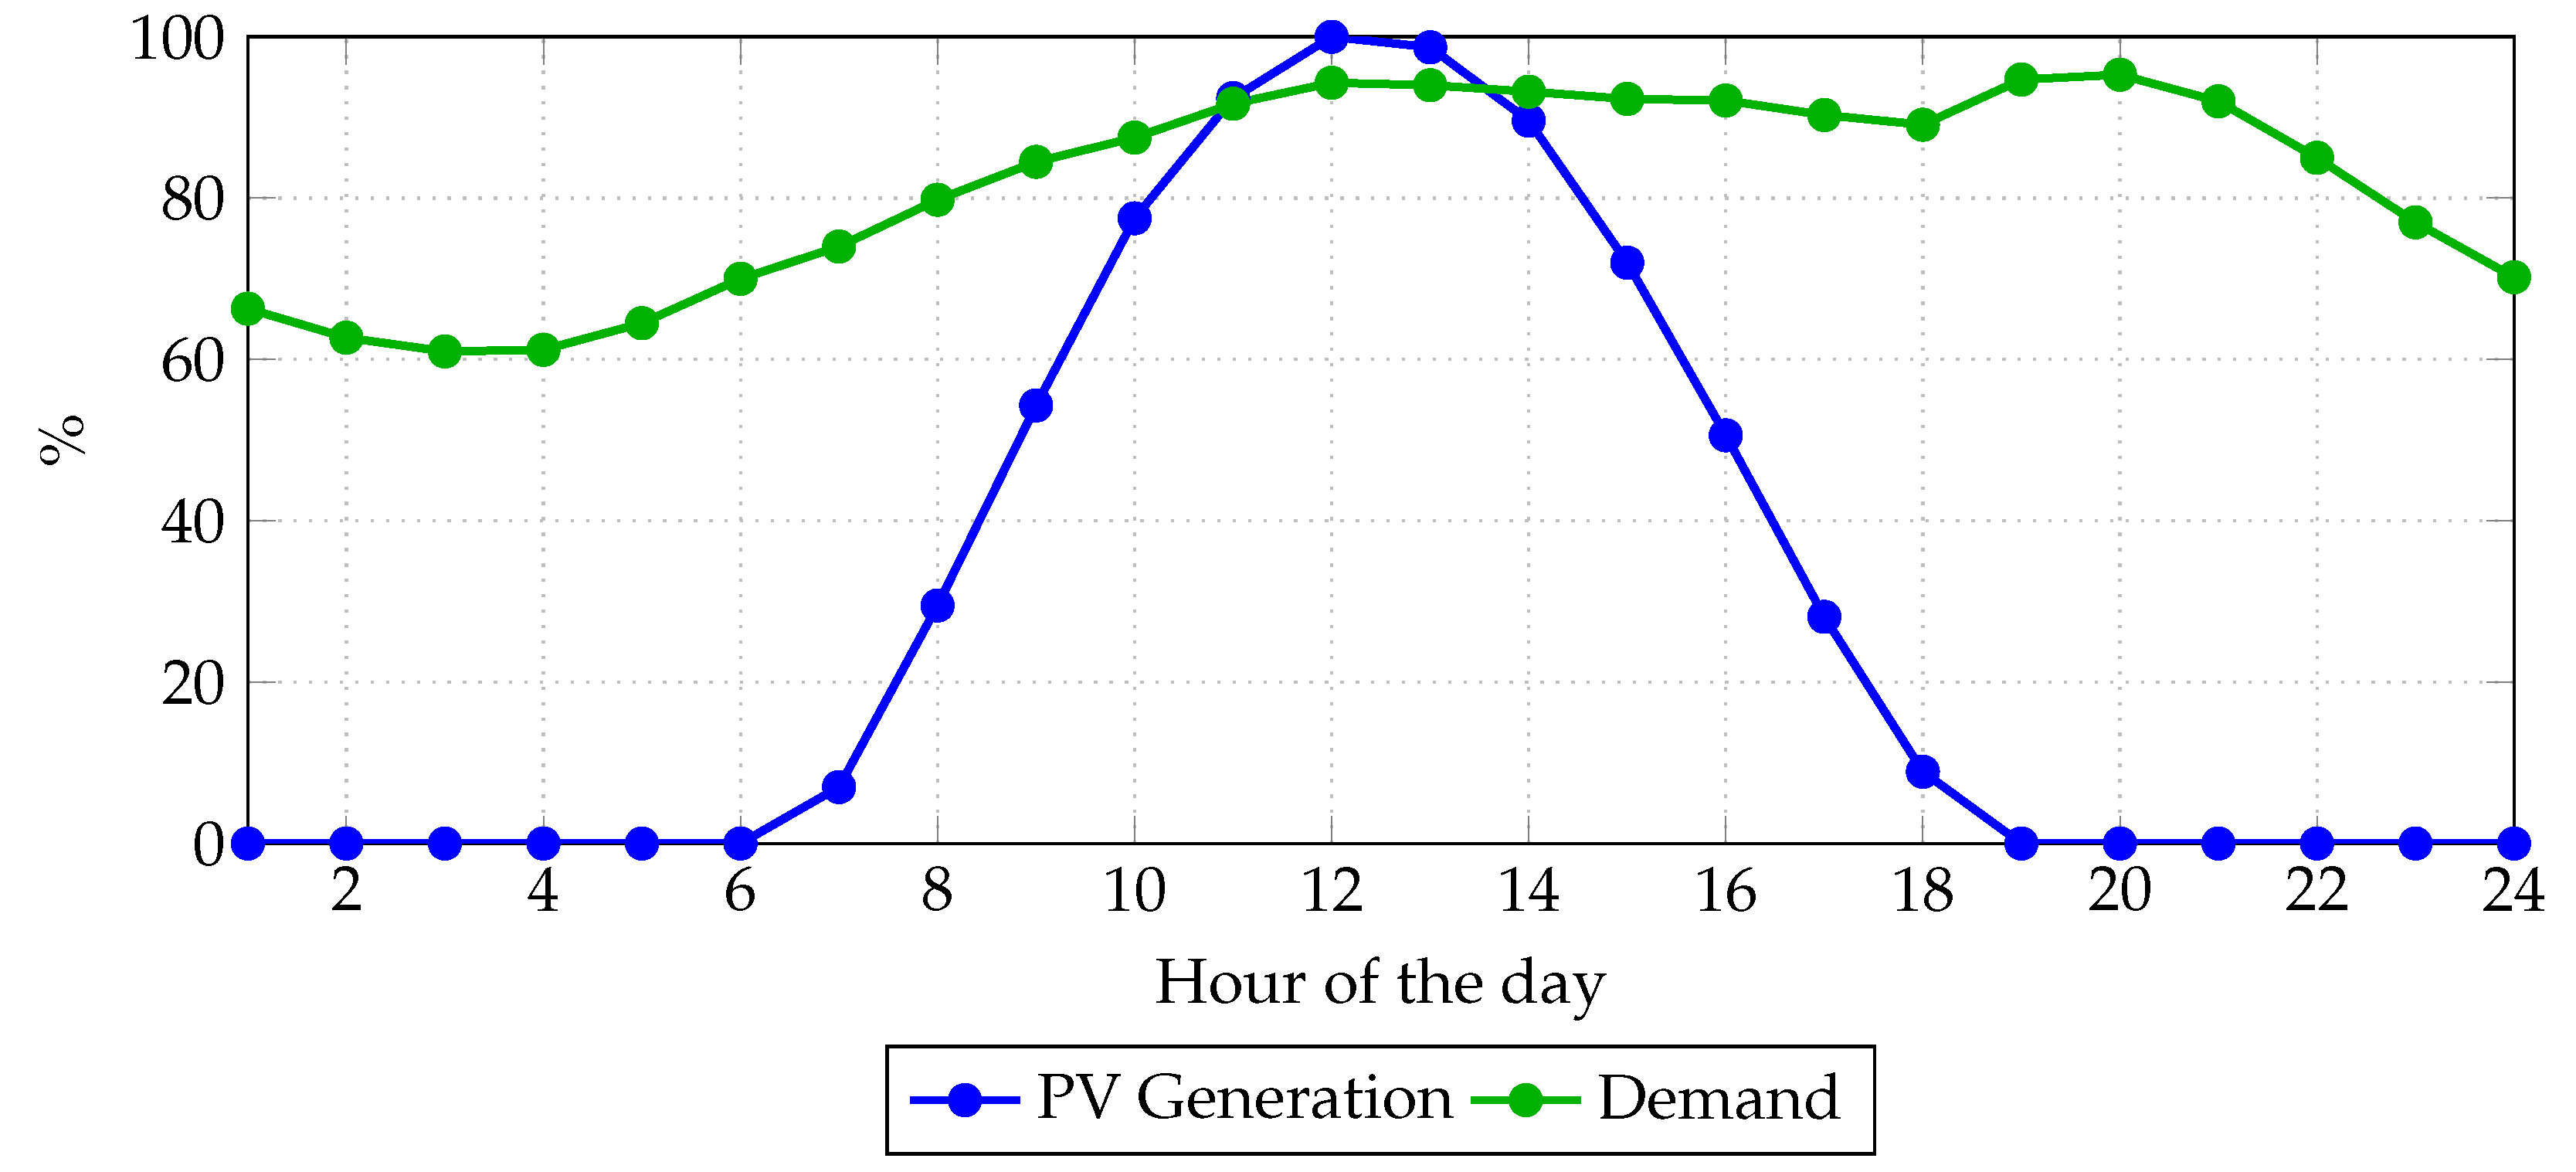
5.3. Analysis of the Impact of Photovoltaic Generation

To evaluate the effect of renewable generation integration on system performance, the results of the convexified SOCP model were compared under two scenarios: one with active photovoltaic generation at nodes 4 and 5 and another without renewable generation, using the same hourly demand curve in both cases (see Figure 2) and balanced weighting factors ( ω 1 = 0.5 , ω 2 = 0.5 ).
The results presented in Table 13 show a significant reduction in operating costs ( z 1 ) and CO2 emissions ( z 2 ) when PV generation is incorporated. Specifically, the system with photovoltaic generation reduced operating costs by approximately USD 2.54 million and emissions by around 2.5 million kilograms of CO2 over the evaluated 24 h horizon.
This behavior is due to the fact that photovoltaic generators, having virtually zero variable cost and being emissions-free, displace part of the more expensive and polluting thermal generation during periods of higher solar irradiation. Figure 6 shows the hourly profile of power generated by PV1 and PV2 units, where a significant contribution is observed between 7 a.m. and 5 p.m.
These results support the relevance of integrating renewable sources into MT-HVDC grids, both from an economic and environmental perspective, and confirm the usefulness of SOCP models for efficiently representing these operating scenarios.
Figure 6 shows the hourly evolution of power generation in the two photovoltaic generators (PV1 and PV2) connected to the 11-node system. As expected, both generators show zero generation during nighttime hours (before 7 a.m. and after 6 p.m.), reaching their maximum production between 11:00 a.m. and 2:00 p.m., coinciding with the peak of solar irradiation.
It can be observed that generator PV2 achieves a higher installed capacity and, therefore, delivers greater power compared to PV1 throughout the day. Nevertheless, both follow a very similar profile, influenced by the previously defined solar availability curve.
This behavior is key to reducing dependence on thermal dispatch during the central hours of the day, which directly translates into lower generation costs and CO2 emissions, as evidenced in the comparison between scenarios with and without renewable generation. The presence of these generators not only improves the environmental profile of the system but also helps relieve thermal units during peak demand periods, enhancing the operational sustainability of the system.

6. Conclusions

This study proposed a convex optimization framework for solving the economic–environmental dispatch (EED) problem in DC power networks by employing second-order cone programming (SOCP). The approach effectively addresses the non-convexity introduced by voltage product terms in the power balance equations through the introduction of auxiliary variables and a conic relaxation strategy. This guarantees global optimality and enhances computational tractability without compromising physical feasibility.
The methodology was tested on two benchmark systems—a 6-node grid with only thermal generation and an 11-node system incorporating photovoltaic (PV) generators with hourly solar profiles. Comparative analyses were carried out against the original non-convex model implemented in GAMS (DNLP) and the convex SOCP-based reformulation developed in MATLAB using CVX.
Key results demonstrate the effectiveness of the proposed approach:
  • Relative errors between the SOCP and DNLP models remained below 0.01 % for both cost and emission objectives, confirming the accuracy of the convex approximation.
  • The inclusion of thermal current constraints was successfully handled within the SOCP model, yielding operationally feasible and realistic dispatch solutions comparable to those of the non-convex formulation.
  • The integration of photovoltaic generation led to a substantial reduction in operating costs and CO2 emissions. Specifically, costs decreased by approximately USD 2.54 million (24.34%) and emissions were reduced by 2.5 million kg of CO2 (27.27%) over a 24 h horizon.
These findings highlight the model’s capacity to support multi-objective dispatch planning in DC systems while ensuring fast convergence and global optimality. The conic formulation emerges as a powerful tool for energy management in future power networks with high shares of renewable energy.
As future work, we intend to extend the proposed methodology along several key directions to enhance its practical applicability and robustness. First, to address the inherent uncertainties associated with photovoltaic generation and load demand, we plan to integrate stochastic and robust optimization techniques into the SOCP framework. This will enable the dispatch model to maintain reliability under variable and unpredictable operating conditions by incorporating probabilistic scenarios or uncertainty sets. Second, we aim to develop a dynamic, time-coupled formulation that captures intertemporal constraints such as generation ramping limits, energy storage dynamics, and demand flexibility. These enhancements will improve the model’s suitability for real-time operation and large-scale system management. Additionally, future developments will focus on extending the framework to hybrid AC/DC network configurations and incorporating demand response mechanisms, thereby enabling the coordinated operation of heterogeneous energy resources in modern and resilient power systems.

Author Contributions

Conceptualization, methodology, software, and writing (review and editing): N.J.B.-C., C.A.M.-P. and O.D.M. All authors have read and agreed to the published version of the manuscript.

Funding

This research received no external funding.

Data Availability Statement

The original contributions presented in this study are included in the article. Further inquiries can be directed to the corresponding author.

Acknowledgments

The authors acknowledge the support provided by Thematic Network 723RT0150, i.e., Red para la integración a gran escala de energías renovables en sistemas eléctricos (RIBIERSE-CYTED), funded through the 2022 call for thematic networks of the CYTED (Ibero-American Program of Science and Technology for Development).

Conflicts of Interest

The authors declare no conflicts of interest.

References

  1. Nanda, G.; Yamgar, S.; Srivastava, S.C.; Singh, S.N.; Gupta, P.; Paul, D.; Shrestha, R.M. Implications of carbon tax on generation expansion plan & GHG emission: A case study on Indian power sector. Int. J. Emerg. Electr. Power Syst. 2005, 3, 1045. [Google Scholar] [CrossRef]
  2. Lahdi, S.; Lai, L.L.; Nankoo, D. Grid Integration of Wind-Solar Hybrid Renewables Using AC/DC Converters as DG Power Sources. In Proceedings of the 2011 World Congress on Sustainable Technologies (WCST), London, UK, 7–10 November 2011. [Google Scholar]
  3. García Torres, D.A. Dynamics of Thermoelectric Generation in Colombia: Forecasting Through Long-Memory Time Series. Master’s Thesis, Universidad del Norte, Barranquilla, Colombia, 2014. (In Spanish). [Google Scholar]
  4. Bastidas, S.; Arcos, H. Despacho económico del sistema híbrido de las islas Santa Cruz y Baltra incorporando la aleatoriedad de potencia de los sistemas eólico y solar fotovoltaico. Rev. Téc. Energy 2019, 16, 1–7. [Google Scholar] [CrossRef]
  5. Dragičević, T.; Lu, X.; Vasquez, J.C.; Guerrero, J.M. DC Microgrids–Part I: A Review of Control Strategies and Stabilization Techniques. IEEE Trans. Power Electron. 2015, 31, 4876–4891. [Google Scholar] [CrossRef]
  6. Park, J.B.; Jeong, Y.W.; Shin, J.R.; Lee, K.Y. An improved particle swarm optimization for nonconvex economic dispatch problems. IEEE Trans. Power Syst. 2010, 25, 156–166. [Google Scholar] [CrossRef]
  7. Raza, A.; Shakeel, A.; Altalbe, A.; Alassafi, M.O.; Yasin, A.R. Impacts of MT-HVDC Systems on Enhancing the Power Transmission Capability. Appl. Sci. 2020, 10, 242. [Google Scholar] [CrossRef]
  8. Lavaei, J.; Low, S.H. Zero duality gap in optimal power flow problem. IEEE Trans. Power Syst. 2012, 27, 92–107. [Google Scholar] [CrossRef]
  9. Berrío Castro, K.J. Método de Solución para el Despacho Económico en Línea Considerando Restricciones y Reglas de un Mercado Eléctrico. Master’s Thesis, Universidad Nacional de Colombia, Medellín, Colombia, 2016. [Google Scholar]
  10. Jeyakumar, D.; Jayabarathi, T.; Raghunathan, T. Particle swarm optimization for various types of economic dispatch problems. Electr. Power Energy Syst. 2006, 28, 36–42. [Google Scholar] [CrossRef]
  11. Montoya, O.D.; Gil-Gonzalez, W.; Garces, A. A Sequential Quadratic Programming Model for the Economic–Environmental Dispatch in MT-HVDC. In Proceedings of the 2019 IEEE Workshop on Power Electronics and Power Quality Applications (PEPQA), Manizales, Colombia, 30–31 May 2019; IEEE: Piscataway, NJ, USA, 2019; pp. 1–6. [Google Scholar] [CrossRef]
  12. Contreras-Sepúlveda, W.; Montoya, O.D.; Gil-González, W. An economic-environmental energy management system design for MT-HVDC networks via a semi-definite programming approximation with robust analysis. Ain Shams Eng. J. 2024, 15, 102968. [Google Scholar] [CrossRef]
  13. Juárez Cervantes, J.D. Electric Power Distribution Systems (In Spanish); Universidad Autónoma Metropolitana, Unidad Azcapotzalco: Mexico City, Mexico, 1995. [Google Scholar]
  14. Elsayed, A.M.; Shaheen, A.M.; Alharthi, M.M.; Ghoneim, S.S.M.; El-Sehiemy, R.A. Adequate Operation of Hybrid AC/MT-HVDC Power Systems Using an Improved Multi-Objective Marine Predators Optimizer. IEEE Access 2021, 9, 51065–51087. [Google Scholar] [CrossRef]
  15. Santa María, M.; von der Fehr, N.H.; Millán, J.; Benavides, J.; Gracia, O.; Schutt, E. The Electric Energy Market in Colombia: Characteristics, Evolution, and Impact on Other Sectors; Informe Técnico; Fedesarrollo: Bogotá, Colombia, 2009. (In Spanish) [Google Scholar]
  16. Gjorgiev, B.; Čepin, M. A multi-objective optimization based solution for the combined economic-environmental power dispatch problem. Eng. Appl. Artif. Intell. 2013, 26, 417–429. [Google Scholar] [CrossRef]
  17. Dashtdar, M.; Flah, A.; Hosseinimoghadam, S.M.S.; Reddy, H.R.; Kotb, H.; AboRas, K.M.; Jasińska, E.; Jasiński, M. Solving the environmental/economic dispatch problem using the hybrid FA-GA multi-objective algorithm. Energy Rep. 2022, 8, 13766–13779. [Google Scholar] [CrossRef]
  18. Haas, R.; Resch, G.; Panzer, C.; Busch, S.; Ragwitz, M.; Held, A. Efficiency and effectiveness of promotion systems for electricity generation from renewable energy sources - Lessons from EU countries. Energy 2011, 36, 2186–2193. [Google Scholar] [CrossRef]
  19. Bansal, R.C. Optimization Methods for Electric Power Systems: An Overview. Int. J. Emerg. Electr. Power Syst. 2005, 2, 1021. [Google Scholar] [CrossRef]
  20. Farivar, M.; Low, S.H. Branch Flow Model: Relaxations and Convexification. In Proceedings of the Proceedings of the 51st IEEE Conference on Decision and Control (CDC), Maui, HI, USA, 10–13 December 2012. [Google Scholar] [CrossRef]
  21. Wu, L.; Wang, Y.; Yuan, X.; Zhou, S. Environmental/economic power dispatch problem using multi-objective differential evolution algorithm. Electr. Power Syst. Res. 2010, 80, 1171–1181. [Google Scholar] [CrossRef]
  22. Alawode, K.; Jubril, A.; Kehinde, L.; Ogunbona, P. Semidefinite programming solution of economic dispatch problem with non-smooth, non-convex cost functions. Electr. Power Syst. Res. 2018, 164, 178–187. [Google Scholar] [CrossRef]
  23. Hozouri, M.A.; Abbaspour, A.; Fotuhi-Firuzabad, M.; Moeini-Aghtaie, M. On the Use of Pumped Storage for Wind Energy Maximization in Transmission-Constrained Power Systems. IEEE Trans. Power Syst. 2015, 30, 1017–1025. [Google Scholar] [CrossRef]
  24. Jabr, R.A. Radial distribution load flow using conic programming. IEEE Trans. Power Syst. 2006, 21, 1458–1459. [Google Scholar] [CrossRef]
  25. Gan, L.; Low, S.H.; Topcu, U. Convex relaxations and linear approximation for optimal power flow in multiphase radial networks. In Proceedings of the 2014 Power Systems Computation Conference, Wroclaw, Poland, 18–22 August 2014. [Google Scholar] [CrossRef]
  26. Benson, H.Y.; Sağlam, Ü. Mixed-Integer Second-Order Cone Programming: A Survey. In INFORMS Tutorials in Operations Research; INFORMS: Catonsville, MD, USA, 2013; pp. 13–36. [Google Scholar] [CrossRef]
Figure 1. Six-node MT-HVDC system.
Electricity 06 00043 g001
Figure 2. Expected daily behavior of photovoltaic generation and demand.
Electricity 06 00043 g002
Figure 3. Eleven-node MT-HVDC system.
Electricity 06 00043 g003
Figure 4. Comparison of z 1 (costs) and z 2 (emissions) in different scenarios.
Electricity 06 00043 g004
Figure 5. Comparison of power dispatch by generator.
Electricity 06 00043 g005
Figure 6. Hourly profile of photovoltaic generation for PV1 and PV2 generators.
Electricity 06 00043 g006
Table 1. Summary of the state of the art and identified limitations in EED models.
ReferenceMethodologyLimitationsContribution of This Work
Nanda et al. (2005) [1]Multi-objective optimization using classical programming methodsLimited to simplified systems; non-convexities not addressed; no renewable sources includedIncorporates renewable PV generation and addresses non-convexities via convex reformulation
Lahdi et al. (2011) [2]Grid-based dispatch optimization with emissions considerationInflexible to renewable generation variability; focused on AC systemsTailored to DC systems and includes dynamic PV profiles
Jeyakumar et al. (2006) [10]Particle swarm optimization for EEDHeuristic nature yields suboptimal results; lacks guarantees of global optimalityUses SOCP to guarantee global optimality with negligible error vs. exact NLP
Montoya et al. (2019) [11]SQP for EED in AC systemsHigh computational burden; no conic relaxation; limited scalabilityReformulated as convex SOCP, reducing computational time and improving scalability
Farivar and Low (2012) [20]Conic relaxation for optimal power flow in AC systemsAC-focused, no multi-objective formulation; lacks integration of emissions objectiveExtends conic relaxation to multi-objective EED in DC networks with emissions modeling
Table 2. Resistance parameters associated with line connections.
Line Parameters
(Line #)FromTo R ij [ Ω ] (Line #)FromTo R ij [ Ω ]
(Line 1)155.70(Line 5)364.75
(Line 2)532.28(Line 6)121.90
(Line 3)541.71(Line 7)261.90
(Line 4)132.28
Table 3. Load consumption parameters for the 6-node system.
Load Consumption
NodeP (MW)NodeP (MW)NodeP (MW)
41500512506950
Table 4. Cost and emission coefficients for thermal plants in the MT-HVDC system.
Genc (USD)b (USD/MW)a (USD/MW2h) γ (kg)
p 1 c g 100200.104.091
p 2 c g 100150.122.543
p 3 c g 200180.044.258
Genβ (kg/MWh)α (kg/MW2h)pg,min (MW)pg,max (MW)
p 1 c g −5.5430.06490501500
p 2 c g −6.0470.056381002000
p 3 c g −5.0940.045861401800
Table 5. Transmission line resistances and maximum current capacities.
Line #FromTo R ij ( Ω ) I ij max (kA)
1123.85 (3.50)
2144.22 (3.20)
3164.85 (3.10)
4262.37 (3.50)
5273.25 (3.10)
6372.95 (2.90)
7394.36 (3.20)
8464.02 (3.50)
94103.87 (3.60)
10593.34 (3.00)
115104.12 (2.80)
125113.78 (2.00)
13674.65 (3.00)
146115.25 (2.60)
15783.14 (3.00)
16894.55 (1.50)
178115.14 (1.60)
Table 6. Load consumption for the 11-node system.
Load Consumption
NodeP (MW)NodeP (MW)
68507750
89509800
1065011700
Table 7. Cost and emission parameters for three thermal plants and two PV generators.
Gen.c (USD)b (USD/MWh)a (USD/MW2h) γ (kg)
p 1 c g 150140.103.002
p 2 c g 125180.074.903
p 3 c g 180220.055.236
p 4 r g 0400.000
p 5 r g 0420.000
Gen.β (kg/MWh)α (kg/MW2h) p g , min (MW) p g , max (MW)
p 1 c g −4.2680.0751501350
p 2 c g −5.3240.0873001800
p 3 c g −6.5760.0602502400
p 4 c g 320.00002500
p 5 c g 290.00002000
Table 8. Comparison of results between non-convex model (GAMS) and relaxed model (MATLAB-CVX).
ScenarioModel z 1 [$] z 2 [kg]Error z 1 [%]Error z 2 [%]
1MATLAB (SOCP)420,988.63253,833.130.000040.0124
GAMS (DNLP)420,988.45253,864.62
2MATLAB (SOCP)421,639.60252,204.000.0000070.00001
GAMS (DNLP)421,639.63252,203.96
3MATLAB (SOCP)456,269.90245,303.810.3190.0030
GAMS (DNLP)454,819.58245,311.09
Table 9. Comparison of generated powers (MW) in Scenario 2.
GeneratorMATLAB (SOCP)GAMS (DNLP)
P 1 1039.601039.56
P 2 981.70981.72
P 3 1800.001800.00
Table 10. Results with inclusion of thermal current limit.
Model z 1 [$] z 2 [kg]PG1 [MW]PG2 [MW]PG3 [MW]
MATLAB (SOCP)570,814.38277,442.581500.001426.50913.50
GAMS (DNLP)570,815.56277,441.841500.001426.52913.49
Table 11. Comparison of results with and without the thermal current constraint (30).
ModelConstraint z 1 [$] z 2 [kg]PG1 [MW]PG2 [MW]PG3 [MW]
MATLAB (SOCP)Active570,814.38277,442.581500.001426.50913.50
Inactive421,639.60252,204.001039.60981.701800.00
GAMS (DNLP)Active570,815.56277,441.841500.001426.52913.49
Inactive421,639.63252,203.961039.56981.721800.00
Table 12. Comparison of results between convex and non-convex models with photovoltaic generation (11-node system).
Model z 1 [$] z 2 [kg CO2]
MATLAB (SOCP)7,906,357.616,643,278.60
GAMS (DNLP)7,906,357.606,643,278.58
Table 13. Impact of photovoltaic generation on system costs and emissions (SOCP model, 11-node system).
Scenario z 1 [$] z 2 [kg CO2]
With photovoltaic generation7,906,357.606,643,278.58
Without photovoltaic generation10,449,997.009,139,670.17
Disclaimer/Publisher’s Note: The statements, opinions and data contained in all publications are solely those of the individual author(s) and contributor(s) and not of MDPI and/or the editor(s). MDPI and/or the editor(s) disclaim responsibility for any injury to people or property resulting from any ideas, methods, instructions or products referred to in the content.

